Development of Accessible Hinge Details for Box-Girder Bridges Kristopher Darnell University of Texas at Austin University of California – Berkeley Dr. Khalid Mosalam Proceedings of the 2007 Earthquake Engineering Symposium for Young Researchers paper 35 1 Seattle, Washington | August 8-12, 2007
Transcript
Development of Accessible Hinge Details for Box-Girder Bridges
Kristopher Darnell University of Texas at Austin
University of California – Berkeley Dr. Khalid Mosalam
Proceedings of the 2007 Earthquake Engineering Symposium for Young Researchers
paper 35 1 Seattle, Washington | August 8-12, 2007
Abstract On typical California Box-Girder Bridges, the in-span connection between two portions of such a bridge is a seated hinge. This hinge allows expansion and contraction of either side of a span to occur due to a number of factors including temperature change, creep, shrinkage, and prestress. In addition, the hinge permits each substructure to vibrate independently of one another during an earthquake. The top and bottom of the seated hinge share a common set of elastomeric bearings which serve to facilitate lateral movement. Current designs used for such bridges call for an access opening through the diaphragm of the bridge as to allow maintenance on the bearings. This access opening may significantly alter the material behavior of the hinge. Through a simple monotonic loading test, the effects of this access opening will be assessed, the strength and behavior of the hinge will be analyzed, and the effectiveness of the current reinforcement will be determined. The results of the test will serve to calibrate parameters for Finite Element Analysis. Using both resources, a re-design of the reinforcements and access openings will be performed.
Proceedings of the 2007 Earthquake Engineering Symposium for Young Researchers
paper 35 2 Seattle, Washington | August 8-12, 2007
Contents
Introduction………………………………………………………………………………. 3 Objective of Research……………………………………………………………….…….3 Significance of Study…………………………………………….………………………. 4 Hinge Details…………………………………………………………….………………. 4 Test Setup…………………………………………………………………………..……. 5 Strain Gage Placement………………………………………………...…………………. 6 Finite Element Analysis……………………………………………….…………………. 6 Nonlinear Results…………………………………………………...……………………. 8 Nonlinear Issues……………………………………………………………………..…… 9 Current and Future Work………………………………………………………………. 1 0 Acknowledgements………………………………………………………….…………. 1 2 Appendix A………………………………………………………………….…………. 1 3 References………………………………………………………………...……………. 1 5
Proceedings of the 2007 Earthquake Engineering Symposium for Young Researchers
paper 35 3 Seattle, Washington | August 8-12, 2007
Introduction The effects of earthquakes can be varied in the form of gentle cracking along sidewalks, an idle vibration, or the complete collapse of a building. To date, much research is being conducted to create stronger columns, more resilient frames, better emergency communication systems, and so forth. Yet, with the majority of such studies there lies several problems with feasibility. It might be very beneficial to construct 25 life-size specimens of the same span of a 200 foot bridge, subjecting it to several loading modes and analyzing the effect of every modification. However, time, money, and resources limit the capabilities of such encompassing research projects. The more practical approach to understanding the dynamics of currently standing structures is to build scaled-down models and optimize the amount of testing required through the duplicate use of computer analysis. With computer analysis, most specifically Finite Element Analysis (hence referred to as FEA), a properly defined model can be subjected to an infinite number of loading conditions, saving time and money. However, the issue is with the meaning of properly defined. A sophisticated FEA software package will define a material’s behavior in a plethora of ways. With each modification, its identity is further established but incorrect data may be creating a less accurate representation of the true material properties of the specimen in question. In using a finite element analysis approach, a fine line is towed. The aim of this research is to investigate the behavior of an in-place structure using the approach outlined in the preceding paragraphs. A specimen of approximately 1/3 the actual size will be constructed. The specimen will be instrumented and the material definitions will be obtained as to define parameters within an FEA software program. Another four specimens will be constructed, using the results from the properly defined FEA model. Each specimen will be slightly altered to provide validation of the FEA results, as well as slowly work towards a more effective and economical design. Objective of Research The specimen will be modeled after an in-span box girder bridge hinge. The current reinforcement details will be followed as best as possible considering the 30% decrease in size. An initial assessment of the reinforcement detail indicates that diagonal bars connecting the lateral portion of the hinge to the vertical portion are taking the majority of the stress. This will be monitored using strain gages. The first of five tests will serve to properly calibrate the FEA and evaluate which bars are most effective. Modifications will be processed in the FEA and then used to build the latter specimens. After the conclusion of the five tests, a recommendation will be made that assesses the hinge’s mode of failure, and a re-designed reinforcement detail which serves to optimize the amount of reinforcement used. In addition, the current drawings for the bridge hinge call for an access opening to the elastomeric bearings. These access opening may offer a considerable amount of stress
Proceedings of the 2007 Earthquake Engineering Symposium for Young Researchers
paper 35 4 Seattle, Washington | August 8-12, 2007
Bearing
Girders
Slabs
Diaphragm
Bearing
Girders
Slabs
Diaphragm
concentration. If this is the case, then an alternative design will be created to facilitate the maintenance of these bearings without causing the unwanted stress concentration. Significance of Study A limited amount of research has been devoted to the hinge of box-girder bridges. This is quite odd considering that such a bridge has a very realistic chance of failing right at the hinge. It is designed to be the point which accommodates lateral expansion of the span. Elastomeric bearings facilitate this expansion which is caused by other factors such as prestress, temperature variation, creep, and shrinkage. It simultaneously allows a breakpoint between the span which accommodates two modes of vibration on either side of the hinge. Hinge Details The hinge is an L-shaped reinforced concrete beam that rigidly attaches to the box-girder bridge. It is located in between a two, sometimes a three, column span with a reciprocal L-shape placed directly on top as shown in Figure 1. Each elastomeric bearing is made of steel and is located between the two L pieces. The portion of the hinge which rigidly connects to the slab and girders is referred to as the diaphragm. While the portion that is strictly an L-shape, is referred to as the seat. A three-dimensional rendering of this geometry is shown in Figure 2.
Figure 1: Cross-section of Hinge Figure 2: Three-dimensional Rendering
A detailed view of the reinforcement can be found in Figure 1-A, located in Appendix A. As can be seen in that detail, the joint seal assembly has been neglected for ease of testing. In addition, only one seat will be tested. This follows from the assumption that each seat will be experiencing the same loading conditions. Also, one must be aware of
Proceedings of the 2007 Earthquake Engineering Symposium for Young Researchers
paper 35 5 Seattle, Washington | August 8-12, 2007
the rotation that has occurred. For ease of testing, the seat will be rotated 90° and will appear as such throughout. Test Setup As previously stated, only the seat of the hinge will be tested, the joint seal assembly will be neglected, and the entire apparatus will be rotated 90° for ease of testing. A section of hinge with two bearings has been chosen for the specimen, with approximately three access openings. The specimen will be 1/3 size, which equates to approximately 96 inches by 46 inches. A steel beam will be fashioned as the loading apparatus. The beam will apply uniform point loads to the steel bearings by way of an actuator. A three dimensional rendering of the afore-mentioned test setup can be found in Figure 3. Additionally, a two-dimensional test setup illustration with appropriate dimensions can be found in Figure 2-A, located in Appendix A.
Figure 3: Three-dimensional Rendering of Test Setup
The vertical bars shown in Figure 3–A, located in Appendix A, are 10 post-tensioned bars holding 100 kips each. The bars serve to present a near-rigid constraint to the seat. The testing sequence will follow as such: Test 1 – Seat without Access Openings; Test 2 – Seat with Access Openings; Tests 3-5 – To commence at later date, with undefined modifications. That is to say, tests 1 and 2 will serve to establish the effect of the access openings and provide pertinent data on the calibration of FEA definitions. The test will commence with load controlled loading to the complete point of failure. As testing ensues, several displacement transducers will be monitoring the lateral, vertical, and out-of-plane displacement of the seat. The goal of which is to create a load-displacement curve. Simultaneously, eighty-nine strategically placed strain gages will be monitoring the strain felt by individual reinforcing bars.
Proceedings of the 2007 Earthquake Engineering Symposium for Young Researchers
paper 35 6 Seattle, Washington | August 8-12, 2007
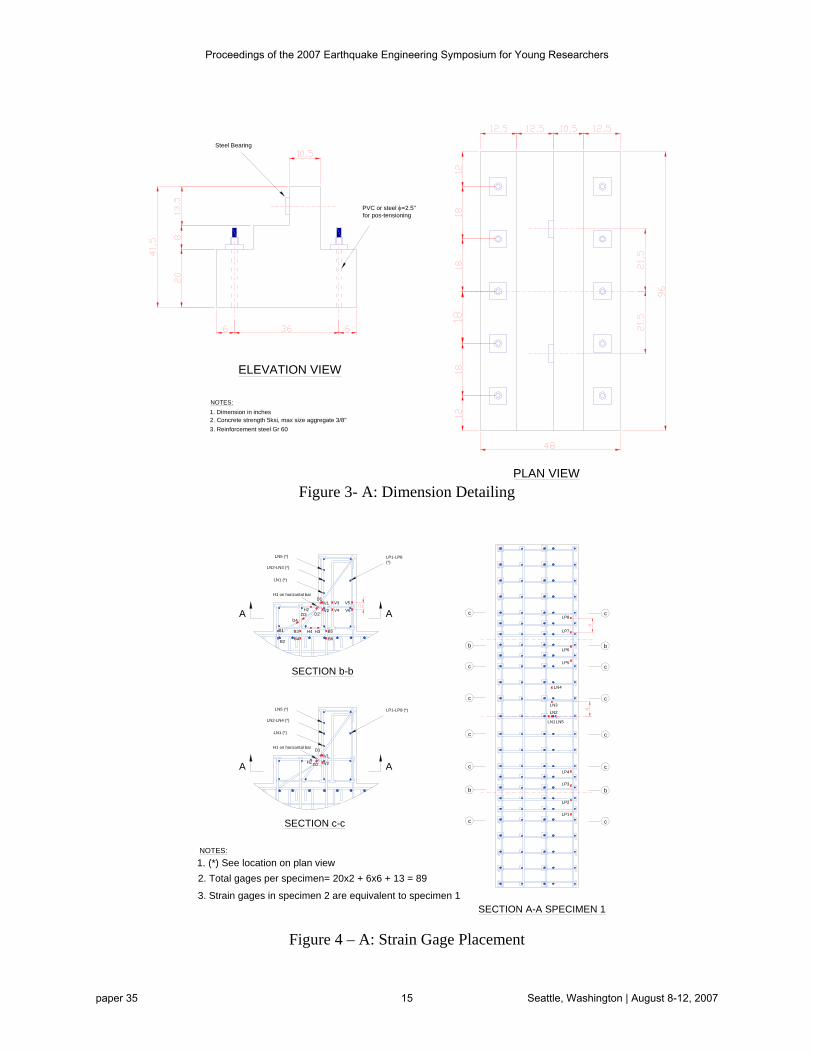
Strain Gage Placement Strain gages operate under a simple philosophy. When attached to a reinforcing bar, the gage reads a certain resistance. As the bar begins to shorten or elongate, the resistance read by the strain gage is altered. This alteration is directly correlated to the described change in length of the bar. The details of such electrical inner-workings are irrelevant to our study, but whose importance is fundamental to our understanding of the stress induced in our specimen. The important thing to note is that the strain gage is a delicate object which requires careful handling. The placement of strain gages is an arduous, lengthy process which required many hours of labor. The placement of strain gages is a direct result of preliminary FEA results. The details of the material definitions will be discussed later. For now, we will disregard the FEA input and analyze the output. The results of this preliminary analysis, show that the majority of the stress felt by the reinforcing bars can be found in the diagonal bars (Bars #5 and #6), as well as the vertical and horizontal bars. The stress can further be identified as occurring primarily at the corner. This resulted in a focus on the reinforcement of that corner. In addition, the results showed that a great deal of stress accumulated at the bearings, which are also the loading points. Using the discussed results, it was decided that strain gages will be placed in pairs on bars, and concentrated in the area surrounding the corner. The reasoning behind pairs of strain gages came from the desire to account for the interaction between intertwined reinforcement. If the strain on the top-portion of a vertical bar is different than that of the bottom-portion of a vertical bar, we can attribute the change in strain to the interaction with the horizontal bar. Thus, the lower portion of the reinforcement is serving little purpose and alternative designs can be considered without reinforcement in the lower portion of such a bar. An overall scheme of the strain gage placement can be seen in Figure 4-A located in Appendix A. Finite Element Analysis The FEA software being used for this research will be completely devoted to use with DIANA. The package is robust, but offers little support in the form of user interface. The material inputs are defined in text files, as are node and element numberings. For all analyses, the elements will be eight-node bricks. The assignment of nodes was done so with emphasis on creating a symmetric model with more elements in the actual seat, and more elements near the loading points. A screenshot of the model without access openings can be viewed in Figure 4. The model is typically referred to as a “mesh”. The first set of analyses was done so using what is called a linear analysis. This is equivalent to assigning elastic properties to both the concrete, as well as the steel. Neither cracking of the concrete, nor yielding of the steel occurs. Furthermore, an even simpler analysis was performed in which none of the steel was present. The primary reason for
Proceedings of the 2007 Earthquake Engineering Symposium for Young Researchers
paper 35 7 Seattle, Washington | August 8-12, 2007
doing so is to analyze 1) the approximate stiffness of the specimen; 2) the approximate load at which lifting of the specimen occurs. The findings of which were that the stiffness without any reinforcement was calculated at approximately 21,500 kip/in. This is extremely relevant to the development of the FEA, but will be simply regarded as “very stiff” herein. In addition, the approximate load at which lifting occurred was 300 kip. This is slightly below the approximated failure load. While approximate, this value still serves to establish an upper limit on the ability of the post-tensioned bars to act as a fixed base.
Figure 4: Three-dimensional view of FEA “mesh”
The next step was to incorporate all the steel into the model, maintaining linear properties and evaluate the changes in the aforementioned quantities. It is important to note the material definitions at this point. For the concrete: Modulus of Elasticity: 4030 ksi; for the steel: Modulus of Elasticity: 29000 ksi. Beyond those two values, nothing else is defined. In addition, it is important to describe the loading. Two points load are applied at the centroids of the bearings, in the lateral direction. Then, it was important to move forward by now treating the model as a combination of two nonlinear materials. In DIANA, a nonlinear material is described as having changes in its material behaviors (cracking, yielding) or one in which individual elements are deforming their shapes. In reality, we would desire to incorporate both nonlinear dynamic properties; however, implementation of only one, is a cumbersome task to tackle let alone two. With that being said, it was decided that the more important nonlinear behavior property was that of the material. And so, the concrete was subjected to cracking. Material inputs were as follows: Cracking Mode: Total Strain Rotating crack model; Modulus of Elasticity: 4030 ksi, Tension Strength: 0.42 ksi; Fracture energy: 5.8e-4. For the purposes of our study, we shall summarize this material definition as: cracking will occur when the tensile strength in an element reach 0.42 ksi, thereby the element will lose a majority of its tensile strength. For the steel: Modulus of Elasticity: 29000 ksi; Yielding Value: 60 ksi; Yielding
Proceedings of the 2007 Earthquake Engineering Symposium for Young Researchers
paper 35 8 Seattle, Washington | August 8-12, 2007
Mode: Von Mises. These values can be summarized as, the steel yields when it reaches a tensile stress of 60 ksi and no strain hardening was accounted for. The important aspect to take from this description is that the material definitions of both the steel and concrete have been more accurately defined. However, there is a great deal missing, since both materials are still approximated with conservative estimation of the material properties. Yet, currently we will fix the material definitions as they have been defined. Non-Linear Results With a nonlinear analysis, many more factors in the analysis must be considered which cause the analysis time and difficulty to greatly increase. Thereby, the ability to alter parameters is not so easily accomplished. This is a serious concern, since the main reason for using an FEA approach is to decrease the amount of time and effort required to perform individual analyses. There is a give and take involved in testing, which requires an interaction between time and quality of analysis. A real-time analysis requires a great deal of time, yet it provides a high quality type of data. Conversely, the FEA is designed to greatly reduce the time involved in analysis, while compromising the quality of the data associated with incomplete material definitions. As the material definitions are made more accurate, the analysis time is increased exponentially. After real-time analyses are performed, a semi-validation of the incomplete nonlinear material definitions will hopefully be made. This shall serve to establish a quasi-equilibrium point of the time-quality dilemma.
Figure 5: Force Displacement curves for various load cases
With that being said, under the previously defined nonlinear material definitions, and a loading scheme of displacement controlled loading, the average analysis is seven hours. This is a moderate analysis, with as yet to be validated results. The results of which are difficult to come by, for the loading step is a fickle entity requiring a bit of tweaking. Several loading schemes are illustrated in Figure 5. Each loading scheme is slightly altered in the way of step size. The problem is that at certain junctures in the analysis, a
Proceedings of the 2007 Earthquake Engineering Symposium for Young Researchers
paper 35 9 Seattle, Washington | August 8-12, 2007
significant amount of cracking occurs, and the solver (in this case it is Newton-Raphson) is unable to converge. In addition, the last two cases incorporate nonlinear definition of all reinforcement. Whereas, in all previous cases the reinforcement only accounts for nonlinear behavior in the seat (not the base). It easy to see that the general trend of the curve is maintained for all load cases. Early load cases terminate while they are still practically linear. Also, the general shape seems to suggest two things: 1) At approximately 250 kips, the behavior of the hinge changes, resulting in what we know to be yielding of a large number of the steel reinforcing bars and 2) The ultimate load (under these material definitions) is somewhere in the range of 350 kips. Both observations are to be validated or contradicted once actual testing commences. Simple observations are good measuring quantities for the effectives of the FEA model. It would not be at all wise to calibrate an FEA model if the experimental data starkly contradicts the FEA results. Likewise, if these results correspond to observable facts during testing, there is a solid base for further claims about the predictions of the FEA analysis. A summary of the occurrences in cases 1-10 can be seen in Table 1.
Table 1: Summary of Differing Nonlinear Analyses
Integration Load Disp Force Average # # Method Increment in Kip # Iter Cracks Yield Case 1 N Regular Automa 0.0310 225.8 Case 2 N Regular 0.00005 0.0088 107.3 2.4 1618 0 Case 3 N Regular 0.0001 0.0155 135.6 6.8 3496 0 Case 4 N Regular 0.0002 0.0272 185.0 7.5 5926 2 Case 5 N Regular 0.0004 0.0512 244.7 13.4* 9921 75 Case 6 N Regular 0.0005 0.0615 268.2 13.0 11038 142 Case 7 N Regular 0.001 0.1185 327.6 14.5 14674 385 Case 8 N Regular 0.002 0.2400 379.6 12.4 17373 612 Case 9 RT N Regular 0.001 0.1230 316.1 15.1 17710 407 Case 10 RT N Regular 0.002 0.2340 370.5 12.3 21248 658
Nonlinear Issues The most obvious issue with the nonlinear analysis is the accuracy with which it defines the material properties of both the concrete and steel. Both sets of properties are strict approximations with very discernable limits. To be more specific: while not extensively discussed here, the total strain rotating crack model used for the concrete does not take into account concrete that is crushing under its compressive limitations. Also, the Von Mises yielding criteria for the steel disregards the well known strain-hardening which steel typically experiences. In many applications, it is acceptalbe to overlook this fact. However, it has yet to be shown whether or not such disregard has a significant affect on the results of the FEA.
Proceedings of the 2007 Earthquake Engineering Symposium for Young Researchers
paper 35 10 Seattle, Washington | August 8-12, 2007
A short study was conducted, on the technique required to produce a stress-strain relationship for steel that mimics the well-known curve. The study made use of an Equation called the Voce Equation. The Voce equation is as follows:
Eq. – 1
where , k, refers to plastic strain, ep1 refers to the yield plateau and ep0 refers to the strain shift factor.
Figure 6: Illustration of the use of the Voce Equation for strain hardening The results of one curve with undefined parameters are shown in Figure 6. The parameters are purposely not included to demonstrate the variability in curves. Nearly any curve of any uniqueness, while still having the same general shape, can be created. This will be useful once experimental data can be compared with analytical. Only then can the use of such an equation be effective in further defining the material properties of the reinforcing steel. For now, it is purely a guessing game. Current and Future Work Research is currently in the experimental stage of testing, where both initial specimens of as-is reinforcement, one with openings, one without, is fully constructed and awaiting the actual test. This is a crucial juncture, in which, no further work may be done, but simultaneously serves as the cusp for current knowledge and usable data. At the completion of the two tests, the effect of the openings will be analyzed and proper data
Proceedings of the 2007 Earthquake Engineering Symposium for Young Researchers
paper 35 11 Seattle, Washington | August 8-12, 2007
regarding the load-displacement curve of the specimen and other material properties will be defined. At that point, further FEA work will be done. The first portion of which will be dedicated to statistical comparison of FEA results against experimental results. The goal of which will be to define the FEA material properties in such a way that the comparison between observable effects (cracking, yielding) and numerical results (load-displacement curves) shall be statistically equivalent. Such a task will likely prove to be highly time-consuming and arduous. At the completion of the described material definition process, a multitude of FEA’s will begin with the intent of modifying the reinforcement details in the way of reducing clutter, minimizing cost, and maintaining or exceeding the structural strength of the concrete. The described tasks herein have taken several months and the remaining tasks will surely encompass a much greater time span.
Proceedings of the 2007 Earthquake Engineering Symposium for Young Researchers
paper 35 12 Seattle, Washington | August 8-12, 2007
Acknowledgements
I must recognize PEER for providing me with such a unique and rewarding opportunity. I have seen the effects of my experience in my personal life as well as my academic life. Secondly, I must thank Dr. Khalid Mosalam for allowing me to participate in his project, and affording me the flexibility to learn as much as I desired. And finally, I must thank Matias Hube who is responsible for all of the research mentioned in this paper. I was simply able to provide some bit of assistance, lending a hand or an idea when I could. His knowledge and expertise has made me a better student and engineer.
Proceedings of the 2007 Earthquake Engineering Symposium for Young Researchers
paper 35 13 Seattle, Washington | August 8-12, 2007
Appendix- A
13
16A
SECTION A-A
A
7
116
12
@ 4
.5" 1 2 3 4
1197
1 2 3 4
5
14
15 17
18 19
20
94
7 #4 @ (*) headed L=44"
#3 @ (*) headed L=24"6
9
8
19
196
#3 @ (*) headed L=21"
338 #3 L=100"12 94
11 #3 @ (*) L=15"
#3 @ (*) headed L=21"10
3394
NOTES:
2. (*) See spacing of bars on section A-A
20 183
37 #4 @ 4" L=24"
3 #4 L=160"
15 14
943 3
46#5 @ 4" L=75"
6 #3 L=100"13
14
1. Cover: 1/2" minimum on regular bars, stirrups and
33
14
ANOTATION
3
5
4
2
18
#3 @ (*) headed L=36"
#4 @ (*) headed L=26"
#3 @ (*) headed L=36"
#3 @ 5" L=36"
17
16 #5 @ 4" L=125"
46
9416#5 @ 4" L=125"
9416
333 #4 L=160"
1 #4 @ (*) headed L=26"
#5 @ 4" L=75"15 15
15
15
33
ELEVATION VIEW
9
10
Tota
l=4
10
Tota
l=2
@ 9
" @
9"
Tota
l=2
10
Tota
l=4
@ 4
.5"
10
Tota
l=3
@ 6
" @
3"
Tota
l=6
Tota
l=6
Tota
l=3
@ 6
"
10
@ 3
" @
4.5
"
10
@ 9
" To
tal=
3To
tal=
5
21
21 463 33 #4 @ 4" L=52"
93 3
2610
1026
15
174
1" headed bars
8
#4 @ (*) headed L=20"
6
8
6
8 9 117
4321
6
8 9 117
4321
6
8 9 117
4321
6
8 9 117
4321
reinforcement heads
DETAIL A
barsDistance from head,
1 2 43
Distance from head,bars 87 109
Figure 1-A: Reinforcement Details
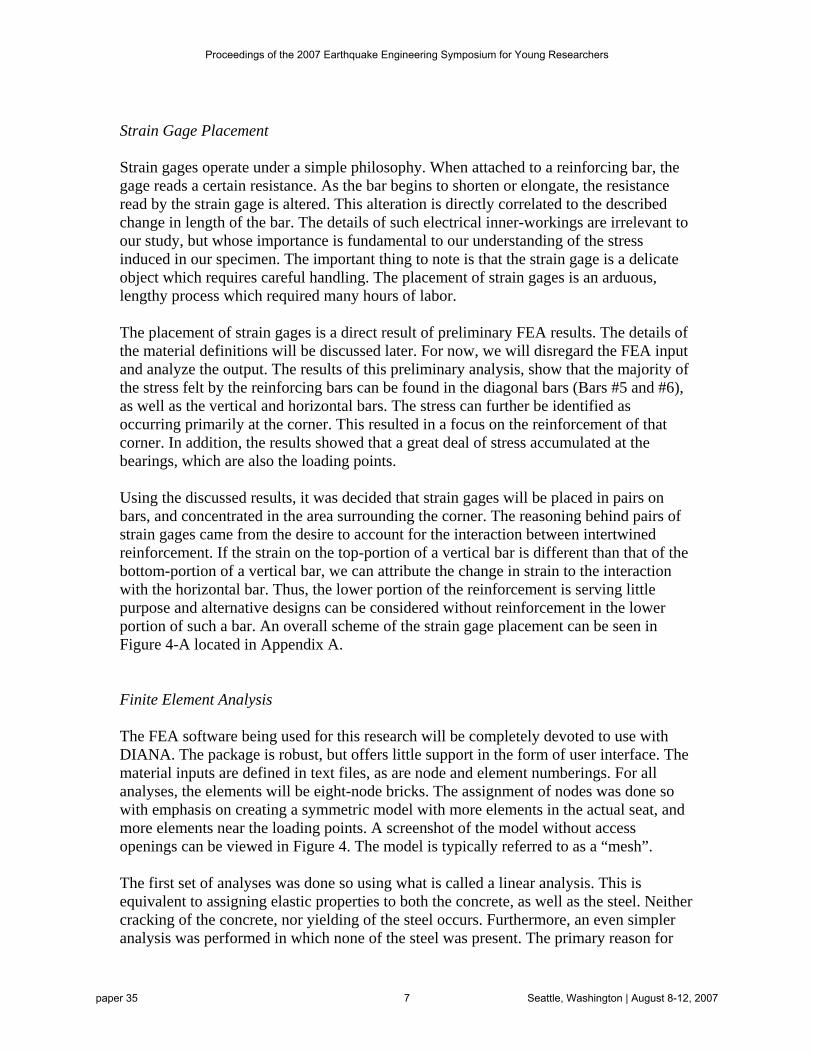
PLAN VIEW
10 Post-Tension rods 100kip each
ELEVATION VIEW
200kip load cell
End Plate1500kip Actuator W24x103 L=5' with Stiffeners
Plate 6x6x1.5"Plate 6x6x1.5"
W24x103 L=5' with Stiffeners
Figure 2 – A: Test Setup Details
Proceedings of the 2007 Earthquake Engineering Symposium for Young Researchers
paper 35 14 Seattle, Washington | August 8-12, 2007
ELEVATION VIEW
PLAN VIEW
PVC or steel φ=2.5" for pos-tensioning
Steel Bearing
2. Concrete strength 5ksi, max size aggregate 3/8"3. Reinforcement steel Gr 60
1. Dimension in inchesNOTES:
Figure 3- A: Dimension Detailing
SECTION A-A SPECIMEN 1
2. Total gages per specimen= 20x2 + 6x6 + 13 = 89
bb
c c
LP1-LP8 (*)
SECTION b-b
bb
SECTION c-c
AA
LN2-LN4 (*)
LN5 (*)
LN1 (*)
NOTES:
1. (*) See location on plan view
c c
c c
c c
c c
c cV4
V3
V2
V1
V6
V5
B1
B2
D1
D2D3D4
H2
H3H4
B4
B3 B5
B6
LP1
LP2
LP3
LP4
LP5
LP6
LP7
LP8
LN2
LN5LN1
LN3
LN4
D2
V1
V2 AA
LP1-LP8 (*)
LN1 (*)
LN5 (*)
LN2-LN4 (*)
3. Strain gages in specimen 2 are equivalent to specimen 1
H1 on horizontal bar
H2
H1 on horizontal bar D1
Figure 4 – A: Strain Gage Placement
Proceedings of the 2007 Earthquake Engineering Symposium for Young Researchers
paper 35 15 Seattle, Washington | August 8-12, 2007
References
Mosalam, K.M., Hube, M. (2007), “Development of Accessible Hinge Details for Box
Girder Bridges” Mosalam, K.M., Hube, M. (2007), “Development of Accessible Hinge Details for Box
Girder Bridges: Preliminary Report #1”
Proceedings of the 2007 Earthquake Engineering Symposium for Young Researchers
paper 35 16 Seattle, Washington | August 8-12, 2007