Graduate Theses, Dissertations, and Problem Reports 2017 Development of an Ammonia Reduction After-Treatment Systems Development of an Ammonia Reduction After-Treatment Systems for Stoichiometric Natural Gas Engines for Stoichiometric Natural Gas Engines Saroj Pradhan Follow this and additional works at: https://researchrepository.wvu.edu/etd Recommended Citation Recommended Citation Pradhan, Saroj, "Development of an Ammonia Reduction After-Treatment Systems for Stoichiometric Natural Gas Engines" (2017). Graduate Theses, Dissertations, and Problem Reports. 6447. https://researchrepository.wvu.edu/etd/6447 This Dissertation is protected by copyright and/or related rights. It has been brought to you by the The Research Repository @ WVU with permission from the rights-holder(s). You are free to use this Dissertation in any way that is permitted by the copyright and related rights legislation that applies to your use. For other uses you must obtain permission from the rights-holder(s) directly, unless additional rights are indicated by a Creative Commons license in the record and/ or on the work itself. This Dissertation has been accepted for inclusion in WVU Graduate Theses, Dissertations, and Problem Reports collection by an authorized administrator of The Research Repository @ WVU. For more information, please contact [email protected].
Transcript
Graduate Theses, Dissertations, and Problem Reports
2017
Development of an Ammonia Reduction After-Treatment Systems Development of an Ammonia Reduction After-Treatment Systems
for Stoichiometric Natural Gas Engines for Stoichiometric Natural Gas Engines
Saroj Pradhan
Follow this and additional works at: https://researchrepository.wvu.edu/etd
Recommended Citation Recommended Citation Pradhan, Saroj, "Development of an Ammonia Reduction After-Treatment Systems for Stoichiometric Natural Gas Engines" (2017). Graduate Theses, Dissertations, and Problem Reports. 6447. https://researchrepository.wvu.edu/etd/6447
This Dissertation is protected by copyright and/or related rights. It has been brought to you by the The Research Repository @ WVU with permission from the rights-holder(s). You are free to use this Dissertation in any way that is permitted by the copyright and related rights legislation that applies to your use. For other uses you must obtain permission from the rights-holder(s) directly, unless additional rights are indicated by a Creative Commons license in the record and/ or on the work itself. This Dissertation has been accepted for inclusion in WVU Graduate Theses, Dissertations, and Problem Reports collection by an authorized administrator of The Research Repository @ WVU. For more information, please contact [email protected].
1.1 PROBLEM STATEMENT ........................................................................................................................ 3 1.2 OBJECTIVE ............................................................................................................................................. 4
CHAPTER 2 Literature Review .......................................................................................... 6
2.1 THREE-WAY CATALYST REACTIONS ................................................................................................. 6 2.2 AMMONIA EMISSION CHARACTERISTICS IN STOICHIOMETRIC NATURAL GAS VEHICLES
WITH TWC .......................................................................................................................................................... 8 2.3 HEALTH AND ENVIRONMENTAL EFFECTS OF AMMONIA EMISSIONS ...................................... 12 2.4 USE OF SCR TECHNOLOGY FOR NH3 STORAGE AND REDUCTION ......................................... 13 2.5 NH3-SCR OPERATION MECHANISM ............................................................................................... 15 2.6 NH3-SCR ACTIVITY DEPENDENCY ................................................................................................ 17 2.7 CONTROL STRATEGIES USED IN SCR APPLICATIONS ................................................................. 19
2.7.1 Traditional SCR control methods ............................................................................................... 19 2.7.2 Model-based SCR control ............................................................................................................. 20 2.7.3 Control approach using Artificial Intelligence Techniques ..................................................... 22
2.8 CONTROL-ORIENTED MODEL BASED ON PHYSICAL NOX AND NH3 SENSORS ..................... 23 2.9 SUMMARY ............................................................................................................................................. 27
5.4 REGENERATION CONTROL USING FUZZY-LOGIC ...................................................................... 91 5.5 POST-TWC NH3 ESTIMATION USING ANN ................................................................................. 96 5.6 SCR MODEL CALIBRATED TO EXPERIMENTAL DATA ............................................................... 108
Figure 6. NOx conversion efficiency for vanadium-based and metal-exchanged zeolite-based SCR
activity at varying temperatures under standard-SCR conditions (Kröcher 2007) ..................................... 17
Figure 7. Schematic of a NOx-ZrO2 sensor (Blanco-Rodriguez 2014) ....................................................... 24
Figure 8. Performance of NOx sensor NH3 cross-sensitivity factor using different error estimation
designs (Zhang, Wang, and Wang 2015) ........................................................................................................... 25
Figure 9. Schematic of NH3 sensor based on non-equilibrium electrochemical sensing principle (Moos
et al. 2002) .............................................................................................................................................................. 26
Figure 10. Baseline Cummins ISL-G test cell setup ........................................................................................ 30
Figure 11. Cummins ISL-G (TWC+SCR) test cell setup ............................................................................... 31
Figure 12. Schematic diagram of an FTIR interferometer (Sanchonx 2017) .............................................. 32
Figure 14. Schematic of dilute gaseous measurement system using CVS method ..................................... 34
Figure 15. Manual lean-ON hardware control setup ...................................................................................... 35
Figure 16. Schematic of manual lean-ON control setup for intercepting on-board O2 sensor signal to
the ECU .................................................................................................................................................................. 36
Figure 17. Schematic of the experimental setup for the baseline (engine + TWC) evaluation ................ 37
Figure 18. FTP normalized speed and torque profiles ................................................................................... 38
Figure 19. WHTC normalized speed and torque profiles .............................................................................. 38
Figure 20. Normalized distribution of engines operating points for the FTP and WHTC cycles .......... 39
Figure 24. Flow-chart showing the fuzzy-logic based controller for controlling the passive-ARC
regeneration status ................................................................................................................................................ 44
Figure 25. Membership function shapes for three input linguistic variables and its values ...................... 46
Figure 26. Membership function for output variable ...................................................................................... 47
Figure 27. 48 inference rule based matrix for fuzzy-logic output ................................................................. 48
Figure 28. De-fuzzification of the fuzzy-logic output using middle of maximum method ...................... 49
Figure 29. Schematic of model-based NH3 estimation approach for the fuzzy-logic based controller .. 52
Figure 30. Example flow model architecture of ANN with seven inputs, three hidden layers and one
Figure 32. Schematic of ammonia storage distribution and CSTR model of SCR catalyst ...................... 58
Figure 33. Schematic for model parameter identification .............................................................................. 60
Figure 34. Averaged NOx, NH3, CO and THC emission concentration before and after the TWC
system over transient (FTP cycle) tests ............................................................................................................. 65
Figure 35. Averaged NOx, NH3, CO and THC emission concentration before and after the TWC
system over transient (WHTP cycle) tests ........................................................................................................ 65
Figure 42. Cumulative profile of inlet NH3, NH3 storage and NH3 slippage from the evaluated SCR 3
over the FTP cycle ................................................................................................................................................ 73
Figure 43: Comparison of averaged percent NOx conversion efficiency as a function of temperature
over the FTP cycle ................................................................................................................................................ 74
Figure 44: Comparison of averaged percent NH3 slip as a function of temperature over the FTP cycles
Figure 55. Comparison of varying lean-ON periods (Mode 3) ..................................................................... 91
Figure 56. Ammonia Slip (AS), Rate of Ammonia Slip (RAS), and NOx Slip (NOS) Membership
Function ................................................................................................................................................................. 92
Figure 60. Transient FTP profile of the seven input variables ...................................................................... 96
Figure 61. Results for measured versus estimated NH3 concentration using number of neurons and
Levenberg-Marquardt training function ............................................................................................................ 98
Figure 62. Comparison of measured and estimated NH3 concentration using different number of
neurons and Bayesian Regularization training function ................................................................................. 99
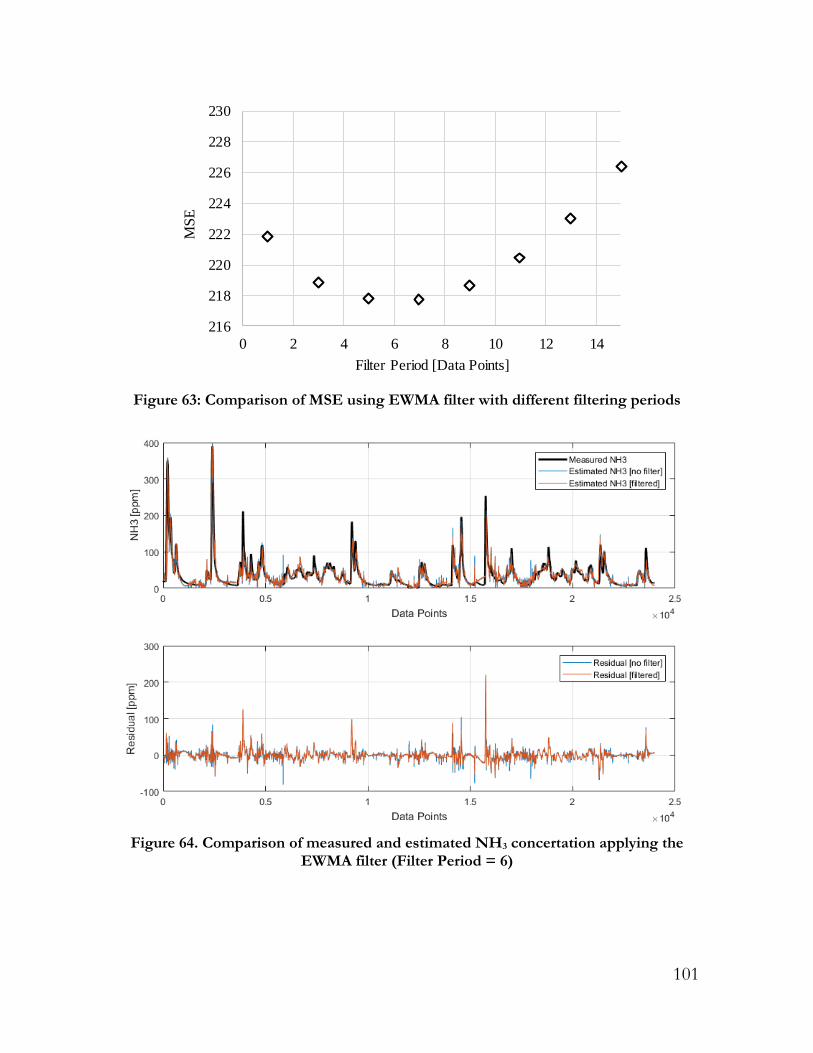
Figure 63: Comparison of MSE using EWMA filter with different filtering periods .............................. 101
Figure 64. Comparison of measured and estimated NH3 concertation applying the EWMA filter (Filter
Period = 6) ........................................................................................................................................................... 101
Figure 65. Comparison of measured and estimated NH3 concentration; (Number of Inputs = 9,
Number of Neurons = 40, Fitting Function = Bayesian Regularization, EWMA with Period = 6) .... 102
Figure 66. Comparison of number of moles of NH3 per catalyst volume (moles/m3) calculated from
actual versus estimated NH3 concentration. ................................................................................................... 103
Figure 67. Difference between actual and estimated number of moles of NH3 per catalyst volume ... 103
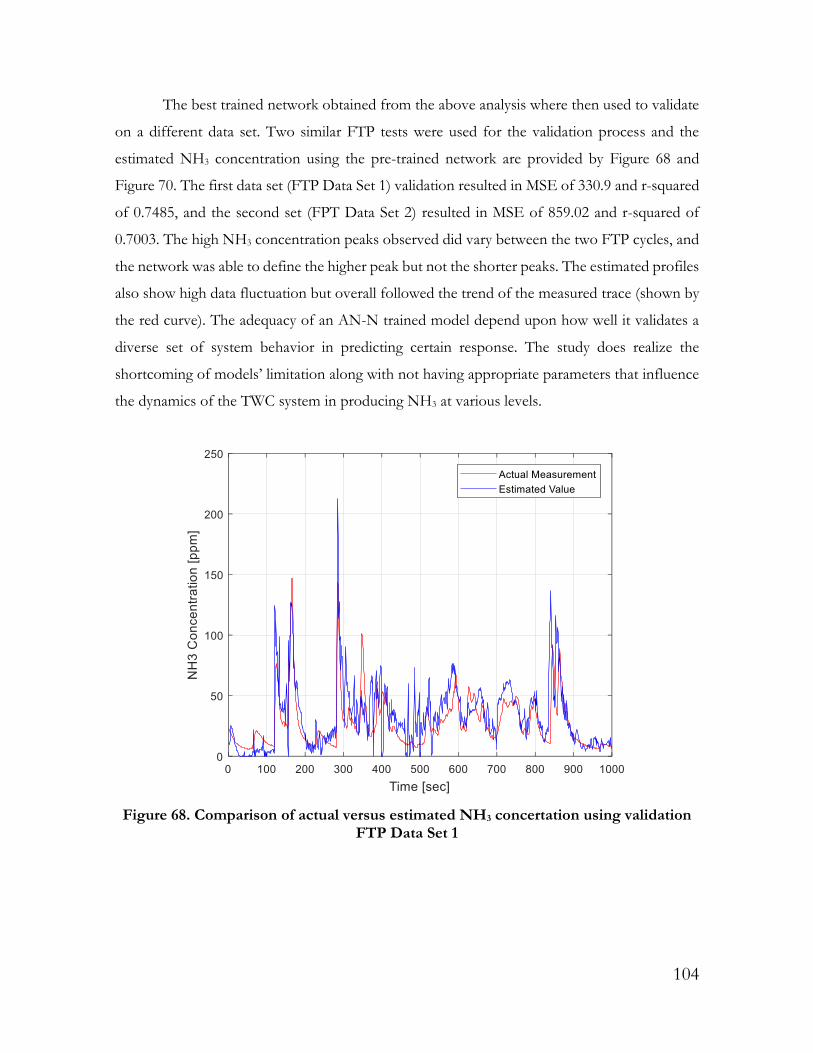
Figure 68. Comparison of actual versus estimated NH3 concertation using validation FTP Data Set 1
Figure 70. Comparison of actual versus estimated number of moles of NH3 per catalyst volume
(moles/m3) for FTP Data Set 1 ........................................................................................................................ 105
Figure 71. Comparison of actual versus estimated number of moles of NH3 per catalyst volume
(moles/m3) for FTP Data Set 2 ........................................................................................................................ 106
Figure 72. Comparison of actual versus estimated number of moles of NH3 per catalyst volume
(moles/m3) periods for FTP Data Set 2 using three different EWMA filtering ...................................... 107
Figure 73. Difference between actual versus estimated number of moles of NH3 per catalyst volume
(moles/m3) periods for FTP Data Set 2 using three different EWMA filtering ...................................... 107
Figure 74. Comparison of post-SCR NOx, post-SCR NH3 and NH3 storage ratio predicted by 3-state
SCR model storage ratio for steady-state Mode 1 (baseline operation); Initial ammonia storage ratio =
Table 8. Test matrix from the five SCR evaluation study .............................................................................. 71
Table 9. Steady-State mode test for SCR 4, engine and SCR temperature operating conditions ............ 78
Table 10. Summary comparison between baseline operation versus lean operation over eight steady-
state modes............................................................................................................................................................. 88
Table 11. Comparison of performance using different number of neurons and Levenberg-Marquardt
training function .................................................................................................................................................... 97
Table 12. Comparison of performance using different number of neurons and Bayesian Regularization
training function .................................................................................................................................................... 97
Table 13. Comparison of performance for four different number of neurons with Bayesian
Regularization training function and additional two first derivative input parameters ........................... 100
Table 14. Reaction rate identified parameters in the three state SCR model ............................................ 108
Table 15. Reaction rate identified parameters in the three state SCR model ............................................ 111
Table 16. FTIR Specification from Manufacturer ......................................................................................... 123
1
CHAPTER 1 Introduction
Considering today’s in-use emission control devices that aid modern heavy-duty vehicles
to comply with stringent USEPA emissions and CO2 greenhouse standards, natural gas fueled
vehicles utilizing three-way catalyst (TWC) technology are known to provide better fuel
consumption and lower tailpipe emission benefits when compared to the SCR equipped diesel
counterparts (D. W. Stanton 2013). However, natural gas engines are precisely controlled to
operate at a narrow stoichiometric combustion regime to effectively and simultaneously convert
major toxic emissions such as nitrogen oxides (NOx), carbon monoxide (CO) and hydrocarbons
(HC) in the TWC system. This has notably limited natural gas vehicles to operate the majority
of their activity close to stoichiometric ratio, hence, leaving less room for fuel reduction
improvements.
Efficiently converting the three major pollutants simultaneously from natural gas
engine’s exhaust stream over a TWC is commonly achieved by dithering the air-fuel ratio (AFR),
a periodical switch between rich and lean combustion window operation (Defoort, Olsen, and
Willson 2004). During the lean window, the three-way catalyst formulation is able to oxidize
HC and CO, and during the rich window favors redox reactions to reduce oxides of nitrogen
(Shi et al. 2015). In addition to the standard reactions, studies have shown that under rich
operating conditions, oxygen deficiency in the exhaust also promotes other two kinds of
reactions known as water gas-shift and steam reforming reactions (Barbier and Duprez 1994).
In such events, CO which is not oxidized due to lack of oxygen reacts with water vapor (H2O)
to form CO2 and hydrogen (H2). Further, under suitable conditions, the H2 molecules react with
available NO and CO in the exhaust stream to form ammonia (NH3), considered as a precursor
emission (Suarez-Bertoa, Zardini, and Astorga 2014).
Gas-phase NH3 is also considered to be a critical atmospheric pollutant contributing to
the formation of airborne particulate matter (Renner and Wolke, 2008). These secondary
formed particles in the atmosphere have been studied by many researchers and institutions, and
tend to show risk factors pertaining to human health (Suarez-Bertoa et al., 2014). As stated by
International Agency for Research on Cancer, a part of the World Health Organization (WHO),
particulate matter are the major constituents of outdoor air pollution and can cause cancer in
humans (IARC, 2013). In addition to human health effects, secondary ammonia also impacts
2
terrestrial vegetation (Krupa, 2003), and threatens ecosystem health by contributing to critical
amount of nitrogen in remote ecosystems (Sun et al., 2016).
Numerous emission measurement conducted in laboratories, on-road in-use tests,
roadside/tunnel studies by means of remote sensing methods and more have indicated high
levels of tailpipe NH3 emissions from both gasoline and natural gas vehicles equipped with a
TWC after-treatment system operating under stoichiometric combustion regime (Huai et al.
2003; Livingston, Rieger, and Winer 2009; Quiros et al. 2016). An emission inventory report
published in August of 2000 by the South Coast Air Quality Management District estimated
that mobile sources were the third largest source of NH3 emissions in the greater Los Angeles
area, apart from agricultural and livestock waste sources, and accounted for approximately 18%
of the inventory. Similarly, a study conducted around the same time period showed that motor
vehicles accounted for about 6% in North Carolina and 14% in San Joaquin Valley
(Battye Viney P., Roelle, Paul A. 2003). In Europe, a report published by the European
Environment Agency’s road transport sector showed an increase of 378% in ammonia emission
between 1990 and 2010.
Elevated levels of NH3 emission from natural gas vehicles could be attributed to several
factors that promotes NH3 formation. Aging of the TWC over extensive vehicle operation has
evidently shown to be one of the major contributor. Indeed, recent studies conducted by WVU
have indicated high NH3 emission from such natural gas vehicles, and also reporting vehicle age
attributing in varying levels of NH3 being emitted (Thiruvengadam et al. 2016). The
deterioration of vehicle components and aging of the after-treatment system, as illustrated by
the researchers, have shown to play a significant role in the operating characteristics of the TWC
system. In specific to three-way catalyst performance, studies have shown that degradation of
catalyst over time affects the chemical and/or thermal mechanisms of the catalyst material being
used (Matam et al. 2012), and tend to influence oxidation storage capacity (Sabatini et al. 2016),
emission conversion efficiencies, and light-off temperatures (Nagashima et al. 2000).
Although, a non-regulated pollutant in the US, increasing trend in NH3 emission from
mobile sources, especially in urban areas and densely populated cities have received critical
concerns over the years. In the heavy-duty transportation sector, natural gas-fueled vehicle
population share a significantly lower market than the diesel-fueled vehicles. However, market
studies have shown substantial penetration of natural gas-fueled vocational vehicles within
urban areas, especially in the US (Delgado and Muncrief 2015). In vocational application captive
3
fleets such as transit buses, refuse trucks, food/beverage delivery trucks and similar types,
natural gas fueled vehicles are trending upward, attributed to the increasing number of fueling
stations and vehicle procurement incentive programs at different federal and state levels.
According to a conference paper presented by Stanton, a 11.9% average annual growth rate is
projected between 2011 and 2040 for natural gas vehicles in the US (D. Stanton, Charlton, and
Vajapeyazula 2013). As a result, such a trend could potentially increase vehicular NH3 emissions
within major populated cities causing immediate as well as long term urban air quality
degradation.
The above highlights pose a critical need to monitor NH3 emission from stoichiometric
natural gas vehicles and develop strategies to capture or abate tailpipe NH3 emissions. In
addition, NH3 reduction pathways can also lead to further reduction in NOx and GHG
emissions, to potentially meet more stringent future regulations. The USEPA has initiated
rulemakings for low-NOx emission standards, and if in force, the new standard would require
all heavy-duty vehicles to meet 0.02 g/bhp-hr NOx regulation starting 2024 (USEPA 2016).
This would force vehicle manufactures to reduce NOx emissions by almost 90% from the
current standards, and would require significant advancement in emission control strategies and
technologies.
1.1 Problem Statement
The study investigates the application of coupling an ammonia reduction technology to
an existing stoichiometric natural gas after-treatment system downstream of the three-way
catalyst (TWC) in order to reduce observed precursor-NH3 emissions. According to current
industry practices, SCR systems have proven effective in reducing NOx emission by supplying
of precisely controlled NH3, to aim selective reduction reactions over the catalyst. However,
conversion performance of SCR system differs based on the catalyst formulation, where
temperature and NH3 storage capability plays a critical role. The study considers investigating
the characteristics and effects of different zeolite based SCR catalyst formulation on NH3
storage and NOx conversion efficiency operated over dynamic loading of a commercially used
heavy-duty stoichiometric natural gas engine equipped with a TWC system.
A SCR system outlet of the TWC has mostly been explored for gasoline applications, as
a lean-burn combustion strategy. This work however, demonstrates an active engine control
regeneration approach to simultaneously reduce NOx and NH3, while at the same time obtain
4
fuel reduction benefits. The regeneration process is initiated by precise control of air-fuel ratio,
alternating between rich (NH3 production mode) and lean (NH3 regeneration mode) modes,
where the ammonia absorbed during the normal stoichiometric operation in the SCR brick
could be regenerated with the effect of high NOx slip through the TWC. The approach involves
continuous monitoring of the SCR activity via utilizing additional NH3 and NOx sensors.
1.2 Objective
The global objective of this study is to demonstrate the applicability of an SCR system
similar to one used in diesel application, to be used as an added Ammonia Reduction System
(passive-ARC) that can store NH3 generated by the TWC system and then regenerated by brief,
high NOx events when shifting the engine to lean-burn combustion. The theory behind the
approach also leads to a pathway in further reducing overall NOx emissions and improve fuel
consumption benefits for stoichiometric natural gas engines. The study is divided into two
specific aims to achieve the global objective, and are provided as follows:
Specific Aim 1: Investigate NOx and NH3 reduction characteristics of different SCR
catalyst over stoichiometric natural gas engine operating conditions. In summary, the specific aim
is to identify a suitable system that performs well in ammonia storage capacity and NOx
conversion characteristics over the wide operating conditions of a stoichiometric natural gas
engine, and under the central hypothesis that a SCR catalyst is considered to be an adequate passive
NH3 reduction system. The hypothesis was tested by performing SCR catalyst evaluation
experiments over engine dynamometer procedure. Evaluation criteria included NOx conversion
and NH3-slippage over different temperature ranges, emission constituent levels, and engine
operating conditions. The SCR catalyst can then be used as a passive-ARC with a dual purpose
of storing NH3 under specific conditions and then utilize the stored NH3 as a reducing agent in
a strategic event of brief, lean-burn, high-NOx for ammonia regeneration (purge) which leads
to the second specific aim of the study.
Specific Aim 2: Develop a SCR performance controlling technique consisting of a
decision-making control feature, designed for actively regenerate ammonia stored within the
catalyst by alternating between rich (NH3 production) and lean (NH3 regeneration using NOx
reduction) modes with real-time feedback sensing based on either a physical sensor or from
model-based estimation approach. Furthermore, the specific aim will also consider sensor
5
reduction evaluation in conjunction to model-based control approach with SCR activity
estimation methods focused on real-time, in-ECU application.
6
CHAPTER 2 Literature Review
Three-way catalyst equipped stoichiometric natural gas vehicles have proven to be an
effective alternative fuel strategy that has shown superior low NOx benefits in comparison to
diesels equipped with SCR. However, in recent years, studies evaluating tailpipe emissions have
shown the TWC activity to contribute to elevated levels of tailpipe ammonia emissions.
Although a non-regulated pollutant, ammonia is a potent pre-cursor to ambient secondary PM
formation. Ammonia is an inevitable catalytic byproduct of TWC during that results also
corresponds to lowest NOx emissions. This chapter will focus on NH3 formation in the TWC,
along with its known effects on the environment and human health. Also, an extensive review
of available SCR technology utilizing NH3 will be presented. Additionally, a review will also be
done on several types of after-treatment control strategies. In summary, the literature gathered
for the study focuses on available research in the scientific and industry community that would
potentially help in achieving the studies objectives.
2.1 Three-way catalyst reactions
The exhaust stream from a natural gas combustion primarily comprises of unburned
hydrocarbons (HC), carbon monoxide (CO) and oxides of nitrogen (NOx). These emissions are
effectively controlled with the help of commonly used three-way catalyst system, which uses
combination of platinum (Pt), rhodium (Rh), and palladium (Pd) as the active catalytic
substances. Studies have shown that natural gas vehicles operated over stoichiometric
combustion provide better performance over the older technology vehicles equipped with
oxygen catalyst operated with lean-burn combustion in order to meet the more stringent 2010
NOx emission standards from the USEPA (Karavalakis et al. 2016). With the adequately
designed three-way formulation, the catalyst promotes two kinds of reactions, oxidation
reaction in the presence of oxygen to reduce HC and CO (given by Equation (1 and Equation
(2), and reduction reaction to reduce NOx with presence of CO (given by Equation (3).
7
CO + ½ O2 CO2 (1)
CH4 + 2O2 CO2 + H2O (2)
NO + CO 2N2 + CO2 (3)
Simultaneous reduction via the above-mentioned reaction of the three major gases in
the natural gas exhaust is achieved via frequently varying the air-fuel ratio (AFR) of the engine
combustion between rich and lean mixture, a commonly known strategy as fuel-dithering. This
process have shown to be an effective approach in achieving greater efficiency in reducing NOx
and CO during slightly rich operation and HC during slight lean operation (Defoort, Olsen, and
Willson 2004). From a fuel-dithering optimization study for natural gas engine showed that the
optimal dithering lambda-midpoint resides in slightly rich combustion, and precise control of
frequency and amplitude of the fuel dithering tend to affect the overall performance
characteristics of the TWC system (Shi et al. 2015).
In addition to the major chemical mechanism, two more reactions, water-gas shift
reaction and steam reforming reactions have also known to commonly occur over the TWC
system. Under suitable rich operating conditions of the engine when there is oxygen deficiency
in the exhaust stream, favors unoxidized CO and HC to form CO2 and hydrogen (H2) (Barbier
and Duprez 1994; Ohtsuka 2015), and expressed by Equation ((4) and ((5) below. Precursor
NH3 is then generated over the catalyst in the presence of molecular H2 with available NO and
CO (Nagashima et al. 2000), expressed mainly by the Equation (6) and (7).
CO + H2O CO2 + H2 (4)
CH4 + 2H2O CO2 + 4H2 (5)
2NO + 5H2 2NH3 + 2H2O (6)
2NO + 2CO + 3H2 2NH3 + 2CO2 (7)
From the above-mentioned reaction mechanisms, it shows that NH3 formation over the
TWC is a chain effect of species and their kinetic behavior, and significantly impacted by varying
8
AFR, either fuel rich combustion or oxygen rich combustion. Hence, different operating
conditions lead to NH3 formation at different levels, which are reviewed in more details in the
following sections.
2.2 Ammonia emission characteristics in stoichiometric natural
gas vehicles with TWC
Ammonia formation mechanism have not been well studied in stoichiometrically
operated heavy-duty natural gas engines equipped with a TWC system, however there have been
multiple studies evidently showing high ammonia emission levels from such engine
configuration and similar TWC system used in gasoline applications. These studies have shown
that the characteristics in ammonia production is significantly dominated by engine operating at
different AFR regime mainly to meet the required load demands and hence, directly affecting
the amount of NH3 being produced over the catalyst (Defoort, Olsen, and Willson 2004). Figure
1 shows an example of how AFR impacts the dynamics of different species along with NH3
emission observed after a TWC operated in a gasoline engine application. According to the
chart, the highest levels of TWC out NH3 occurs close to stoichiometric region in a typical
gasoline engine exhaust.
Figure 1. Effect of AFR sweep on NH3 formation over a TWC fir gasoline engine source (Li et al. 2010)
9
From the point of power demand during on-road activity, driving behavior have shown
as an influenceable factor in higher ammonia emissions seen from natural gas and gasoline
sourced engines. Detailed emission measurement studies have shown that aggressive driving
patterns or hard acceleration events result in high NH3 peaks in the exhaust (Huai et al. 2003).
Sudden power demand with high acceleration corresponds to have richer AFR indicating
sharper excursions in NH3 produced after the TWC. Recent studies conducted by WVU, also
tend to evidently report such cycle trends in peak NH3 emissions (Thiruvengadam et al. 2016).
The study measured NH3 concentration using Fourier Transform Infrared Spectroscopy (FTIR)
analyzer from various natural gas transit buses and the study reported elevated levels of NH3
concentration, as high as 800 ppm, mainly produced during acceleration events as depicted in
the Figure 2 (NH3 formation observed only when the vehicle is in motion). In addition, studies
have also shown high levels of NH3 emissions due to significant change in road grade, in
instances where NH3 emission factors almost doubled when the road grade was increased from
0 to 7% (Sun et al. 2016).
Figure 2. NH3 emission from a transit bus natural gas vehicle (Veh 4) over UDDS test
(Thiruvengadam et al. 2016)
In extension to the aforementioned WVU study that also tested similar natural gas
vehicles having different accumulated vehicle mileage evidently showed higher brake-specific
NH3 emissions, indicating vehicle age as a crucial factor. Figure 3 obtained from the study
presents brake specific NOx and NH3 emissions for five different natural gas vehicles with two
specific types of vocational application (Thiruvengadam et al. 2016). All five vehicles equipped
with TWC system as the after-treatment technology were tested on a heavy-duty chassis
10
dynamometer over the Urban Dynamometer Driving Schedule (UDDS) cycle. Results from the
study highlights the fifth vehicle (Veh 5 as referred in the Figure 3) having the highest
accumulated mileage, emitted the highest amount of NH3 emissions when compared to the
other four vehicles. The brake-specific NOx results obtained from this vehicle also appeared to
exceed the 0.2 g/bhp-hr USEPA 2010 NOx regulation levels for heavy-duty vehicle which was
still considered to be below its useful life standards (USEPA 2011). The chart also shows result
obtained from the fifth vehicle tested over real-world driving conditions which produced similar
amounts of NH3 emission than the same vehicle tested over the chassis cycle but exhibit lower
than 0.2 g/bhp-hr of NOx level.
Figure 3. NOx and NH3 emissions (g/bhp-hr) from five vocational natural gas vehicles (Thiruvengadam et al. 2016)
Thiruvengadam et al. indicated degradation of emission control, such as the aging of an
on-board feedback oxygen sensor could potentially cause sluggish response in the actual oxygen
measurement, which in return affects the fuel dithering. And, this imbalance in engine operation
control of the air-fuel ratio for the optimum TWC performance could lead to variability in
tailpipe NH3 emissions (Thiruvengadam et al. 2016). A study by Wang et. al specifically studied
the impact of oxygen sensor degradation on air-fuel ratio and emissions, and reported that a
small shift in the signal from the oxygen sensor, for example, weather its upward, downward or
even a slight delay in the sensor response, would deviate the conversion of the HC, CO and
NOx to either increase or decrease (Dongliang Wang et al. 2011).
0
50k
100k
150k
200k
250k
0.0
0.1
0.2
0.3
0.4
0.5
0.6
Veh 1 Veh 2 Veh 3 Veh 4 Veh 5 Veh 5 (In-Use)
Odo
mete
r [m
iles]
g/b
hp
-hr
NOx
NH3
ODO
Goods Movement NG Vehicles
Transit Bus NG Vehicles
11
Additionally, extensive experimental studies have also shown degradation of TWC due
to catalyst aging, and are typically caused under chemical and/or thermal process of the TWC
over repeated use in time, affecting the overall performance of the catalyst. Matam et al. studied
the thermal and chemical aging in a model TWC with Pd/Al2O3 for compressed natural gas
vehicles exhaust and results showed that thermal aging leads to simply physical modification
such as decreased surface area and dispersion of the catalyst material (Matam et al. 2012). The
authors also highlights that physical modification clogs support pores along fouling of Pd
nanoparticles. On the other hand, chemical aging was shown to be more detrimental than
thermal aging for TWC performance, drastically decreasing the efficiency. The performance
activity for a TWC to start converting CO, HC and NOx above a certain efficiency greatly
depends upon the light-off temperatures of catalyst material used, and such effect has been
widely researched. For example, from a thermal aging study for a typical (Pd-Pt-Rh)
combination based TWC, significant differences were observed in performance between fresh
and aged catalyst (González-velasco et al. 2000). In this study it was shown that the light-off
temperatures tend to shift towards a higher temperature with an aged catalyst and also
considerably degrades performance in NOx conversion, as referred to the bottom right chart in
Figure 4.
Figure 4. Light-off curves corresponding to fresh versus aged TWC with different formulation (González-velasco et al. 2000)
12
Similarly, Sanatini et al. characterized the effects of aging on TWC, and reported aging
substantially affects the oxygen storage dynamics of the catalyst and hence, affects the overall
performance and formation of high NH3 emissions (Sabatini et al. 2016). The study mentions
the importance of monitoring the oxygen concentration after the TWC to better understand the
oxygen storage dynamics and proposes using a post lambda sensor as a good aging indicator. In
order to better optimize oxygen storage capacity of the catalyst, loading interaction between Pt-
Rh and Pd-Rh in the TWC have contributed to be a major factor in achieving high performance
even after extensive thermal aging (Nagashima et al. 2000). In addition to formulation loading,
optimization of the substrate material such as alumina and Ce, also helps in compensating the
high mobility of Pt at the high aging temperatures. Effects of Sulfur poising have also been
studied for TWC activity which shown the degrade the TWC performance. Ohtsuka et. al
examined Pt-Rh/CeO2-Al2O3 TWC aged with SO2 under 400-500ºC temperatures operating
conditions, and presented results indicating significant decrease in performance activity,
especially CH4 conversion (Ohtsuka 2015).
2.3 Health and environmental effects of ammonia emissions
Gas-phase ammonia has shown to contribute to the formation of airborne particulate
matter (Renner and Wolke 2008). Research in this area has indicated that ammonia in ambient
air neutralizes nitric and sulfuric acid to form ammonia nitrate (NH4NO3) and sulfate
(NH4)2SO4, a two important components contributing to airborne fine particles or PM2.5
(Tengyu Liu Boguang Wang, Xiang Ding, Wei Deng, Sujun Lü, Yanli Zhang 2014). These
secondary formed particulate matter in the atmosphere have been examined by many
researchers and institutions, and tend to show risk factors pertaining to human health (Suarez-
Bertoa, Zardini, and Astorga 2014). As has been stated by International Agency for Research
on Cancer, a part of the World Health Organization (WHO), particulate matter are the major
constituents of outdoor air pollution and can cause cancer in humans (IARC 2013). In addition
to human health effects, secondary ammonia also impact terrestrial vegetation (Krupa 2003),
and threatens ecosystem health by contributing to critical amounts of nitrogen in remote
ecosystems (Sun et al. 2016).
Although studies have shown that exposure to ammonia at environmental concertation
is unlikely to have direct adverse effects on human health, however, exposure to high
concentration could cause irritation of the eyes, nose and throat as well as burning of the skin
13
from direct contact. Ammonia, even at low concentrations, when released into air gives
unpleasant odor, but most notably harm vegetation, particularly at high concentrations (Krupa
2003). On the other hand, ammonia in water bodies causes more serious harm due to the toxicity
to aquatic organisms.
2.4 Use of SCR technology for NH3 storage and reduction
The use of SCR catalyst technologies have widely been investigated and proven to be
an effective technology in removing NOx emissions from modern automotive vehicles
equipped with compression ignited diesel engines (Tennison, Lambert, and Levin 2004; Johnson
2009; D. W. Stanton 2013; Nova Enrico 2014; Delgado and Muncrief 2015; Franco S.
Francisco; German, John; Mock, Peter 2014). As widely adopted technology to reduce majority
of the engine-out NOx emissions, large numbers of heavy-duty vehicle manufactures have also
utilized engine-based control strategies in addition with the SCR system (D. Stanton, Charlton,
and Vajapeyazula 2013). Engine-based strategy such as the exhaust gas recirculation (EGR)
technology has provided manufactures in further meeting the stringent NOx emission standards.
Several studies have also demonstrated coupled after-treatment configurations with use
of a SCR system downstream of the TWC, typically in spark ignited direct gasoline engines to
achieve lean-burn fuel consumption benefits with NOx emission reductions (V. Y. Prikhodko
et al. 2016; Li et al. 2010; Theis, Kim, and Cavataio 2015; Guralp et al. 2011). Researchers Guralp
et al. demonstrated using a passive ammonia SCR system on an underfloor (U/F) SCR for
storage of ammonia which is produced by the close-coupled TWC systems (Guralp et al. 2011).
The study looked into oxygen tolerance and temperature requirements for the added SCR under
stoichiometric conditions using a lab reactor experiment, and found that oxygen concentration
was an important factor in order to get efficient NOx reduction over the catalyst. Based on the
findings that NOx reduction efficiency was very low in the absence of oxygen, researchers
experimented rich pulses operation where the SCR catalyst was able to store the ammonia
produced on the close-coupled TWC and during lean pulse, NO was reduced by ammonia-SCR
reaction over SCR catalyst. The study was also looked with use of combining with Deceleration
Fuel Cut-Off (DFCO) and lean-idle (LI) operation strategies with the passive-SCR integration
for fuel consumption improvement. The result indicated that in urban section of the FTP fuel
consumption improved by 8.9% and additional improvement with a total of 11.1% when lean-
idle strategy also enabled. The work also highlights the benefits of using passive-SCR for
14
stoichiometric application where the TWC can benefit from PGM loading requirements,
performance improvement under varying operating strategies, increasing flexibility of air-fuel
control and simplicity in the control techniques.
Study conducted by Prikhodko et al. demonstrated a 2.0L lean burn gasoline direct
injection (GDI) engine utilizing a TWC system as an onboard NH3 producer, acquired during
periodic rich engine operation and subsequently storing NH3 over a SCR (Cu-based) catalyst
(V. Y. Prikhodko et al. 2016). The stored NH3 in the catalyst brick was then allowed to react
with brief high levels of unreacted NOx slipped through the TWC during lean combustion
operation. The study presented results of NOx conversion greater than 99% with the added
passive SCR system and fuel consumption benefit ranging between (6-11%) under certain
engine condition when compared with its baseline stoichiometric operation. On the other hand,
Prikhodko et al also studied a hybrid LNT+SCR system used to control NOx from a light-duty
diesel engine with in-cylinder regeneration controls (J. P. and V. Prikhodko 2009). The results
from the study showed that the NH3 formation increased strongly with extended regeneration
of the LNT and cycling he control to lean-rich parameters enables controlling the ratio of NOx
reduction between LNT and SCR catalysts. Additionally, the stored NH3 after multiple lean-
rich cycles can enable continued NOx reduction by the SCR the lean-rich period stops, assisting
in better optimization during transient operation.
General Motors (GM) have published few different papers demonstrating passive
ammonia-SCR system (PASS) indicating a potential low cost, simple and urea-free-system to
enable the implementation of lean-burn gasoline engines (Li et al., 2010, Kim, Perry, Viola, Li,
& Narayanaswamy, 2011). In the paper published by Li et al. showed NOx conversion efficiency
greater than 85% with passive SCR system for a 2.2L GDI engine. The experiments were
evaluated with two kinds of zeolite-based SCRs, Cu- and Fe- tested over New European Driving
Cycles (NEDC). On the other hand, the study published by Kim et al., indicated that the PASS
needs to be adequately optimized for the PGM loading and oxygen storage control for HC/CO
control during both stoichiometric and rich operations. Some of the key parameters the authors
mentions are the TWC wash-coat formulation that maximizes the efficiency of ammonia
generation under mildly rich operating conditions, SCR formulation that maximizes NH3
storage and thermal stability at temperature greater than 400ºC. Comparison on ammonia yield
and response time of a TWC and Pd/Al2O3 catalyst combined with a passive SCR catalyst under
dynamic engine operating conditions has also been investigated. It was observed that the yield
15
of ammonia under rich condition was able to be maximized by using minimal valve overlap and
an advanced spark timing, and additionally, use of low lambda values reduced the oxygen
content of the exhaust gas, raising the H2 content resulting in increasing trend of the rate of NO
conversion into ammonia. A study performed by Ford Motor Company also demonstrated a
TWC but combining a lean-NOX trap (LNT) and a SCR catalyst for lean NOx control (Theis,
Kim, and Cavataio 2015). The study showed equivalent NOx conversion and lower NH3
emissions, however, the approach resulted in higher fuel consumption due to LNT purge
requirement and/or to generate NH3 for the SCR as compared to TWC+SCR only system.
Additionally, the study also examined effect of sulfur poisoning on the combine configuration,
and indicates that the SCR catalyst does not significantly get affected by sulfur poisoning, but
the NH3 production and steam reforming capability of the TWC significantly degrades by sulfur
during continuous operations at temperature near 500ºC. The authors also indicate that the
closed coupled configuration would tend to remain in desulphated state with events caused
from hot rich conditions during cold start, accelerations, and high load operations.
2.5 NH3-SCR operation mechanism
The basis of SCR application in diesel exhaust and, the main chemical reaction that
occur over the SCR catalyst are provided by three main mechanisms. The first reaction provided
by Equation (8), interpreted as “standard-SCR” (Koebel, Elsener, and Madia 2001), between
NH3, NO and O2, where four mole of NH3 reacts with four mole of NO and one mole of O2
to produce N2 and H2O. However, due to low availability of oxygen present in a typical
stochiometric operated natural engine’s exhaust, the reaction would occur at much slower rate,
and potentially hinder NO to NH3 selective reduction reaction.
4NH3 + 4NO + O2 4N2 + 6H2O (8)
Subsequently, a faster known reaction (Bosch and Janssen 1988) between the reducing
agent NH3, and mixture of an even ration of 1:1 between NO2 and NO is given by Equation
(9). This reaction is also recognized as “fast-SCR” reaction.
2NH3 + NO + NO2 2N2 + 3H2O (9)
16
Conversely, the reaction is slower when NO2/NOx ratio exceeds 50% (Bosch and
Janssen 1988), and such reaction, solely with NO2 is provided by the following Equation (10).
8NH3 + 6NO2 7N2 + 12H2O (10)
In the SCR system, the ammonia decomposes on the catalyst surface and reacts with
NOx. The unreacted NH3 is stored in the catalyst through adsorption and the stored ammonia
is either further reacted with NOx and oxidized with O2 or desorbs from the surface. The
potential adsorption, desorption, oxidation and NOx conversion capability of the SCR catalyst
to the ammonia depends on temperature, surface area and catalyst loading (Haga et al. 2015).
For example, the amount of NH3 that can be stored in a SCR catalyst, decreases with rise in
catalyst bed temperature. Additionally, the storage capacity as a function of temperature also
tend to differ with the type catalyst formulation used. Eijnden et. al. showed zeolite based SCRs
can store higher levels of NH3 at lower temperatures than for a Vanadium based catalyst SCR,
and also indicates a non-linear behavior of storage with respect to temperature, as depicted in
Figure 5 (Eijnden et al. 2009).
Figure 5. Ammonia storage capacity for two SCR formulation as a function of temperature (Eijnden et al. 2009)
17
2.6 NH3-SCR activity dependency
The main target of the SCR system is the conversion efficiency of NOx, and this
efficiency highly depends upon multiple factors such as type of ammonia storage ratio, catalyst
material, NO-to-NO2 ratio, and most importantly the catalyst temperatures at which the
reaction takes place inside the SCR system (Keuper et al. 2011). Additionally, it presents that
above mentioned parameters have interdependency within each other for optimum SCR
functionality.
As reviewed earlier, the effect of temperature on SCR efficiency also depends on the
type of catalyst coating used. Different catalysts-based material within the SCR system have
varying light-off temperatures along with different temperature ranges for optimum catalyst
activity. Figure 6 compares the catalytic activity of iron-based (Fe), copper-based (Cu) and
vanadium-based (V) coated catalysts given by the symbols (), () and (•), respectively.
Figure 6. NOx conversion efficiency for vanadium-based and metal-exchanged zeolite-based SCR activity at varying temperatures under standard-SCR conditions
(Kröcher 2007)
A similar pathway could be approached towards a lean-burn natural gas engine
application, and catalyst formulations plays a vital role in the overall performance of converting
ammonia and NOx emissions. Based on different SCR formulation, the performance due to
lean-burn catalytic operation can be varied with temperature, in changing the catalysts light-off
temperatures (the minimum temperature at which the catalyst starts aiding the selective reaction)
and the optimum conversion temperature ranges, where the catalyst effectively reacts in
converting the targeted component (Colombo, Nova, and Tronconi 2010). In specific to heavy-
18
duty diesel market, Cu-zeolite and Fe-zeolite based and V-based are the two commonly used
base metal SCRs that are adopted (Skaf et al. 2014). However, the Cu-zeolite based catalyst
formulation are more dominantly used than compared to the other two due to its observed
lower temperature performance suitable for after-treatment activity seen in modern heavy-duty
diesel vehicles (Kamasamudram et al. 2010). In terms of their performances at different active
temperature ranges, Cu-zeolite based have operating range between (150-450°C), Fe-zeolite
based have between (350-600°C), and V-based have between (300-450°C) (Majewski 2005). On
the other hand, natural gas SI engines are typically known to operate at high combustion
temperatures resulting in high exhaust stream temperatures. From a recent on-road study
conducted by WVU with a 2013 CNG vehicle, show exhaust temperatures as high as 600°C
measured right after the TWC (Quiros et al. 2016). The zeolite-based SCRs seems more suitable
in high exhaust temperature activity of natural gas engines; however, it is to be noted that the
ammonia is a precursor of TWC reaction and its known to be generated irrespective to the after-
treatment state. Consequently, the ammonia storage capacity of the select SCR would be
considered as an important factor in selecting the right formulation of a passive reduction
system. A study performed by Frobert et al. indicated that the exhaust temperature, NO2/NOx
ratio, and air mass flow were the three main parameters that influenced the ammonia storage
characteristics (Frobert et al. 2009). Studies have also shown ammonia storage capacity tend to
be higher at lower catalyst temperatures and decreases as temperature increases (Li et al. 2010).
Li et al. specifically highlights results for Cu-zeolite based catalyst observing higher ammonia
storage capacity as compared to the Fe-zeolite based catalyst, however, both catalyst showed
ammonia storage at their lowest levels and an initiation of increasing trend in NH3 slippage
(desorption) at temperatures of 400°C and above.
In contrast to any specific SCR catalyst, the NH3 adsorption and desorption
characteristics highly depends upon factors like the gaseous concentration, catalyst surface
temperature and the exhaust flow rates (Zhao et al. 2011; Colombo et al. 2012; I. Nova 2011;
Keuper et al. 2011). Additionally, the SCR systems are highly nonlinear in behavior due to
transient operations, reaction kinetics and the nature of thermal effects on the catalyst brick
along with the catalysis processes occurring at different time scales (Figura et al., 2016)
(McKinley and Alleyne 2009; Skaf et al. 2014). In regards to different time scales, author Skaf
et al. distinguishes three time scales for an SCR system from a control point of view of NH3
dosing in their study (Skaf et al. 2014). From the three-time scale explained, the fastest time
19
scale (referred to as Quasi stationary) occurs during the transport and reaction in the gas phase,
which typically takes fraction of a second. The medium time scale (referred to as short term) is
due to catalyst state, where effects from NH3 coverage and substrate temperature dynamics
plays a role. And, then the third-time scale (referred to as long term) happens over long period
of time due to sensor and actuator drifts and catalyst aging. Therefore, various control
approaches have been exploited and implemented especially in performance of diesel after-
treatment devices which are oriented around the dynamics of the type catalyst system used and
the performance targeted.
2.7 Control strategies used in SCR applications
In effective utilization of urea-SCR control technology, several advanced control
techniques have been developed and studied for active urea dosage rates which are aimed at
highest NOx conversion targets and minimum NH3 slippage. Development of such SCR
controls related task require satisfying some of the key challenges of the complex after-treatment
system. The sections below reviews some of the control strategies and the development in the
research area of SCR control. The review also illustrates some of the control challenges,
especially in today’s modern heavy-duty after-treatment configuration and complexity of the
systems working together to keep NOx emissions below the enforced limits.
2.7.1 Traditional SCR control methods
The control techniques typically involve either a feedforward open-loop control or
feedback closed-loop control or combination of both architecture to improve the overall SCR
performance (Haga et al. 2015; Chavannavar 2014). As described by Haga et al., the open-loop
control technique which are considered as the conventional method in SCR control uses
variables obtained from model based state estimation generally summarized in table lookups or
maps which are defined either during offline (requiring calibration time) or even online (real-
time learning/adaptive) basis. These methods are simple and less complex to implement but
usually lack measurement error compensations causing inconsistency in catalyst performance
over its usage time (Skaf et al. 2014). Plus, majority of the open-loop control strategies are based
on the stoichiometric assumption of the SCR catalyst surface reactions which are limited due to
the fact that not all the reactions taking place on the surface are known or have been identified
(Chi 2009).
20
On the other hand, closed-loop control technique uses feedback from its output
quantity signal and, hence the control output becomes a function of the desired output error
compensation, giving a dynamic control over more transient system response. Closed-loop
based SCR control methods have become the prime technique in modern heavy duty after-
treatment technologies but are known to have its own challenges mainly due to its nature of
dependency in measuring accurate output signals as most of the time delivered from physical
sensors (Willems et al. 2007). Willems et al. mentions some of the major aspects that limits the
proper applicability of the SCR performance controlling technique which are seen from slow
catalyst dynamics, cross-sensitivity of the NOx and NH3 sensor to respective species, and time
delay in the urea dosage system. The author also discusses relevant control strategies conducted
via using combination of closed-loop along with open-loop control schemes as an integrated
controller where the open-loop control kicks in as a fallback strategy in the case of feedback
sensor failure. With similar approaches seen in SCR control systems, conventional controllers
such as close-loop Proportional-Integral-Derivative (PID) controller mechanism have also
widely been designed and implemented for error regime compensation along with including
feedforward and adaptive compensator to overcome some of the inherent variability in the
signal sources, model and hardware aging effects (Ong et al. 2010).
Furthermore, design challenges may include additional complexity underlying the
dynamic changing process of the system and, eventually require rigorous tuning/calibration of
the PID parameters of the control response, taking into account the control stability and the
nonlinearity dependency on the temperature of the catalyst. The robustness of the closed-loop
urea-SCR controllers greatly depends upon the feedback signal and its response to different
transient behavior, in case of occurrence of over-dosage of urea and therefore, proper NH3 slip
detection is critical.
2.7.2 Model-based SCR control
The characteristics of the SCR dynamics due to reaction kinetics, different catalyst state
at different time scales, and strong nonlinearities originated from chemical reaction and
temperature affect the adequacy of the control behavior. In a paper published by the Jiri Figura
(Figura et al. 2016), the author briefly reviews different model-based estimators from numerous
literature survey and identifies important set of features where the estimators have to satisfy in
order to adequately characterize the SCR system and its performance. For example, the
21
estimator needs to have moderate stability under feasible operating conditions, good steady-
state and transient estimation, robustness to modeling uncertainties and measurement over
different ambient and temperature conditions along with cost-effectiveness and low
computational complexity. The author also mentions some of the proposed techniques in study
and development of estimation of NOx concentration and NH3 coverage ratio. A better
dynamic operation model-based control has been shown using a state estimation via NH3
coverage ratio, which is not directly measurable but can be estimated from kinetic model.
Model-based SCR control strategy based on estimating the state of the SCR system has
been an effective methods in reducing design complexity, usually witnessed in classical
controller methods (Herman et al. 2009). The state feedback and state estimation control feature
with linear and nonlinear observer techniques have shown SCR control benefits than relying
only on inlet-out SCR NOx and NH3 values, and in majority has led to sensor reduction.
However, depending upon the inaccuracy of state estimation, such approach are known to
sensitive to disturbance and error accumulation which causes variation in the SCR control (Skaf
et al. 2014),. Simplified models on state estimation with assuming linearized SCR system, in
order to predict gas phase NH3 slip and catalyst ammonia coverage ratio has also been studied
(Upadhyay and Van Nieuwstadt 2006; Devarakonda, Johnson, and Parker 2012). Although such
approach works well within a narrow operating conditions of the SCR, their accuracies are
limited due to presence of nonlinearities, uncertainties and high variable disturbance (Skaf et al.
2014). Likewise, there have multiple studies using nonlinear models to estimate internal species
along with NH3 coverage ratio. Studies have shown to use different estimation technique using
non-linear models, such as sliding mode observer design for estimation of NH3 coverage ratio
with incorporating temperature and inlet and out NOx sensors signals but require a mid-catalyst
NH3 sensor to give robustness against the NH3 cross-sensitivity (M.-F. Hsieh and Wang 2011).
Similarly, Chen et al. proposed an alternative design which did not require the NH3 sensor and
estimated the mid-catalyst NH3 concentration with minimum NH3 cross sensitivity (Chen and
Wang 2015). Some studies have also utilized using Extended Kalman Filter (EKF) technique as
the nonlinear model estimator with different outlet sensor configuration with and without
considering NOx sensor cross sensitivity to NH3 (M. F. Hsieh and Junmin Wang 2010; Figura
et al. 2016). Numerous model-based studies have been considered with or even without using
physical sensors such as the NOx and NH3 sensors as these sensors tend to add cost to the
overall system (Chen and Wang 2014).
22
2.7.3 Control approach using Artificial Intelligence Techniques
Currently, artificial intelligent techniques have been gaining lot of attraction in
developing automotive virtual sensors mainly in the area of on-board after-treatment
diagnostics, delivering similar accuracy, dynamic performance and faster time response (Arsie
et al., 2013). Few examples of fuzzy-logic usage in automotive applications are: fault diagnosis
for engine vacuum leak detection (Lu et al., 1998), control methods for plug-in hybrid electric
vehicles (Ivanov, 2015), vehicle speed controller (Altrock, 1997), and more famously used in
active vehicle suspension systems (Jinzhi et al., 2002). Some vehicle manufactures have also
used it as engine-control solution in ECU architecture replacing some of the loop-up-tables
(Altrock, 1997). A study published by Jinzhi et al. also demonstrated using fuzzy-logic controller
with combination of other artificial technique such as GA-based optimization method for PID
tuning and NN for parameter estimation (Jinzhi et al., 2002).
Similarly, fuzzy-logic decision-making strategy has also been efficiently utilized for after-
treatment controls (Niewiadomski and Kacprowicz, 2014, Meierjurgen et al., 2013, Theodore,
2008). In the field of SCR control development, Fuzzy-Logic (FL) based control algorithm has
also been widely utilized in urea-dosage application (Soliman et al., 1998). In a thesis research,
carried out by Theodore R. Adams from WVU (Theodore, 2008), studied a controller design
developed for an open loop non-sensor based fuzzy logic urea dosage controller with employing
development of urea injection maps. The study presented results with more than 50% NOx
reduction over two different transient cycles with maximum NH3 slippage of 10ppm and less.
In a another study aimed at complete sensorless SCR system approach, two ANN was trained,
one for predicting engine out NOx using engine parameters and the other for predicting SCR
NH3 coverage ratio using a non-linear state-space plant model that simulated reduction
reactions in the SCR (Meierjurgen et al., 2013). A fuzzy-logic based controller was then
developed to control urea-dosing utilizing two inputs, consisting of the error function calculated
from the output NOx of ANN with predetermined NOx target and NH3 surface coverage
predicted from the second ANN.
The fuzzy-logic based control strategies can be designed for non-linear systems with just
basic minimum knowledge of depended multiparametric behavior of the desired system using
experimental experiences. This tends to reduce the complexity in decision-making mechanism
approach by applying data-driven engineering heuristics and makes the control logic qualitative
in nature.
23
2.8 Control-oriented model based on physical NOx and NH3
sensors
Utilizing in conjunction with one or multiple sensors in order to monitor SCR state and
activity have been common control approach, mainly in open-loop controls, in targeting
efficient NOx reduction as a result of adequate urea injection upstream of the catalyst. For
example, NH3 sensors has been used for pre-SCR ammonia concentration and mixing as a
feedback signal to controllers for urea-dosage purpose. Similarly, such method is also further
refined by including NOx signals monitoring NOx downstream of the SCR catalyst as an
additional feedback signal. Combination of using NOx sensor pre-and-post of SCR also
provides advantages, especially in the OBD applications. The flexibility and performance of the
control related task also depends upon he integrity of the sensors used, for example, cross
sensitivity of NOx sensor to NH3 play a key challenge in effective SCR activity. The following
paragraphs reviews literature on using NOx and NH3 sensor for commercial SCR control
applications and their ongoing development in widely available model-based and adaptive
control techniques.
Similar to oxygen sensors, NOx sensors have been in development from early as 1990s,
and was commercially introduced in 2002 for gasoline cars and extended onto diesel SCR system
in 2005 (Jääskeläinen and Majewski 2016). The on-board applied NOx sensors have commonly
been working under the same principle based on yttrium-stabilized ZrO2-based electrochemical
sensing and have progressed over time on measurement ranges, accuracy and durability. Figure
7 provides the common layout of the working principle of the ZrO2-based NOx sensor used in
common exhaust path. NOx sensor manufactured by NGK and in partnered with Continental,
known as the UniNOx sensor, measures ranges of 0-500ppm or 0-1500ppm depending on the
application used for, with accuracy of ±10% at 100ppm to 500ppm and ±10ppm at 0 ppm
(NGK 2017).
24
Figure 7. Schematic of a NOx-ZrO2 sensor (Blanco-Rodriguez 2014)
Current NOx sensor measurement method has a major challenge, that is such sensors
are typically cross-sensitive to other nitrogen compounds at various levels. More importantly,
cross-sensitivity due to gaseous NH3 have shown to corrupt NOx sensing measurement and
varies with temperature (Zhang, Wang, and Wang 2015). This could potentially impact SCR
urea control dependent upon NOx sensor feedback to accurately control at dynamic conditions
of the exhaust. These could also lead to over or under dosing of urea, causing either urea cost
or impact catalyst performance. There have been studies on eliminating the NOx sensor cross-
sensitivity to NH3 and estimate actual NOx concentration using cross-sensitivity correction
factors, and typically modeled using the following expression (M. F. Hsieh and Junmin Wang
2010; Marins 2000):
𝐶𝑁𝑂,𝑠𝑒𝑛𝑠𝑜𝑟 = 𝐶𝑁𝑂∗ + 𝐾𝐶𝑆𝐶𝑁𝐻3 (11)
where, 𝐶𝑁𝑂∗ is the actual NOx concentration, 𝐾𝐶𝑆 is the cross-sensitivity factor, and
𝐶𝑁𝐻3 is the actual NH3 concentration. The model is used in predicting the actual NOx
concentration using the sensor model as expressed above. The 𝐾𝐶𝑆 cross-sensitivity factor is
obtained using ammonia measurement. The authors address that the level of cross-sensitivity
factor changes and varies between sensors. It shows that sensor aging causes inaccuracy in the
25
factor, slowly with time, and becomes a challenge to develop models to adequately. Design
based on Extended Kalman Filter (EKF) was proposed in the study to estimate NOx
concentration and cross-sensitivity factor based on approximated model and the stochastic
character of signals. Results obtained on FTP75 test cycle indicated the approach to accurately
eliminate cross-sensitivity error caused by presence of ammonia and able to predict actual NOx
concentration. In a recent study, the same authors utilized a different approach to remove NOx
sensor ammonia cross-sensitivity from measurement in diesel SCR systems (Zhang, Wang, and
Wang 2015). The study evaluates using H2/H∞ approach, a design for gain-scheduling strategy
consisting of an adaptive compensation for the existing nonlinearities and the involved time-
varying parameters of the SCR model. Experiment results from the study indicated that the
proposed model performed better over the EKF on estimating the cross-sensitivity of NOx
sensor to ammonia, as shown in Figure 8. Additionally, EKF approach was also found to be
slower than the alternative proposed method.
Figure 8. Performance of NOx sensor NH3 cross-sensitivity factor using different error estimation designs (Zhang, Wang, and Wang 2015)
NOx sensors have also been used to estimate NH3 concentration without requiring NH3
sensor through cross-sensitivity correlation between NOx and NH3. A method based on two
NOx sensors with different temperature dependent NH3 cross-sensitivity characteristics at the
26
SCR outlet was proposed to estimate also the SCR-out NH3 concentration (Chen and Wang
2015).
Figure 9. Schematic of NH3 sensor based on non-equilibrium electrochemical sensing principle (Moos et al. 2002)
Application of using NH3 sensors have also been widely used for measure NH3
concentration and provided benefits in developing robust SCR feedback control. The developed
control strategies have also been used in conjunction with model-based approach in estimating
NH3 storage capacity of the SCR as such storage characteristics is not directly measurable but
including it in models benefits in state-estimation of the SCR under time and temperature
dependent non-linear dynamics of the system. There have been only limited commercially
developed NH3 sensors in market, operation based on a non-equilibrium electrochemical
sensing principle where the sensing element used co-fired zirconia and alumina layers with NH3
sensing, a Pt reference electrode and an integrated heater circuit (Moos et al. 2002). Figure 9
presents a schematic of a commercially available NH3 sensor. Typically, the NH3 sensors are
used post-SCR to detect any ammonia leak, and are designed to detect the range of ammonia in
the exhaust. NH3 sensor designed by Delphi, has a measurement range of 0 to 100ppm with a
tolerance of ±5ppm NH3 at 10 ppm range (D Wang et al. 2007). However, these sensors are
observed to be relatively insensitive to interference from nitrogen compounds and along with
HC and CO but are reported to sensitive to interference from water and oxygen (D Wang et al.
2007). According to the study conducted by Wang et. al with the Delphi NH3 sensors, the water
and oxygen tend to have inverse interference effect to the NH3 sensor. But at narrow range of
water and oxygen in the exhaust, self-compensation effect is possible and is also possible with
model based correction using air-fuel ratio and air humidity information. Ongoing work is being
27
done for NH3 sensors for real-world applications and alternative technologies are being looked
at by the industry and different research institutes.
2.9 Summary
When compared between diesel versus natural gas fueled vehicles in heavy-duty
transportation application, diesel vehicles significantly dominates the market share (Delgado
and Muncrief 2015). However, future demands in low fossil fuel dependent and low emission
emitter vehicles are causing a trending technology shift, consequently resulting in popularity in
the alternative fueled natural gas vehicles (Stanton, 2013). From a 2016 statistics data reported
by the NGV Global, the natural gas powers roughly 24.4 million vehicles worldwide and
projected to reach more than 30 million by the year 2024 (NGV Global 2017). Based on
Stanton’s review on development of efficient and clean engines to meet future GHG norms, an
estimated 11.9% average annual growth rate is projected between 2011 and 2040 in the US. The
growth in the use of heavy-duty natural gas vehicles in the US has been seen largely in centrally
fueled fleets attributed by increasing domestic fuel availability and fueling stations along with
increasing vehicle procurement incentives provided at different state and federal levels. Natural
gas vehicles equipped with TWC system have shown to produce elevated levels of precursor
ammonia emission. Gas-phase ammonia was considered to be a critical atmospheric pollutant
contributing to the formation of airborne particulate matter (Renner and Wolke, 2008),
threatening the ambient air quality and predominately effecting both human health (Krupa,
2003) and the ecosystem (Sun et al., 2016). The current regulation for heavy-duty engines
excludes ammonia emission as a regulated criterion, however for the reasons discussed above
there is critical need for ammonia reduction from heavy-duty stoichiometric natural gas vehicles.
The literature survey was conducted to identify a viable pathway in mitigating tailpipe
NH3 emission produced in stoichiometric natural gas engine. Application of SCR technologies
were reviewed in modern-heavy-duty diesel applications along with gasoline fueled engines to
increase fuel benefits from lean-burn operation. However, exhaust temperature becomes a key
challenge in maintaining overall performance of the SCR depending on the type of catalyst used.
As catalyst formulations observed to be a key factor in NOx and NH3 performance over
different temperature range, the study reviewed the three-major catalyst formulations used in
SCRs. Furthermore, the study considered reviewing different traditional and AI based SCR
control techniques which can be potentially utilized in developing active regeneration strategies
28
to lower NOx and NH3. Finally, the study reviewed NOx and NH3 sensors from both, a physical
sensor and estimator (virtual sensor) standpoint which are used for controlling the proposed
passive-ARC system activity.
29
CHAPTER 3 Experimental Setup
This chapter provides the general overview of the experimental setups, instrumentation
and specifications used during the study. All measurement of the study presented herein were
conducted at the Engine and Emissions Research Laboratory (EERL) at West Virginia
University. The EERL is a part of West Virginia University’s Center for Alternative Fuels,
Engines and Emissions (CAFEE) and the transient engine dynamometer test cell is designed
and operated according to recommendations set forth by Code of Federal Regulations (CFR),
Title 40, Part 1065 (USEPA). It is to be noted that different sections of the experiments, herein,
were conducted at different time due to unavailability in laboratory space and instruments
required for the study. The following sections outlines details in experimental setup and
procedure in order to meet the study’s objectives.
3.1 Test engine specification
The after-treatment system analysis conducted using a stoichiometric natural gas engine
on a heavy-duty engine dynamometer under controlled laboratory conditions. The study
procured a commercial natural gas engine with its stocked after-treatment configuration as
provided in Table 1 below.
Table 1. Test Engine and After-treatment Specification
This section summarizes the results obtained from utilizing ANN technique to estimate
post-TWC NH3 concentration using different engine parameters as training inputs. For the
input data set, two combined transient FTP tests were used to train the model initially with
seven different inputs and the measured NH3 concentration as the network output. The data
set consisted of 23,980 data points which is equivalent to 23,980 seconds of the transient cycle
measured. Figure 60 presents the input profile for all seven inputs used in training and evaluating
the AN-N model.
Figure 60. Transient FTP profile of the seven input variables
97
The selected network was trained with different network properties and resulted were
evaluated based on the estimated performance of the output parameter, i.e. NH3 concertation
after the TWC. Table 11 and Table 12, presents results obtained from training the input-output
network using two different training functions (Levenberg-Marquardt and Bayesian
Regularization). The tables also include using these training function with different number of
neurons. The results clearly show that with increasing neurons, we get better estimation of the
output, provided by the R-squared number (indicates how the close the data fitted to a linear
regression line) and Mean Square Error (MSE) number (indicates the quality of the estimation).
However, with computational time to train the network increases due to added neurons through
the network. It is also known that increasing the neurons increases the possibility of over
training and over fitting the dataset, and to avoid certain circumstances, the errors were
compared between the training, validation and test performances during each training iterations.
Further training would stop if six consecutive errors would increase between the trained and
validated errors. When comparing the performance between the two training functions,
Bayesian Regularization provide slightly better performance, especially at lower number of
neurons. The computational time for this function was significantly higher than Levenberg-
Marquardt.
Table 11. Comparison of performance using different number of neurons and Levenberg-Marquardt training function
Number of Neurons 10 20 30 40
R-squared 0.799 0.850 0.899 0.916
Overall MSE 578.4 422.2 278.3 235.2
Number of Iterations 50 68 134 109
Training Time [sec] 2.8 7.9 32.5 36.9
Table 12. Comparison of performance using different number of neurons and Bayesian Regularization training function
Number of Neurons 10 20 30 40
R-squared 0.844 0.889 0.902 0.916
Overall MSE 432.6 301.0 272.9 231.4
Number of Iterations 300 300 300 300
Training Time [sec] 16.0 40.7 64.5 104.5
98
Figure 61 and Figure 62, shows the estimated continuous traces of the NH3
concentration for Levenberg-Marquardt and Bayesian Regularization training functions,
respectively. The figures also provide the residual charts for visualization differences between
the actual and the measured. Examining the continuous traces, we see that the estimated NH3
concentration follows well with the actual measured curves (shown by the black line), but with
observed noise. The trained network was able estimate better for the first few peaks seen from
the profiles, especially when using 40 number of neurons (as depicted from the residual plots).
Figure 61. Results for measured versus estimated NH3 concentration using number of neurons and Levenberg-Marquardt training function
99
Figure 62. Comparison of measured and estimated NH3 concentration using different number of neurons and Bayesian Regularization training function
The study also evaluated performance of ANN using additional model inputs. The first
derivatives of the pre-and-post TWC temperatures were calculated as using as inputs in the
training a network with Bayesian Regularization and the four-same number of neurons as used
earlier for the evaluation. The study uses these inputs in order to identify and estimate any
additional correlation that would provide the formation of NH3 from in TWC system. Table 13
provides the performance with adding the two temperature derivatives as input to training of
the model. The result indicates slight improvement in the R-squared and MSE compared to
previous values. Adding the additional inputs resulted in taking more time in training the
network.
100
Table 13. Comparison of performance for four different number of neurons with Bayesian Regularization training function and additional two first derivative input
parameters
Number of Neurons 10 20 30 40
R-squared 0.858 0.896 0.919 0.921
Overall MSE 399.1 276.3 222.7 221.9
Number of Iterations 300 300 300 300
Training Time [sec] 19.8 47.8 88.4 133.9
The measured NH3 concertation were observed to be smoother, with sharp rises and
slower falls. The sudden rise in NH3 peaks follows the immediate rise in power causing higher
exhaust flowrate through the TWC during the cycle. On the other hand, the longer response in
the NH3 drop could potentially be from the thermal and chemical inertia accompanied by the
low flowrate at such conditions. The study further investigated data smoothening or filtering
methods to see if certain distinct response behavior could be captured and at the same time
minimize data fluctuation at lower power demand conditions. A filtering method known as
exponential weighted moving average (EWMA) was evaluated for the obtained results. EWMA
have been commonly used in statistical sensor estimation cases, one of its few applications in
the area of on-board diagnostics for vehicle emission control systems. Unlike, other simple
moving average which gives equal weighing on a period of data size provide as a time window
by the user, EWMA on the other hand, applies weighting factors which decrease exponentially
within the specified filtering period (FP). The filter was applied to the estimated dataset to
examine if this potentially reduces the lag by applying higher weights to the estimated peaks and
lower weights to the slow response of the trace. The filter performance for the best estimated
data set were evaluated based on the improvement in the MSE value. Figure 63 provides the
MSE results for using EWMA filter with different averaging period, and it is observed that for
a period of six data points resulted in the lowest MSE value for the given data set. Figure 64,
shows the comparison of the estimated NH3 concentration using between the filtered versus
the unfiltered results using EWMA filtering method with period 6. Based on the residual curves,
we do notice slight improvement in noise reduction.
101
Figure 63: Comparison of MSE using EWMA filter with different filtering periods
Figure 64. Comparison of measured and estimated NH3 concertation applying the EWMA filter (Filter Period = 6)
216
218
220
222
224
226
228
230
0 2 4 6 8 10 12 14
MS
E
Filter Period [Data Points]
102
Figure 65, shows the final estimated NH3 concentration trace using the best network
properties obtained from the above parametric analysis. The following estimation resulted in
having MSE equals to 218 and with a R-squared value of 0.93. It shows that, ANN method
using different engine and after-treatment parameters as in input factors can be used to capture
the formation of NH3 through the catalyst with some accuracy.
Figure 65. Comparison of measured and estimated NH3 concentration; (Number of Inputs = 9, Number of Neurons = 40, Fitting Function = Bayesian Regularization,
EWMA with Period = 6)
The primary objective of this specific work was to understand if precursor NH3 can be
accurately predicted from the TWC using engine parameters, especially under transient
conditions and then used the estimated value (instead of sensor based value) into the passive-
SCR model as one of the input parameter. The dynamics of adsorption and desorption behavior
is significantly influenced by the amount of NH3 entering and being stored on the surface of
the SCR catalyst. As in terms of quantity, the NH3 entering the SCR can be estimated and
evaluated in terms of moles per catalyst volume. The obtained estimated NH3 concertation from
the ANN is converted into estimated number of moles of NH3 per SCR catalyst volume
(moles/m3).
Figure 66 shows the cumulative profile of the estimated moles of NH3 per catalyst
volume over the duty-cycle. This representation provides the estimation of the available NH3
that is entering the SCR and can be stored by the catalyst. From basic visual inspection, the
estimated profile closely matches with the value obtained from actual measurement. The
103
difference in the number of moles at a given movement into the cycle is provide by Figure 67,
with a maximum value of approximately 0.28 moles/m3 at 943 seconds into the data cycle. For
the given cycle, the total moles of NH3 was calculated to be at 15.45 moles/m3 and 15.65
moles/m3, using actual measurement and AN-N estimated values, respectively.
Figure 66. Comparison of number of moles of NH3 per catalyst volume (moles/m3) calculated from actual versus estimated NH3 concentration.
Figure 67. Difference between actual and estimated number of moles of NH3 per catalyst volume
104
The best trained network obtained from the above analysis where then used to validate
on a different data set. Two similar FTP tests were used for the validation process and the
estimated NH3 concentration using the pre-trained network are provided by Figure 68 and
Figure 70. The first data set (FTP Data Set 1) validation resulted in MSE of 330.9 and r-squared
of 0.7485, and the second set (FPT Data Set 2) resulted in MSE of 859.02 and r-squared of
0.7003. The high NH3 concentration peaks observed did vary between the two FTP cycles, and
the network was able to define the higher peak but not the shorter peaks. The estimated profiles
also show high data fluctuation but overall followed the trend of the measured trace (shown by
the red curve). The adequacy of an AN-N trained model depend upon how well it validates a
diverse set of system behavior in predicting certain response. The study does realize the
shortcoming of models’ limitation along with not having appropriate parameters that influence
the dynamics of the TWC system in producing NH3 at various levels.
Figure 68. Comparison of actual versus estimated NH3 concertation using validation FTP Data Set 1
105
Figure 69 Comparison of actual versus estimated NH3 concertation using validation FTP Data Set 2
Figure 70 and Figure 71, represents the cumulative profile of the actual versus estimated
moles of NH3 per catalyst volume over the duty-cycle. From the observation, the values using
estimated concentration tend to over-predict the moles of available ammonia with a difference
of 24% for Set 1 and 18.8% for the Set 2 at the end of the cycle.
Figure 70. Comparison of actual versus estimated number of moles of NH3 per catalyst volume (moles/m3) for FTP Data Set 1
106
Figure 71. Comparison of actual versus estimated number of moles of NH3 per catalyst volume (moles/m3) for FTP Data Set 2
Considering the results obtained from the validation sets, the ammonia availability
model can be further optimized by reducing variation in the NH3 concentration estimation. The
estimated results from FTP Data Set 2 was further processed using EWMA filtering with
different number of filtering periods. Although, this approach might not be practical in
observing NH3 availibiltiy at a shorter resolution in the cycle but can be utilized in larger time-
scale observation methods.
Figure 72, shows results from applying EWMA filtering with different period numbers.
There wasn’t any notable change seen in NH3 availability profile when using filtering with 6
seconds and 15 seconds periods but better improvement when using a 30 second period. This
can also be observed from provided Figure 73, obtained from calculating the difference between
the actual and the estimated profiles. The number of moles from using 30 second settings
estimation under-predicts during first half of the cycle (due to smoothening of the NH3 high
peaks) and over-predicts for the other half of the cycle. This results in final estimated value of
6.91 moles/m3, i.e. 10% higher than actual measured 6.28 moles/m3.
107
Figure 72. Comparison of actual versus estimated number of moles of NH3 per catalyst volume (moles/m3) periods for FTP Data Set 2 using three different EWMA
filtering
Figure 73. Difference between actual versus estimated number of moles of NH3 per catalyst volume (moles/m3) periods for FTP Data Set 2 using three different EWMA
filtering
108
5.6 SCR model calibrated to experimental data
Parameters of the SCR model were identified by solving the system of reaction using
ODE solver and then calibrating the model against the experimental obtained data. The model
calibration was aimed at matching the solved gaseous concentration to the outlet of the SCR
using cost function, where the parameters are identified by minimaxing the least-square errors.
The developed model results with the obtain reaction parameters was validated with the steady
state mode 1 data.
Table 14 shows the reaction rate parameters identifies in the SCR state model based on
the experimental data. The values obtained here closely matches with the values seen in similar
literatures (Song 2013; Clark et al. 2009). The ammonia storage capacity (Ω) was assumed
constant at 100 moles/m3 in the calculation. The initial value for the ammonia storage ratio was
assumed to be at 0.15.
Table 14. Reaction rate identified parameters in the three state SCR model Parameter Number
Parameter Optimized
Values Unit
1 kreduction 3.63E+06 m3/mol-s
2 Ereduction 65.2 kJ/mol
3 kadsorption 5.48E+06 m3/mol-s
4 Eadsorption 47.6 kJ/mol
5 kdesorption 3.36E+06 1/2s
6 Edesorption 131 kJ/mol
Figure 74 displays comparison of model predicted NOx values with the measured
concentration using FTIR pre-and-post SCR. It can be seen the simulated NOx after the SCR
matches well before the 40th second but then overpredicts for the rest of the part. The initial
value of the ammonia storage ratio plays a key role due to the difference of the initial guess of
the ammonia storage for the model and the true storage ratio inside the SCR catalyst. This can
also be observed from the simulated ammonia storage ratio curve (shown by the dashed green
line in the figure) where ammonia storage ratio rapidly drops to zero indicating no NH3 stored
for NOx reduction reaction. Additionally, the reaction rates of the SCR reactions are highly
dependent on the NH3 storage capacity and changed the model outcome since the value
participates in all three state reactions. The simulation was rerun for a higher initial ammonia
storage value (0.7) using the same reaction parameters and comparison is shown inn Figure
109
75. The result indicates higher ammonia storage ratio till the 250 second with closer NOx
prediction than compared to the previous results.
Figure 74. Comparison of post-SCR NOx, post-SCR NH3 and NH3 storage ratio predicted by 3-state SCR model storage ratio for steady-state Mode 1 (baseline
operation); Initial ammonia storage ratio = 0.15
Figure 75. Comparison of post-SCR NOx, post-SCR NH3 and NH3 storage ratio predicted by 3-state SCR model for steady-state Mode 1 (baseline operation); Initial
ammonia storage ratio = 0.7;
110
Figure 76 provides results simulated from considering the NH3 oxidation mechanism
and adding three more parameters (E and k for oxidation, and Ω) as in the identification process.
The initial NH3 storage ratio was set at 0.15 for this simulation. The comparison of the simulated
NOx profile and the measured show good agreement till 150th second and then tend to
underestimate into rest of the cycle duration, except between (305-420) seconds. And, these
disparities could be due to NO2 formation that was seen in the actual measurement. The study
did not include NO2 formation mechanism in the SCR model.
Figure 76. Comparison of post-SCR NOx, post-SCR NH3 and NH3 storage ratio predicted by 3-state SCR model for steady-state Mode 1 (baseline operation); Initial
ammonia storage ratio = 0.15; Ω as identified parameter
Table 15 summarizes the identified values of 9 model parameters using GA’s
optimization tool. Ones again the obtained parameter correlates well with the ones provided in
literatures.
111
Table 15. Reaction rate identified parameters in the three state SCR model Parameter Number
Parameter Optimized Values Units
1 kreduction 2.84E+05 m3/mol-s
2 Ereduction 70.92 kJ/mol
3 kadsorption 5.45E+06 m3/mol-s
4 Eadsorption 46.6 kJ/mol
5 kdesorption 3.33E+09 1/s
6 Edesorption 125.1 kJ/mol
7 koxidation 6.57E+07 1/s
8 Eoxidation 129.8 kJ/mol
9 Ω 76.63 moles/m3
112
CHAPTER 6 Conclusions
The study presents evaluation of a pathway in mitigating secondary NH3 emission
produced by the TWC during stoichiometric operation of natural gas engines. The study
approaches the development of a passive ammonia reduction system by conducting experiments
on a heavy-duty natural gas engine and utilizing selective catalytic reduction units typically used
in diesel engines. The MY08 ISL-G Cummins engine equipped with the TWC after-treatment
system was evaluated for baseline performance and emission characteristics and tested over
transient and steady-state operating conditions. The study further evaluates an engine-based
control strategy to minimize both NH3 and NOx control over the TWC+SCR configuration.
The following sections highlights the major findings, provides recommendations, and
contextualizes studies contribution to relevant areas of interest.
6.1 Experimental Findings
The results obtained from the baseline evaluation indicated elevated levels of tailpipe
NH3 emission, with an average concentration of 37 ppm and 61 ppm for the FTP and WHTC
transient cycles, respectively. The high peaks of NH3 observed were caused by isolated rich AFR
conditions due to aggressive power demands within the tested cycles. Additionally, exhaust
temperatures were a crucial factor in NOx reduction and NH3 formation, where improved NOx
conversions were observed at higher TWC inlet temperatures but also resulted in increased NH3
formation over the TWC.
Correspondingly, the results obtained from evaluating five different formulated SCRs
showed that SCR 3 (Fe-zeolite with 400 cpsi) and SCR 4 (Cu-zeolite) absorbed above 90% of
the TWC’s generated NH3 below 375°C of averaged SCR temperatures. However, the Fe-zeolite
performed with 60-85% efficiency in NOX conversion above 300°C, while the Cu-zeolite
performed moderately between (40-65%) at all temperature ranges. Performance-based on NOx
conversion efficiency and storage capacity at both low and higher temperature ranges, observed
under dynamic natural gas engine operations, the study considered the Cu-zeolite SCR for an
adsorption and desorption study over eight steady-state modes. From these steady-state mode
experiments, it was observed that NH3 storage ratio and SCR catalyst temperature were the two
main factors in initiating desorption. Furthermore, from switching the engine to lean-burn
operation, the high NOx activity after the TWC could regenerate the stored NH3, however, the
113
levels in NH3 regeneration and NOx conversion depended upon different lean-ON duration.
The study compared different lean-ON periods evaluated for a medium speed/load operation
mode (Mode 6). Lean-ON duration between (2.5-3.5) seconds resulted in low moderate NOx
slip after the TWC, improved NOx conversion by the SCR and initiated NH3 regeneration
process. The study also evaluated fuel consumption differences, and the results indicated on
average a 2.1% brake specific fuel consumption improvement for the lean-ON operation when
compared to baseline stoichiometric operation over the entire 8 steady-state modes.
The study further investigated model-based estimator methods from a stand-point of
control-oriented passive-SCR regeneration approach. Results obtained from Model 1 indicated
that the ANN fitting method estimated accumulated pre-SCR NH3 in moles per SCR volume
to be 1.3% higher than the actual measured when using 9 different inputs form two combined
FTP data sets for training. However, during the validation process, the ANN estimated
significantly higher differences of 25.6% and 16.8% for two different individual FTP data sets.
The study further evaluated using an EWMA filter with different filtering windows, and showed
that the accumulation of NH3 at the SCR inlet could be estimated more accurately at a larger
time scale.
On the other hand, results obtained from Model 2 adequately estimated post-SCR NOx
and NH3 adsorption for lower speed/load steady-state modes but the model was not able to
estimate NH3 desorption rise at higher steady-state modes. The differences observed in post-
SCR NOx and NH3 could be attributed to assuming an initial NH3 storage ratio that could have
been different from the actual NH3 storage of the SCR in the beginning of each steady-state
test. Additionally, the ammonia storage capacity, which have shown to vary with SCR surface
temperature from other related studies, was kept constant during the parameter identification
process.
6.2 Recommendations
The current study was limited by the SCR design parameters, and the performance of
the SCR in NH3 storage and NOx reduction characteristics could be improved with specifically
designed catalyst to meet the natural gas engine operation’s ranges. In addition, the study
observed NO2 being formed over the Cu-zeolite SCR catalyst with NO2/NO ratios as close to
1:1 under certain conditions. As a result, a two stage SCR system could potentially allow
improvements that considers the fast-SCR reactions.
114
Beside from the adequate SCR system downstream of the TWC, the engine based
control strategy that was developed using fuzzy logic method, can be improved in an
experimental study using a H-I-L setup to fine-tune possible input-output parameters. For
example, the size of membership functions and the inference rule matrix could be increased for
better regeneration status control. Along with the size, other shapes in defining the membership
functions could also be considered.
Ammonia storage ratio has shown to be a good indicator in estimating the state of the
SCR, and utilizing this as one of the fuzzy input parameters would allow wider range of SCR
regeneration control. For example, the regen status could be switched to ON mode by
monitoring the ammonia storage ratio which indicates saturation level of the SCR catalyst over
a duty cycle, even when there is no NH3 or NOx being slipped after the SCR. This would allow
improved fuel consumptions due to more frequent lean-ON operations.
The study was limited with engine and after-treatment parameters that were used in the
ANN Model-1. However, the estimation could be improved by conducting further analysis with
other influential factors that links to formation of NH3 over the TWC. For example, using
engine parameters such as actual measured air fuel ratio, mass rate of EGR, in-cylinder
combustion parameters, and more. Using additional emission sensors at the inlet of the TWC
and instrumenting mid-brick temperatures would potentially help in improving the estimation
accuracy but could lead to adding hardware cost and increasing computational time.
On the other hand, Model-2 could also be improved by assuming more higher order
reaction processes and adding potential SCR mechanisms that were not considered in this study.
Although, the study used only the inlet SCR temperatures, using catalyst temperature models
through the catalyst could potentially help in determining desorption characteristics as observed
during the transient and steady-state tests.
6.3 Contributions
This dissertation contributes to the area of alternative fueled vehicles and their emission
reduction challenges. Few researchers have addressed the concerns over high emission levels of
ammonia observed from stoichiometric operated natural gas vehicles equipped with a TWC
system, and previous work primarily focused on gasoline fueled engines only. As a preliminary
part of this work, the study investigated a heavy-duty natural gas engine with a comprehensive
evaluation of ammonia formation over the three-way catalyst in relation to dynamic engine
115
operating parameters. The results obtained in this study pose a critical need to monitor NH3
emission from stoichiometric natural gas vehicles which in the near future could be regulated at
tailpipe levels as seen in diesel vehicles with urea-SCR technology.
In addition, the passive ammonia reduction pathway utilizing an SCR system that was
evaluated in this study could also lead to meeting the low-NOx emission standards. The USEPA
has initiated rulemaking for low-NOx emission standards, and if in force, the new standard
would require all new heavy-duty vehicles to meet 0.02 g/bhp-hr NOx regulation starting from
the year 2024. This would involve vehicle manufacturers to reduce NOx emission by almost
90% from the current standards, and would require significant after-treatment development
strategies.
As a final remark, this study specifically introduces techniques in operating dedicated
natural gas engines at or near stoichiometric point to more lean-burn combustion regimes.
Engines deigned for more lean-burn operation can make use of higher compression ratios, and
thus provide improved performance and more efficient fuel use than those in conventional
spark ignited engines. The engine-based air-fuel ratio dithering strategy using a fuzzy-logic
controller was designed to lower both NH3 and NOx emissions, however, has also shown to
provide fuel consumption improvements. The fuzzy-logic controller which needs only two
sensor values as inputs can further be expanded into using ammonia storage ratios as one of the
linguistic variables. In addition, with the two-regeneration outputs, short-dithering and long-
dithering modes, would further expand the operation of lean-burn activity to a much larger
scale. This would be a promising pathway for off-road and stationary dedicated natural gas
engines since the air-fuel ratio could be precisely controlled over steady-state duty cycles, also
from a model-based ammonia storage and control development standpoint.
116
REFERENCES
Barbier, Jacques, and Daniel Duprez. 1994. “Steam Effects in Three-Way Catalysis.” Applied Catalysis B: Environmental 4 (2): 105–40. doi:http://dx.doi.org/10.1016/0926-3373(94)80046-4.
Battye Viney P., Roelle, Paul A., William; Aneja. 2003. “Evaluation and Improvement of Ammonia Emissions Inventories.” Atmospheric Environment 37 (2003): 3873–83.
Blanco-Rodriguez, Dr-Ing David. 2014. Modelling and Observation of Exhaust Gas Concentrations for Diesel Engine Control. doi:10.1007/978-3-319-06737-7.
Bosch, Hans, and Frans Janssen. 1988. “Catalytic Reduction of Nitrogen Oxides.” Catalysis Today 2 (4): V.
Cavataio, Giovanni, Hung-wen Jen, James R Warner, James W Girard, Jeong Y Kim, and Christine K Lambert. 2008. “Enhanced Durability of a Cu / Zeolite Based SCR Catalyst.” SAE International Journal of Fuels and Lubricants 1 (1): 477–87. doi:10.4271/2008-01-1025.
Cesare, Matteo De, and Federico Covassin. 2011. “Neural Network Based Models for Virtual NOx Sensing of Compression Ignition Engines.” SAE International. doi:10.4271/2011-24-0157.
CFR40/1065/SubB. 2017. “§1065.140 Dilution for Gaseous and PM Constituents.” Accessed November 21. https://www.ecfr.gov/.
CFR40/1065/SubD. 2017. “Subpart D — Calibrations and Verifications.” Accessed November 21. https://www.ecfr.gov/.
Chatterjee, Daniel, Thomas Burkhardt, Brigitte Bandl-Konrad, Tillmann Braun, Enrico Tronconi, Isabella Nova, and Cristian Ciardelli. 2005. “Numerical Simulation of Ammonia SCR-Catalytic Converters : Model Development and Application.” SAE Transactions 114 (4): 437–48. doi:10.4271/2005-01-0965.
Chavannavar, Praveen. 2014. “Development and Implementation of a Mapless, Model Based SCR Control System.” SAE International. doi:10.4271/2014-01-9050.
Chen, Pingen, and Junmin Wang. 2014. “Sliding-Mode Observers for Urea Selective Catalytic Reduction System State Estimations Based on Nitrogen Oxide Sensor Measurements.” Proceedings of the Institution of Mechanical Engineers, Part D: Journal of Automobile Engineering 229 (7): 954407014548052. doi:10.1177/0954407014548052.
Chen, Pingen, and Junmin Wang. 2015. “A Novel Cost-Effective Robust Approach for Selective Catalytic Reduction State Estimations Using Dual Nitrogen Oxide Sensors.” Proceedings of the Institution of Mechanical Engineers, Part D: Journal of Automobile Engineering 229 (1): 83–96. doi:10.1177/0954407014526570.
Chi, John N. 2009. “Control Challenges for Optimal NOx Conversion Efficiency from SCR Aftertreatment Systems.” SAE International. doi:10.4271/2009-01-0905.
Ciardelli, Cristian, Isabella Nova, Enrico Tronconi, Brigitte Konrad, Daniel Chatterjee, Karlheinz Ecke, and Michel Weibel. 2004. “SCR-DeNOx for Diesel Engine Exhaust Aftertreatment: Unsteady-State Kinetic Study and Monolith Reactor Modelling.” Chemical Engineering Science 59 (22–23): 5301–9. doi:10.1016/j.ces.2004.07.016.
Clark, Nigel, D Ph, Gregory Thompson, D Ph, Mridul Gautam, D Ph, Benjamin Shade, et al. 2009. “Optimization of a Retrofit Urea-SCR System Clinton R . Bedick Dissertation Submitted to the College of Engineering and Mineral Resources at West Virginia University in Partial Fulfillment of
117
the Requirements for the Degree of Doctor of Philosophy in Mecha.”
Colombo, Massimo, Grigorios Koltsakis, Isabella Nova, and Enrico Tronconi. 2012. “Modelling the Ammonia Adsorption–desorption Process over an Fe–zeolite Catalyst for SCR Automotive Applications.” Catalysis Today 188 (1): 42–52. doi:http://dx.doi.org/10.1016/j.cattod.2011.09.002.
Colombo, Massimo, Isabella Nova, and Enrico Tronconi. 2010. “A Comparative Study of the NH3-SCR Reactions over a Cu-Zeolite and a Fe-Zeolite Catalyst.” Catalysis Today 151 (3–4): 223–30. doi:http://dx.doi.org/10.1016/j.cattod.2010.01.010.
Defoort, M, D Olsen, and B Willson. 2004. “The Effect of Air-Fuel Ratio Control Strategies on Nitrogen Compound Formation in Three-Way Catalysts.” International Journal of Engine Research 5 (1): 115–22. doi:10.1243/146808704772914291.
Delgado, Oscar, and Rachel Muncrief. 2015. “Assessment of Heavy-Duty Natural Gas Vehicle Emissions: Implications and Policy Recommendations.” http://www.theicct.org/sites/default/files/publications/ICCT_NG-HDV-emissions-assessmnt_20150730.pdf.
Devarakonda, M, J Johnson, and G Parker. 2012. “NOx Control Systems and Methods for Controlling NOx Emissions” US20120260.
Devarakonda, M, G Parker, and J H Johnson. 2008. “Adequacy of Reduced Order Models for Model-Based Control in a Urea-SCR Aftertreatment System.” SAE Technical Paper Series 2008 (724): 776–90. doi:10.4271/2008-01-0617.
Eijnden, Edwin v d, Robert Cloudt, Frank Willems, and Peter v d Heijden. 2009. “Automated Model Fit Tool for SCR Control and OBD Development.” SAE International. doi:10.4271/2009-01-1285.
Figura, Jiri, Dejan Kihas, Jaroslav Pekar, Michael Uchanski, Nassim Khaled, and Sriram Srinivasan. 2016. “Automotive Selective Catalytic Reduction System Model-Based Estimators for On-ECU Implementation: A Brief Overview.” SAE International. doi:10.4271/2016-01-0972.
Franco S. Francisco; German, John; Mock, Peter, Vicente; Posada. 2014. “Real-World Exhaust Emissions from Modern Diesel Cars Part 1: Aggregated Results.” The International Council on Clean Transportation.
Frobert, Arnaud, Yann Creff, Stéphane Raux, Christophe Charial, Arnaud Audouin, and Laurent Gagnepain. 2009. “SCR for Passenger Car: The Ammonia-Storage Issue on a Fe-ZSM5 Catalyst.” SAE International. doi:10.4271/2009-01-1929.
González-velasco, Juan R, Juan A Botas, Raquel Ferret, M Pilar González-marcos, Jean-louis Marc, and Miguel A Gutiérrez-ortiz. 2000. “Thermal Aging of Pd / Pt / Rh Automotive Catalysts under a Cycled Oxidizing – Reducing Environment” 59: 395–402.
Grossale, Antonio, Isabella Nova, and Enrico Tronconi. 2008. “Study of a Fe-Zeolite-Based System as NH3-SCR Catalyst for Diesel Exhaust Aftertreatment.” Catalysis Today 136 (1–2): 18–27. doi:10.1016/j.cattod.2007.10.117.
Guralp, Orgun, Gongshin Qi, Wei Li, and Paul Najt. 2011. “Experimental Study of NO X Reduction by Passive Ammonia-SCR for Stoichiometric SIDI Engines.” Society of Automotive Engineers (SAE). SAE International. doi:10.4271/2011-01-0307.
Haga, Hisao, Hiroyuki Kojima, Naoko Fukushi, Naoki Ohya, and Takuya Mito. 2015. “Optimized NH3 Storage Control for Next Generation Urea-SCR System.” SAE International. doi:10.4271/2015-01-1024.
118
Herman, Andrew, Ming-Cheng Wu, David Cabush, and Mark Shost. 2009. “Model Based Control of SCR Dosing and OBD Strategies with Feedback from NH3 Sensors.” SAE International. doi:10.4271/2009-01-0911.
Hsieh, M.-F., and J Wang. 2011. “Sliding-Mode Observer for Urea-Selective Catalytic Reduction (SCR) Mid-Catalyst Ammonia Concentration Estimation.” International Journal of Automotive Technology 12 (3): 321. doi:10.1007/s12239-011-0038-4.
Hsieh, Ming Feng, and Junmin Wang. 2010. “An Extended Kalman Filter for Ammonia Coverage Ratio and Capacity Estimations in the Application of Diesel Engine SCR Control and Onboard Diagnosis.” In Proceedings of the 2010 American Control Conference, 5874–79. doi:10.1109/ACC.2010.5530516.
Hsieh, Ming Feng, and Junmin Wang. 2011. “Development and Experimental Studies of a Control-Oriented SCR Model for a Two-Catalyst Urea-SCR System.” Control Engineering Practice 19 (4). Elsevier: 409–22. doi:10.1016/j.conengprac.2011.01.004.
Huai, T, T D Durbin, J W Miller, J T Pisano, C G Sauer, S H Rhee, and J M Norbeck. 2003. “Investigation of NH3 Emissions from New Technology Vehicles as a Function of Vehicle Operating Conditions.” Environ Sci Technol 37 (21): 4841–47.
I. Nova, M Colombo and E Tronconi. 2011. “Kinetic Modeling of Dynamic Aspects of the Standard NH3-SCR Reaction Over V2O5-WO3_TiO2 and Fe-Zeolite Commercial Catalysts for the Aftertreatment of Diesel Engines Exhausts.” Oil & Gas Science and Technology 66 (4): 681–91. doi:10.2516/ogst/2011132.
IARC, International Agency for Research on Cancer. 2013. “IARC: Outdoor Air Pollution a Leading Environmental Cause of Cancer Deaths.” World Health Organization.
Jääskeläinen, Hannu, and W Addy Majewski. 2016. “Urea Dosing Control,” 1–20.
Jinbiao, Ning, and Yan Fengjun. 2015. “Nonlinear Disturbance Observer Design for Estimation of Ammonia Storage Ratio in Selected Catalytic Reduction Systems.” In 2015 American Control Conference (ACC), 495–500. doi:10.1109/ACC.2015.7170784.
Johnson, Timothy V. 2009. “Diesel Emission Control in Review.” In SAE. Vol. 2012-01–03.
Kamasamudram, Krishna, Neal Currier, Tamas Szailer, and Aleksey Yezerets. 2010. “Why Cu- and Fe-Zeolite SCR Catalysts Behave Differently At Low Temperatures.” SAE International. doi:10.4271/2010-01-1182.
Karavalakis, Georgios, Maryam Hajbabaei, Yu Jiang, Jiacheng Yang, Kent C. Johnson, David R. Cocker, and Thomas D. Durbin. 2016. “Regulated, Greenhouse Gas, and Particulate Emissions from Lean-Burn and Stoichiometric Natural Gas Heavy-Duty Vehicles on Different Fuel Compositions.” Fuel 175. Elsevier Ltd: 146–56. doi:10.1016/j.fuel.2016.02.034.
Keuper, Andreas, Hiie-Mai Ida Unger, Jia Huang, Harald Bressler, and Wolfgang Albrecht. 2011. “Investigations to Achieve Highest Efficiencies in Exhaust Gas After-Treatment for Commercial Vehicles Using an SCR System.” SAE 2011-01–22.
Kim, Chang Hwan, Kevin Perry, Michael Viola, Wei Li, and Kushal Narayanaswamy. 2011. “Three-Way Catalyst Design for Urealess Passive Ammonia SCR: Lean-Burn SIDI Aftertreatment System.” SAE Technical Paper. SAE International. doi:10.4271/2011-01-0306.
Koebel, Manfred, Martin Elsener, and Giuseppe Madia. 2001. “Recent Advances in the Development
119
of Urea-SCR for Automotive Applications.” SAE 2001-01–36.
Kröcher, O. 2007. “Chapter 9 Aspects of Catalyst Development for Mobile Urea-SCR Systems - From Vanadia-Titania Catalysts to Metal-Exchanged Zeolites.” Studies in Surface Science and Catalysis 171 (January). Elsevier: 261–89. doi:10.1016/S0167-2991(07)80210-2.
Krupa, S V. 2003. “Effects of Atmospheric Ammonia (NH3) on Terrestrial Vegetation: A Review.” Environ Pollut 124 (2): 179–221.
Li, Wei, Kevin L. Perry, Kushal Narayanaswamy, Chang Hwan Kim, and Paul Najt. 2010. “Passive Ammonia SCR System for Lean-Burn SIDI Engines.” SAE International Journal of Fuels and Lubricants 3 (1). SAE International: 2010-01–0366. doi:10.4271/2010-01-0366.
Livingston, Cody, Paul Rieger, and Arthur Winer. 2009. “Ammonia Emissions from a Representative in-Use Fleet of Light and Medium-Duty Vehicles in the California South Coast Air Basin.” Atmospheric Environment 43 (21): 3326–33. doi:10.1016/j.atmosenv.2009.04.009.
Majewski, W Addy. 2005. “Selective Catalytic Reduction.” https://www.dieselnet.com/tech/cat_scr.php.
Marins, J. L. 2000. “An Extended Kalman Filter for Quaternion-Based Attitude Estimation.” Thesis Master, no. x: 3033–38. http://oai.dtic.mil/oai/oai?verb=getRecord&metadataPrefix=html&identifier=ADA384973.
Matam, Santhosh Kumar, E H Otal, M H Aguirre, A Winkler, A Ulrich, D Rentsch, A Weidenkaff, and D Ferri. 2012. “Thermal and Chemical Aging of Model Three-Way Catalyst Pd/Al2O3 and Its Impact on the Conversion of CNG Vehicle Exhaust.” Catalysis Today 184 (1): 237–44. doi:http://dx.doi.org/10.1016/j.cattod.2011.09.030.
Mathworks. 2016. “Fuzzy Logic Toolbox TM User Guide,” 1–285.
MathWorks. 2017. “Solve Stiff Differential Equations and DAEs; Variable Order Method - MATLAB ode15s.” Accessed November 22. http://www.mathworks.com/help/matlab/ref/ode15s.html.
McKinley, Thomas L, and Andrew G Alleyne. 2009. “A Switched, Controls-Oriented SCR Catalyst Model Using On-Line Eigenvalue Estimation.” SAE International. doi:10.4271/2009-01-1284.
Mejía-Centeno, Isidro, and Gustavo A. Fuentes. 2009. “Nitrous Oxide Formation during Light-off over a Commercial Pd-Containing Three-Way Catalytic Converter: The Effect of Low-Sulfur Gasoline.” Chemical Engineering Communications 196 (10): 1140–51. doi:10.1080/00986440902831664.
Moos, Ralf, Ralf Müller, Carsten Plog, Aleksandar Knezevic, Holger Leye, Eckard Irion, Tillmann Braun, Klaus-Jürgen Marquardt, and Klaus Binder. 2002. “Selective Ammonia Exhaust Gas Sensor for Automotive Applications.” Sensors and Actuators B: Chemical 83 (1–3): 181–89. doi:http://dx.doi.org/10.1016/S0925-4005(01)01038-3.
Nagashima, K, G Zhang, T Hirota, and H Muraki. 2000. “The Effect of Aging Temperature on Catalyst Performance of Pt/Rh and Pd/Rh TWCs.” SAE International. doi:10.4271/2000-01-1954.
NGK. 2017. “Primary Uses Sample Measurements.”
NGV Global. 2017. “Current Natural Gas Vehicle Statistics.” http://www.iangv.org/current-ngv-stats/.
Nova Enrico, Isabella; Tronconi. 2014. Urea-SCR Technology for deNOx After Treatment of Diesel
120
Exhausts. Fundamental and Applied Catalysis. Springer: Springer New York.
Ohtsuka, Hirofumi. 2015. “Pt-Rh/CeO2-Al2O3 for Controlling Emissions from Natural Gas Engines: Three-Way Catalytic Activity at Low Temperatures and Effects of SO2 Aging.” Emission Control Science and Technology 1 (1): 108–16. doi:10.1007/s40825-014-0009-0.
Ong, Chun, Anuradha Annaswamy, Ilya V Kolmanovsky, Paul Laing, and Dennis Reed. 2010. “An Adaptive Proportional Integral Control of a Urea Selective Catalytic Reduction System Based on System Identification Models.” SAE International. doi:10.4271/2010-01-1174.
Pant, Atul, and Steven J. Schmieg. 2011. “Kinetic Model of NOx SCR Using Urea on Commercial Cu-Zeolite Catalyst.” Industrial and Engineering Chemistry Research 50 (9): 5490–98. doi:10.1021/ie200060s.
Perhinschi, Mario. 2016. Artificial Intelligence Techniques in MAE Chapter 3 Part 1,2,3 and 4.
Prié, Yannick, B E N Abdallah, B E N Abdallah, Mark Hudson Beale Martin T. Hagan Howard B. Demuth, Etudes Technologiques, Bacha Amira Date, Craig Warren, et al. 2015. “Neural Network Toolbox User â€TM S Guide.” MathWorks, no. June: 2–3. doi:10.1002/0471221546.
Prikhodko, Jim Parks and Vitaly. 2009. “Ammonia Production and Utilization in a Hybrid LNT+SCR System.” SAE Techinical Paper 4970 (November 2009): 2009–2739. doi:10.4271/2009-01-2739.
Prikhodko, Vitaly Y., James E. Parks, Josh A. Pihl, and Todd J. Toops. 2016. “Ammonia Generation and Utilization in a Passive SCR (TWC+SCR) System on Lean Gasoline Engine.” SAE International Journal of Engines 9 (2). SAE International: 2016-01–0934. doi:10.4271/2016-01-0934.
Quiros, David C, Arvind Thiruvengadam, Saroj Pradhan, Marc Besch, Pragalath Thiruvengadam, Berk Demirgok, Daniel Carder, Adewale Oshinuga, Tao Huai, and Shaohua Hu. 2016. “Real-World Emissions from Modern Heavy-Duty Diesel, Natural Gas, and Hybrid Diesel Trucks Operating Along Major California Freight Corridors.” Emission Control Science and Technology 2 (3): 156–72. doi:10.1007/s40825-016-0044-0.
Renner, Eberhard, and Ralf Wolke. 2008. “Formation of Secondary Inorganic Aerosols by High Ammonia Emissions Simulated by LM/MUSCAT.” In Air Pollution Modeling and Its Application XIX, edited by Carlos Borrego and Ana Isabel Miranda, 522–29. Dordrecht: Springer Netherlands. doi:10.1007/978-1-4020-8453-9_57.
Sabatini, Stefano, Irfan Kil, Travis Hamilton, Jeff Wuttke, Luis Del Rio, Michael Smith, Zoran Filipi, Mark A Hoffman, and Simona Onori. 2016. “Characterization of Aging Effect on Three-Way Catalyst Oxygen Storage Dynamics.” SAE International. doi:10.4271/2016-01-0971.
Sanchonx. 2017. “Interferometer for FTIR.” Accessed November 28. https://commons.wikimedia.org/wiki/File:FTIR_Interferometer.png.
Shi, Xian, Reinhard Seiser, Jyh-Yuan Chen, Robert Dibble, and Robert Cattolica. 2015. “Fuel-Dithering Optimization of Efficiency of TWC on Natural Gas IC Engine.” SAE International. doi:10.4271/2015-01-1043.
Skaf, Zakwan, Timur Aliyev, Leo Shead, and Thomas Steffen. 2014. “The State of the Art in Selective Catalytic Reduction Control.” SAE International. doi:10.4271/2014-01-1533.
Song, Xiaobo. 2013. “A SCR Model Based on Reactor and Engine Experimental Studies for a Cu-Zeolite Catalyst.” Mechanical Engineering. Michigan Technological University.
Song, Xiaobo, Gordon Parker, John Johnson, Jeffrey Naber, and Josh Pihl. 2013. “A Modeling Study of
121
SCR Reaction Kinetics from Reactor Experiments.” Sae Technincal Paper Series, no. 2013-01–1576. doi:10.4271/2013-01-1576.
Stanton, Donald, Stephen Charlton, and Phani Vajapeyazula. 2013. “Diesel Engine Technologies Enabling Powertrain Optimization to Meet U.S. Greenhouse Gas Emissions.” SAE International. doi:10.4271/2013-24-0094.
Stanton, Donald W. 2013. “Systematic Development of Highly Efficient and Clean Engines to Meet Future Commercial Vehicle Greenhouse Gas Regulations.” SAE International. doi:10.4271/2013-01-2421.
Suarez-Bertoa, R, A A Zardini, and C Astorga. 2014. “Ammonia Exhaust Emissions from Spark Ignition Vehicles over the New European Driving Cycle.” Atmospheric Environment 97: 43–53. doi:http://dx.doi.org/10.1016/j.atmosenv.2014.07.050.
Sun, Kang, Lei Tao, David J Miller, Da Pan, Levi M Golston, Mark A Zondlo, Robert J Griffin, et al. 2016. “Vehicle Emissions as an Important Urban Ammonia Source in the United States and China.” Environ Sci Technol. American Chemical Society. doi:10.1021/acs.est.6b02805.
Tengyu Liu Boguang Wang, Xiang Ding, Wei Deng, Sujun Lü, Yanli Zhang, Xinming Wang. 2014. “Emission Factor of Ammonia (NH3) from on-Road Vehicles in China: Tunnel Tests in Urban Guangzhou.” Environment Research Letters 9 (6).
Tennison, Paul, Christine Lambert, and Michael Levin. 2004. “NOx Control Development with Urea SCR on a Diesel Passenger Car.” SAE International. doi:10.4271/2004-01-1291.
Theis, Joseph R., Jeong Kim, and Giovanni Cavataio. 2015. “Passive TWC+SCR Systems for Satisfying Tier 2, Bin 2 Emission Standards on Lean-Burn Gasoline Engines.” SAE International Journal of Fuels and Lubricants 8 (2): 2015-01–1004. doi:10.4271/2015-01-1004.
Thiruvengadam, Arvind, Marc Besch, Daniel Carder, Adewale Oshinuga, Randall Pasek, Henry Hogo, and Mridul Gautam. 2016. “Unregulated Greenhouse Gas and Ammonia Emissions from Current Technology Heavy-Duty Vehicles.” Journal of the Air & Waste Management Association 66 (11): 1045–60. doi:10.1080/10962247.2016.1158751.
Upadhyay, Devesh, and Michiel Van Nieuwstadt. 2006. “Model Based Analysis and Control Design of a Urea-SCR deNOx Aftertreatment System.” Journal of Dynamic Systems, Measurement, and Control 128 (3): 737. doi:10.1115/1.2234494.
USEPA. 2011. “Department of Transportation.” Federal Register 76 (179). https://www.gpo.gov/fdsys/pkg/FR-2011-09-15/pdf/2011-20740.pdf.
USEPA. 2016. “Engine Certification and Compliance Testing.” USEPA. https://www.epa.gov/vehicle-and-fuel-emissions-testing/engine-certification-and-compliance-testing.
Wang, D, S Yao, D Racine, D Cabush, and M Shost. 2007. “Ammonia Sensor for SCR NOx Reduction.” In DEER Conf.
Wang, Dongliang, Kaisheng Huang, Xiaozhong Wu, and Yinhui Wang. 2011. “The Impact of Oxygen Sensor Degradation on Air-Fuel Ratio and Emissions.” 2011 International Conference on Electric Information and Control Engineering, ICEICE 2011 - Proceedings, no. 2007: 2773–76. doi:10.1109/ICEICE.2011.5776926.
Willems, Frank, Robert Cloudt, Edwin van den Eijnden, Marcel van Genderen, Ruud Verbeek, Bram de Jager, Wiebe Boomsma, and Ignace van den Heuvel. 2007. “Is Closed-Loop SCR Control Required to Meet Future Emission Targets?” SAE Technical Papers 2007 (x). doi:10.4271/2007-01-1574.
122
Zhang, Hui, Junmin Wang, and Yue Yun Wang. 2015. “Removal of NO Xsensor Ammonia Cross Sensitivity from Contaminated Measurements in Diesel-Engine Selective Catalytic Reduction Systems.” Fuel 150 (x): 448–56. doi:10.1016/j.fuel.2015.02.053.
Zhao, Yanguang, Jing Hu, Lun Hua, Shijin Shuai, and Jianxin Wang. 2011. “Ammonia Storage and Slip in a Urea Selective Catalytic Reduction Catalyst under Steady and Transient Conditions.” Industrial & Engineering Chemistry Research 50 (21). American Chemical Society: 11863–71. doi:10.1021/ie201045w.
123
APPENDIX A FTIR Specification
Table 16. FTIR Specification from Manufacturer
Model MultiGasTM
2030-HS
Measurement Technique FTIR Spectrometry
Gases and Vapors Measurable Most molecules except for N2, H2, and O2
Ranges Concentration setting between 100ppb and 100% full scale
FTIR 2102 Process FTIR
Spectral Resolution 0.5 - 128cm-1
Scan Speed 5 scans/sec @ 0.5cm-1
Scan Time 0.2 sec or longer
Infrared Source Silicon Carbide @ 1200°C
Reference Laser Helium Neon (15798.2cm-1
)
Detector LN2 -cooled MCT; TE -cooled MCT
Purge Pressure 20 psig (1.5 bar) max.
Spectrometer Purge Flow 0.2 L/min of dry nitrogen or CO2 free clean dry air with dewpoints below -70°C
Optics Purge Flow 0.2 L/min of dry nitrogen or CO2 free clean dry air with dewpoints below -70°C
Pressure Transducer MKS Baratron®
Purge Connection Swagelok® quick connect
Computer High speed xeon™ processor supplied with analyzer