chemical engineering research and design 9 2 ( 2 0 1 4 ) 619–634
Contents lists available at ScienceDirect
Chemical Engineering Research and Design
j ourna l h omepage: www.elsev ier .com/ locate /cherd
evelopment of an axisymmetric populationalance model for spray drying and validationgainst experimental data and CFD simulations
ark Pintoa, Ian Kempb,∗, Sean Berminghama, Thoralf Hartwigb,riane Bistenb
Process Systems Enterprise, 6th Floor East, 26-28 Hammersmith Grove, London W6 7HA, UKGlaxoSmithKline plc, R&D, Gunnels Wood Road, Stevenage SG1 2NY, UK
a b s t r a c t
An incremental model for spray drying, including a full droplet size distribution, has been implemented in a flow-
sheeting package incorporating tracking of distributed particle properties. Results were compared with expected
trends based on standard theory and with results from a laboratory-scale spray dryer with a two-fluid nozzle for
atomization. Predicted trends were as expected, with larger droplets giving substantially longer drying times and
higher final moisture content. Predicted final moisture content was lower than measured values, as the very short
residence times for fine particles were inadequately represented by first-order falling-rate drying kinetics. Dryer gas
flow patterns were simulated by computational fluid dynamics. Calculated droplet residence times were much lower
than for a plug-flow or fully mixed gas flow, because a high-velocity gas flow zone from the two-fluid atomizer persists
The main gas flow is recycled and solvent is removed by a
. Introduction
pray dryers are widely used in industry to obtain a partic-late or powder product from a solution or suspension. The
iquid feed is atomized into fine droplets and these are thenried in a hot gas stream. One challenge is to produce dropletsufficiently small to dry rapidly and become non-sticky beforeitting the wall of a small diameter dryer such as a laboratorynit; this is achieved by using a two-fluid nozzle.
Modelling is useful to predict the drying behaviour ofroplets and particles, and how this varies with operatingonditions. However, modelling of spray dryers faces severalhallenges: complex three-dimensional swirling flows withinhe drying chamber, the droplet size distribution from thetomization process and the mechanism of forming a parti-
le from the droplet. A range of models of different levels of
∗ Corresponding author.E-mail address: [email protected] (I. Kemp).Received 31 July 2013; Received in revised form 12 December 2013; Ac
complexity are useful in understanding spray dryer behaviourand predicting performance. This work looks at a new par-ticle tracking model implemented in the gSOLIDS softwareenvironment (Pinto et al., 2010).
2. Equipment
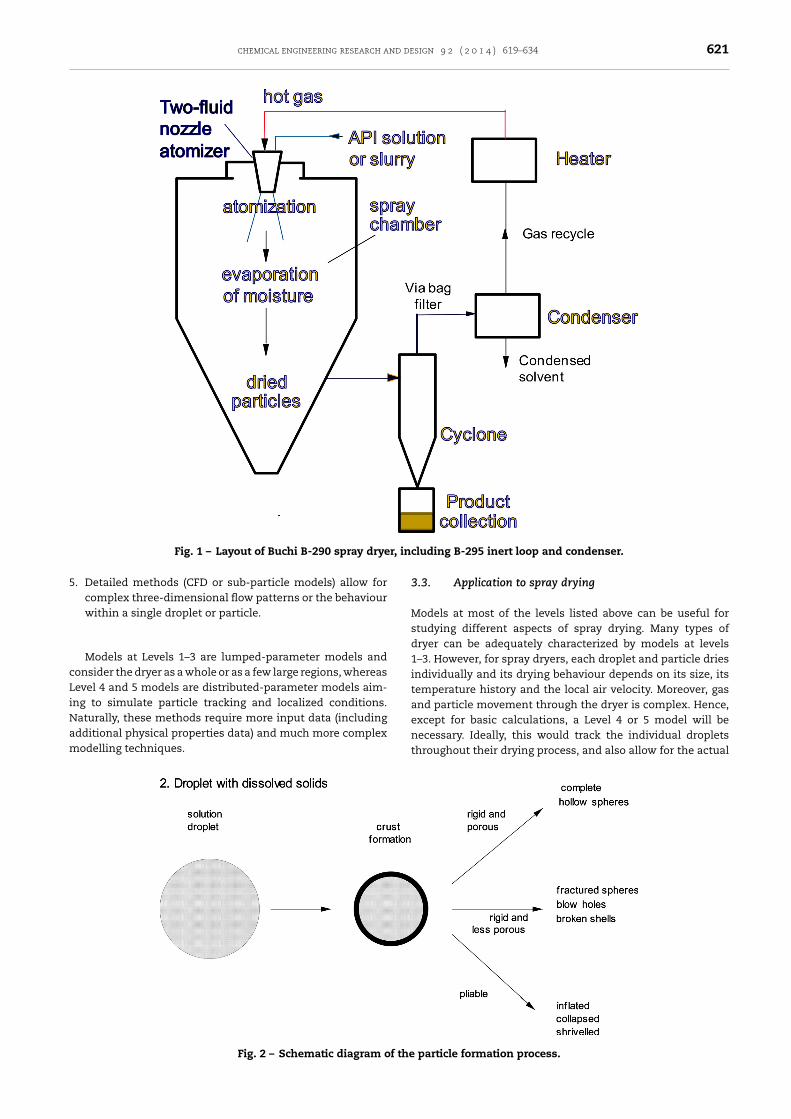
Fig. 1 is a schematic diagram of a Buchi 290 laboratory spraydryer, which is the main type simulated in these studies.A liquid feed (solution or suspension) is atomized into finedroplets by a two-fluid nozzle and these are then dried out ina hot gas stream. The resulting particles are disentrained fromthe gas flow in a cyclone and collected, with a back-up filter.
cepted 16 December 2013
condenser.
neers. Published by Elsevier B.V. All rights reserved.
620 chemical engineering research and design 9 2 ( 2 0 1 4 ) 619–634
Nomenclature
CP specific heat capacity at constant pressure(kJ kg−1 K−1)
d diameter of droplet or particle (m)h heat transfer coefficient (kJ s−1 m−2 K−1)k constant in Thybo equationm mass (kg)Nu Nusselt number, hd/�Pr Prandtl number, �CP/�Q heat flow rate or rate of heat transfer (kW)Re Reynolds number, �Ud/�s,S solids mass fraction (kg/kg)T temperature (◦C)t time (s)U velocity (m s−1)W mass flowrate (kg/s)
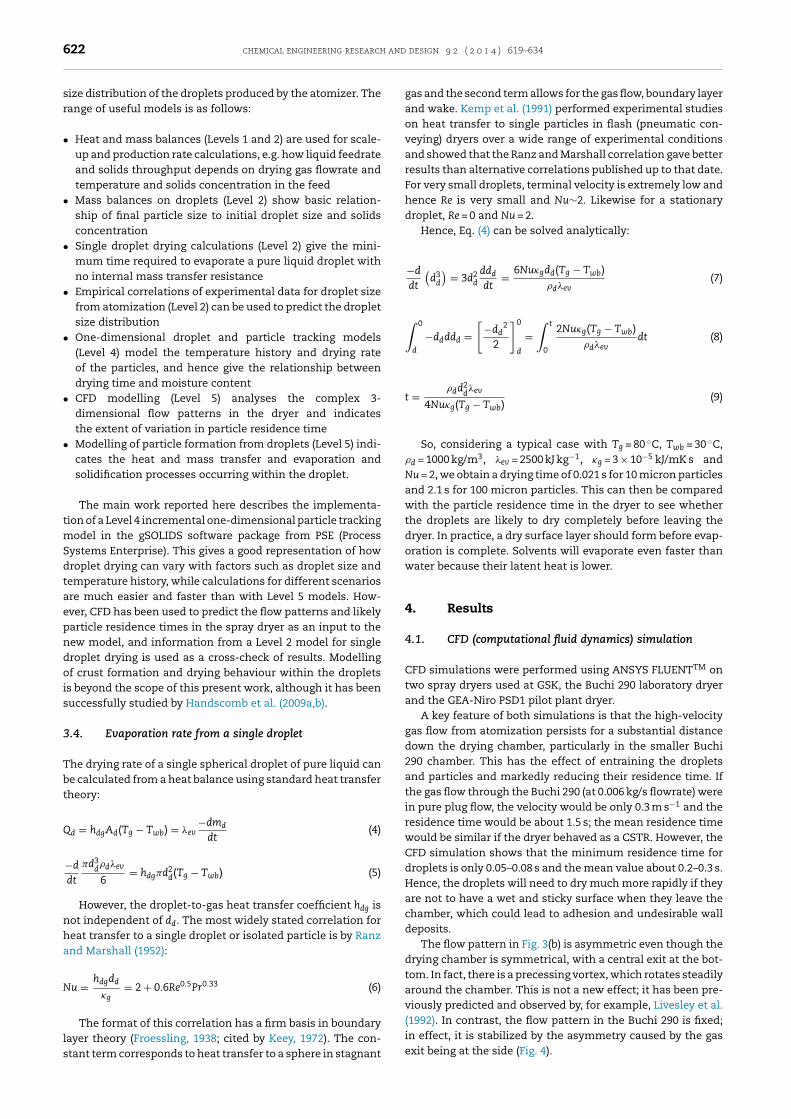
3.1.1. AtomizationThe droplet size distribution from the atomizer is a key influ-ence on the spray drying process, but cannot be predicted fromfirst principles. Most atomization studies (e.g. Marshall, 1954;Lefebvre, 1988, 1991; Bayvel and Orzechowski, 1993) coverrotary atomizers and pressure nozzles, which are unsuitablefor making fine particles below about 20 microns. Spray dryingof fine particles is generally achieved using a two-fluid nozzle,where liquid is sprayed through a nozzle and surrounded byatomizing gas emerging from an annulus, which is typicallyapproaching sonic velocity. The resulting shear forces at thegas-liquid interface cause atomization (Fig. 2).
Thybo et al. (2008) propose the following correlation, whichhas similarities to an equation proposed by Masters (1971)which involved dimensional constants:
dsm
D=(
1 + WL
Watm
)k2
(�L
√�
√�L�gU2
gD1.5
)k1
(1)
The first term shows that liquid flowrate can affect dropletsize if it is significant compared to the atomization gasflowrate. The exponent k1 in the equation is typically about 0.6,so the predicted particle diameter is roughly inversely propor-
tional to the atomization velocity. Kemp et al. (2013a) showedthat this equation did not fully describe trends observed in an
extensive series of experiments with aqueous solutions of eggalbumin, and further work is ongoing (Kemp et al., 2013b).
3.1.2. Particle formation from dropletsAs liquid is evaporated by the hot drying gas, the dropletsshrink and a crust may form, particularly with solution feeds.The concentration of solute at the surface of the droplet ishigher than that in the centre because of evaporation. If a rigidcrust is formed, the particle will not shrink further, althoughit may fragment later. If the crust is flexible and pliable, theparticle can continue to shrink; it may even expand if the liq-uid heats up above its boiling point. Many possible particlemorphologies can be obtained, as shown by Charlesworth andMarshall (1960) and Walton and Mumford (1999a,b).
3.1.3. Relationship of initial droplet size to final particlesizeThe initial droplet size and the final particle size are relatedby a mass balance on the solids fraction, assuming no coales-cence, agglomeration or attrition:
mS = mdSd = �
6d3
d�dSd = mpSp = �
6d3
p�pSp (2)
Hence the final particle size can be estimated from theinitial droplet size as:
dp = dd
(�dSd
�pSp
)1/3
(3)
Thus, for a given droplet size, low solids concentration andhigh particle density are expected to give smaller final parti-cles.
If �p in Eq. (3) is taken to be the true density of the solid,the equation gives a minimum particle size. However, if theparticle is porous or hollow, e.g. because an outer crust hasformed, the mean density is lower and the particle diameteris greater. In practice, the density of individual spray driedparticles is intermediate between the solid true density (typi-cally 1000–1500 kg/m3) and the bulk density of the final powderproduct (typically 50–200 kg/m3), since the latter also includesthe voidage between the individual particles.
3.2. Classification of general dryer models
Kemp and Oakley (2002) categorized dryer models at four lev-els, later expanded to five:
1. Heat and mass balance; gives useful information, espe-cially the water (or solvent) mass balance, but not relatedto dryer size or possible performance, nor to the behaviourof the solids or individual particles.
2. Scoping (approximate) calculations give a first estimate ofdryer size and drying time, assuming a simple theoreticalmodel with constant-rate and first-order falling-rate dry-ing.
3. Scaling calculations (integral model) give overall dimen-sions and performance figures on scale-up, based onmeasured drying curves from small-scale or pilot-plantexperiments, and treating the dryer as a whole.
4. Detailed methods (incremental model) track the local con-ditions of the solids and gas (e.g. variations through a layeror temperature history of a particle) as drying progresses,
typically as a one-dimensional variation with length ortime.
chemical engineering research and design 9 2 ( 2 0 1 4 ) 619–634 621
r, in
5
cLiNam
Fig. 1 – Layout of Buchi B-290 spray drye
. Detailed methods (CFD or sub-particle models) allow forcomplex three-dimensional flow patterns or the behaviourwithin a single droplet or particle.
Models at Levels 1–3 are lumped-parameter models andonsider the dryer as a whole or as a few large regions, whereasevel 4 and 5 models are distributed-parameter models aim-ng to simulate particle tracking and localized conditions.aturally, these methods require more input data (including
dditional physical properties data) and much more complexodelling techniques.
Fig. 2 – Schematic diagram of the
cluding B-295 inert loop and condenser.
3.3. Application to spray drying
Models at most of the levels listed above can be useful forstudying different aspects of spray drying. Many types ofdryer can be adequately characterized by models at levels1–3. However, for spray dryers, each droplet and particle driesindividually and its drying behaviour depends on its size, itstemperature history and the local air velocity. Moreover, gasand particle movement through the dryer is complex. Hence,except for basic calculations, a Level 4 or 5 model will be
necessary. Ideally, this would track the individual dropletsthroughout their drying process, and also allow for the actual
particle formation process.
622 chemical engineering research and design 9 2 ( 2 0 1 4 ) 619–634
size distribution of the droplets produced by the atomizer. Therange of useful models is as follows:
• Heat and mass balances (Levels 1 and 2) are used for scale-up and production rate calculations, e.g. how liquid feedrateand solids throughput depends on drying gas flowrate andtemperature and solids concentration in the feed
• Mass balances on droplets (Level 2) show basic relation-ship of final particle size to initial droplet size and solidsconcentration
• Single droplet drying calculations (Level 2) give the mini-mum time required to evaporate a pure liquid droplet withno internal mass transfer resistance
• Empirical correlations of experimental data for droplet sizefrom atomization (Level 2) can be used to predict the dropletsize distribution
• One-dimensional droplet and particle tracking models(Level 4) model the temperature history and drying rateof the particles, and hence give the relationship betweendrying time and moisture content
• CFD modelling (Level 5) analyses the complex 3-dimensional flow patterns in the dryer and indicatesthe extent of variation in particle residence time
• Modelling of particle formation from droplets (Level 5) indi-cates the heat and mass transfer and evaporation andsolidification processes occurring within the droplet.
The main work reported here describes the implementa-tion of a Level 4 incremental one-dimensional particle trackingmodel in the gSOLIDS software package from PSE (ProcessSystems Enterprise). This gives a good representation of howdroplet drying can vary with factors such as droplet size andtemperature history, while calculations for different scenariosare much easier and faster than with Level 5 models. How-ever, CFD has been used to predict the flow patterns and likelyparticle residence times in the spray dryer as an input to thenew model, and information from a Level 2 model for singledroplet drying is used as a cross-check of results. Modellingof crust formation and drying behaviour within the dropletsis beyond the scope of this present work, although it has beensuccessfully studied by Handscomb et al. (2009a,b).
3.4. Evaporation rate from a single droplet
The drying rate of a single spherical droplet of pure liquid canbe calculated from a heat balance using standard heat transfertheory:
Qd = hdgAd(Tg − Twb) = �ev−dmd
dt(4)
−d
dt
�d3d�d�ev
6= hdg�d2
d(Tg − Twb) (5)
However, the droplet-to-gas heat transfer coefficient hdg isnot independent of dd. The most widely stated correlation forheat transfer to a single droplet or isolated particle is by Ranzand Marshall (1952):
Nu = hdgdd
�g= 2 + 0.6Re0.5Pr0.33 (6)
The format of this correlation has a firm basis in boundary
layer theory (Froessling, 1938; cited by Keey, 1972). The con-stant term corresponds to heat transfer to a sphere in stagnant
gas and the second term allows for the gas flow, boundary layerand wake. Kemp et al. (1991) performed experimental studieson heat transfer to single particles in flash (pneumatic con-veying) dryers over a wide range of experimental conditionsand showed that the Ranz and Marshall correlation gave betterresults than alternative correlations published up to that date.For very small droplets, terminal velocity is extremely low andhence Re is very small and Nu∼2. Likewise for a stationarydroplet, Re = 0 and Nu = 2.
Hence, Eq. (4) can be solved analytically:
−d
dt
(d3
d
)= 3d2
d
ddd
dt= 6Nu�gdd(Tg − Twb)
�d�ev(7)
∫ 0
d
−ddddd =[
−dd2
2
]0
d
=∫ t
0
2Nu�g(Tg − Twb)�d�ev
dt (8)
t = �dd2d�ev
4Nu�g(Tg − Twb)(9)
So, considering a typical case with Tg = 80 ◦C, Twb = 30 ◦C,�d = 1000 kg/m3, �ev = 2500 kJ kg−1, �g = 3 × 10⁻⁵ kJ/mK s andNu = 2, we obtain a drying time of 0.021 s for 10 micron particlesand 2.1 s for 100 micron particles. This can then be comparedwith the particle residence time in the dryer to see whetherthe droplets are likely to dry completely before leaving thedryer. In practice, a dry surface layer should form before evap-oration is complete. Solvents will evaporate even faster thanwater because their latent heat is lower.
CFD simulations were performed using ANSYS FLUENTTM ontwo spray dryers used at GSK, the Buchi 290 laboratory dryerand the GEA-Niro PSD1 pilot plant dryer.
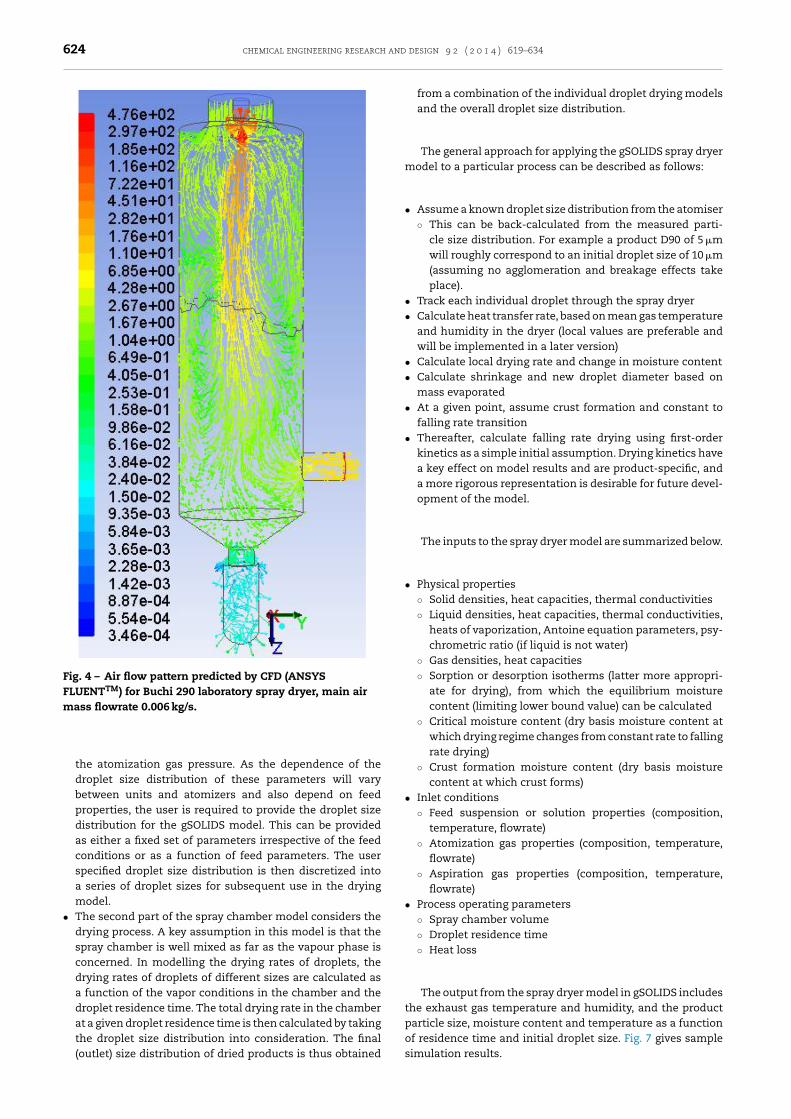
A key feature of both simulations is that the high-velocitygas flow from atomization persists for a substantial distancedown the drying chamber, particularly in the smaller Buchi290 chamber. This has the effect of entraining the dropletsand particles and markedly reducing their residence time. Ifthe gas flow through the Buchi 290 (at 0.006 kg/s flowrate) werein pure plug flow, the velocity would be only 0.3 m s−1 and theresidence time would be about 1.5 s; the mean residence timewould be similar if the dryer behaved as a CSTR. However, theCFD simulation shows that the minimum residence time fordroplets is only 0.05–0.08 s and the mean value about 0.2–0.3 s.Hence, the droplets will need to dry much more rapidly if theyare not to have a wet and sticky surface when they leave thechamber, which could lead to adhesion and undesirable walldeposits.
The flow pattern in Fig. 3(b) is asymmetric even though thedrying chamber is symmetrical, with a central exit at the bot-tom. In fact, there is a precessing vortex, which rotates steadilyaround the chamber. This is not a new effect; it has been pre-viously predicted and observed by, for example, Livesley et al.(1992). In contrast, the flow pattern in the Buchi 290 is fixed;
in effect, it is stabilized by the asymmetry caused by the gasexit being at the side (Fig. 4).
chemical engineering research and design 9 2 ( 2 0 1 4 ) 619–634 623
Fig. 3 – Air flow pattern predicted by CFD (ANSYS FLUENTTM) (rotated through 90◦) for: (a) Buchi 290 laboratory spray dryer,main air mass flowrate 0.004 kg/s and (b) GEA-Niro PSD-1 pilot-plant spray dryer.
4
4Tediaiasc
.2. Modelling using gSOLIDS
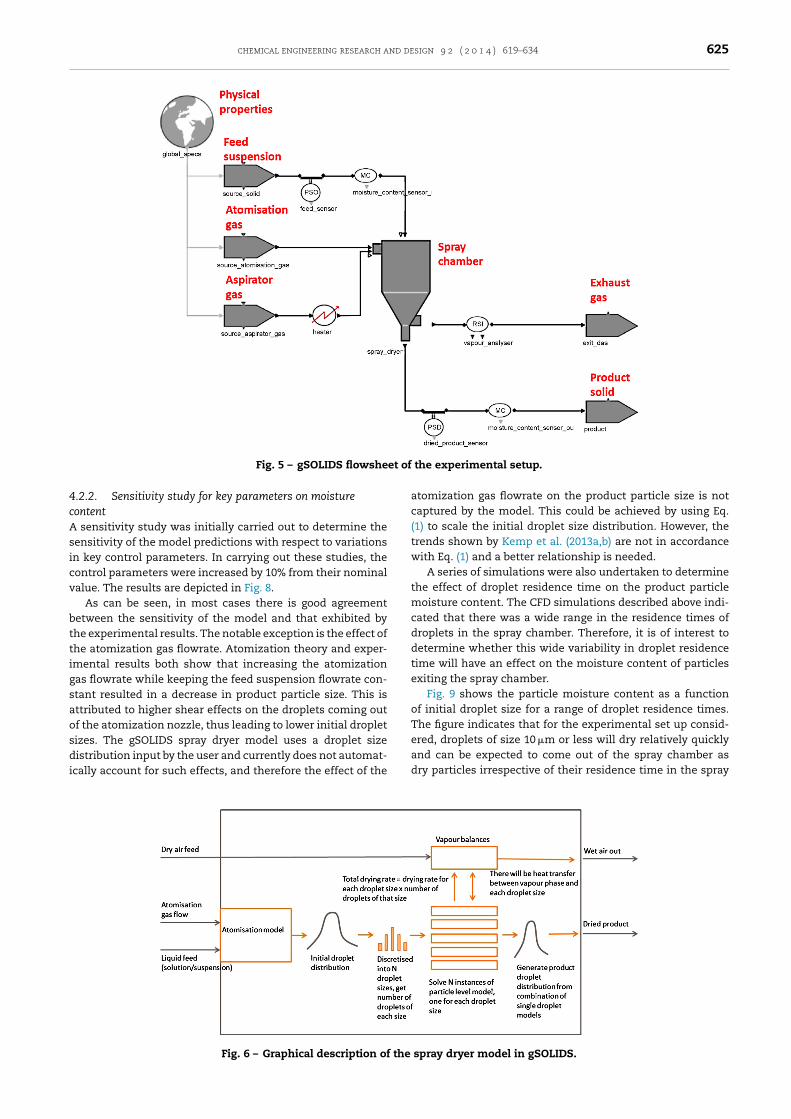
.2.1. Methodhe solids process flowsheet simulation tool, gSOLIDS (Pintot al., 2010), was used to model the experimental set upescribed above. The flowsheet used to simulate the exper-
mental set up is depicted below in Fig. 5. The atomization gasnd aspirator gas are modelled as separate inlet streams ast is assumed that atomization gas enters the spray chambert room temperature. The gSOLIDS model allows for perfect
eparation of vapour and solid and therefore modelling of theyclone has been omitted here.
For the sake of brevity, a detailed description of the spraydryer model in gSOLIDS is deferred to Appendix A and a briefdescription is provided here. The spray chamber model ingSOLIDS can be depicted graphically as shown in Fig. 6. Themodel consists of two segments:
• The atomization model takes in a feed suspension andgenerates an initial droplet distribution. In practice, thedistribution of droplets coming out of the atomizerdepends on several factors including the primary particle
size distribution (the distribution of primary particles inthe feed suspension), the atomization gas flowrate, and
624 chemical engineering research and design 9 2 ( 2 0 1 4 ) 619–634
Fig. 4 – Air flow pattern predicted by CFD (ANSYSFLUENTTM) for Buchi 290 laboratory spray dryer, main airmass flowrate 0.006 kg/s.
of residence time and initial droplet size. Fig. 7 gives samplesimulation results.
the atomization gas pressure. As the dependence of thedroplet size distribution of these parameters will varybetween units and atomizers and also depend on feedproperties, the user is required to provide the droplet sizedistribution for the gSOLIDS model. This can be providedas either a fixed set of parameters irrespective of the feedconditions or as a function of feed parameters. The userspecified droplet size distribution is then discretized intoa series of droplet sizes for subsequent use in the dryingmodel.
• The second part of the spray chamber model considers thedrying process. A key assumption in this model is that thespray chamber is well mixed as far as the vapour phase isconcerned. In modelling the drying rates of droplets, thedrying rates of droplets of different sizes are calculated asa function of the vapor conditions in the chamber and thedroplet residence time. The total drying rate in the chamberat a given droplet residence time is then calculated by takingthe droplet size distribution into consideration. The final(outlet) size distribution of dried products is thus obtained
from a combination of the individual droplet drying modelsand the overall droplet size distribution.
The general approach for applying the gSOLIDS spray dryermodel to a particular process can be described as follows:
• Assume a known droplet size distribution from the atomiser◦ This can be back-calculated from the measured parti-
cle size distribution. For example a product D90 of 5 �mwill roughly correspond to an initial droplet size of 10 �m(assuming no agglomeration and breakage effects takeplace).
• Track each individual droplet through the spray dryer• Calculate heat transfer rate, based on mean gas temperature
and humidity in the dryer (local values are preferable andwill be implemented in a later version)
• Calculate local drying rate and change in moisture content• Calculate shrinkage and new droplet diameter based on
mass evaporated• At a given point, assume crust formation and constant to
falling rate transition• Thereafter, calculate falling rate drying using first-order
kinetics as a simple initial assumption. Drying kinetics havea key effect on model results and are product-specific, anda more rigorous representation is desirable for future devel-opment of the model.
The inputs to the spray dryer model are summarized below.
heats of vaporization, Antoine equation parameters, psy-chrometric ratio (if liquid is not water)
◦ Gas densities, heat capacities◦ Sorption or desorption isotherms (latter more appropri-
ate for drying), from which the equilibrium moisturecontent (limiting lower bound value) can be calculated
◦ Critical moisture content (dry basis moisture content atwhich drying regime changes from constant rate to fallingrate drying)
◦ Crust formation moisture content (dry basis moisturecontent at which crust forms)
• Inlet conditions◦ Feed suspension or solution properties (composition,
temperature, flowrate)◦ Atomization gas properties (composition, temperature,
flowrate)◦ Aspiration gas properties (composition, temperature,
flowrate)• Process operating parameters
◦ Spray chamber volume◦ Droplet residence time◦ Heat loss
The output from the spray dryer model in gSOLIDS includesthe exhaust gas temperature and humidity, and the productparticle size, moisture content and temperature as a function
chemical engineering research and design 9 2 ( 2 0 1 4 ) 619–634 625
et of
4cAsicv
bttigsaosdi
Fig. 5 – gSOLIDS flowshe
.2.2. Sensitivity study for key parameters on moistureontent
sensitivity study was initially carried out to determine theensitivity of the model predictions with respect to variationsn key control parameters. In carrying out these studies, theontrol parameters were increased by 10% from their nominalalue. The results are depicted in Fig. 8.
As can be seen, in most cases there is good agreementetween the sensitivity of the model and that exhibited byhe experimental results. The notable exception is the effect ofhe atomization gas flowrate. Atomization theory and exper-mental results both show that increasing the atomizationas flowrate while keeping the feed suspension flowrate con-tant resulted in a decrease in product particle size. This isttributed to higher shear effects on the droplets coming outf the atomization nozzle, thus leading to lower initial dropletizes. The gSOLIDS spray dryer model uses a droplet sizeistribution input by the user and currently does not automat-
cally account for such effects, and therefore the effect of the
Fig. 6 – Graphical description of the
the experimental setup.
atomization gas flowrate on the product particle size is notcaptured by the model. This could be achieved by using Eq.(1) to scale the initial droplet size distribution. However, thetrends shown by Kemp et al. (2013a,b) are not in accordancewith Eq. (1) and a better relationship is needed.
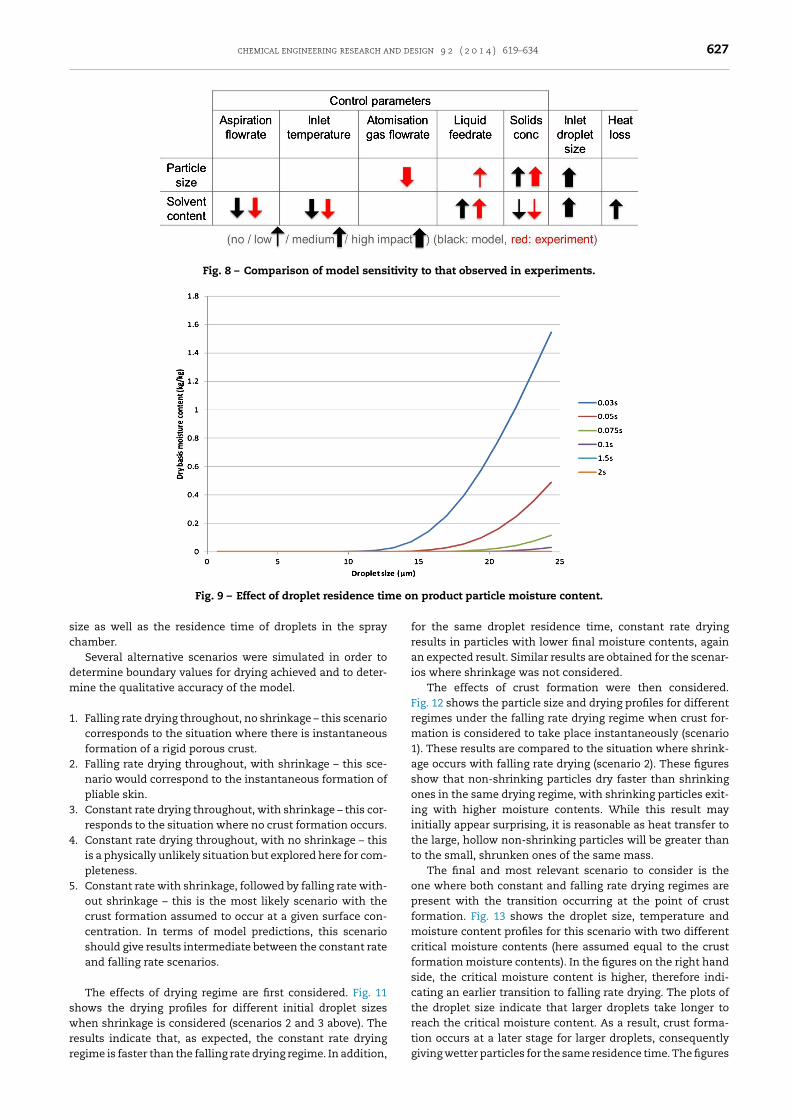
A series of simulations were also undertaken to determinethe effect of droplet residence time on the product particlemoisture content. The CFD simulations described above indi-cated that there was a wide range in the residence times ofdroplets in the spray chamber. Therefore, it is of interest todetermine whether this wide variability in droplet residencetime will have an effect on the moisture content of particlesexiting the spray chamber.
Fig. 9 shows the particle moisture content as a functionof initial droplet size for a range of droplet residence times.The figure indicates that for the experimental set up consid-ered, droplets of size 10 �m or less will dry relatively quicklyand can be expected to come out of the spray chamber as
dry particles irrespective of their residence time in the spray
spray dryer model in gSOLIDS.
626 chemical engineering research and design 9 2 ( 2 0 1 4 ) 619–634
Fig. 7 – Sample simulation results obtained from the gSOLIDS spray chamber model.
chamber. However, as the initial droplet size increases further,the probability of a droplet not drying completely to its finalequilibrium moisture content (here 0.027%, based on the sorp-tion isotherm) increases substantially. This illustrates that theeffect of atomization is key, as if the initial droplet size istoo large, it will not be possible to dry all droplets sufficientlybefore they exit the spray chamber.
This is further evident from Fig. 10 which shows the dry-ing profiles for different initial droplet sizes. Taking into
consideration the range of residence times predicted by theCFD simulations (0.03–0.3 s) and the expected range in ini-tial droplet sizes (5–15 �m), it can be seen that there canbe a significant variation in moisture contents of parti-cles exiting the spray chamber. In particular, the highestmoisture contents will be exhibited by large initial dropletswith the shortest residence times. This figure also illus-
trates that the average moisture content of the particlesexiting the spray chamber is dependent on the initial droplet
chemical engineering research and design 9 2 ( 2 0 1 4 ) 619–634 627
Fig. 8 – Comparison of model sensitivity to that observed in experiments.
e o
sc
dm
1
2
3
4
5
swrr
Fig. 9 – Effect of droplet residence tim
ize as well as the residence time of droplets in the sprayhamber.
Several alternative scenarios were simulated in order toetermine boundary values for drying achieved and to deter-ine the qualitative accuracy of the model.
. Falling rate drying throughout, no shrinkage – this scenariocorresponds to the situation where there is instantaneousformation of a rigid porous crust.
. Falling rate drying throughout, with shrinkage – this sce-nario would correspond to the instantaneous formation ofpliable skin.
. Constant rate drying throughout, with shrinkage – this cor-responds to the situation where no crust formation occurs.
. Constant rate drying throughout, with no shrinkage – thisis a physically unlikely situation but explored here for com-pleteness.
. Constant rate with shrinkage, followed by falling rate with-out shrinkage – this is the most likely scenario with thecrust formation assumed to occur at a given surface con-centration. In terms of model predictions, this scenarioshould give results intermediate between the constant rateand falling rate scenarios.
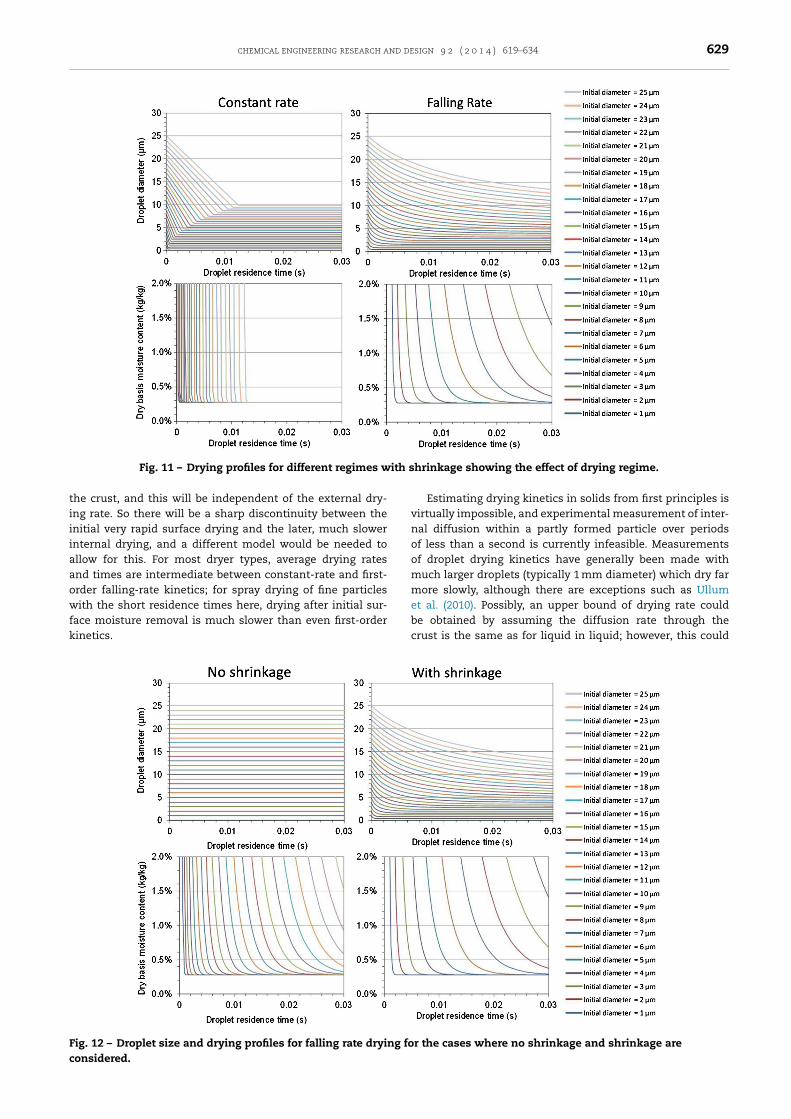
The effects of drying regime are first considered. Fig. 11hows the drying profiles for different initial droplet sizeshen shrinkage is considered (scenarios 2 and 3 above). The
esults indicate that, as expected, the constant rate dryingegime is faster than the falling rate drying regime. In addition,
n product particle moisture content.
for the same droplet residence time, constant rate dryingresults in particles with lower final moisture contents, againan expected result. Similar results are obtained for the scenar-ios where shrinkage was not considered.
The effects of crust formation were then considered.Fig. 12 shows the particle size and drying profiles for differentregimes under the falling rate drying regime when crust for-mation is considered to take place instantaneously (scenario1). These results are compared to the situation where shrink-age occurs with falling rate drying (scenario 2). These figuresshow that non-shrinking particles dry faster than shrinkingones in the same drying regime, with shrinking particles exit-ing with higher moisture contents. While this result mayinitially appear surprising, it is reasonable as heat transfer tothe large, hollow non-shrinking particles will be greater thanto the small, shrunken ones of the same mass.
The final and most relevant scenario to consider is theone where both constant and falling rate drying regimes arepresent with the transition occurring at the point of crustformation. Fig. 13 shows the droplet size, temperature andmoisture content profiles for this scenario with two differentcritical moisture contents (here assumed equal to the crustformation moisture contents). In the figures on the right handside, the critical moisture content is higher, therefore indi-cating an earlier transition to falling rate drying. The plots ofthe droplet size indicate that larger droplets take longer toreach the critical moisture content. As a result, crust forma-
tion occurs at a later stage for larger droplets, consequentlygiving wetter particles for the same residence time. The figures
628 chemical engineering research and design 9 2 ( 2 0 1 4 ) 619–634
Fig. 10 – Drying profiles for different initial droplet sizes.
also reinforce the earlier result that constant rate drying isquicker than falling rate drying.
The final set of results shows the effect of critical mois-ture content on the drying profile for 10 �m droplets. Theresults, shown in Fig. 14, indicate that earlier crust formation(or shorter constant rate drying), at 5.0 kg/kg mean moisturecontent, leads to longer drying, larger and wetter particles, asexpected from theory. However, the model predicts that thedroplets reach the equilibrium moisture content of 0.3 (w/w%)within a residence time of 0.03 s regardless of the scenario cho-sen. Experimental results indicate a range of 0.3–0.9 (w/w%).This indicates that the current model is qualitatively accuratebut over predicts the drying rate during the falling rate period.
5. Discussion
Most of the observed results and trends are in line with whatwould be expected from theory. The model shows very clearlythe effect of different initial droplet sizes in a distribution, andthe effect of shrinkage, plus the difference between constant
rate and falling rate drying or transition at an intermediatevalue.
To explicitly include the effect of atomization gas andliquid flowrates on the initial droplet size distribution thatis generated, an atomization model would need to beadded.
The current model overpredicts drying rate in the laterstages of the falling rate drying period. The model uses first-order drying kinetics based on the initial constant drying ratefor the pure droplet. This simple model requires no measure-ment of drying kinetics parameters and is known to work wellfor a wide range of dryers, including deep-bed, vacuum, rotaryand fluidized bed dryers (Kemp and Oakley, 2002; Genskowet al., 2007). However, the drying times for these units are min-utes or hours. The underlying basis of the first-order kineticsmodel is that moisture profiles are set up within the particlecorresponding to steady-state diffusion, with a smooth tran-sition from constant-rate drying at the point where internaldiffusion cannot match external mass transfer. However, forthe spray dryer with its solids residence times of fractionsof a second, there is too little time for these profiles to beestablished. The surface crust will form and will rapidly dryout completely, because the rate of external mass transfer is
extremely high, but the drying rate of the interior of the par-ticle will depend on the rate of transport of moisture through
chemical engineering research and design 9 2 ( 2 0 1 4 ) 619–634 629
ith s
tiiiaaowfk
Fc
Fig. 11 – Drying profiles for different regimes w
he crust, and this will be independent of the external dry-ng rate. So there will be a sharp discontinuity between thenitial very rapid surface drying and the later, much slowernternal drying, and a different model would be needed tollow for this. For most dryer types, average drying ratesnd times are intermediate between constant-rate and first-rder falling-rate kinetics; for spray drying of fine particlesith the short residence times here, drying after initial sur-
ace moisture removal is much slower than even first-orderinetics.
ig. 12 – Droplet size and drying profiles for falling rate drying foonsidered.
hrinkage showing the effect of drying regime.
Estimating drying kinetics in solids from first principles isvirtually impossible, and experimental measurement of inter-nal diffusion within a partly formed particle over periodsof less than a second is currently infeasible. Measurementsof droplet drying kinetics have generally been made withmuch larger droplets (typically 1 mm diameter) which dry farmore slowly, although there are exceptions such as Ullumet al. (2010). Possibly, an upper bound of drying rate could
be obtained by assuming the diffusion rate through thecrust is the same as for liquid in liquid; however, this could
r the cases where no shrinkage and shrinkage are
630 chemical engineering research and design 9 2 ( 2 0 1 4 ) 619–634
Fig. 13 – Droplet size, temperature and moisture content profiles for constant and falling rate drying at two differenttransitions.
Fig. 14 – Droplet size, moisture content profiles for constant and falling rate drying at different critical moisture contents for
10 �m droplets.
be a substantial overestimate. A receding evaporative inter-face model as suggested by Cheong et al. (1986) is anotherpossibility.
The model in its present form would be expected to be moresuccessful for larger spray dryers using other types of atom-izer (pressure nozzle or rotary), where the initial droplet sizeis of the order of hundreds of microns and the drying timeswill be several seconds. Nevertheless, alternative ways ofrepresenting drying kinetics will be useful, to give the
model enough flexibility to be fitted to real experimentaldata.
6. Conclusions
The one-dimensional particle tracking model as implementedin gSOLIDS successfully predicts the expected qualitativetrends in drying time and final moisture content with vary-ing initial droplet diameter, and gives quantitative valuesfor these trends. As expected, small droplets dry very muchfaster than large ones. The simulation uses a complete inletdroplet size distribution, and shows the differences between
constant and falling rate drying, with and without shrink-age. The model could be improved further by allowing for
chemical engineering research and design 9 2 ( 2 0 1 4 ) 619–634 631
aesmmtb0C
A
Tt
••
••
A
TTa
w
•••
••
•
•••
M
w
x
w(
ci
x
• d is the residence time of droplets in the system (s),• FS,dry,j,z is the mass flowrate of droplets in grid location z in
the droplet phase j (kg/s),• FS,dry,nom,j,z is the nominal mass flowrate of droplets in grid
location z in the droplet phase j (kg/s),
ctual gas flow patterns, as identified by CFD, and a differ-nt representation of drying kinetics. The CFD simulationhows that the residence time of most particles will beuch lower than predicted from either a plug-flow or well-ixed calculation, due to the high-velocity flow field round
he atomizer persisting a long way down the dryer cham-er. For the Buchi 290 dryer, typical residence times are.05–0.3 s, as against 1.5 s for plug flow or a well-mixedSTR.
ppendix A. Detailed description of model
he following assumptions are made in deriving the model ofhe spray dryer.
The vapour phase is assumed to be perfectly mixed. The droplet phase is assumed to follow plug flow (i.e. no
back-mixing of droplets is assumed to take place). Agglomeration or breakage of droplets is not considered. Heat transfer between droplets and vapour is considered.
Additional heat losses are not calculated but can be speci-fied by the user.
.1. Vapour phase balances
he vapour phase is modelled as a perfectly mixed region.he mass balances on the components of the vapour phasere given by
dMV,i
dt= FV,inxV,in,i − FV,outxV,out,i ∀i ∈ CV − CLV
dMV,i
dt= FV,inxV,in,i − FV,outxV,out,i +
∑j ∈ PS
Rdrying,j,i ∀i ∈ CLV
here
MV,i is the mass of species i in the vapour phase (kg), FV,in is the vapour mass flowrate into the system (kg/s), xV,in,i is the mass fraction of species i in the vapour flow
entering the system (kg/kg), FV,out is the vapour mass flowrate out of the system (kg/s), xV,out,i is the mass fraction of species i in the vapour flow
leaving the system (kg/kg), Rdrying,j,i is the rate of removal of liquid species i from the
droplet phase j (kg/s), CV is the set of vapour phase components, CLV is the set of liquid components that can evaporate, PS is the set of solid phases.
The total vapour phase mass holdup is given by
V,total =∑i ∈ CV
MV,i
here MV,total is the total vapour mass holdup (kg).The vapour phase composition is given by
V,iMV,total = MV,i i ∈ CV
here xV,i is the mass faction of species i in the vapour phasekg/kg).
Due to the assumption of perfect mixing, the outlet vapouromposition is to be assumed equal to the vapour compositionnside the system:
V,out,i = xV,i i ∈ CV
The volume of vapour inside the system is given by
VV =∑i ∈ CV
MV,i
�V,i
where
• Vv is the volume of vapour in the system (m3),• �V,i is the pure component mass density of species i in the
vapour phase (kg/m3).
Pressure driven flow is not considered; therefore, he outletvapour flowrate is modelled using the following state transi-tion network:
FV,out = 0 VV < Vnominal
FV,out = max [0, k (VV − Vnominal)] VV≥Vnominal
where
• Vnominal is the nominal volume of the system (m3),• k is an outflow gain (kg/m3s).
There is assumed to be no pressure drop inside the systemso that
Pout = Pin
where
• Pin is the pressure at the system inlet (Pa),• Pout is the pressure at the system outlet (Pa).
An energy balance of the vapour phase is given by
dHV
dt= �V,in − �V,out +
∑j ∈ PS
⎛⎝∑
i ∈ CLV
Rdrying,j,icp,V,i
⎞⎠(TV − Tref
)
−∑j ∈ PS
NFV∑z
z=1
((FS,dry,j,z
FS,dry,nom,j,z
)h
∫ d
=0|+AS,j,z,
(TV − TS,j,z,
)d
)
where
• HV is the total enthalpy holdup of the vapour phase (J),• ˚V,in is the enthalpy flowrate of vapour entering the system
(J/s),• ˚V,out is the enthalpy flowrate of vapour leaving the system
(J/s),• cp,V,i is the pure component specific heat capacity of species
i in the vapour phase (J/kg K),• TV is the temperature of the vapour phase (K),• Tref is the reference temperature (K),• h is the heat transfer coefficient (J/m2s K),
• AS,j,z, is the surface area of droplets of phase j in grid loca-tion z and at residence time (m2/s),
632 chemical engineering research and design 9 2 ( 2 0 1 4 ) 619–634
phase is related to the mass flowrate of droplets entering thesystem by the following relationship.
Rdrying,j,i =NFV∑z=1
FS,dry,j,z
FS,dry,nom,j,z
∫ max
=0
RS,drying,nom,j,i,,zd i ∈ CLV, j ∈ PS
• TS,j,z, is the temperature of droplets of phase j in grid loca-tion z and at residence time (K),
• NFV is the number of grid locations.
The enthalpy holdup of the vapour phase is related to thevapour phase temperature by the following equation.
HV = MV,total
(∑i ∈ CV
xV,icp,V,i
)(TV − Tref
)Similarly, the inlet and enthalpy flowrates of the vapour phaseare related to the inlet and outlet vapour phase temperaturesby the following equations.
˚V,in = FV,in
(∑i ∈ CV
xV,in,icp,V,i
)(TV,in − Tref
)˚V,out
= FV,out
(∑i ∈ CV
xV,out,icp,V,i
)(TV,out − Tref
)
where
• TV,in is the temperature of the vapour entering the system(K),
• TV,out is the temperature of the vapour leaving the system(K).
Due to the assumption of perfect mixing, the temperatureof the vapour leaving the system is assumed equal to the tem-perature of vapour inside the system:
• FS,dry,nom,j,z is the nominal mass flowrate of dry material cor-responding to size class z in the droplet phase j (kg/s),
• XS,j,i,,z is the dry basis moisture content of liquid species iat residence time corresponding to size class z in the solidphase j (kg/kg of dry solid),
• RS,drying,nom,j,i,,z is the nominal drying rate of species i at resi-dence time corresponding to size class z in the solid phasej (kg/s2),
• CLV is the set of liquid components that can evaporate,• PS is the set of solid phases,• NFV is the number of size classes used to approximate the
droplet size distribution. is the residence time domain (s),• max is the residence time of droplets in the unit (s).
where rS,dry,j,z is the radius of droplets at residence time cor-responding to size class z in the solid phase j on a dry basis(m).
The actual drying rate of droplets in a particular droplet
where FS,dry,j,z is the actual mass flowrate of droplets on a drybasis corresponding to size class z in the solid phase j (kg/s).
chemical engineering research and design 9 2 ( 2 0 1 4 ) 619–634 633
j,,z
)−
w
•
•••••
A
Tt
R
w
•
••
•••
e
w
••
•
•
•
•
•
••••
The relative humidity is obtained from the following equa-tion.
An energy balance on the droplet phase is given by
FS,dry,nom,j,z
⎛⎝cp,dry,S,j,z +
∑i ∈ CLV
XS,j,i,,zcp,i
⎞⎠ ∂TS,j,,z
∂= hAS,nom,j,,z
(TV − TS,
TS,j,0,z = TS,in,j,z j ∈ PS, z = 1, . . ., NFV
here
TS,j,,z is the temperature of droplets corresponding to sizeclass z in the phase j at residence time (K),
TV is the temperature of the vapour phase (K), h is the heat transfer coefficient (J/m2 s K), cp,dry,S,j,z is the specific heat capacity of dry droplets (J/kg K), cp,i is the specific heat capacity of liquid species i (J/kg K), �i is the latent heat of vapourisation of liquid species i (J/kg).
.3. Drying rate calculations
he unhindered drying rate is related to the driving force byhe following relationship:
unhindered,i = h
�i(TV − Twb,i) i ∈ CLV
here
Runhindered,i is the unhindered drying rate of species i per unitsurface area (kg/m2 s),
h is the heat transfer coefficient (J/m2 s K), �i is the latent heat of vapouristion of species i (J/kg)
TV is the vapour temperature (K), Twb,i is the wet bulb temperature of species i (K), CLV is the set of liquid components that can evaporate.
The wet bulb temperature is calculated from the followingquations.
TV,in − Twb,i
Hwb,i − Hin,i=[
TV,in − Tad,i
Had,i − Hin,i
]Pi
pwb,i = PHwb,i
MWi
MWV+ Hwb,i
pwb,i = exp
(Ai − Bi
Ci + Twb,i − 273.15
)i ∈ CLV
here
TV,in is the inlet temperature of the vapour (K), Tad,i is the adiabatic temperature of vapour with respect to
species i (K), Had,i is the adiabatic humidity of vapour with respect to
species i (kg/kg), Hin,i is the inlet humidity of the vapour with respect to
species i (kg/kg), Twb,i is the wet bulb temperature of the vapour with respect
to species i (kg/kg), Hwb,i is the wet bulb temperature of the vapour with respect
to species i (kg/kg), pwb,i is the vapour pressure of species i corresponding to the
wet bulb temperature (Pa), P is the pressure in the system (Pa), MWi is the molecular weight of species i (g/mol),
MWV is the molecular weight of the vapour (g/mol), Ai, Bi, Ci are Antoine equation parameters for species i (var-
• Pi is the psychrometric ratio for species i,• CLV is the set of liquid components that can evaporate.
The adiabatic temperature and adiabatic humidity areobtained by solving the following set of equations.
pad,i = exp
(Ai − Bi
Ci + Tad,i − 273.15
)
pad,i = PHad,i
MWi/MWV + Had,ii ∈ CLV
Rmax,i = FV,dry,in
( cp,i
�i
)(TV,in − Tad,i)
Rmax,i = FV,dry,in (Had,i − Hin,i)
where
• pad,i is the vapour pressure of species i at the adiabatic tem-perature (Pa),
• Rmax,i is the maximum drying rate (kg/s),• FV,dry,in is the dry inlet vapour mass flowrate (kg/s),• cp,i is the heat capacity of species i in the vapour phase
(J/kg K),• �i is the latent heat of vapourisation of species i (J/kg).
The heat transfer coefficient is calculated from the Nusseltnumber using the following equations. The Nusselt number is2 for drying of liquid droplets in a stagnant vapour medium.Therefore, these equations imply that the relative velocitybetween the droplets and the vapour is negligible.
Nu = 2 = hdp,in
kV
where
• Nu is the Nusselt number (dimensionless),• h is the heat transfer coefficient (J/m2 s K),• dp,in the initial droplet size (m),• kV is the thermal conductivity of the vapour phase (J/ms K),
The equilibrium dry basis moisture content of the solid isdetermined from the following relationship.
XS,eq,j,i = f (�i) i ∈ CLV, j ∈ PS
where
• XS,eq,j,i is the dry basis equilibrium moisture content of liquidspecies i in solid phase j (kg/kg dry solid),
• ˚i is the relative humidity of liquid species i in the vapourphase (kg/kg),
• f(˚i) is the sorption isotherm,• PS are the droplet phases considered.
�i = pi
psat,ii ∈ CLV
634 chemical engineering research and design 9 2 ( 2 0 1 4 ) 619–634
References
Bayvel, L., Orzechowski, Z., 1993. Liquid Atomization. New York,Taylor and Francis.
Charlesworth, D.H., Marshall, W.R., 1960. Evaporation from dropscontaining dissolved solids, part 1. AIChE J. 6 (Part 1), 9–30.
Cheong, H.W., Jeffryes, G.V., Mumford, C.J., 1986. A recedinginterface model for the drying of slurry droplets. AIChE J. 32,1334–1346.
Handscomb, C.S., Kraft, M., Bayly, A.E., 2009a. A new model forthe drying of droplets containing suspended solids. ChemicalEngineering Science 64, 628–637.
Handscomb, C.S., Kraft, M., Bayly, A.E., 2009b. A new model forthe drying of droplets containing suspended solids after shellformation. Chemical Engineering Science 64, 228–246.
Keey, R., 1972. Drying; Principles and Practice. Pergamon Press,Oxford.
Kemp, I.C., Oakley, D.E., 2002. Modelling of particulate drying intheory and practice. Drying Technology 20 (9), 1699–1750.
Kemp, I.C., Bahu, R.E., Oakley, D.E., 1991. Modelling verticalpneumatic conveying dryers. In: Mujumdar, A.S., et al. (Eds.),Drying ’91, 7th Int. Drying Symp. Prague, Czechoslovakia,August 1990. Elsevier, pp. 217–227, ISBN 0444893520.
Kemp, I.C., Wadley, R., Hartwig, T., Cocchini, U., See-Toh, Y.,Gorringe, L., Fordham, K., Ricard, F., 2013a. Experimental studyof spray drying and atomization with a two-fluid nozzle toproduce inhalable particles. Drying Technology 31 (8), 930–941.
Kemp, I.C., Hartwig, T., Hamilton, P., Wadley, R., Bisten, A., 2013b.Spray drying of fine particles from organic solvents at small
and large scale. In: Paper accepted for Eurodrying’13Conference, Paris, October.
Lefebvre, A.H., 1988. Atomisation and Sprays. Hemisphere, NewYork, ISBN: 978-0891166030.
Lefebvre, A.H., 1991. Twin-fluid atomization: factors influencingmean drop size. In: Keynote lecture, IClass-91: Proc. 5th Intl.Conf. on Liquid Atomization and Spray Systems, July 15–18,Gaithersburg, US, pp. 49–64.
Livesley, D.M., Oakley, D.E., Gillespie, R.F., Elhaus, B., Ranpuria,C.K., Taylor, T., Wood, W., Yeoman, M.L., 1992. Developmentand validation of a computational model for spray-gas mixingin spray dryers. In: Mujumdar, A.S. (Ed.), Drying 92, Proc. 8thIntl. Drying Symp (IDS 92), Montreal, Canada. Elsevier, pp.407–416.
Marshall, W.R., 1954. Atomization and spray drying. ChemicalEngineering Progress and Mining Series 50, 2.
Masters, K., 1971. Spray Drying Handbook, 1st ed. Leonard HillBooks, London, pp. 201 (eq 6.88).
Pinto, M.A., Bermingham, S.K., Weinstein, B., Hecht, J.P., 2010. Anintegrated framework for model-based solids processengineering. In: AIChE Annual Meeting, Salt Lake City, USA.
Thybo, P., Hovgaard, L., Andersen, S.K., Lindeløv, J.S., 2008.Droplet size measurements for spray dryer scale-up.Pharmaceutical Development and Technology 13 (2),93–104.
Ullum, T., Sloth, J., Brask, A., Wahlberg, M., 2010. Predicting spraydryer deposits by CFD and an empirical drying model. DryingTechnology 28 (5), 723–729.
Walton, D.E., Mumford, C.J., 1999a. Spray driedproducts—characterization of particle morphology.Transactions of the Institution of Chemical Engineers, Part A77, 21–38.
Walton, D.E., Mumford, C.J., 1999b. The morphology ofspray-dried particles: the effect of process variables upon the
morphology of spray-dried particles. Transactions of IChemEPart A 77, 442–459.