30 TRANSPORTATION RESEARCH RECORD 1187 Development of an Expert System To Assist in the Interactive Graphic Transit System Design Process NATARAJAN JANARTHANAN AND JERRY B. SCHNEIDER Urban public transit plays a vital role in the functioning of most urban areas. Transit network design is one of the impor- tant components of urban transit planning. Because of the complexity of planning urban transit, the components can be best handled by using interactive graphic methods, coupled with ways to evaluate alternative transit network designs from multiple conflicting criteria. The research presented in this paper focuses on an investigation of the applicability of a knowledge-based expert systems (KBES) approach to increas- ing the productivity of the transit network design process. For this research, an interactive KBES, TNOP _ADVISOR, was developed to assist in the development of high-performance transit network designs. TNOP _ADVISOR provides advice about how to modify designs to obtain improved performance. A network simulation software package, Transit Network Optimization System (TNOP), prm·ides the capability for modifying and predicting the performance of these designs. Three tests are conducted using the interactive KBES and multicriteria evaluation capability as support tools for the conduct of a TNOP-based design process. The results show that the advice provided helped produce high-performance designs in all cases. Urban public transit usually plays a major role in the efficient functioning of most urban areas. To play this role properly, the transit system should be planned and oper- ated in the most efficient manner possible within the many existing constraints. Transit planning consists primarily of transit network design, network evaluation, and run cut- ting. Transit network design involves the design of routes, headways, layover times, and departure times, which to- gether determine patronage and loading patterns. Tradi- tionally transit network design work has been done using either heuristics or mathematical optimization techniques (1-9). In general, optimization techniques are applicable only to small networks. Heuristic methods are usually required for large networks because of the heavy computer time requirements of optimization techniques. Heuristic interactive graphics methods that allow on- line interaction between the user and the machine have been successfully employed recently in transit network N. Janarthanan, Puget Sound Council of Governments, 216 First Avenue South, Seattle, Wash. 98104. J. B. Schneider, Department of Civil Engineering, University of Washington, Seattle, Wash. 98195. design work (TNOP, EMME/2). Heuristic methods em- ploy empirically derived rules for a systematic search for near-optimal solutions. Interactive methods use human intuitive capabilities and knowledge to help search for the best solution. But such methods depend on the knowledge and experience of a very capable user. Such persons are rare. For this reason, interactive graphics may not always produce high-quality designs. The recently developed knowledge-based expert systems (KBES) approach in- volves capturing the domain knowledge of one or more experts and using it to structure a knowledge base that can then be consulted to obtain good advice about how to solve particular problems. This approach makes the ex- pertise of a few available to many and can substantially improve the productivity of the design process. KBES are widely used in medicine, engineering, and other fields, but they have not yet been used in transit network design. This research is designed to develop and apply the KBES meth- odology as an aid to the designer who wishes to make more productive use of the Transit Network Optimization System (TNOP) software. The major task of this research is to translate the knowl- edge and experience about designing transit systems, gained by the authors over several years of using TNOP for research and instructional activities, into a well-struc- tured knowledge base. When this is accomplished, less experienced and knowledgeable persons can make much more productive use of TNOP's many capabilities. The task is not to fully automate the design process but to provide a significant consultation capability that will make available a large quantity of expertise to anyone who wishes to use it. !NOP Overview TNOP consists of a large set of computer programs that are used to design and simulate the performance of alter- native bus and rail transit systems. An overview ofTNOP and its components is shown in Figure I (10). The system is designed to analyze fixed-route, fixed-schedule transit systems. It provides easily understood graphics displays
Transcript
30 TRANSPORTATION RESEARCH RECORD 1187
Development of an Expert System To Assist in the Interactive Graphic Transit System Design Process
NATARAJAN JANARTHANAN AND JERRY B. SCHNEIDER
Urban public transit plays a vital role in the functioning of most urban areas. Transit network design is one of the important components of urban transit planning. Because of the complexity of planning urban transit, the components can be best handled by using interactive graphic methods, coupled with ways to evaluate alternative transit network designs from multiple conflicting criteria. The research presented in this paper focuses on an investigation of the applicability of a knowledge-based expert systems (KBES) approach to increasing the productivity of the transit network design process. For this research, an interactive KBES, TNOP _ADVISOR, was developed to assist in the development of high-performance transit network designs. TNOP _ADVISOR provides advice about how to modify designs to obtain improved performance. A network simulation software package, Transit Network Optimization System (TNOP), prm·ides the capability for modifying and predicting the performance of these designs. Three tests are conducted using the interactive KBES and multicriteria evaluation capability as support tools for the conduct of a TNOP-based design process. The results show that the advice provided helped produce high-performance designs in all cases.
Urban public transit usually plays a major role in the efficient functioning of most urban areas. To play this role properly, the transit system should be planned and operated in the most efficient manner possible within the many existing constraints. Transit planning consists primarily of transit network design, network evaluation, and run cutting. Transit network design involves the design of routes, headways, layover times, and departure times, which together determine patronage and loading patterns. Traditionally transit network design work has been done using either heuristics or mathematical optimization techniques (1-9). In general, optimization techniques are applicable only to small networks. Heuristic methods are usually required for large networks because of the heavy computer time requirements of optimization techniques.
Heuristic interactive graphics methods that allow online interaction between the user and the machine have been successfully employed recently in transit network
N. Janarthanan, Puget Sound Council of Governments, 216 First Avenue South, Seattle, Wash. 98104. J. B. Schneider, Department of Civil Engineering, University of Washington, Seattle, Wash . 98195.
design work (TNOP, EMME/2). Heuristic methods employ empirically derived rules for a systematic search for near-optimal solutions. Interactive methods use human intuitive capabilities and knowledge to help search for the best solution. But such methods depend on the knowledge and experience of a very capable user. Such persons are rare. For this reason, interactive graphics may not always produce high-quality designs. The recently developed knowledge-based expert systems (KBES) approach involves capturing the domain knowledge of one or more experts and using it to structure a knowledge base that can then be consulted to obtain good advice about how to solve particular problems. This approach makes the expertise of a few available to many and can substantially improve the productivity of the design process. KBES are widely used in medicine, engineering, and other fields, but they have not yet been used in transit network design. This research is designed to develop and apply the KBES methodology as an aid to the designer who wishes to make more productive use of the Transit Network Optimization System (TNOP) software.
The major task of this research is to translate the knowledge and experience about designing transit systems, gained by the authors over several years of using TNOP for research and instructional activities, into a well-structured knowledge base. When this is accomplished, less experienced and knowledgeable persons can make much more productive use of TNOP's many capabilities. The task is not to fully automate the design process but to provide a significant consultation capability that will make available a large quantity of expertise to anyone who wishes to use it.
!NOP
Overview
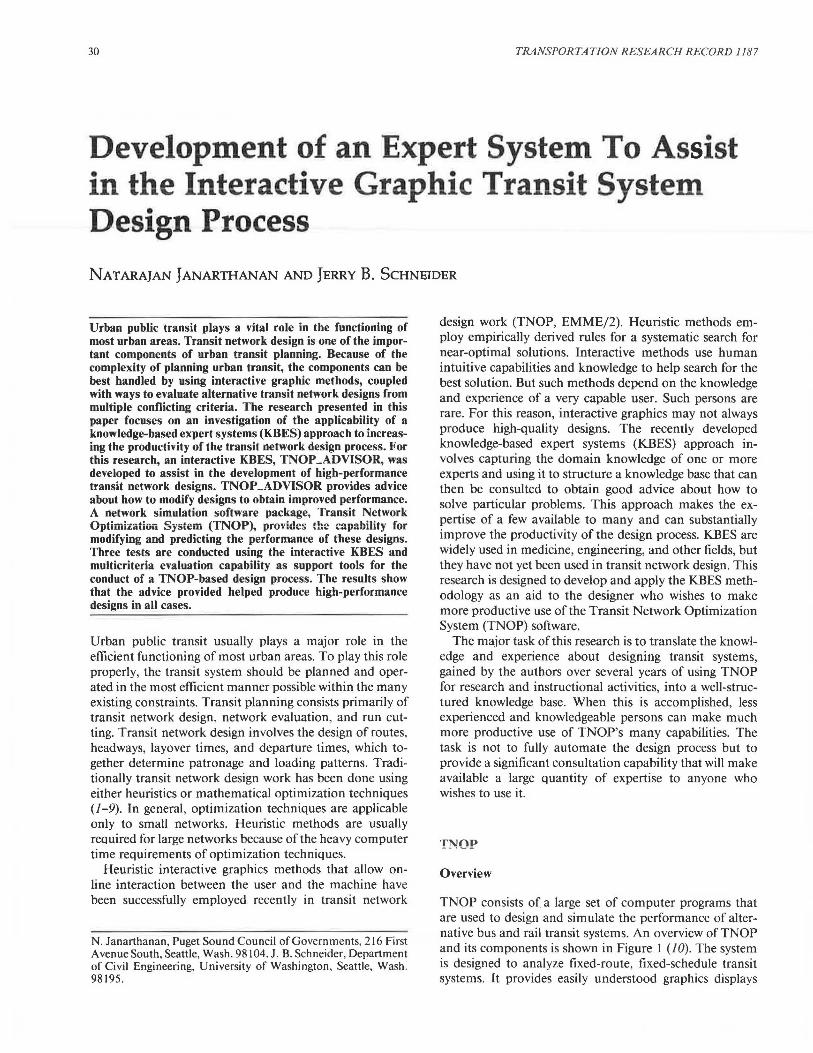
TNOP consists of a large set of computer programs that are used to design and simulate the performance of alternative bus and rail transit systems. An overview ofTNOP and its components is shown in Figure I (10). The system is designed to analyze fixed-route, fixed-schedule transit systems. It provides easily understood graphics displays
Janarthanan and Schneider
A DATA BASE
·(Stored on disk)
Base Network Transit Demand (O-D Matrix) Vehic le Characteristics Geographic References Calibration Coefficients
0 RESULTS AND
EVALUATION INDICATORS
(Displayed interactively)
Rid ership Maps and Table s • Network Load ing s * Line Loadings * Transfer Volumes
that can be accessed via a user-friendly interface. The interactive graphics system allows the transit planner to examine a wide range of design alternatives and compare their performance to find successively better ways of providing transit services that closely match a particular origin and destination demand pattern.
TNOP was developed in Switzerland by Rapp and others in the late 1970s. The PRIME version is used by the Civil Engineering Department at the University of Washington. The input-output functions and interactive modules were modified to suit CYBER requirements. More modifications were made to eliminate a few bugs and to provide easier access to any menu item in the program. The CYBER version of the program has nearly 100 subroutines and requires 43 working files.
Design Process
The design process supported by TNOP is shown schematically in Figure 2.
Step l: Input all data and verify them by using the data analysis modules. Use trip desire lines, production and attraction plots, and travel time contour maps to gain familiarity with the data and check for data errors.
Step 2: Define the transit routes, one by one, using the design menus.
Step 3: Specify the service attributes for each route, including headway and the numbers and types of transit vehicles to be used.
Step 4: Assign the trips on the specified transit network. Step 5: Review the areawide performance values, transit
link-load patterns, and other performance measures by using the many tabular and graphics displays. Optimize the headways by comparing the total capacity on the line with the maximum load.
Step 6: If the current design needs changes, repeat Steps 2 through 6.
Step 7: Perform timetable optimization.
By using TNOP, high-performance designs are achieved by a trial-and-error process supported by computer graphics and guided by human intuition as it is shaped by human pattern recognition and other t.hinking and analytical capabilities. After seeing and thinking about these results, users must select some design modifications that they think will produce better performance measures. This normally involves making some route and service attribute changes. This modified design is then evaluated and the same analysis and modification process is repeated.
Figure 2 clearly indicates the importance of the user's hand in the design process. The user has to interact at every level and make decisions about the input or the next module to be invoked. The user needs to make many decisions, and a user with no or minimal experience will have problems making good decisions. Assisting the user by giving suggestions about some of the input to or analysis of the design will be extremely useful. This will help the user make fasi an<l guu<l <lel:isiuus ihai wiH lead to a design with improved performance. A good KBES can help to achieve this goal.
REVIEW OF KBES
KBES is one of the results of applications of artificial intelligence (Al) research to software programming. Arti-
ficial intelligence is a branch of computer science that studies ways of enabling computers to do tasks that appear to require human intelligence (11). Expert systems are named for their essential characteristic: they provide advice for problem solving that is derived from the knowledge of experts. Expert systems typically use a set of rules and facts to make inferences that are reported as conclusions. The inference process relies heavily on theories of logical deduction (12). The objective uf au expert system is to help the user choose among a limited set of options, within a specific context, from information that is more likely to be qualitative than quantitative.
Expert systems have become popular recently and have been successfully applied in many fields. This includes diagnosing infectious diseases [MYCIN (13)] , finding the structure of chemical compounds [DENDRAL (14)], per-
Janarthanan and Schneider
forming mathematical symbol manipulations [MACSYMA (15)], and exploring for minerals [PROSPECTOR (16)]. In addition, expert systems are available to assist in analyzing land use laws and other legal issues (17), determine whether a proposed land use meets zoning and other local land use regulations, give advice on building regulations, or estimate probable damage to property in the event of natural catastrophe.
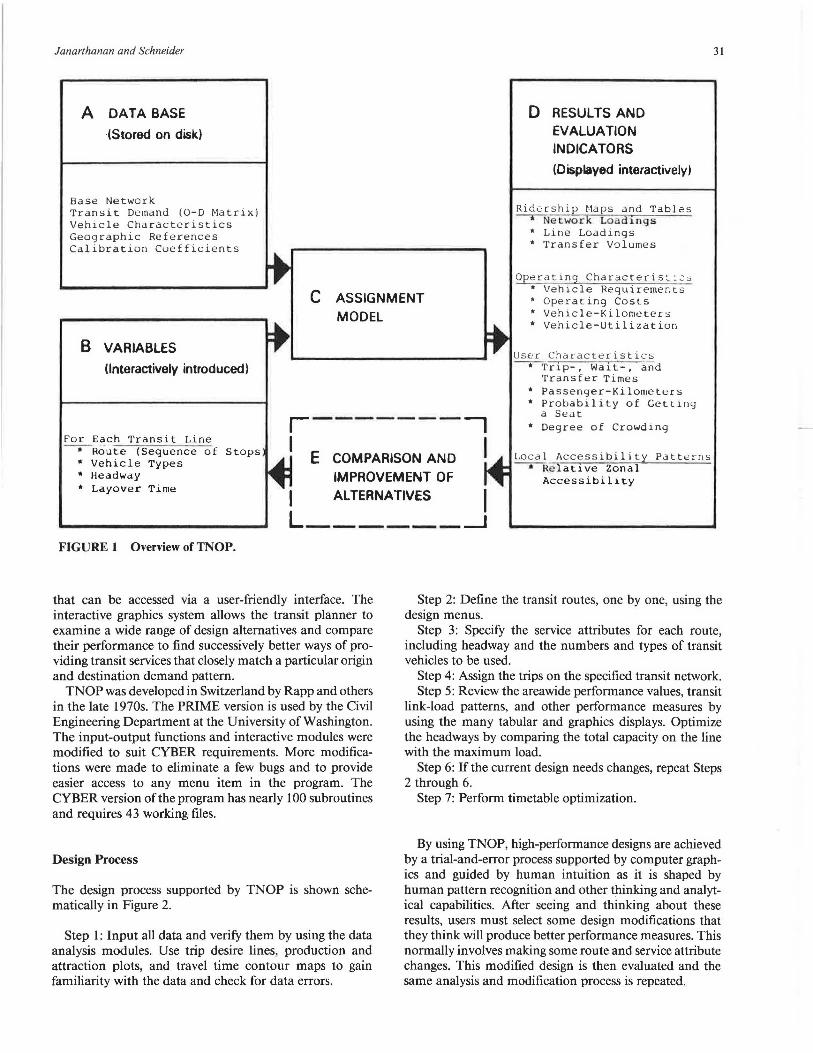
The framework for an expert system primarily consists of the knowledge base, inference engine or inference machine, context or working memory, explanation module, and user interface. Figure 3 shows the components of an expert system. The collection of facts, rules, and computational procedures that represent the domain is called its knowledge base; it is the power base of the expert system. The set of procedures for manipulating the information in the knowledge base to reach conclusions is called the control mechanism, or inference engine. The objective of the inference engine is to find one or more conclusions for a subgoal or for a main goal of the consultation. It searches the facts and rules in the knowledge base and identifies and stores conclusions to use in new facts for subsequent inferencing. The context or working memory contains all the information derived from the inferencing process. This information describes the problem being solved, the rules that have been "fixed," and the conclusions derived from them. The explanation module contains explanations for every inference made or piece of advice given. The user interface provides for a dialogue between human and machine.
Knowledge acquisition and representation are the most difficult parts of building an expert system. They often require the knowledge engineer to interact intensely with one or more experts in the application domain. Not all problems are suitable for expert systems. For successful application, there must be an expert or experts in the domain, and the problem should be specialized. The expert selected must be able to articulate the special knowledge needed to solve problems in the domain. If this problem
Expert(s)
Knowledge base/ Cache Memory
Advices
33
solving involves the use of rules of thumb or symbolic reasoning, an expert system might be appropriate and helpful.
APPLICABILITY OF EXPERT SYSTEMS TO TRANSIT NETWORK DESIGN
A conventional interactive approach to transit network design using TNOP is shown in Figure 4. A successful design will depend on the knowledge and intuitive skill of the user, who must conduct a cumbersome iterative search process that may or may not produce a better design. Also, this traditional approach is user dependent and lacks consistency and reliability. These problems can be solved by the expert systems approach, by which available design expertise is transformed into a visible format so it can be used and maintained by nonexpert designers.
Transit network design problems are suited to a KBES approach because it is heuristic, has no explicit solution steps, and requires domain knowledge to solve the problem. It takes quite a few years of experience for an average user to build domain knowledge. Developing a KBES to assist in transit network design will help the nonexpert users find high-performance designs quickly.
The expert systems approach captures the knowledge of one or more experts and uses it to solve similar problems to eliminate the user-dependency factor in solving the design problem. Figure 5 shows the role of the expert system in solving transit network design problems. This interactive method uses a knowledge base to identify the ways to improve the network design. The various performance measures and attributes of a transit network design will be passed through the KBES to identify the flaws in the design and generate advice about how to improve it. This iterative process will stop when the user finds a satisfactory transit network design or the KBES can provide no further advice that is feasible within the constraints of the problem.
FIGURE 3 Components of an expert system.
34
INTERACTIVE APPROACH TO TRANSIT NETWORK DESIGN USING TNOP AND TNOP _ADVISOR
This section presents the knowledge-based interactive approach to transit network design. The methodology uses TNOP (a simulation model), TNOP _ADVISOR (a KBES), and CONCORD_NL (a nonlinear concordance analysis method for comparing and ranking alternatives). A software package called PRISM was also developed to select and arrange the results from a TNOP run to enter into TNOP _ADVISOR. The knowledge base consists of many knowledge subbases, which are discussed in detail. The proposed methodology is tested in three different test networks, and the results are reviewed and analyzed.
Development of the Knowledge Base TNOP _ADVISOR
A knowledge base is the main component of an expert system. In this research, the knowledge base includes the knowledge to design an efficient transit network using TNOP. The knowledge base must be structured to use the full design capabilities of TNOP and recognize its constraints. The following section discusses in detail the analysis of design strategy using TNOP.
Input
TNOP Human lnteraclion
Output
FIGURE 4 Conventional approach to transit network design.
c~' lnpu-' ~
TRANSPOR TATION RESEARCH R ECORD 1187
Analysis of Design Strategy Using TNOP
The main inputs for TNOP are the base network, transit mode demand pattern, TNOP model parameters, line definition, and service attributes. For a given design problem the base network, demand pattern, and model parameters are fixed. These fixed parameters are difficult to change without making planning changes. Planning changes normally include changes in routes and are often not possihle except for minor extensions or reductions in existing routes. In real-world problems, it is easier to extend or add new routes than it is to shorten or remove routes. The variable parameters in TNOP are mainly service attributes such as headway, vehicle type, layover, and departure times on routes. These variables determine the operational attributes of the transit system. The knowledge base developed in this research focuses on generating improved designs by making only operational changes. The implications of changing these variables on the performance of a transit system will be explained.
Changes in the headway on a route affect the frequency, waiting time, number of vehicles required, operating cost, and route use. One of the constraints attached to modifying headways is that they must satisfy policy headways. The objective of making headway changes is to achieve optimal capacity conditions on a given route in order to match the maximum link load on the route. If a given route has a prespecified policy headway, an optimal headway can be suggested only when it is shorter (i.e., better) than the policy headway. A change in vehicle type can also help to increase the vehicle use on the route. This will have a direct impact on route and system use and operating costs. Changes in layover time will change vehicle requirements and operating costs. Departure time changes will affect the transfer delay performance of the system.
When operational changes are allowed, advice will be given about how to modify one or more of the variable parameters. When planning changes are allowed, general advice will be given about how to modify one or more routes. The knowledge base will be able to handle two situations: when planning changes are allowed and when they are not. A constraint inherent in using TNOP is that a mix of different vehicle types cannot be used on a given route. TNOP provides various statistics and graphic dis-
~ -----~
TNOP Human Interaction
Output Facts
FIGURE 5 Expert system approach to transit network design.
Janarthanan and Schneider
plays to aid in the evaluation of a network design. All the statistics will be analyzed to get an accurate and detailed description of a design for use by the knowledge base, which performs the inferencing task and generates design modification advice.
Description of Expert System Shell RUNNER
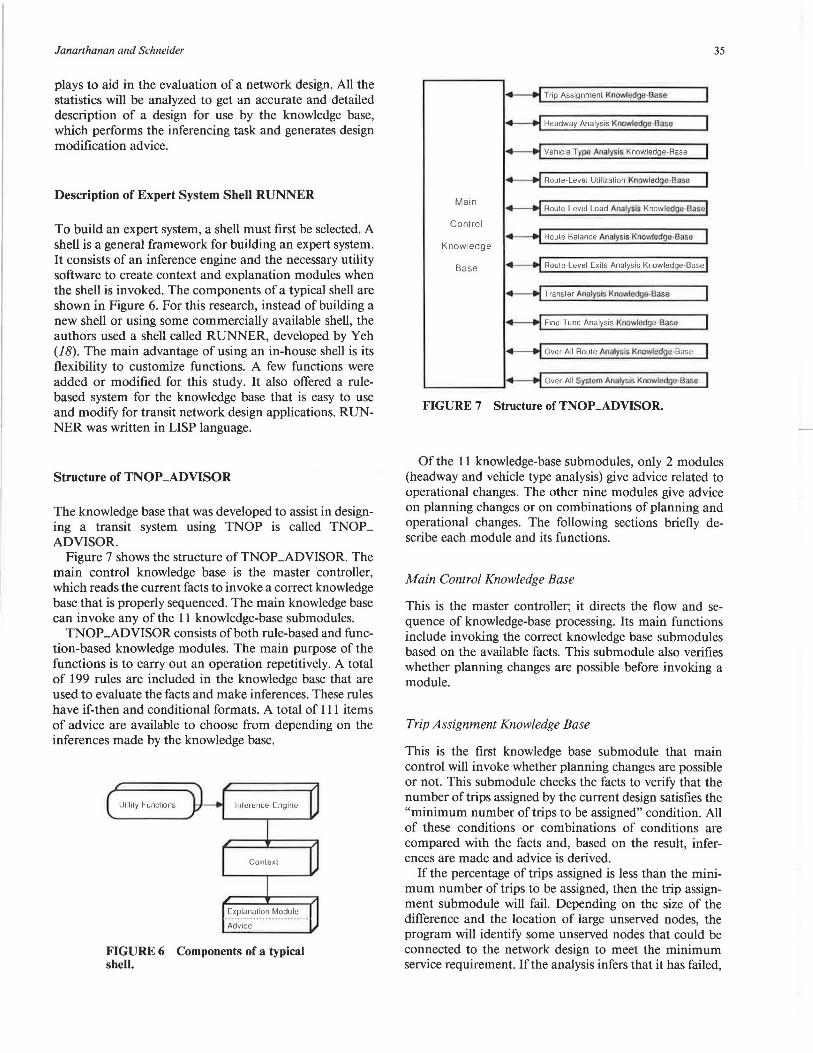
To build an expert system, a shell must first be selected. A shell is a general framework for building an expert system. It consists of an inference engine and the necessary utility software to create context and explanation modules when the shell is invoked. The components of a typical shell are shown in Figure 6. For this research, instead of building a new shell or using some commercially available shell, the authors used a shell called RUNNER, developed by Yeh (18). The main advantage of using an in-house shell is its flexibility to customize functions: A few functions were added or modified for this study. It also offered a rulebased system for the knowledge base that is easy to use and modify for transit network design applications. RUNNER was written in LISP language.
Structure of TNOP _ADVISOR
The knowledge base that was developed to assist in designing a transit system using TNOP is called TNOP _ ADVISOR.
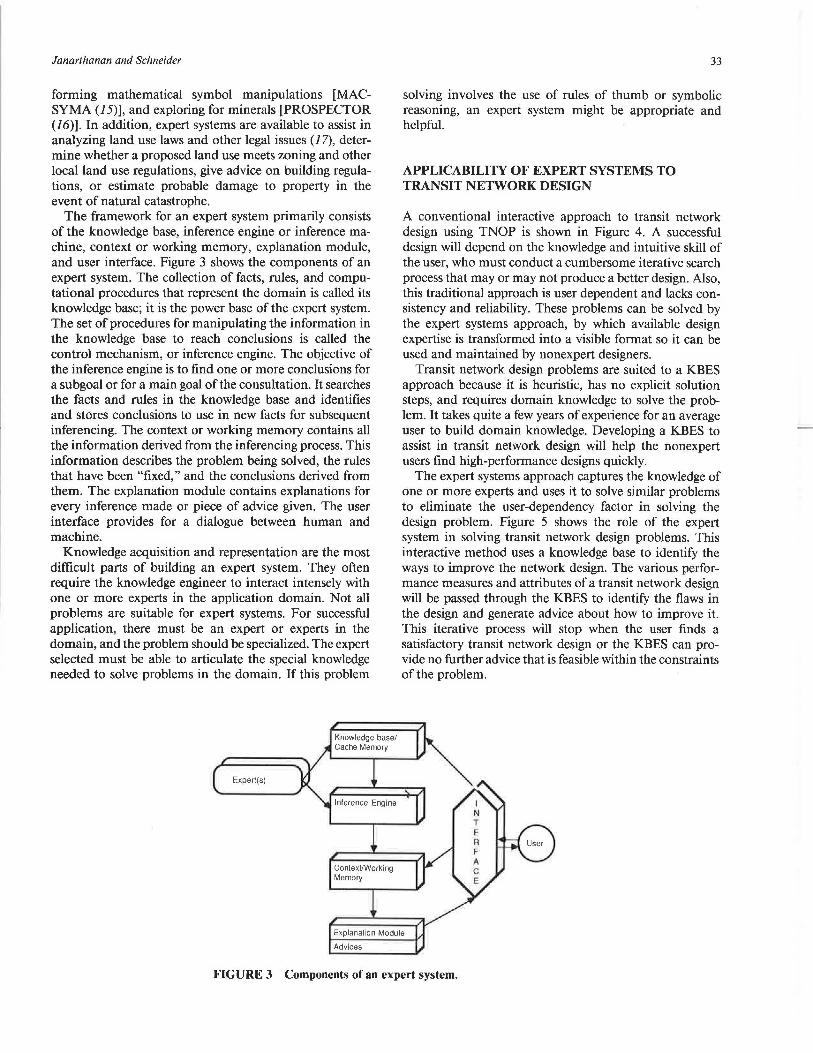
Figure 7 shows the structure ofTNOP _ADVISOR. The main control knowledge base is the master controller, which reads the current facts to invoke a correct knowledge base that is properly sequenced. The main knowledge base can invoke any of the 11 knowledge-base submodules.
TNOP _ADVISOR consists of both rule-based and function-based knowledge modules. The main purpose of the functions is to carry out an operation repetitively. A total of 199 rules are included in the knowledge base that are used to evaluate the facts and make inferences. These rules have if-then and conditional formats. A total of 111 items of advice are available to choose from depending on the inferences made by the knowledge base.
Ut1lily Func1ions lnlerence Engine
Conte xi
Explanation Module
FIGURE 6 Components of a typical shell.
35
+-..j Trip Assignment Knowledge-Base
+-..j Headway Analysis Knoyiledge-Base
+-..j Vehicle Type Analysis Knowledge-Base
+-..j Roule-Level Ulilizalion Kn1>Wladga-Baso
Main 4----..j Roule-Level Load Analysis Knowledge-Basel
Of the 11 knowledge-base submodules, only 2 modules (headway and vehicle type analysis) give advice related to operational changes. The other nine modules give advice on planning changes or on combinations of planning and operational changes. The following sections briefly describe each module and its functions.
Main Control Knowledge Base
This is the master controller; it directs the flow and sequence of knowledge-base processing. Its main functions include invoking the correct knowledge base submodules based on the available facts. This submodule also verifies whether planning changes are possible before invoking a module.
Trip Assignment Knowledge Base
This is the first knowledge base submodule that main control will invoke whether planning changes are possible or not. This submodule checks the facts to verify that the number of trips assigned by the current design satisfies the "minimum number of trips to be assigned" condition. All of these conditions or combinations of conditions are compared with the facts and, based on the result, inferences are made and advice is derived.
If the percentage of trips assigned is less than the minimum number of trips to be assigned, then the trip assignment submodule will fail. Depending on the size of the difference and the location of large unserved nodes, the program will identify some unserved nodes that could be connected to the network design to meet the minimum service requirement. If the analysis infers that it has failed,
36
further analysis will stop. Advice will be given about how to redesign the route structure by adding more nodes.
Headway Analysis Knowledge Base
This knowledge base checks the existing headway, vehicle type, and maximum loading on each route. If the maximum loading does not match the capacity provided, the knowledge base will generate advice on what optimum headway to use. It will also check whether the route has a policy headway, and appropriate advice will be given based on whether the optimum headway is less or more than the policy headway. In addition, a layover time will be suggested. If the optimum headway necessary for the given vehicle type is less than I min, advice will be given to use a different vehicle type having a much higher capacity. If that is not possible, advice will be given to make planning changes, such as changing the route structure.
If a system has even one route with nonoptimal headway (when there is possible and feasible change on that route), the headway analysis will be considered failed and further analysis will stop. Because further analysis and advice will not be based on optimal headway condition, this approach is followed.
Vehicle Type Analysis Knowledge Base
This knowledge base scans various available vehicle types and their capacities. It also checks each route for the vehicle type used and how closely this matches maximum loading conditions. If another vehicle type can provide optimal capacity conditions, then it will be recommended. Along with the recommended optimal vehicle type, the optimal headway for that vehicle type and layover time will be suggested. The rules reflect the view that providing 90 percent of capacity (slightly underloaded) is better than providing 110 percent (slightly overloaded) in order to optimize resources and allow for better use.
Route Balance Analysis Knowledge Base
This analysis is carried out only for two-way routes. It compares the loadings in one direction along the route with those in the other direction. Consider an example of a two-way route with five links. The link loads in Direction A are compared with the loads in Direction B. The advice is based on the ratio of total link load in one direction to iuiai iiuk iuau iu iht:: uiirt::1. Tht:: raiiu is cah:uiait::u uy dividing the smaller load by the larger load. A ratio of 0. 9 or higher indicates a very well balanced condition. When the ratio lies between 0.75 and 0.9, the route is judged to have an acceptable balance condition. Previous experience has shown that if the ratio is less than 0.75, the route is poorly balanced and will have very low use and will decrease the overall loading performance of the system.
TRANSPORTATION RESEARCH RECORD 1187
The purpose of this analysis is to identify two-way routes with directional loading problems. Many times, a two-way route may be efficient in only one direction. This will reduce drastically the average and also systemwide use of the route. The advice ranges from adding more origins and destinations to the weaker direction to converting it into a one-way route.
Average Utilization Analysis Knowledge Base
This analysis is directed toward the identification of routes with below-average use. Above-average use on a route indicates that the route has better loading (link loads) and headways than does the areawide average. An optimal headway gives minimum operating costs in many instances. By identifying the routes with below-average use, advice can be derived about improving it. The advice includes planning changes like adding or deleting links or dropping the route altogether. This knowledge base will not analyze a route if it has a policy headway.
Maximum Load to Average Load Analysis Knowledge Base
Two useful indicators of route performance are maximum load and average load. The average load gives the overall estimate ofload conditions on a route, whereas maximum load identifies the maximum load on a particular link in the route being examined. The maximum load governs the optimal headway calculations. When the difference between the maximum load and average load is high, it indicates that the route needs higher capacity to serve only the maximum link, because many other links do not need more capacity. A high ratio indicates that the route is not efficient and needs improvement.
This knowledge base examines the average and maximum loads of each route, and the ratio of maximum load to average load is calculated. If this ratio is greater than 2.25, the route is bad and needs planning changes. It should be redesigned or dropped from the system. If the ratio is less than 1.50, the route is good. If the ratio lies between 1.50 and 2.25, the route is acceptable, but only a few routes can be in this condition. These boundary numbers are derived from previous experience that was used to define the rules in the knowledge base.
Exit Analysis Knowledge Rase
The link loads and exit patterns of a route indicate how !1t::4ut::uiiy a ruuit:: is useu. Fur exampie, a rome with few exits and a large number of heavy link loads is one over which people travel longer distances, compared with routes where there are many exits and few heavily loaded links. From previous design experience with TNOP, it was found that the ratio of total link loads (sum of all link loads) on a route to total number of exits yields a useful indicator of whether the route serves short or long trips.
Janarlhanan and Schneider
Transfer Analysis Knowledge Base
A transfer analysis involves examination of the number and spatial pattern of transfers in the system. The number of transfers in a transit system is a valuable performance indicator. A large number of transfers (greater than 1.0 per passenger) indicates that many people have to use more than one route to reach their destination. A small value indicates that routes are laid out well and that many passengers do not have to transfer to reach their destination. But in many cases, to obtain operational efficiency when there is not enough demand, making passengers transfer from one route to another is necessary. This knowledge base looks at the total number of transfers in the system and the permitted (designer specified) number of transfers in the system. Advice is given based on the ratio of actual to permitted number of transfers in the system. If the number of transfers exceeds the required limit, the advice identifies which nodes have the most transfers. Recommendations are also given that such nodes be analyzed in detail to see how transfers could be reduced. This module does not provide specific advice because knowledge about how to achieve transfer reductions is still limited. The user needs to consider many things, because it is necessary to modify the route structures to obtain transfer volume reductions. Making planning changes may be the only way possible to obtain a reduction in transfer volumes at particular locations.
Fine-Tune Knowledge Base
This module provides system-level advice. The analysis includes both average walk time and the ratio of in-vehicle to out-of-vehicle travel time. A high areawide average walk time means that people spend considerable time walking to and from transit stops. The advice varies, depending on whether the average walk time is less than 5 min, between 5 and 11 min, or greater than 11 min.
To study the relationship between in-vehicle and outof-vehicle time, the ratio of in-vehicle to total travel time (in-vehicle+ out-of-vehicle time) is used. The ratio has a theoretical maximum of 1.0. The closer the value is to 1.0, the better the route. From previous design experience, several rules were derived and incorporated into the knowledge base. The advice includes operational changes, like lower headways on routes, or planning changes, like modifications to route locations.
Overall Advice Expert Knowledge Base
There are two knowledge bases in this category. One gives advice on overall route conditions, and the other gives advice on overall system conditions. These modules combine the inferences made by other knowledge bases and make inferences on the overall route and system conditions. Overall route-level advice is based on the inferences
37
from the utilization, maximum load to average load balance, and exits analyses. A route that has good performance for all these indicators gets a good mark on overall condition. Overall system-level advice is given from inferences derived from average use, overall route conditions, and inference results from the fine-tune analysis.
Full-Design Improvement
A user can specify either full design improvement or conditional design improvement as a goal for the knowledge base. In full-design improvement mode, the facts of a given design will be passed through all the knowledge base modules (subject to the conditions of each knowledge base), inferences will be made, and advice will be generated. Figure 8 shows the flowchart of full-design improvement. In full-design improvement mode, the user has the flexibility of skipping any particular knowledge base by specifying appropriate facts and conditions as input before starting the TNOP _ADVISOR. If the focus is on a particular design improvement, the main control knowledge base will execute the knowledge base chosen by the user and then conclude the analysis.
Development of the PRISM Preprocessor
PRISM is a software package that extracts all the facts about a transit design from TNOP output. PRISM needs TNOP output, a demand matrix, and answers to a series of questions from the user. PRISM goes through the TNOP output, extracts the required facts about the design, and
Trip Asslgnmen1 Allalysls
Passed
Passed
Transfer Analysis
Stop
FIGURE 8 Flowchart of full-design improvement.
Failed
Failed
38
arranges them properly for reading by the knowledge base. The user needs to answer a few questions interactively about whether the goal is full-design improvement or conditional improvement, whether planning changes are possible or not, and so on. Figure 9 presents the structure of PRISM.
PRISM also analyzes the origin-destination matrix and identifies the origin and destination nodes not currently connected to the network.
CONCORD_NL (Multicriteria Evaluation Software)
CONCORD_NL is a computer program that was written to allow use of the concordance analysis procedure for evaluating alternative transit designs. Transit planning is one of many multicriteria problems that have conflicting goals. This means that better performance for one criterion often cannot be achieved without negatively affecting other criteria values. In addition to these inherent conflicts, the differing opinions of local government agencies, political groups, citizen groups, and system users have to be taken into account. In this research the recently developed CONCORD_NL (19) software, which is based on multicriteria evaluation methodology, is used.
TNOI-' Output
Demand Information Input User Interaction
Prism
OUTPUT
Design Goal
Design Condition
General Route Data
Trip Assignment Data
Headway Data
Vehicle Type Data
I Route Level Data
I Transfer Data
l Fine Tune Data
FIGURE 9 Role and output of PRISM.
TRANSPORTATION RESEARCH RECORD 1187
Concordance analysis is a multicriteria evaluation technique by which alternative plans are evaluated by a series of pairwise comparisons across a set of criteria. It is based on the Electre method originally developed in France. References to and discussions of the development of the Electre and concordance methods are presented by Nijkamp and Van Delft (20) and by Giuliano et al. (21). CONCORD_NL includes improvements in the normalization procedure by adding a nonlinear normalization method. Figure 10 presents a general framework for evaluating alternative transit network designs.
Testing of TNOP _ADVISOR
The knowledge base TNOP _ADVISOR was tested to evaluate its capabilities to produce advice that, when followed, would produce improved transit network designs. TNOP _ ADVISOR was tested on three different design problems. The first two design problems use the same network and demand pattern, and the third problem uses a different network and demand pattern. The first and third problems require that a new transit network be designed. The second problem involves application of TNOP _ADVISOR to an existing network design. The objective of this testing is to prove that TNOP _ADVISOR can handle different problems at different stages of design using different networks.
FIGURE 10 Framework for evaluation of transit system improvement alternatives.
Janarthanan and Schneider
In practice, it is often necessary to fine-tune an existing design to improve its performance or to accommodate base network or demand pattern changes, or both, from changes in population or employment.
Figure 11 presents the testing procedure used. The procedure consists of simulating the performance of an initial transit network design, using TNOP as the first step. TNOP can be used either to create a new design or to simulate an existing design. The design process requires the user to input network and demand data, define routes and service attributes, assign trips, and perform timetable optimization. At this point, the TNOP results are fed through PRISM to prepare the facts (performance data) about the design for input into the knowledge base of TNOP _ ADVISOR. TNOP _ADVISOR analyzes the design and gives advice about how to improve it. The user can either accept or reject this advice and modify the transit network design using the interactive graphics capabilities ofTNOP. The whole process can be repeated until the user is satisfied. Because the transit network design process does not use a mathematical optimization technique, the knowledge base will not decide when to stop; the user decides. The decision to stop is usually made when most of the routes attain satisfactory performance measures and when the advice provided does not refer to operational changes. The knowledge base will give specific advice on route- and system-level operational changes. Advice on planning changes is restricted to indicating the direction for possible changes, and it is up to the user to translate this advice into specific network changes. To show that by following the advice ofTNOP _ADVISOR better designs will result, the designs are processed through the CONCORD_NL concordance analysis program, and ranks are computed from the weighted multiple criteria.
39
Test Problem 1
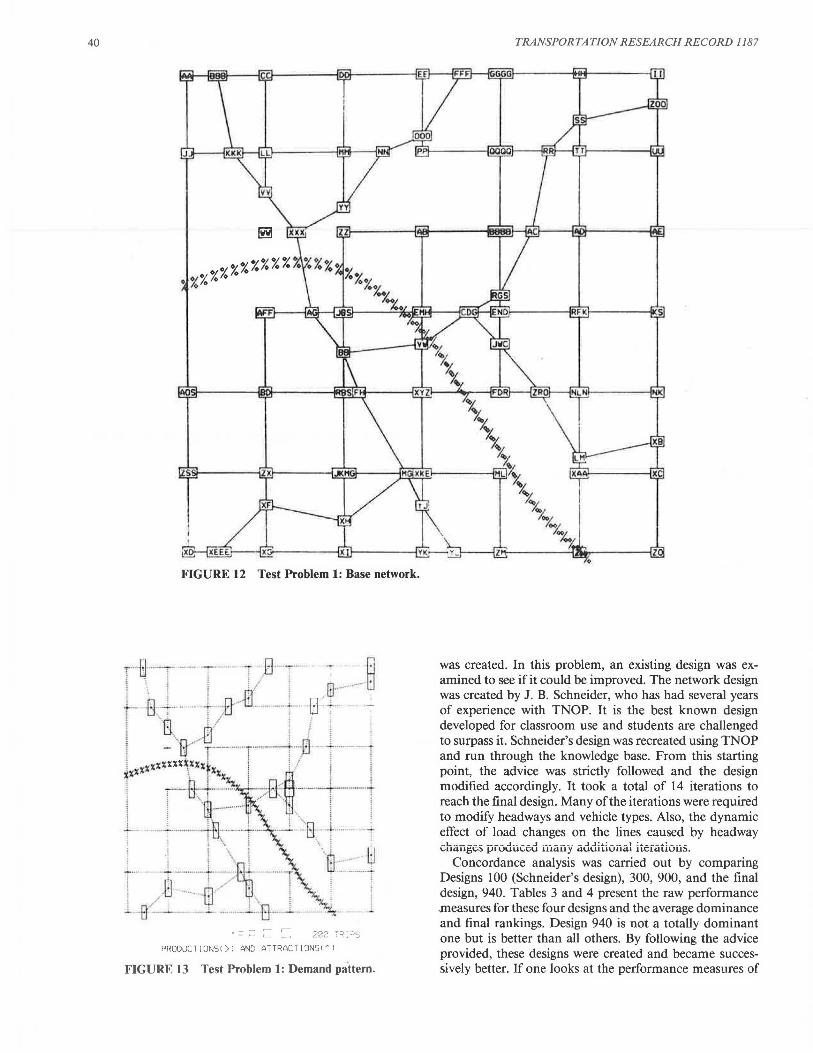
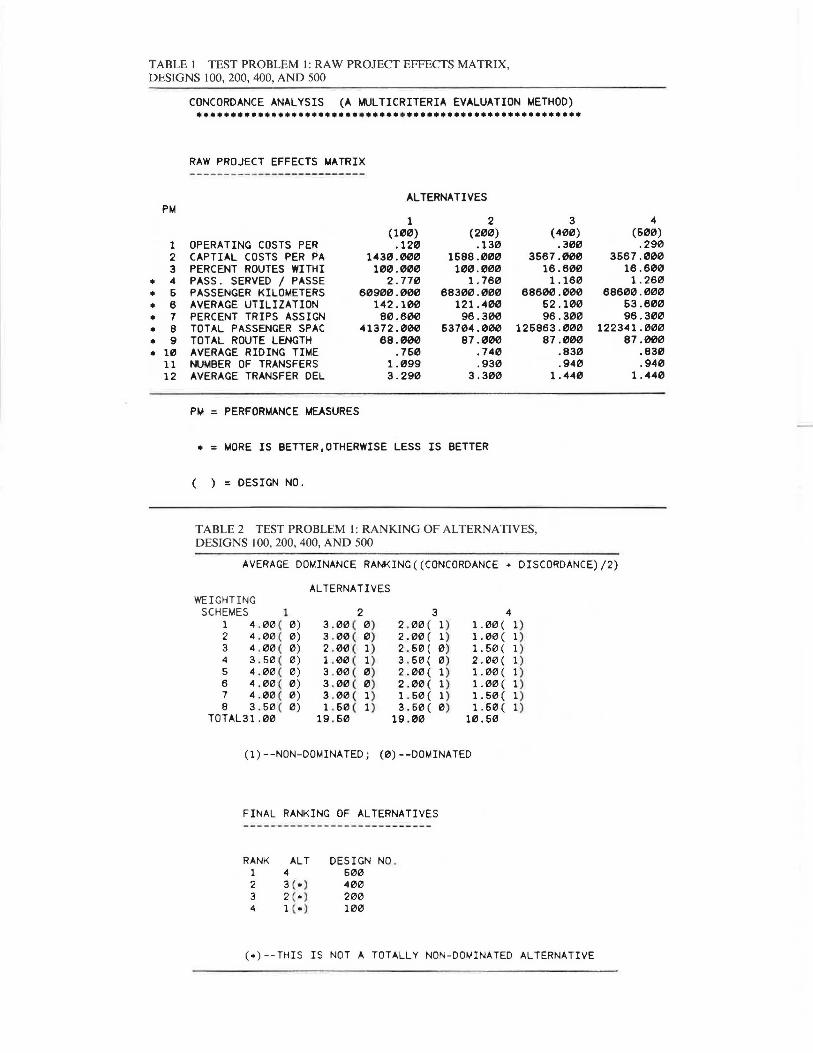
This problem represents a case in which a net design is to be developed. Figure 12 shows the transit network with node names. This network was designed by Rapp (10) as a tutorial network for TNOP software. It consists of 75 nodes and 388 one-way links. Figure 13 displays productions, attractions, and the demand pattern for this problem. The initial design created on this network consisted of five lines (routes). The objectives for this design problem are to serve at least 90 percent of the demand with a system on which the maximum capacity on any link is within 10 percent of the capacity of that route. Full-design improvement is invoked as a goal in the knowledge base, and it is assumed that planning changes are possible. These objectives are used for all the test problems.
The output from the first design (100) from TNOP was passed through PRISM to prepare the facts about the design; then TNOP _ADVISOR was invoked. It analyzed the design facts and used the rules to generate its advice. Design 100 was the initial (first-cut) design. From this starting point, TNOP _ADVISOR's advice was followed exactly to create the next three designs. Concordance analysis results show that each successive design was better than the previous design; this indicates that the advice provided was appropriate and productive. Tables 1 and 2 show the raw performance values, the average dominance ranking for eight weight schemes, and the final rankings for the four designs from the concordance analysis.
Test Problem 2
This design problem uses the same network and demand matrix used previously. In Test Problem 1, a new design
Existing Design
Weights and Normalization Parameters
Network and Demand Pattern
Test Problems 1 & 3
Pertormance Criteria Values
Evaluation Data and Rank~ of Designs
Test Problem 2
TNOP
Design Changes
FIGURE 11 Flowchart of procedure for testing TNOP _ADVISOR.
Facts
TNOP _ADVISOR
Knowledge Base
Inference Engine
Advice
40
FIGURE 12 Test Problem 1: Base network.
r -8-···-·T - ··· ~ fl 0 ! \ i I I / .' . ' 8"_ ..... -·-8 i B .. J.. ........ -+.. -11--·ffi . . ......... ;-.. B__: +·- - -
I T!i ~/ !;; -,_ .fJ ! ; !
1
, - f{"" r ------T--··-t-{l·-· i · ·~- 1 l.. I • • •
xxxxxxux\ xxxh ! ! _/ l i
x r- - &-+·-~'~"' ! -;fi~·ffi ·---.. -f--······· ...... + I i \rn-····""' ··' '·ID, ! i j _ -···· i ·-·---ffl-··-··· ! ··- .. I :8 _J........ . i
. ' ' . . . I
L. _i. __ ...... -. ..1._>:~l..--·-N-r \ru~ ... ==· ~. i Q r ""' ; • •
! / 0 .. · i]·/ ~ l '. I I -a: . . ... ' ·-····- ' ·fl·--_;_ . .;_
~=:::::: == ~= 222 :~::")s PROD0CTi ONSl) I AND ATTRACTIONSl•I
FIGURE 13 Test Problem 1: Demand pa.ttern.
TRANSPORTATION RESEARCH RECORD 1187
was created. In this problem, an existing design was examined to see if it could be improved. The network design was created by J. B. Schneider, who has had several years of experience with TNOP. It is the best known design developed for classroom use and students are challenged to surpass it. Schneider's design was recreated using TNOP and run through the knowledge base. From this starting point, the advice was strictly followed and the design modified accordingly. It took a total of 14 iterations to reach the final design. Many of the iterations were required to modify headways and vehicle types. Also, the dynamic effect of load changes on the lines caused by headway ~L~-~~- --~..l----...l ------ · -....:l..l.!..i..! ____ 1 _-:..._ ____ ... ~- ---\...lJCl.110~;:, }JlUUU\....c;U 1uaU.)' a.uu1uu11a.1 ll'G'.ldlJUU~.
Concordance analysis was carried out by comparing Designs 100 (Schneider's design), 300, 900, and the final design, 940. Tables 3 and 4 present the raw performance measures for these four designs and the average dominance and final rankings. Design 940 is not a totally dominant one but is better than all others. By following the advice provided, these designs were created and became successively better. If one looks at the performance measures of
TABLE I TEST PROBLEM I: RAW PROJECT EFFECTS MATRIX, DESIGNS 100, 200, 400, AND 500
PM
1 2 3
• 4 • 6 • 6 • 7 • 8 • 9 • 10
11 12
CONCORDANCE ANALYSIS (A MULTICRITERIA EVALUATION METHOD) •••••••••••••••••••••••• •••••• •••••••••••••••••••••••••••
RAW PROJECT EFFECTS MATRIX
OPERATING COSTS PER CAPTIAL COSTS PER PA PERCENT ROUTES WITH! PASS . SERVED /PASSE PASSENGER KILOMETERS AVERAGE UTILIZATION PERCENT TRIPS ASSIGN TOTAL PASSENGER SPAC TOTAL ROUTE LENGTH AVERAGE RIDING TIME NUMBER OF TRANSFERS AVERAGE TRANSFER DEL
PM = PERFORMANCE MEASURES
ALTERNATIVES
1 (1"0)
.120 1430. 000
100 . 000 2. 770
60900 . 000 142. 100 80.600
41372.000 68.000
.760 1.099 3.290
2 (200)
.130 1688.000
100 . 000 1 . 760
68300.000 121.400 96.300
63704.000 87.000
. 740
. 930 3 . 300
• = MORE IS BETTER,OTHERWISE LESS IS BETTER
= DESIGN NO .
3 ( 400)
.300 3667.000
16.600 1.160
68600.000 62.100 96.300
126863.000 87.000
. 830
.940 1.440
TABLE 2 TEST PROBLEM I: RANKING OF ALTERNATIVES, DESIGNS I 00, 200, 400, AND 500
4 (600)
.290 3667.000
16.600 1 . 260
68600.000 63.600 96.300
122341.000 87.000
.830
.940 1 . 440
AVERAGE DOMINANCE RANKING((CONCORDANCE + DISCORDANCE)/2)
(• ) --THIS IS NOT A TOTALLY NON-DO~INATED ALTERNATIVE
TABLE 3 TEST PROBLEM 2: RAW PROJECT EFFECTS MATRIX, DESIGNS 100, 300, 900, AND 940
PM
1 2 3
• 4 • 6 • 6 • 7 • 8 • 9 • 10
11 12
CONCORDANCE ANALYSIS (A MULTICRITERIA EVALUATION METHOD) •••••••••••••••••••••••••••••••••••••••••••••••••••••••••
RAW PROJECT EFFECTS MATRIX
ALTERNATIVES
OPERATING COSTS PER CAPTIAL COSTS PER PA PERCENT ROUTES WITH! PASS. SERVED / PASSE PASSENGER KILOMETERS AVERAGE UTILIZATION PERCENT TRIPS ASSIGN TOTAL PASSENGER SPAC TOTAL ROUTE LENGTH AVERAGE RIDING TIME NUMBER OF TRANSFERS AVERAGE TRANSFER DEL
1 (100)
.320 2953.000
60.000 1.900
45900.000 42.200 96.600
106316.000 134.000
.799
. 669 1. 471
PM = PERFORMANCE MEASURES
2 (300)
.310 2821.000
12.600 1.980
46900.000 43.900 96.600
101086.000 134.000
.796
.667 1.604
• = MORE IS BETTER,OTHERWISE LESS IS BETTER
DESIGN NO .
3 (900)
.250 2646.000
.000 2.230
46200.000 48.200 95.600
92711.000 134.000
. 770
.516 2.280
TABLE 4 TEST PROBLEM 2: RANKING OF ALTERNATIVES, DESIGNS 100, 300, 900, AND 940
4 (940)
.240 2597.000
.000 2.270
46200.000 49.300 96.600
90727.000 134.000
.770
.614 2.276
AVERAGE DOMINANCE RANKING((CONCORDANCE • DISCORDANCE)/2)
(•)--THIS IS NOT A TOTALLY NON-DOMINATED ALTERNATIVE
Janarthanan and Schneider
Designs 900 and 940, Design 940 has optimum vehicle types and headways on all lines, whereas Design 900 does not have optimal vehicle types on lines 1 and 2. Design 940 is cheaper and has better performance measures than Design 900. The results from this test problem also prove that TNOP _ADVISOR can be useful to fine-tune and improve an existing design as well as create a new design.
Test Problem 3
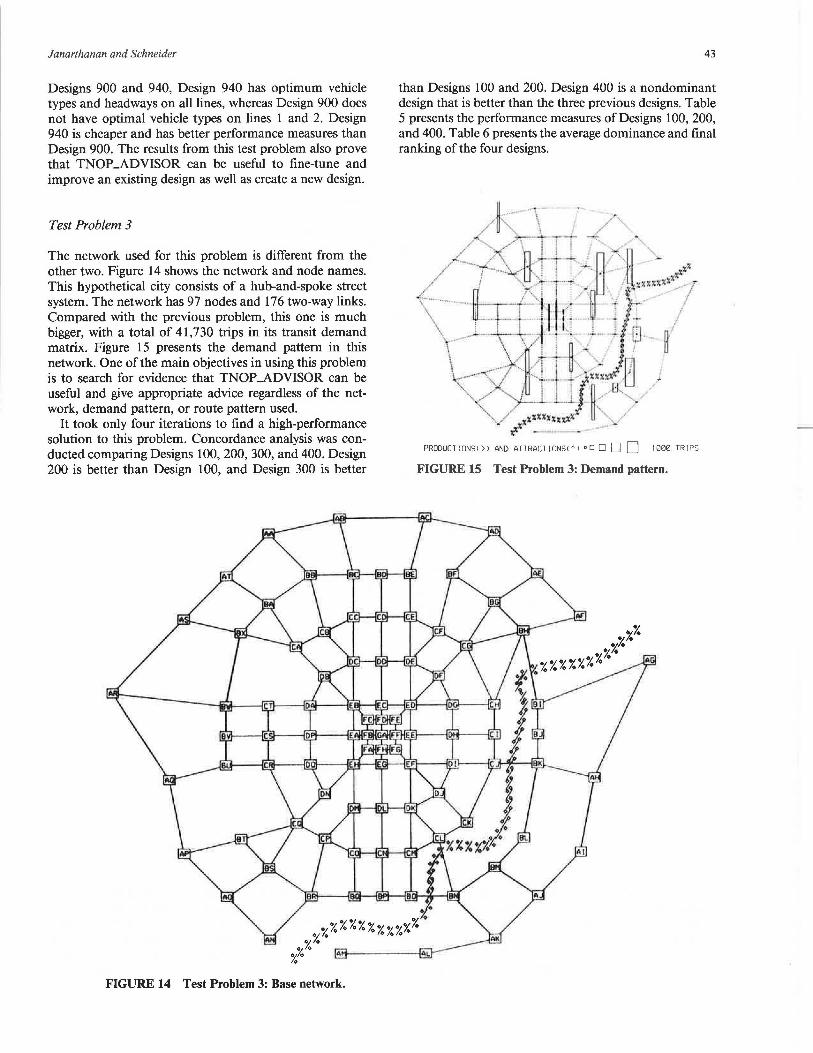
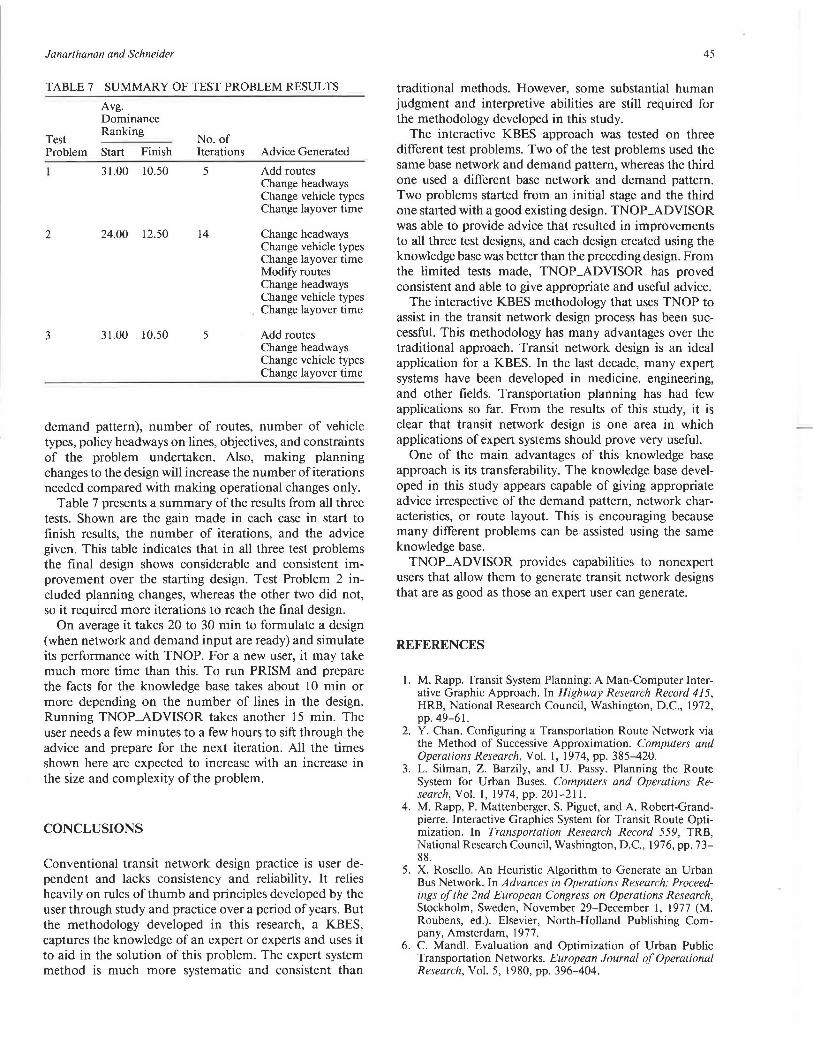
The network used for this problem is different from the other two. Figure 14 shows the network and node names. This hypothetical city consists of a hub-and-spoke street system. The network has 97 nodes and 176 two-way links. Compared with the previous problem, this one is much bigger, with a total of 41,730 trips in its transit demand matrix. Figure 15 presents the demand pattern in this network. One of the main objectives in using this problem is to search for evidence that TNOP _ADVISOR can be useful and give appropriate advice regardless of the network, demand pattern, or route pattern used.
It took only four iterations to find a high-performance solution to this problem. Concordance analysis was conducted comparing Designs 100, 200, 300, and 400. Design 200 is better than Design 100, and Design 300 is better
FIGURE 14 Test Problem 3: Base network.
43
than Designs 100 and 200. Design 400 is a nondominant design that is better than the three previous designs. Table 5 presents the performance measures of Designs 100, 200, and 400. Table 6 presents the average dominance and final ranking of the four designs.
FIGURE 15 Test Problem 3: Demand pattern.
44 TRANSPORTATION RESEARCH RECORD 1187
TABLE 5 TEST PROBLEM 3: RAW PROJECT EFFECTS MA TRIX, DESIGNS 100, 200, 300, AND 400
PM
1 2 3 4
• 5 • 6 • 7 • 8 • 9 • 10
11 12
CONCORDANCE ANALYSIS (A MULTICRITERIA EVALUATION METHOD) •••••••••••••••••••••••••••••••••••••••••••••••••••••••••
RAW PROJECT EFFECTS MATRIX --------------- ------- --- ---
ALTERNATIVES
1 2 3
OPERATING COSTS PER (100) (200) (300)
.260 . 270 1 .000 CAPTIAL COSTS PER PA 563.000 620 . 000 2128 . 000 PERCENT ROUTES WITH! 100 . 000 100.000 18 . 000 PASS . SERVED 6 PASSE 61 .600 5.430 1.460 PASSENGER KIL METERS 649200.000 705100.000 695300 . 000 AVERAGE UTILIZATION 186 .400 183.700 47 . 800 PERCENT TRIPS ASSIGN 76 . 600 92.700 92.700 TOTAL PASSENGER SPAC 289007.000 377316 .000 1430051.000 TOTAL ROUTE LENGTH 360.000 470.000 470.000 AVERAGE RIDING TIME .640 .660 . 770 NUMBER OF TRANSFERS . 627 .627 .650 AVERAGE TRANSFER DEL 3.400 3.200 1.890
PM PERFORMANCE MEASURES
• = MORE IS BETTER,OTHERWISE LESS IS BETTER
= DESIGN NO.
TABLE 6 TEST PROJECT 3: RANKING OF ALTERNATIVES, DESIGNS 100, 200, 300, AND 400
4 (400)
.950 2090 . 000
27.000 1. 510
695600.000 49.600 92.700
1378560.000 470.000
. 770
.550 1.867
AVERAGE DOMINANCE RANKING((CONCORDANCE + DISCORDANCE)/2)
(•)--THIS IS NOT A TOTALLY NON-DOMINATED ALTERNATIVE
The results of these three test problems clearly indicate that TNOP _ADVISOR is capable of providing advice that, when used to make design changes, will provide improved performance levels. Some evidence has shown that TNOP _ ADVISOR can be applied to any design problem regardless of its base network, demand pattern, or route layout. Also
it can be applied to the design of a new system or to the improvement of an existing system. In all three cases tested, TNOP _ADVISOR was able to provide the advice needed to find improved designs. The number of iterations it takes to find a high-performance design depends on the spatial complexity of the problem (size of network and
Janarthanan and Schneider
TABLE 7 SUMMARY OF TEST PROBLEM RESULTS
Avg. Dominance
Test Ranking
No. of Problem Start Finish Iterations Advice Generated
demand pattern), number of routes, number of vehicle types, policy headways on lines, objectives, and constraints of the problem undertaken. Also, making planning changes to the design will increase the number of iterations needed compared with making operational changes only.
Table 7 presents a summary of the results from all three tests. Shown are the gain made in each case in start to finish results, the number of iterations, and the advice given. This table indicates that in all three test problems the final design shows considerable and consistent improvement over the starting design. Test Problem 2 included planning changes, whereas the other two did not, so it required more iterations to reach the final design.
On average it takes 20 to 30 min to formulate a design (when network and demand input are ready) and simulate its performance with TNOP. For a new user, it may take much more time than this. To run PRISM and prepare the facts for the knowledge base takes about 10 min or more depending on the number of lines in the design. Running TNOP _ADVISOR takes another 15 min. The user needs a few minutes to a few hours to sift through the advice and prepare for the next iteration. All the times shown here are expected to increase with an increase in the size and complexity of the problem.
CONCLUSIONS
Conventional transit network design practice is user dependent and lacks consistency and reliability. It relies heavily on rules of thumb and principles developed by the user through study and practice over a period of years. But the methodology developed in this research, a KBES, captures the knowledge of an expert or experts and uses it to aid in the solution of this problem. The expert system method is much more systematic and consistent than
45
traditional methods. However, some substantial human judgment and interpretive abilities are still required for the methodology developed in this study.
The interactive KBES approach was tested on three different test problems. Two of the test problems used the same base network and demand pattern, whereas the third one used a different base network and demand pattern. Two problems started from an initial stage and the third one started with a good existing design. TNOP _ADVISOR was able to provide advice that resulted in improvements to all three test designs, and each design created using the knowledge base was better than the preceding design. From the limited tests made, TNOP _ADVISOR has proved consistent and able to give appropriate and useful advice.
The interactive KBES methodology that uses TNOP to assist in the transit network design process has been successful. This methodology has many advantages over the traditional approach. Transit network design is an ideal application for a KBES. In the last decade, many expert systems have been developed in medicine, engineering, and other fields. Transportation planning has had few applications so far. From the results of this study, it is clear that transit network design is one area in which applications of expert systems should prove very useful.
One of the main advantages of this knowledge base approach is its transferability. The knowledge base developed in this study appears capable of giving appropriate advice irrespective of the demand pattern, network characteristics, or route layout. This is encouraging because many different problems can be assisted using the same knowledge base.
TNOP _ADVISOR provides capabilities to nonexpert users that allow them to generate transit network designs that are as good as those an expert user can generate.
REFERENCES
1. M. Rapp. Transit System Planning: A Man-Computer Interative Graphic Approach. In Highway Research Record 415, HRB, National Research Council, Washington, D.C., 1972, pp. 49-61.
2. Y. Chan. Configuring a Transportation Route Network via the Method of Successive Approximation. Computers and Operations Research, Vol. I, 1974, pp. 385-420.
3. L. Silman, Z. Barzily, and U. Passy. Planning the Route System for Urban Buses. Computers and Operations Research, Vol. 1, 1974, pp. 201-211.
4. M. Rapp, P. Mattenberger, S. Piguet, and A. Robert-Grandpierre. Interactive Graphics System for Transit Route Optimization. In Transportation Research Record 559, TRB, National Research Council, Washington, D.C., 1976, pp. 73-88.
5. X. Rosello. An Heuristic Algorithm to Generate an Urban Bus Network. In Advances in Operations Research: Proceedings of the 2nd European Congress on Operations Research, Stockholm, Sweden, November 29-December 1, 1977 (M. Roubens, ed.). Elsevier, North-Holland Publishing Company, Amsterdam, 1977.
6. C. Mandi. Evaluation and Optimization of Urban Public Transportation Networks. European Journal of Operational Research, Vol. 5, 1980, pp. 396-404.
46
7. J. Lopez. Operational Research '81 (J. Brans, ed.). Elsevier, North-Holland Publishing Company, Amsterdam, 1981 , pp. 621-535.
8. T. Magnanti and R. Wong. Network Design and Transportation Planning: Models and Algorithms. Transportation Science, Vol. 18, No. I, Feb. 1984.
9. R. Wong. Transportation Network Research: Algorithmic and Computational Questions. Transportation Research, Vol. 19A, 1985, pp. 436-438.
10. Interactive Graphic Transit Network Optimization System (TNOP): User's Manual. GM Transportation System Center, Nov. 1979.
11. C. Ramamoorthy, S. Shekhar, and V. Garg. Software Development Support for Al Programs. Computer, Jan. 1987, pp. 30-40. .
12. L. Ortolano and C. Perman. A Planner's Introduction to Expert Systems. American Planning Association Journal, Winter 1987.
13. E. Shortlitfe. Computer-Based Medical Consultation: MYCIN. American Elsevier, New York, 1976.
14. B. Buchanan, G. Sutherland, and E. Feigenbaum. Heuristic DENDRAL: A Program for Generating Explanatory Hypothesis in Organic Chemistry. Machine Intelligence, Vol. 4, American Elsevier, New York, 1969.
TRANSPORTATION RESEARCH RECORD I 187
15. MACSYMA Reference Manual. Mathlab Group, Laboratory for Computer Science, Massachusetts Institute of Technology, Cambridge, Mass., Nov. 1975.
16. R. Duda and J. Gasching. Knowledge-Based Expert Systems Come of Age. Byte, Vol. 6, No. 9, Sept. 1981, pp. 238-279.
17. D. A. Waterman. A Guide to Expert Systems. AddisonWesley, Reading, Mass., 1985.
18. C. Yeh. Development of a Post-Disaster Transportation Network Trip Simulation Model and Traffic Recovery Strategy Expert System. Doctoral dissertation. University of Washington, Seattle, 1986.
19. N. Janarthanan and J. Schneider. Multicriteria Evaluation of Alternative Transit System Designs. In 'J'ransportation Research Record 1064, TRB, National Research Council, Washington, D.C. , 1986, pp. 26-34.
20. P. Nijkamp and A. Van Delft. Mu/ticriteria Analysis and Regional Decision-Making. Kluwer-Academic, Martinus Nijhotf, Norwell, Mass., 1977, 135 pp.
21. G. Giuliano, M. Berglund, K. Mortazavi, G. Thompson, P. Lyon, and J. Berechman. Making Transportation Corridor Investment Decisions within a Multimodal Framework. Final report. Institute of Transportation Studies, University of California, Irvine, Oct. 1983, 248 pp.