Presented by Achmad Chafidz Development of an integrated solar-driven desalination system for remote areas in Saudi Arabia In collaboration: 1 King Saud University - Riyadh, Saudi Arabia 2 Nanyang Technological University - Singapore Water Arabia 2013 Conference & Exhibition Al-Khobar - Saudi Arabia, 4 – 6 February 2013 Saeed Al-Zahrani 1 , Achmad Chafidz 1 , Choo F. H. 2 , Tan F. L. 2 and M. Prabu 2 Email: [email protected]
Transcript
Presented by Achmad Chafidz
Development of an integrated solar-driven desalination system for remote areas in Saudi Arabia
In collaboration: 1King Saud University - Riyadh, Saudi Arabia
2Nanyang Technological University - Singapore
Water Arabia 2013 Conference & Exhibition
Al-Khobar - Saudi Arabia, 4 – 6 February 2013
Saeed Al-Zahrani1, Achmad Chafidz1, Choo F. H.2, Tan F. L.2 and M. Prabu2
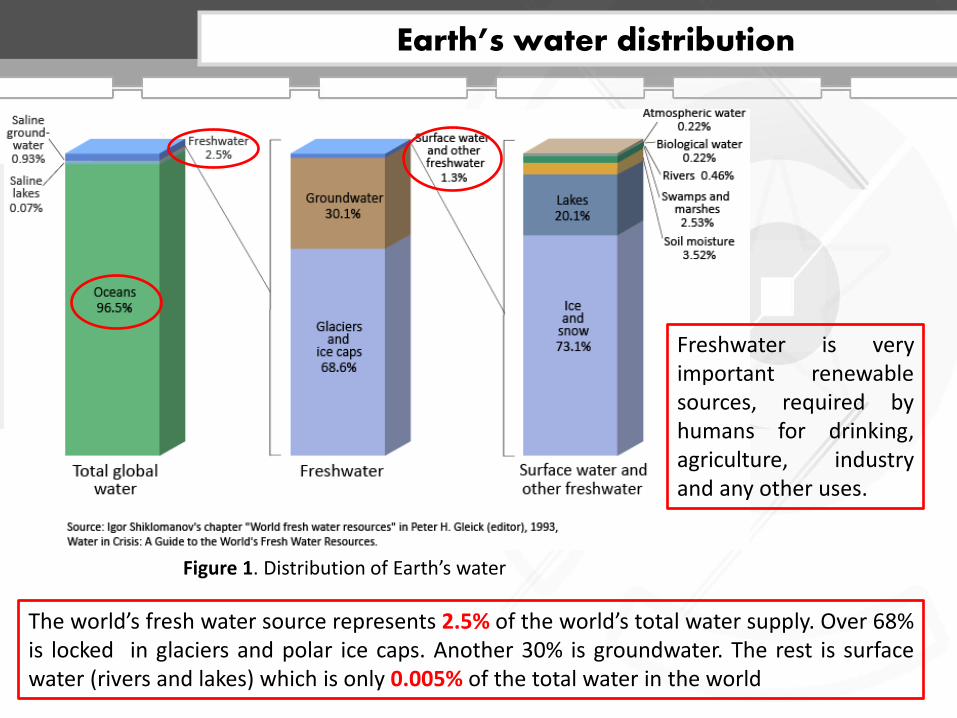
The world’s fresh water source represents 2.5% of the world’s total water supply. Over 68% is locked in glaciers and polar ice caps. Another 30% is groundwater. The rest is surface water (rivers and lakes) which is only 0.005% of the total water in the world
Freshwater is very important renewable sources, required by humans for drinking, agriculture, industry and any other uses.
Earth’s water distribution
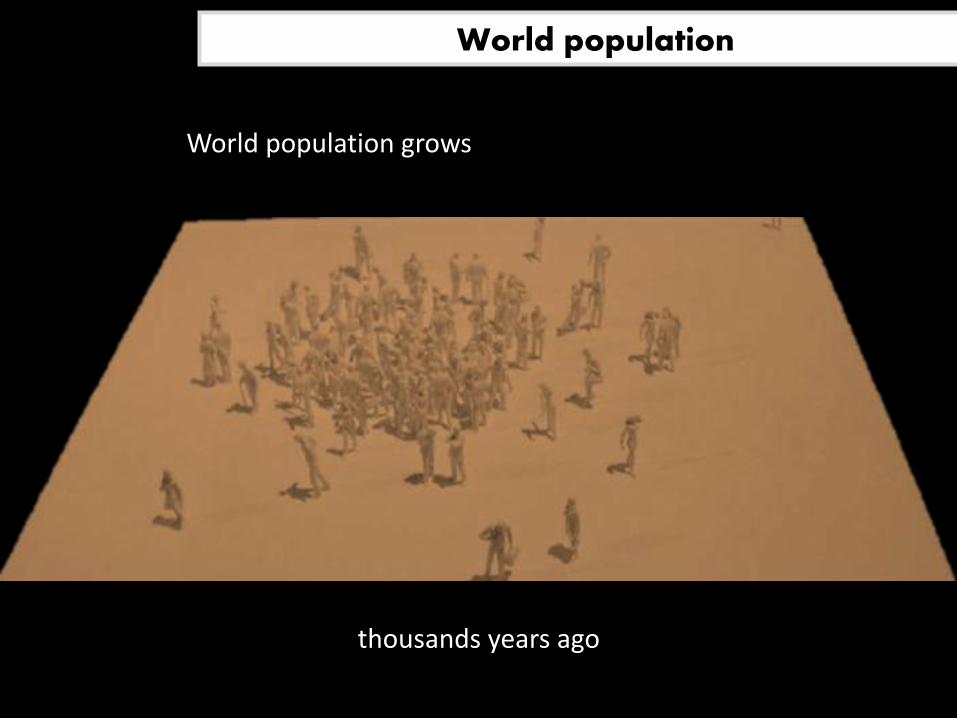
World population grows
thousands years ago
World population
World population grows and grows …
In the year 1850
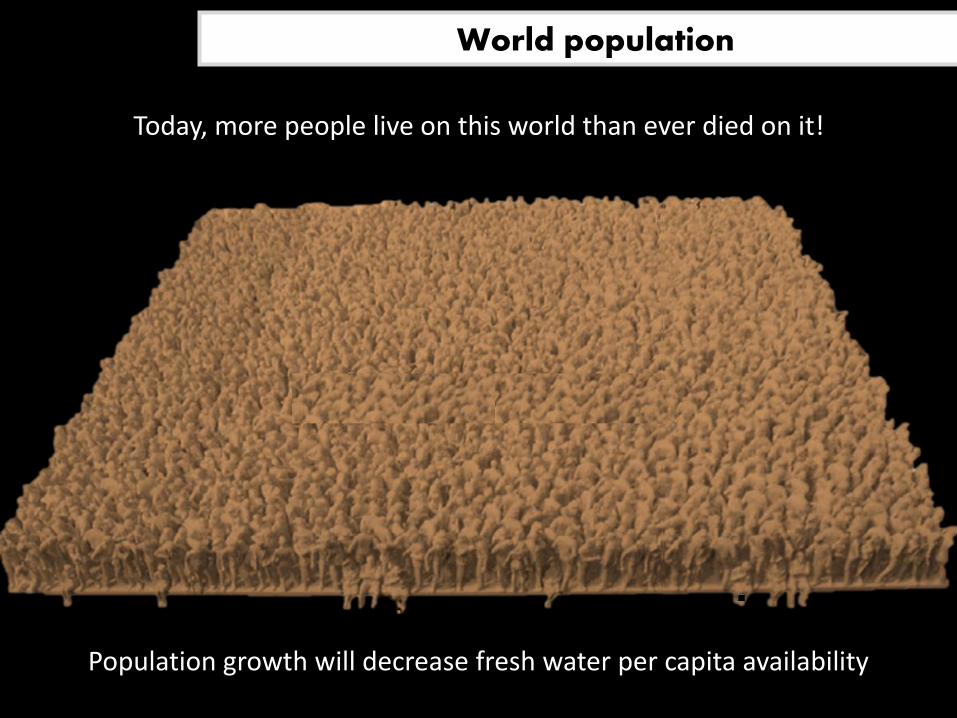
World population
Today, more people live on this world than ever died on it!
World population
Population growth will decrease fresh water per capita availability
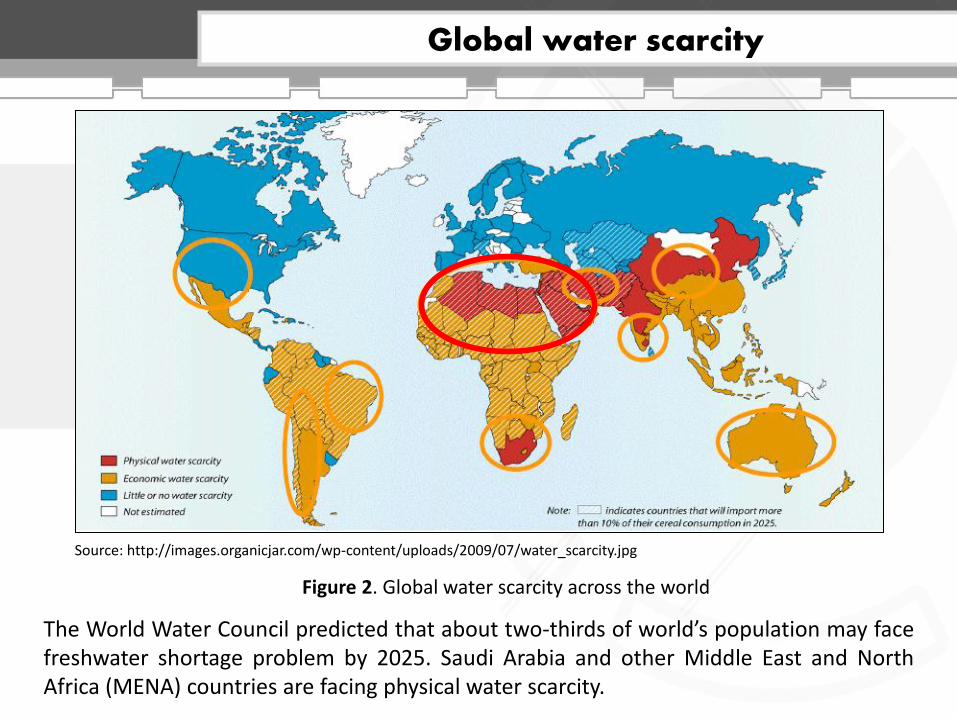
Figure 2. Global water scarcity across the world
The World Water Council predicted that about two-thirds of world’s population may face freshwater shortage problem by 2025. Saudi Arabia and other Middle East and North Africa (MENA) countries are facing physical water scarcity.
Source: M.K. Wittholz, B.K. O’Neill, C.B. Colby, D. Lewis, Estimating the cost of desalination plant using a cost database, Desalination 229 (2008) 10-20
Desalination
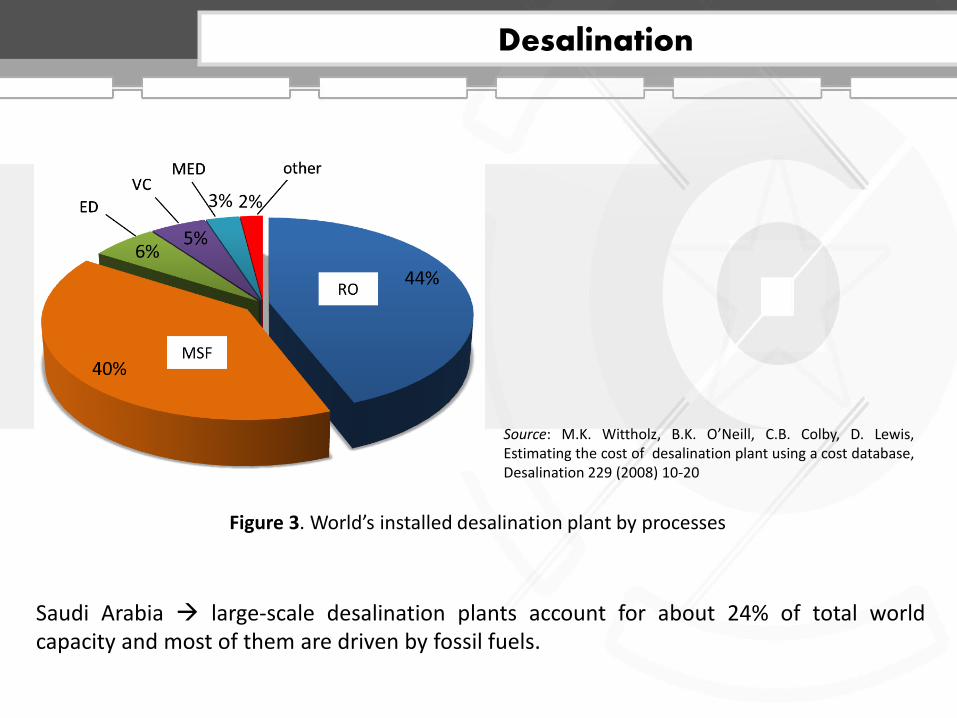
Figure 3. World’s installed desalination plant by processes
Saudi Arabia large-scale desalination plants account for about 24% of total world capacity and most of them are driven by fossil fuels.
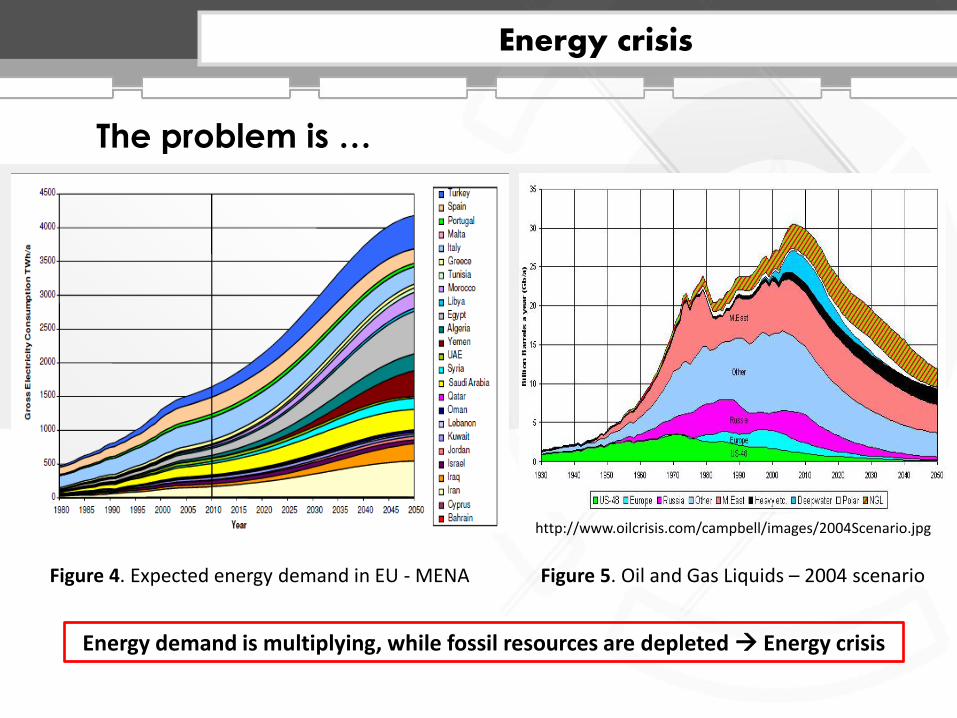
Figure 4. Expected energy demand in EU - MENA
Energy demand is multiplying, while fossil resources are depleted Energy crisis
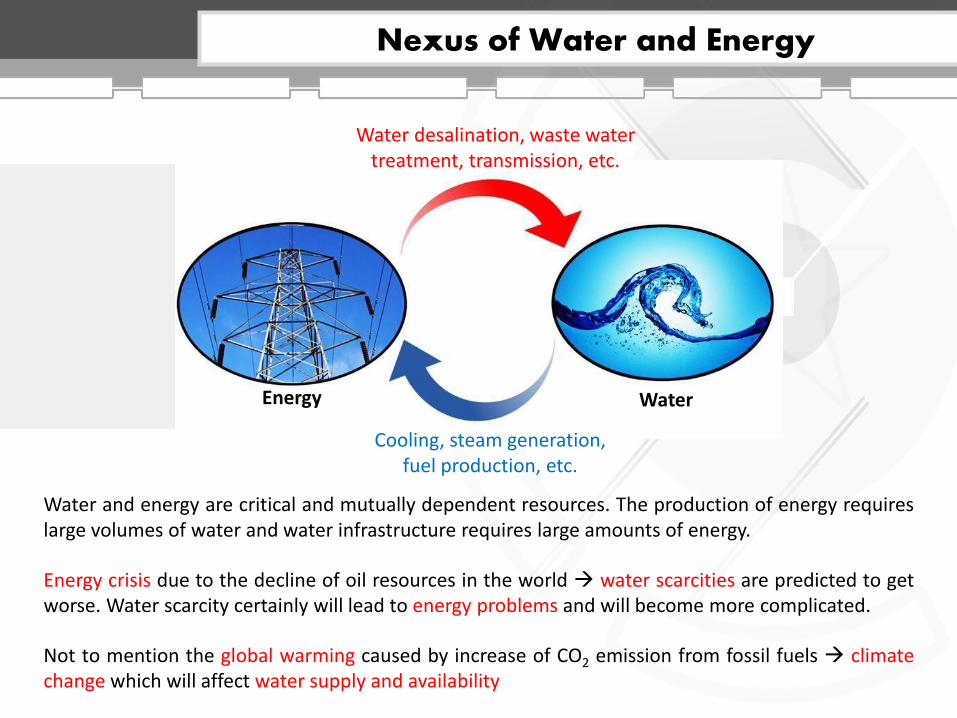
Water and energy are critical and mutually dependent resources. The production of energy requires large volumes of water and water infrastructure requires large amounts of energy.
Cooling, steam generation, fuel production, etc.
Water desalination, waste water treatment, transmission, etc.
Energy Water
Energy crisis due to the decline of oil resources in the world water scarcities are predicted to get worse. Water scarcity certainly will lead to energy problems and will become more complicated.
Not to mention the global warming caused by increase of CO2 emission from fossil fuels climate change which will affect water supply and availability
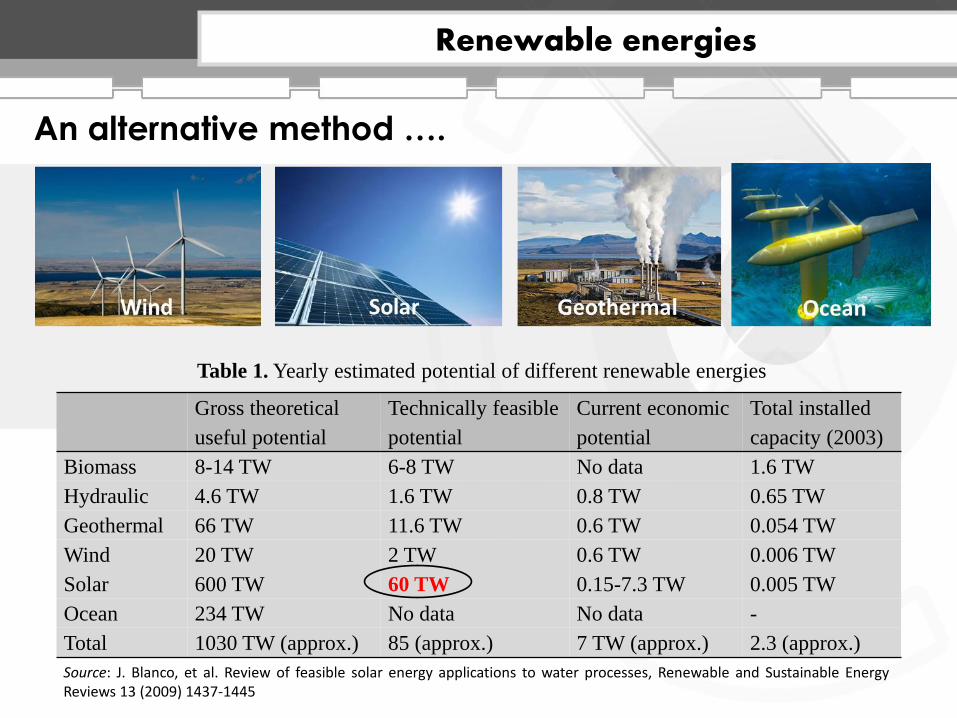
Table 1. Yearly estimated potential of different renewable energies
Source: J. Blanco, et al. Review of feasible solar energy applications to water processes, Renewable and Sustainable Energy Reviews 13 (2009) 1437-1445
Renewable energies
An alternative method ….
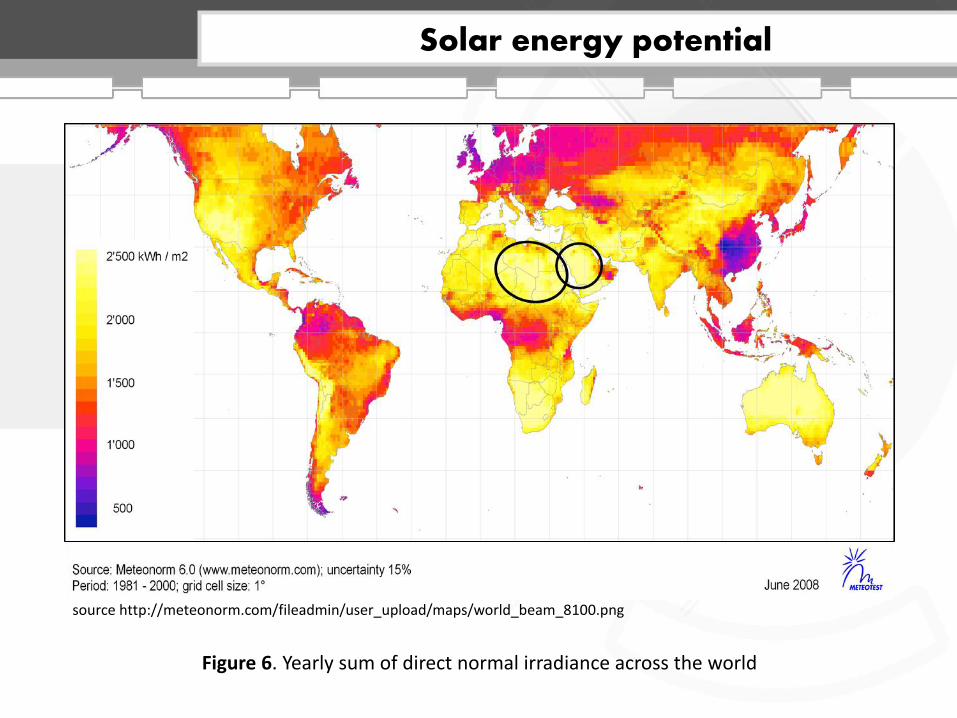
Figure 6. Yearly sum of direct normal irradiance across the world
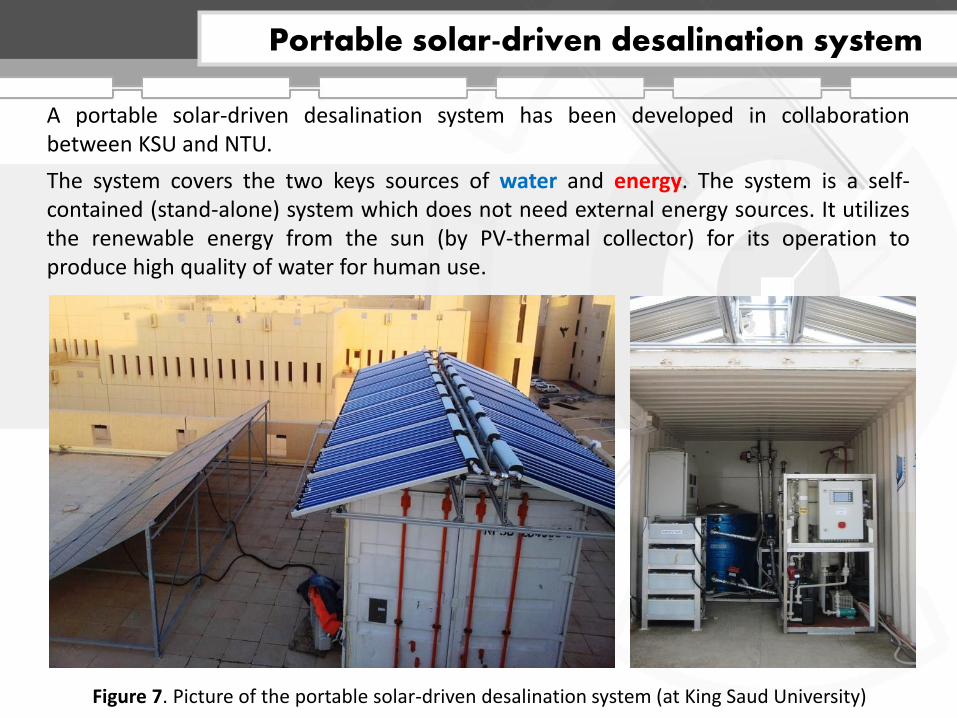
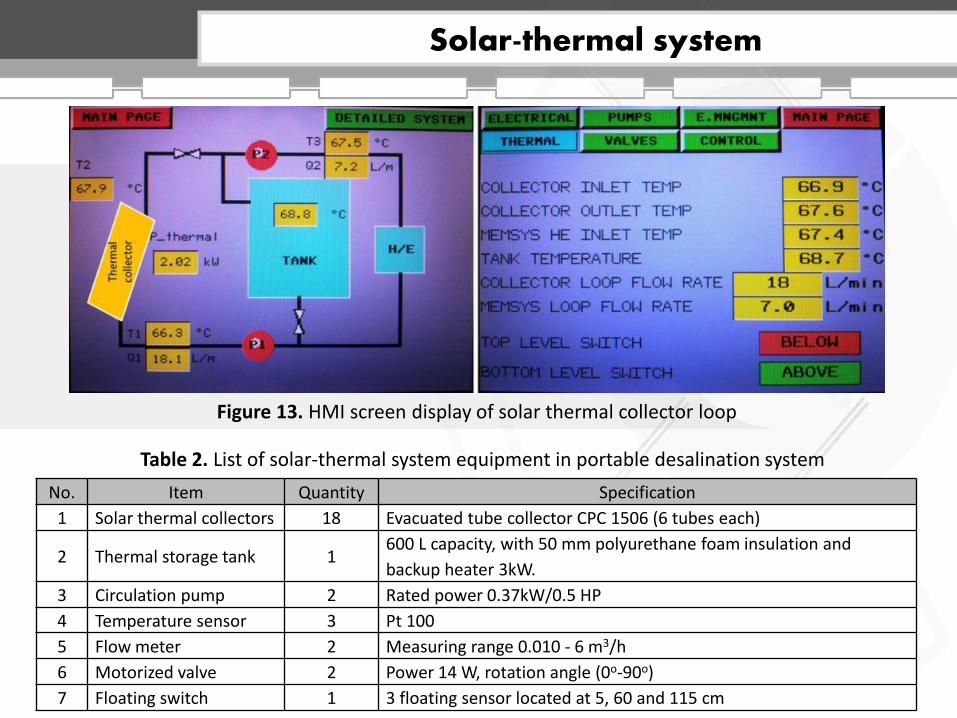
Figure 7. Picture of the portable solar-driven desalination system (at King Saud University)
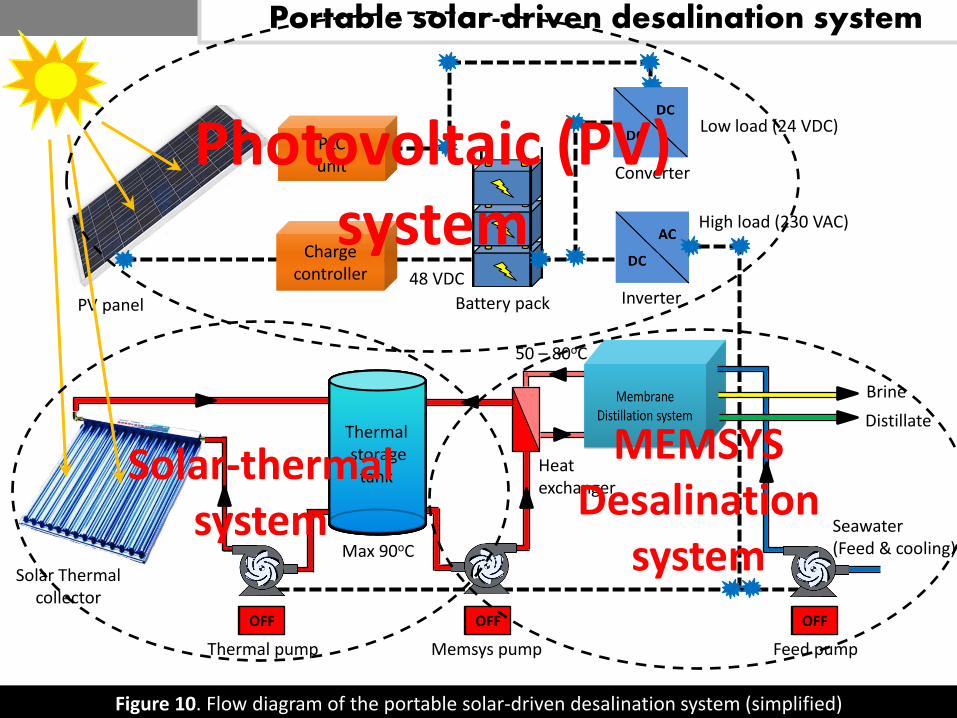
A portable solar-driven desalination system has been developed in collaboration between KSU and NTU.
The system covers the two keys sources of water and energy. The system is a self-contained (stand-alone) system which does not need external energy sources. It utilizes the renewable energy from the sun (by PV-thermal collector) for its operation to produce high quality of water for human use.
Portable solar-driven desalination system
Memsys
The container
Portable solar-driven desalination system
Seawater IN
6.02 m
2.4 m
2.6 m 2.0 m
Sea water tank Seawater OUT
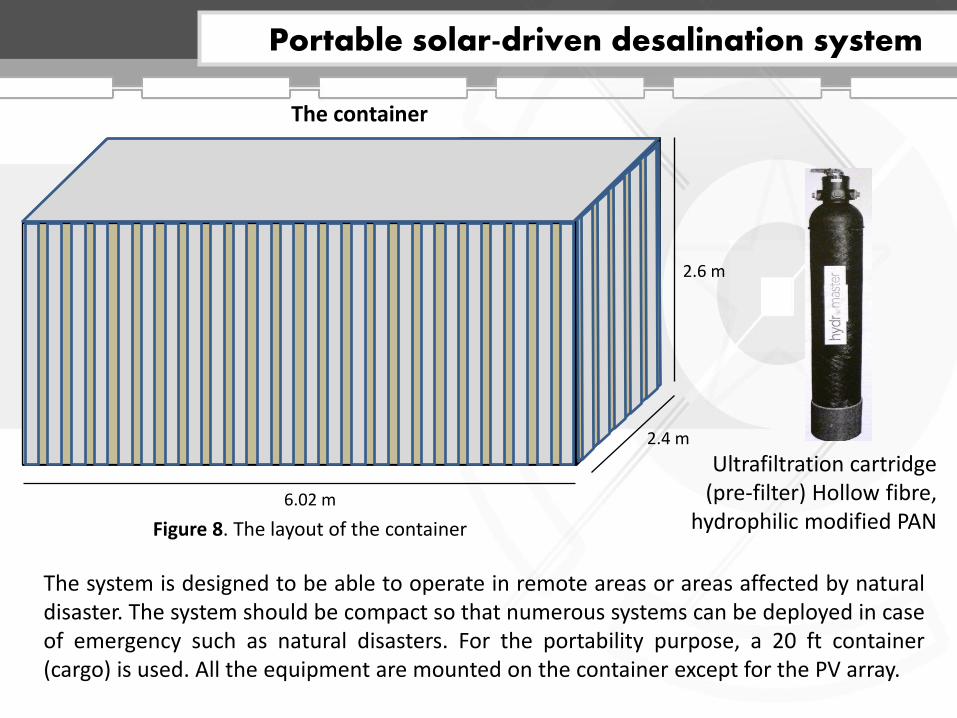
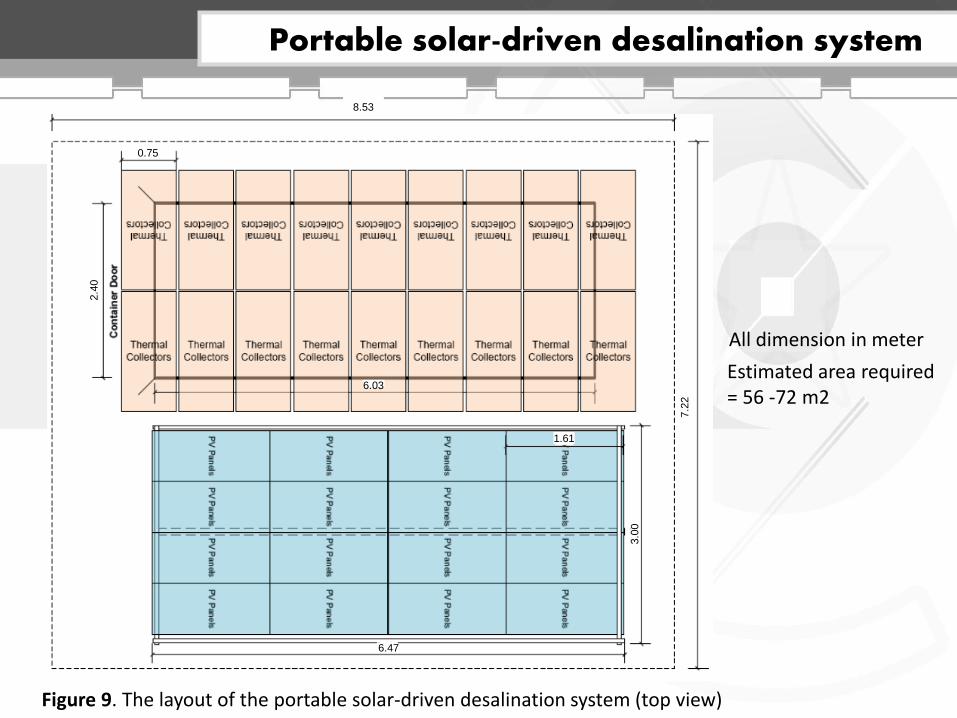
Figure 8. The layout of the container
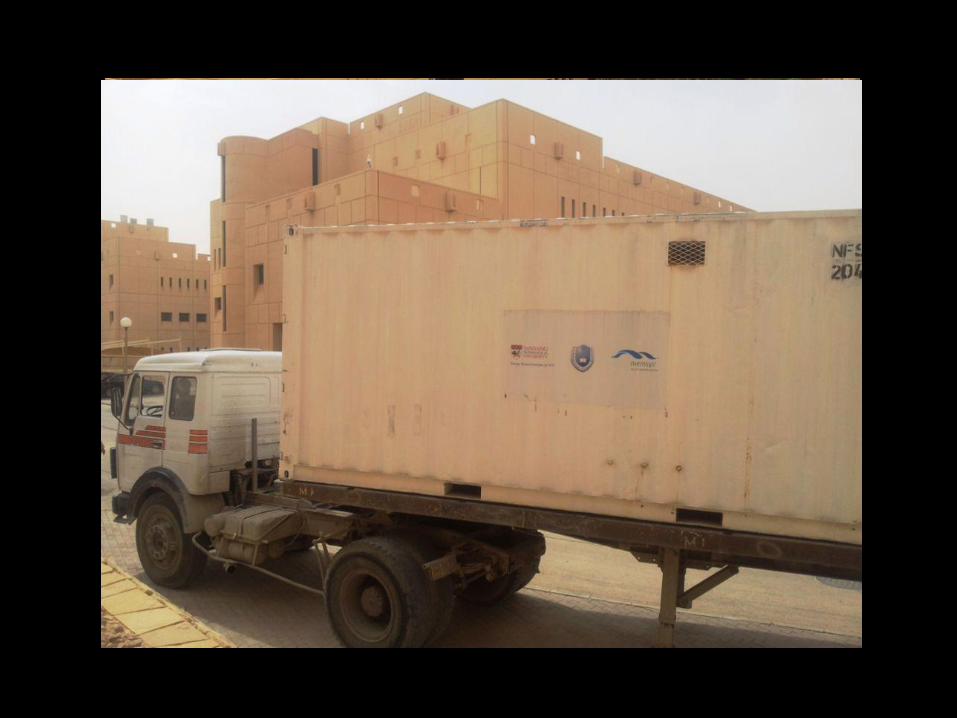
The system is designed to be able to operate in remote areas or areas affected by natural disaster. The system should be compact so that numerous systems can be deployed in case of emergency such as natural disasters. For the portability purpose, a 20 ft container (cargo) is used. All the equipment are mounted on the container except for the PV array.
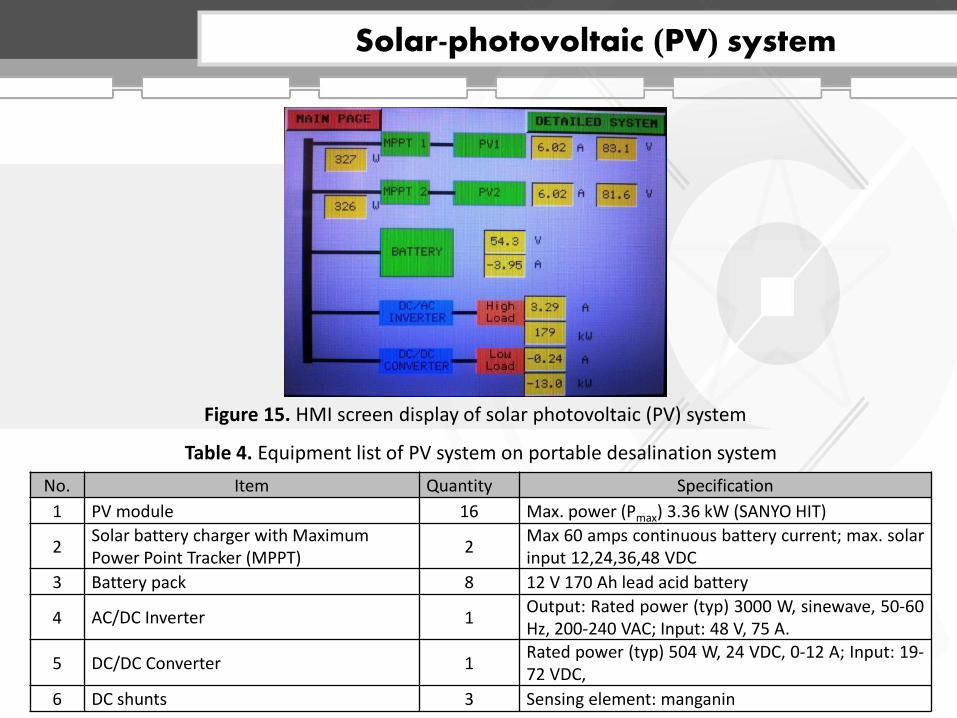
Table 4. Equipment list of PV system on portable desalination system
Solar-photovoltaic (PV) system
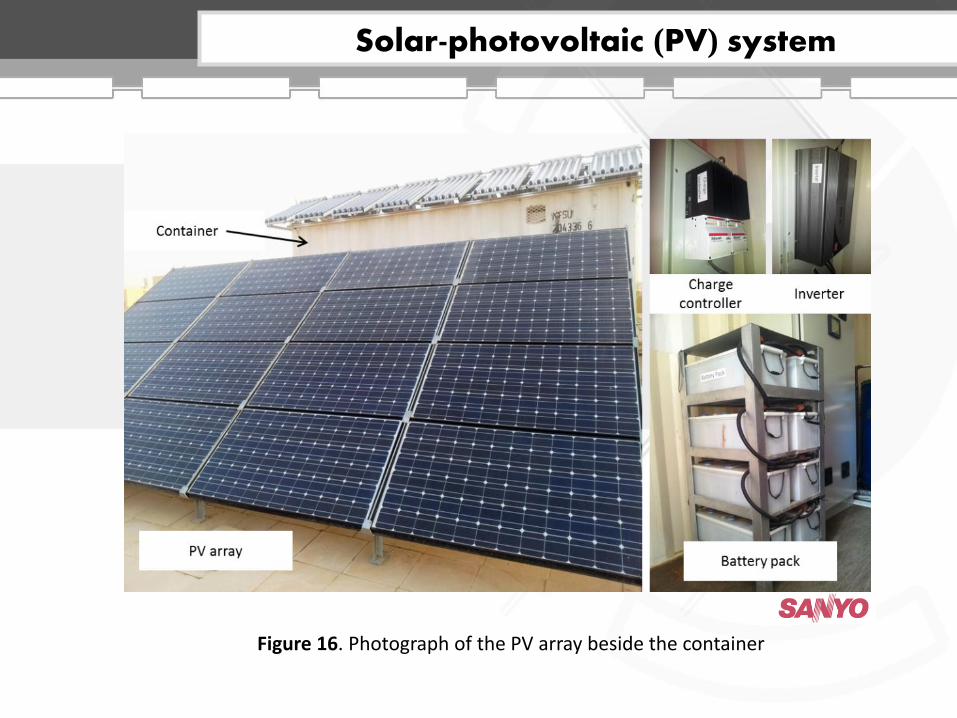
Figure 16. Photograph of the PV array beside the container
Solar-photovoltaic (PV) system
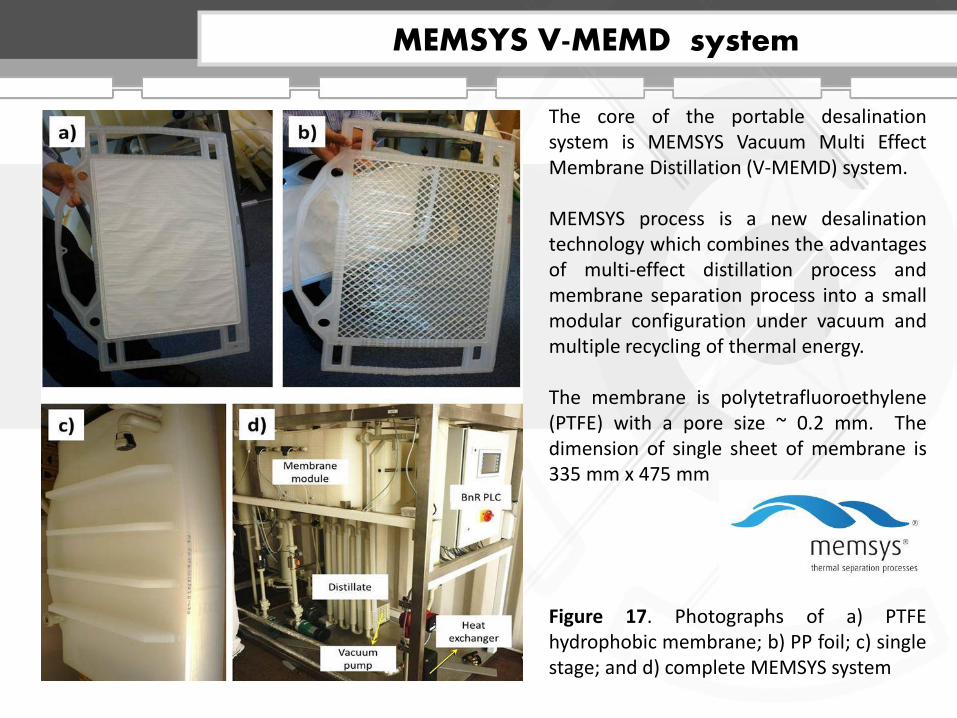
Figure 17. Photographs of a) PTFE hydrophobic membrane; b) PP foil; c) single stage; and d) complete MEMSYS system
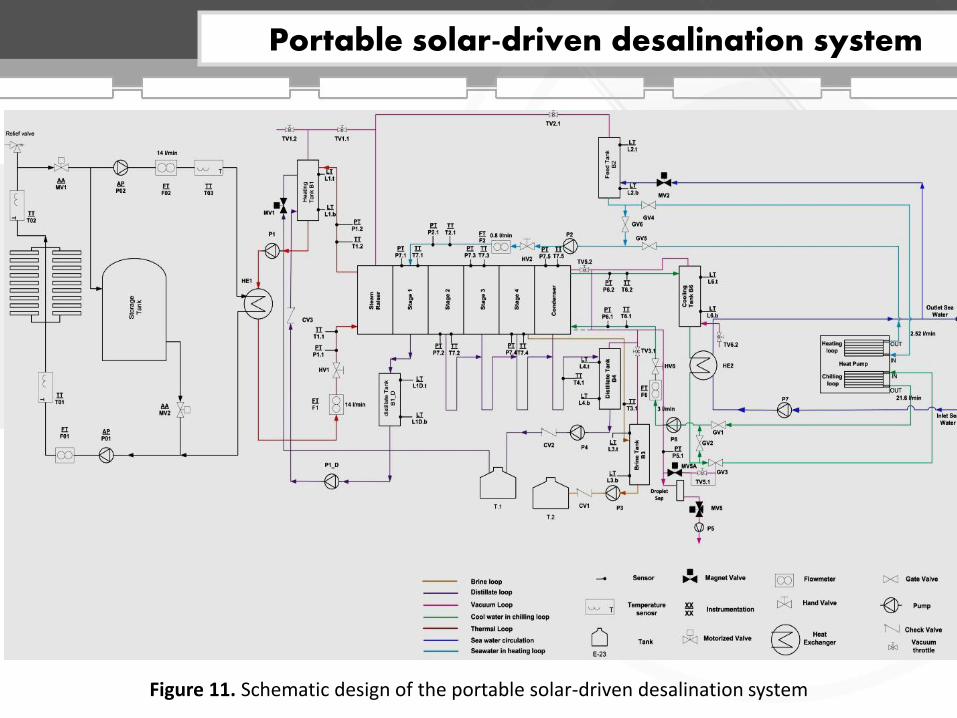
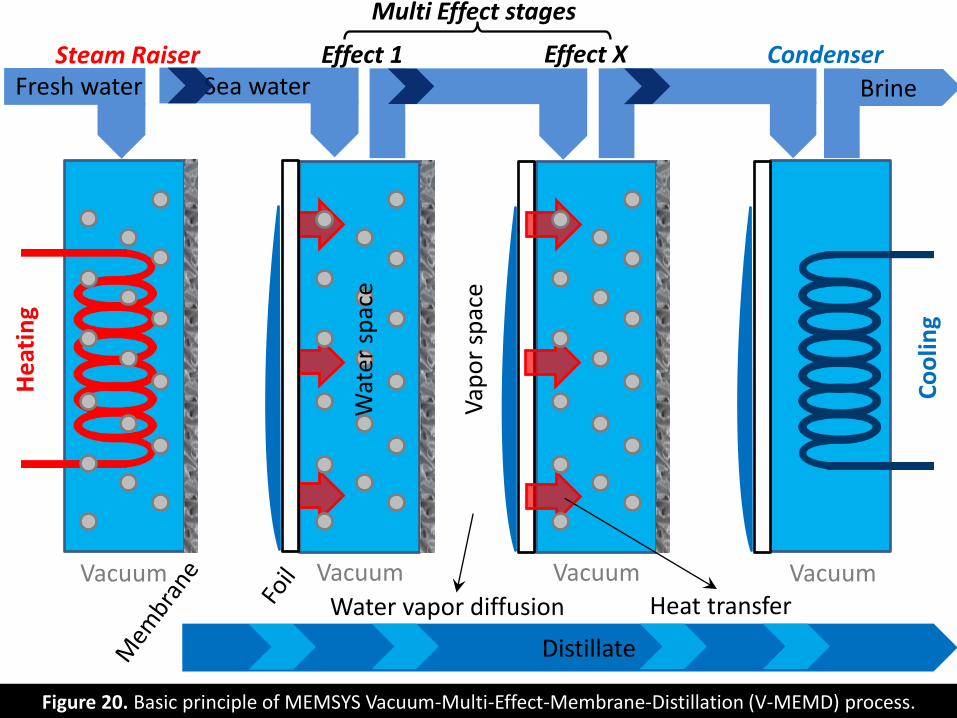
The core of the portable desalination system is MEMSYS Vacuum Multi Effect Membrane Distillation (V-MEMD) system. MEMSYS process is a new desalination technology which combines the advantages of multi-effect distillation process and membrane separation process into a small modular configuration under vacuum and multiple recycling of thermal energy. The membrane is polytetrafluoroethylene (PTFE) with a pore size ~ 0.2 mm. The dimension of single sheet of membrane is 335 mm x 475 mm
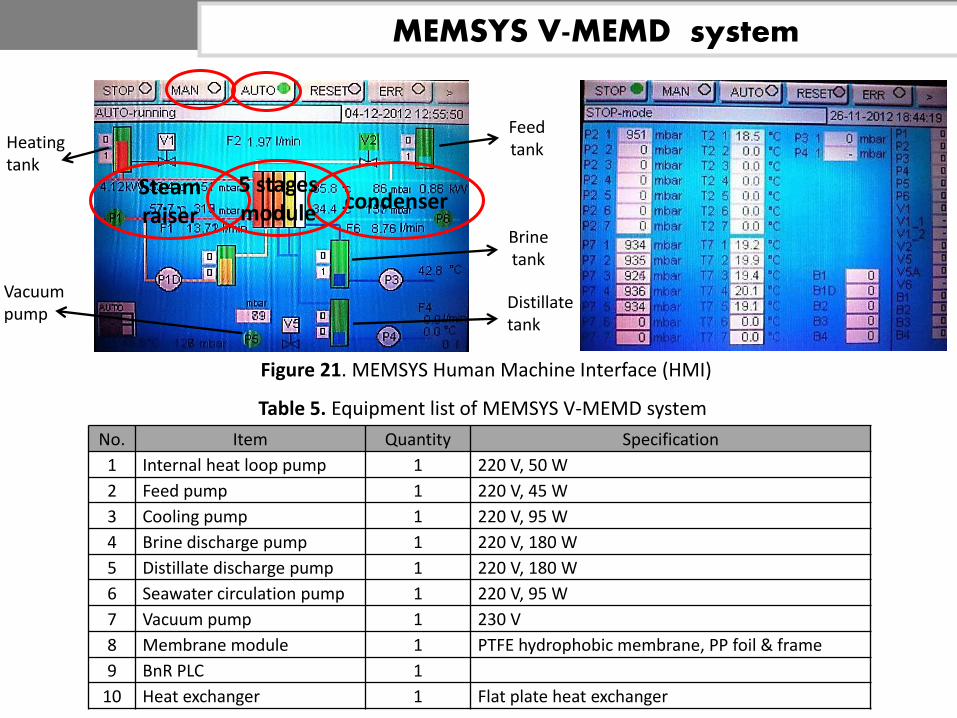
MEMSYS V-MEMD system
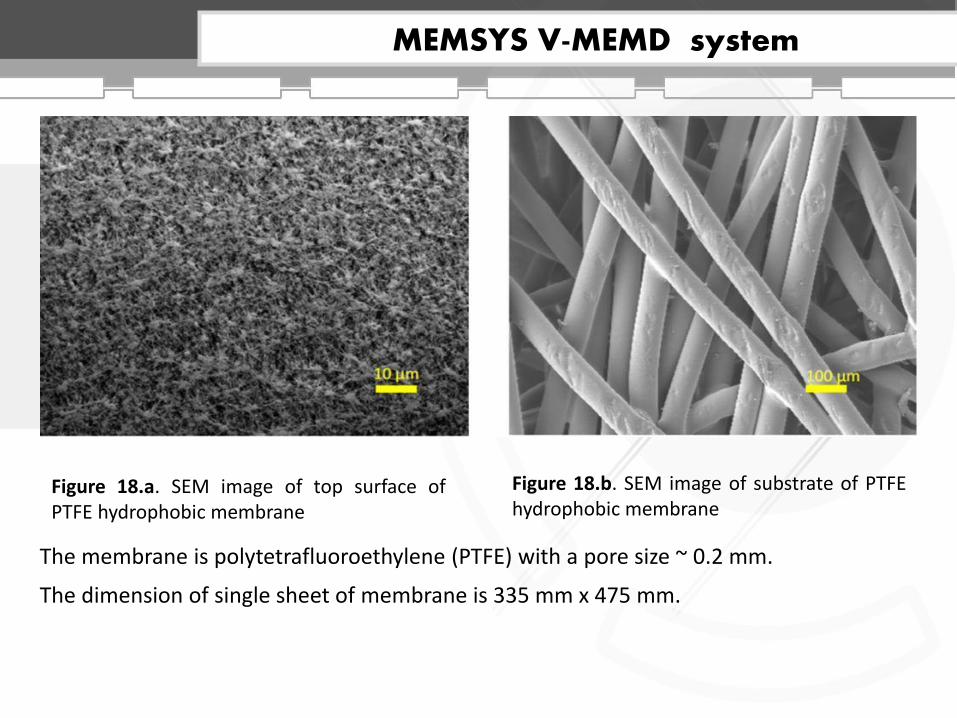
Figure 18.a. SEM image of top surface of PTFE hydrophobic membrane
Figure 18.b. SEM image of substrate of PTFE hydrophobic membrane
MEMSYS V-MEMD system
The membrane is polytetrafluoroethylene (PTFE) with a pore size ~ 0.2 mm.
The dimension of single sheet of membrane is 335 mm x 475 mm.
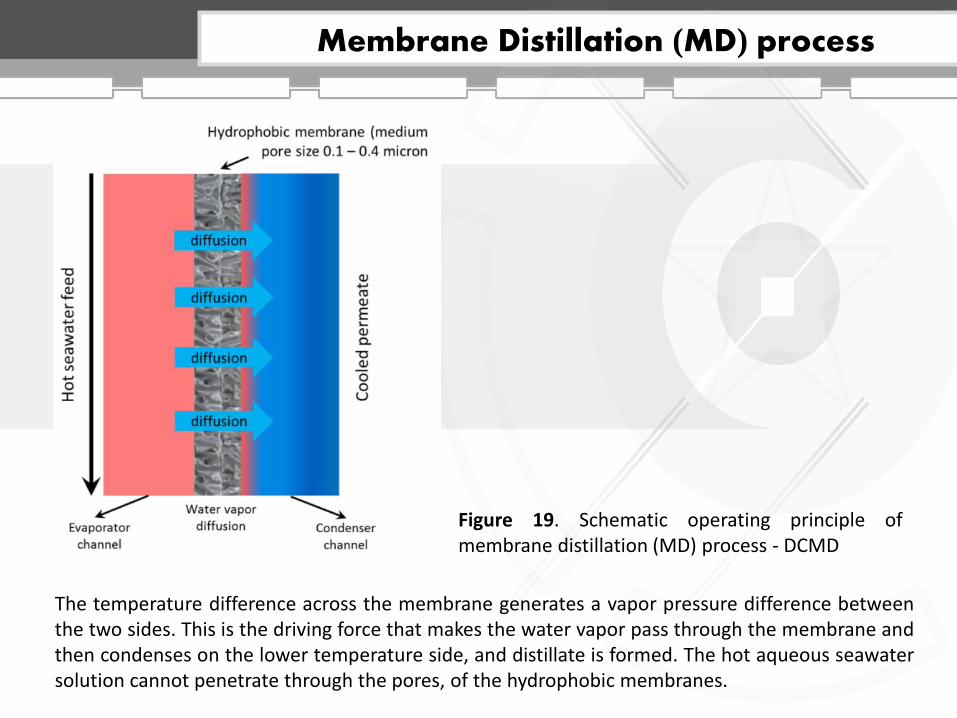
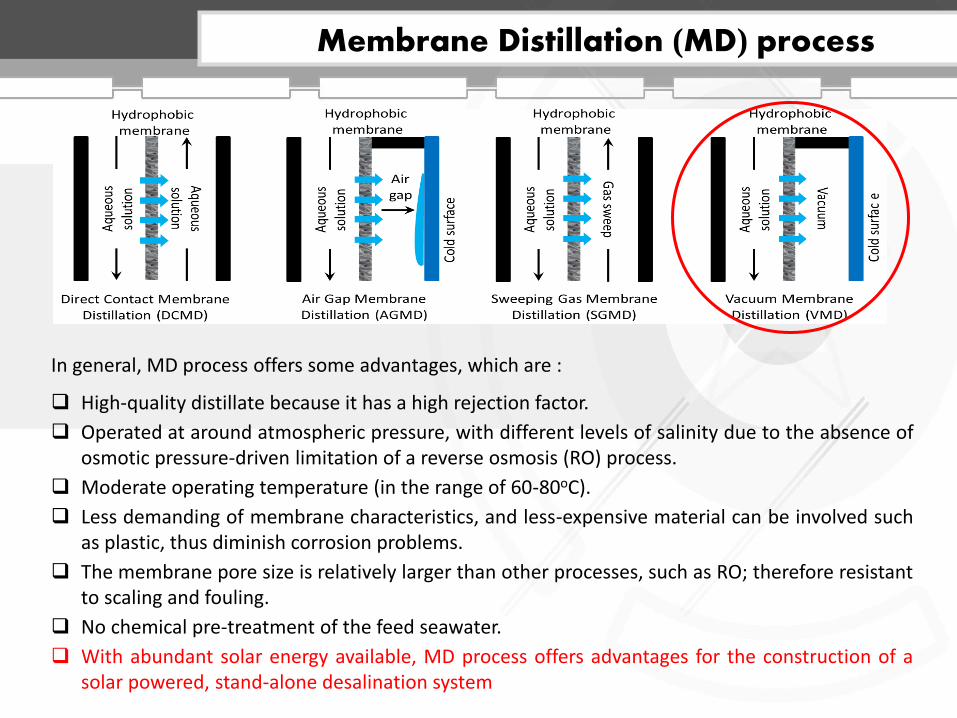
Figure 19. Schematic operating principle of membrane distillation (MD) process - DCMD
Membrane Distillation (MD) process
The temperature difference across the membrane generates a vapor pressure difference between the two sides. This is the driving force that makes the water vapor pass through the membrane and then condenses on the lower temperature side, and distillate is formed. The hot aqueous seawater solution cannot penetrate through the pores, of the hydrophobic membranes.
Membrane Distillation (MD) process
In general, MD process offers some advantages, which are :
High-quality distillate because it has a high rejection factor.
Operated at around atmospheric pressure, with different levels of salinity due to the absence of osmotic pressure-driven limitation of a reverse osmosis (RO) process.
Moderate operating temperature (in the range of 60-80oC).
Less demanding of membrane characteristics, and less-expensive material can be involved such as plastic, thus diminish corrosion problems.
The membrane pore size is relatively larger than other processes, such as RO; therefore resistant to scaling and fouling.
No chemical pre-treatment of the feed seawater.
With abundant solar energy available, MD process offers advantages for the construction of a solar powered, stand-alone desalination system
Distillate
Fresh water Brine Sea water
He
atin
g
Vacuum Vacuum Vacuum Vacuum
Co
olin
g
Heat transfer Water vapor diffusion
Steam Raiser Condenser Effect 1 Effect X
Multi Effect stages
Wat
er s
pac
e
Vap
or
spac
e
Figure 20. Basic principle of MEMSYS Vacuum-Multi-Effect-Membrane-Distillation (V-MEMD) process.
Energy efficient through multiple recycling of energy
Robust, because its thermal self adjusting properties and small tendency for fouling and scaling, because not water that passes through the membrane but only the clean vapour.
Low investment cost, through the use of plastic materials
Low operating cost, because of the efficient use of low waste energy and very little need of pretreatment.
Sustainable, since materials are recyclable, the need for chemical and pretreatment is low and waste of solar energy is efficiently put to use.
Wide variety of application due to its modularity and ability to also deal with very highly concentrated salt solution (different solutions).
MEMSYS V-MEMD system
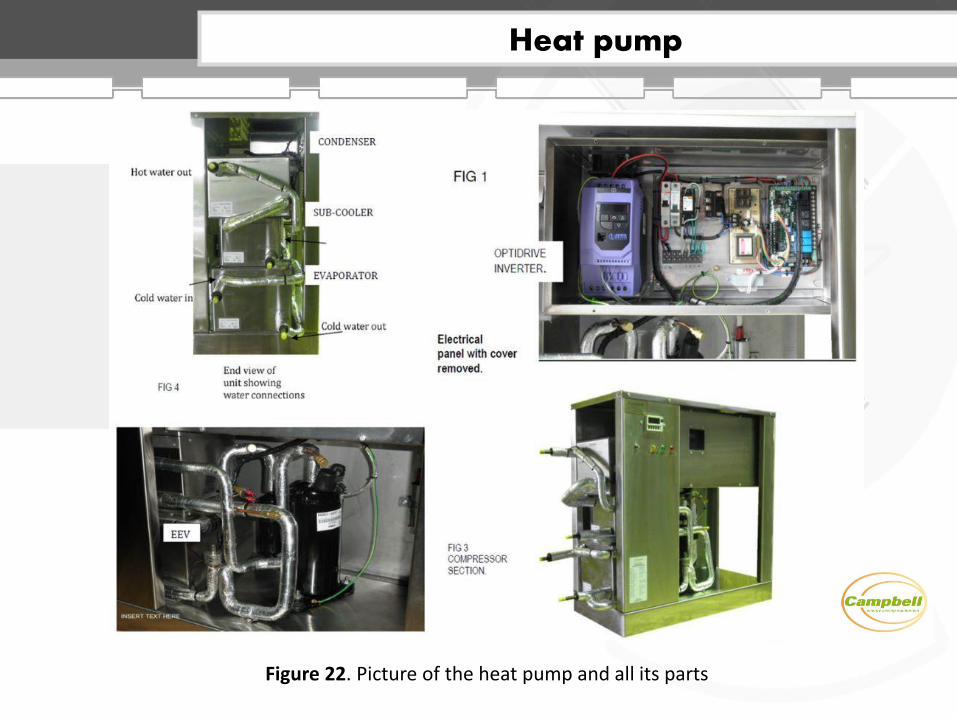
Figure 22. Picture of the heat pump and all its parts
Heat pump
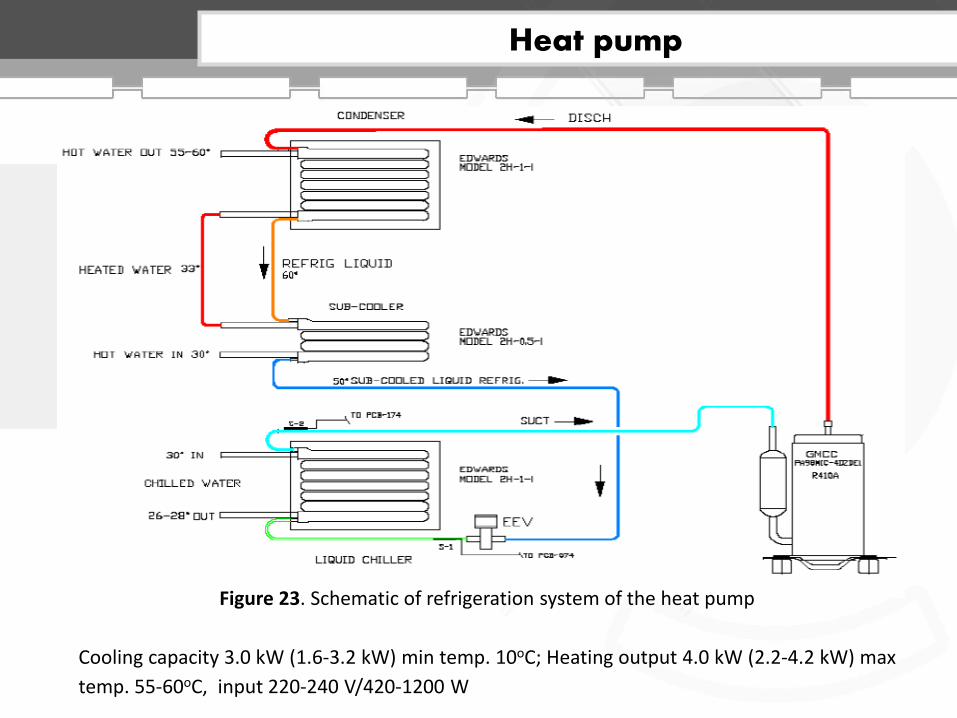
Figure 23. Schematic of refrigeration system of the heat pump
Heat pump
Cooling capacity 3.0 kW (1.6-3.2 kW) min temp. 10oC; Heating output 4.0 kW (2.2-4.2 kW) max
temp. 55-60oC, input 220-240 V/420-1200 W
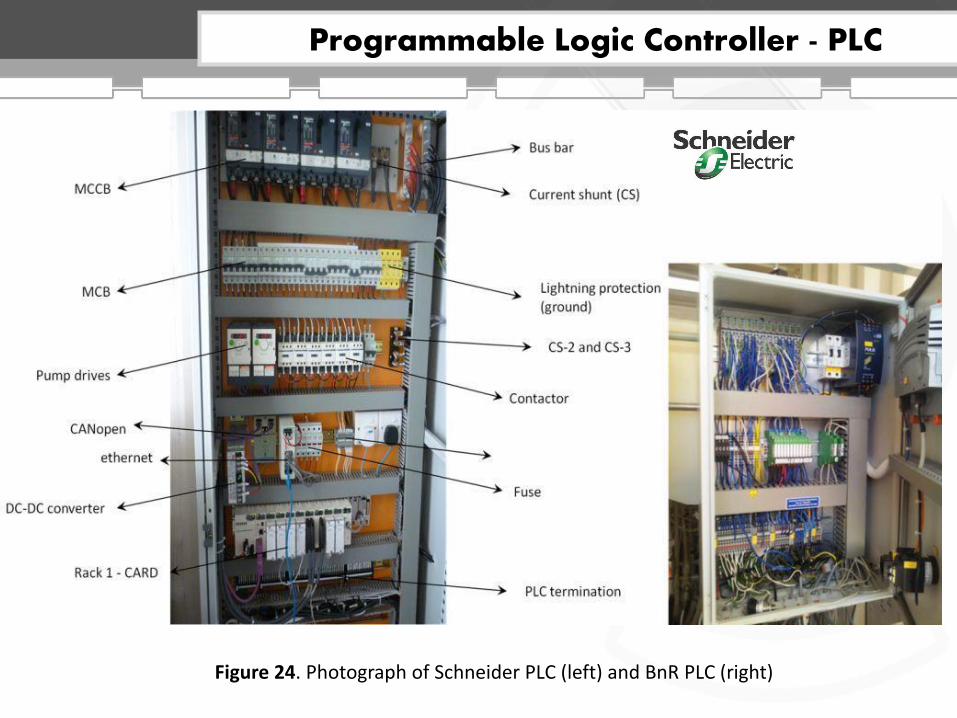
Figure 24. Photograph of Schneider PLC (left) and BnR PLC (right)
Programmable Logic Controller - PLC
continued
continued
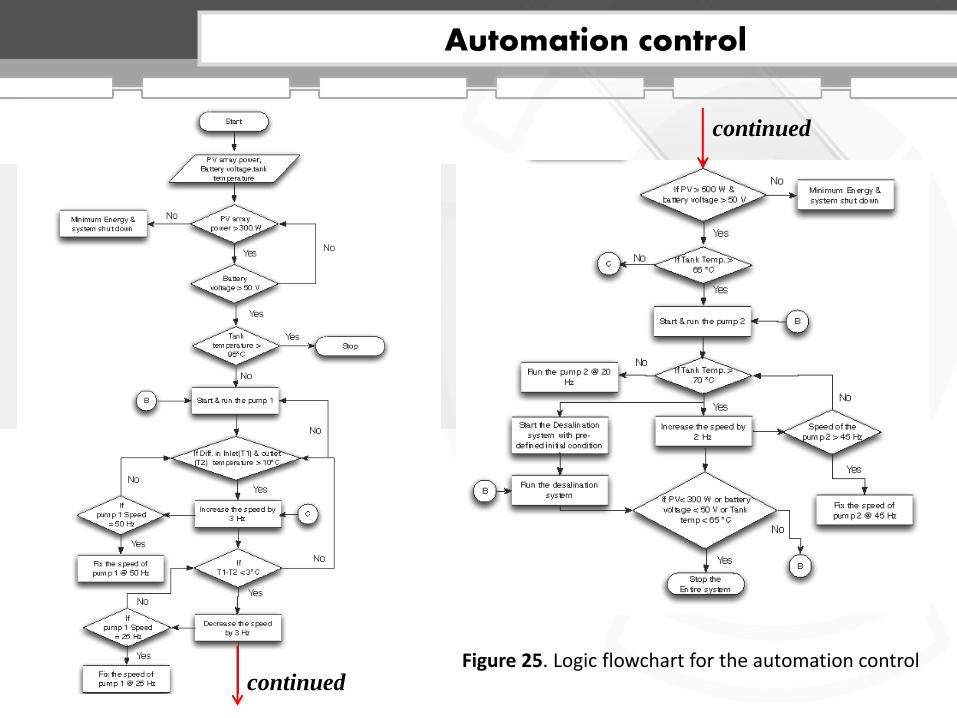
Figure 25. Logic flowchart for the automation control
Automation control
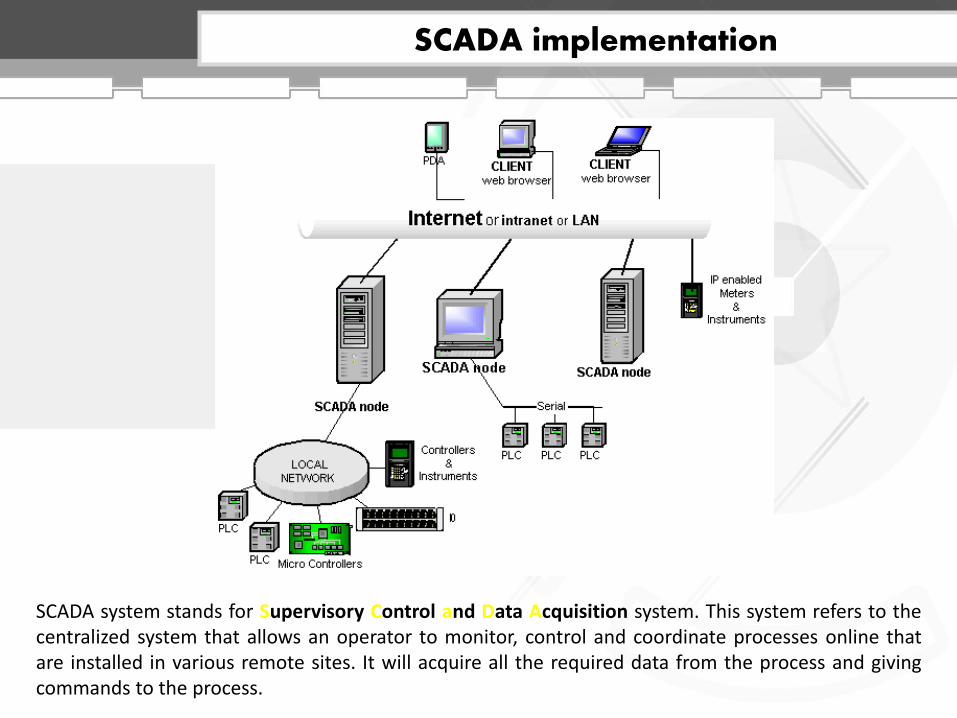
SCADA system stands for Supervisory Control and Data Acquisition system. This system refers to the centralized system that allows an operator to monitor, control and coordinate processes online that are installed in various remote sites. It will acquire all the required data from the process and giving commands to the process.
SCADA implementation
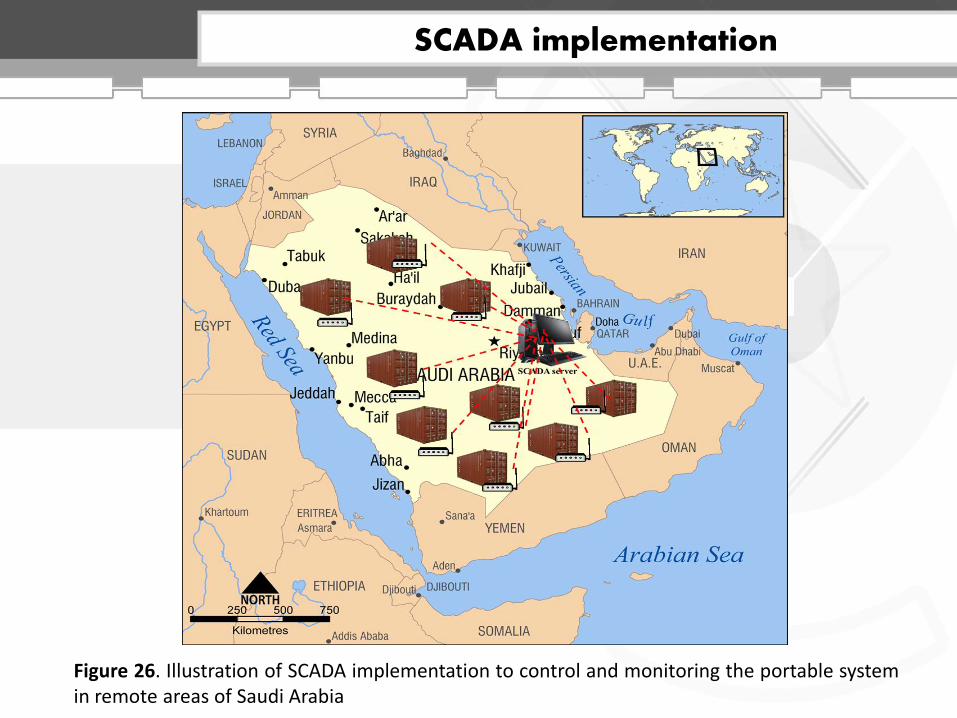
SCADA implementation
Figure 26. Illustration of SCADA implementation to control and monitoring the portable system in remote areas of Saudi Arabia
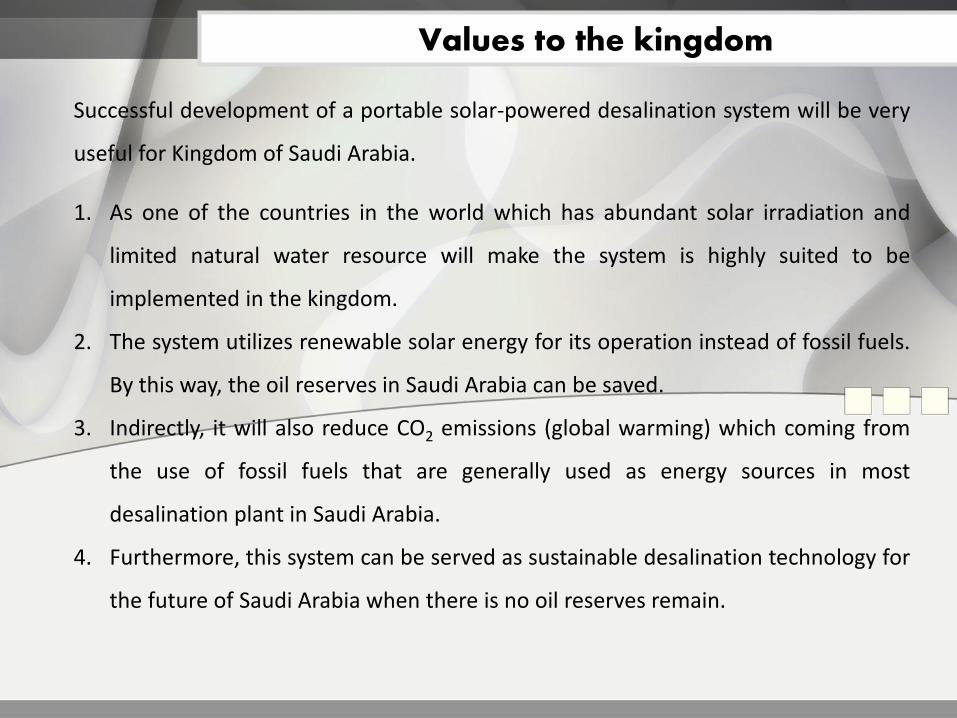
Successful development of a portable solar-powered desalination system will be very
useful for Kingdom of Saudi Arabia.
1. As one of the countries in the world which has abundant solar irradiation and
limited natural water resource will make the system is highly suited to be
implemented in the kingdom.
2. The system utilizes renewable solar energy for its operation instead of fossil fuels.
By this way, the oil reserves in Saudi Arabia can be saved.
3. Indirectly, it will also reduce CO2 emissions (global warming) which coming from
the use of fossil fuels that are generally used as energy sources in most
desalination plant in Saudi Arabia.
4. Furthermore, this system can be served as sustainable desalination technology for
the future of Saudi Arabia when there is no oil reserves remain.
Values to the kingdom
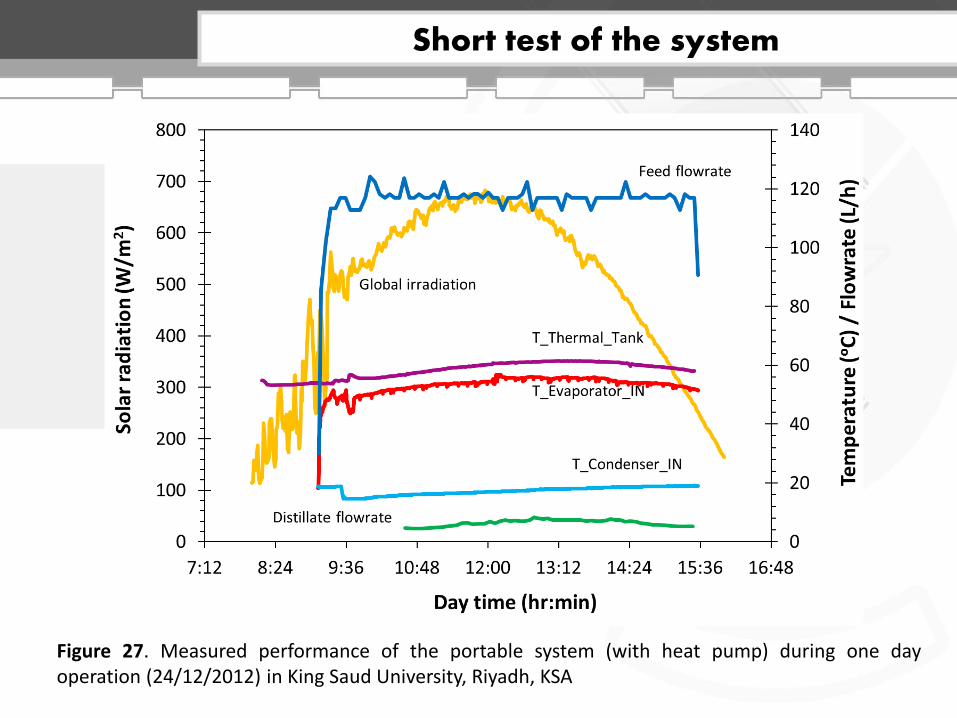
Figure 27. Measured performance of the portable system (with heat pump) during one day operation (24/12/2012) in King Saud University, Riyadh, KSA
Short test of the system
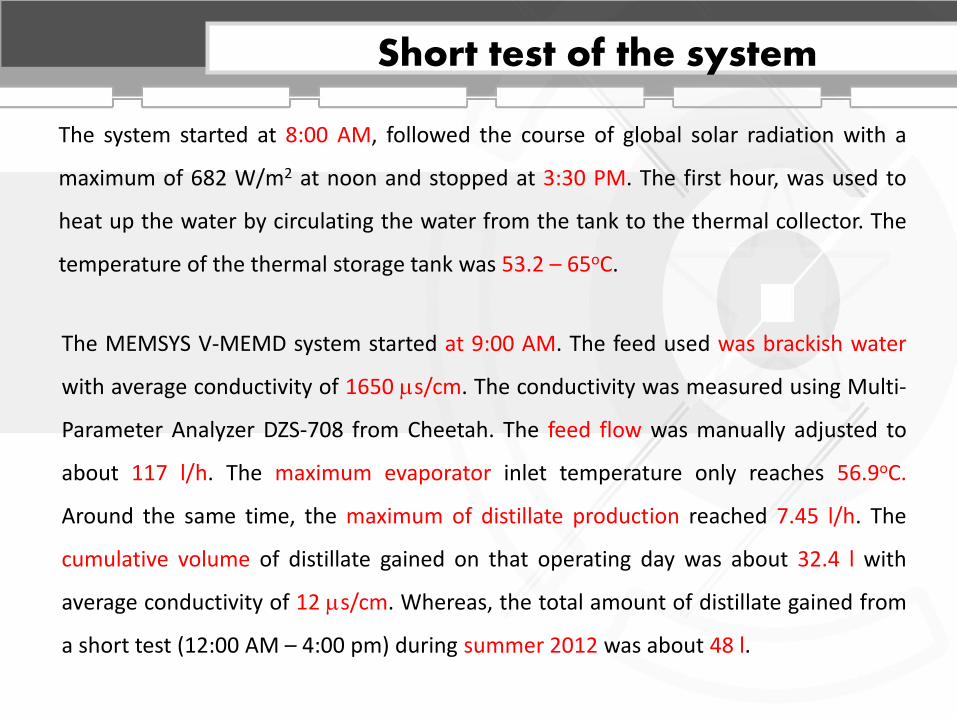
The system started at 8:00 AM, followed the course of global solar radiation with a
maximum of 682 W/m2 at noon and stopped at 3:30 PM. The first hour, was used to
heat up the water by circulating the water from the tank to the thermal collector. The
temperature of the thermal storage tank was 53.2 – 65oC.
The MEMSYS V-MEMD system started at 9:00 AM. The feed used was brackish water
with average conductivity of 1650 ms/cm. The conductivity was measured using Multi-
Parameter Analyzer DZS-708 from Cheetah. The feed flow was manually adjusted to
about 117 l/h. The maximum evaporator inlet temperature only reaches 56.9oC.
Around the same time, the maximum of distillate production reached 7.45 l/h. The
cumulative volume of distillate gained on that operating day was about 32.4 l with
average conductivity of 12 ms/cm. Whereas, the total amount of distillate gained from
a short test (12:00 AM – 4:00 pm) during summer 2012 was about 48 l.
Short test of the system
Figure 28. Energy harnessed and converted into thermal and electrical energy during one day operation (24/12/2012) in King Saud University, Riyadh, KSA
Short test of the system
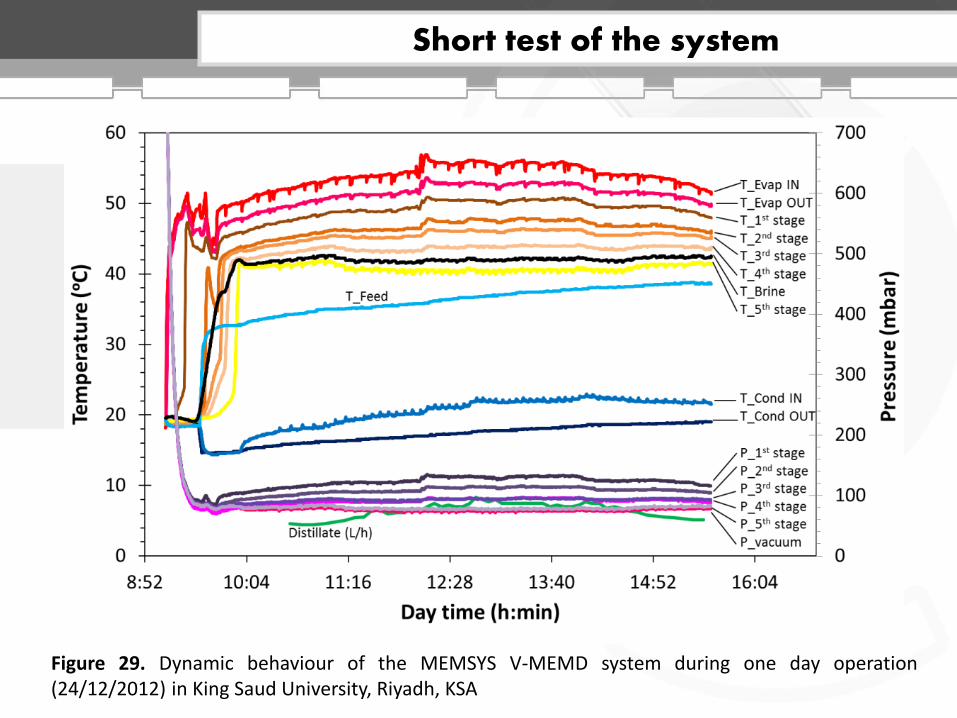
Figure 29. Dynamic behaviour of the MEMSYS V-MEMD system during one day operation (24/12/2012) in King Saud University, Riyadh, KSA
Short test of the system
Summary
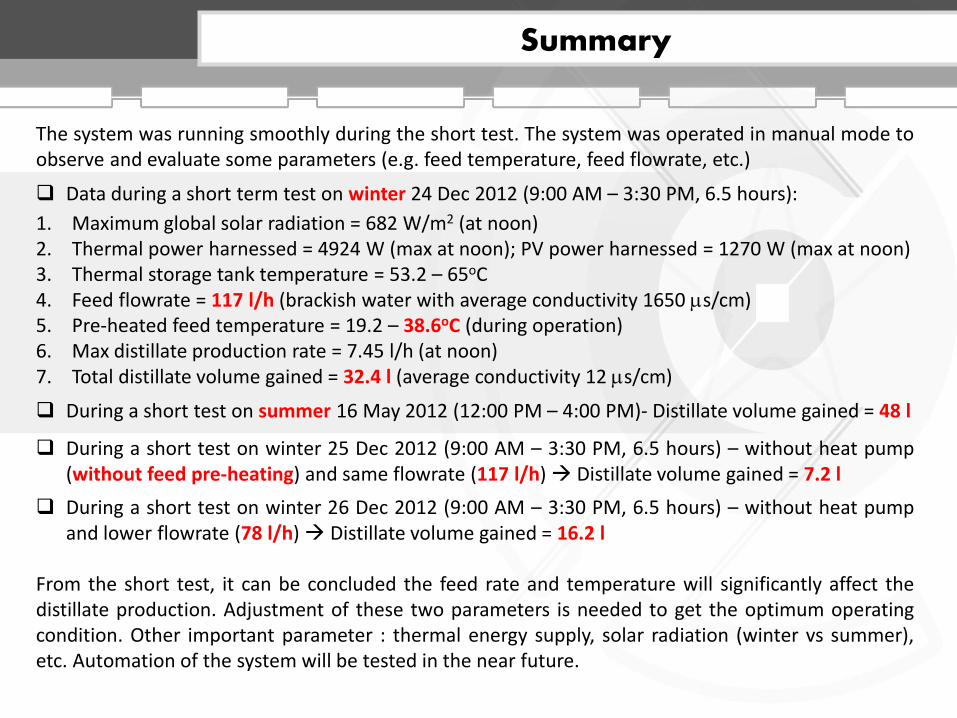
The system was running smoothly during the short test. The system was operated in manual mode to observe and evaluate some parameters (e.g. feed temperature, feed flowrate, etc.)
Data during a short term test on winter 24 Dec 2012 (9:00 AM – 3:30 PM, 6.5 hours):
1. Maximum global solar radiation = 682 W/m2 (at noon) 2. Thermal power harnessed = 4924 W (max at noon); PV power harnessed = 1270 W (max at noon) 3. Thermal storage tank temperature = 53.2 – 65oC 4. Feed flowrate = 117 l/h (brackish water with average conductivity 1650 ms/cm) 5. Pre-heated feed temperature = 19.2 – 38.6oC (during operation) 6. Max distillate production rate = 7.45 l/h (at noon) 7. Total distillate volume gained = 32.4 l (average conductivity 12 ms/cm)
During a short test on summer 16 May 2012 (12:00 PM – 4:00 PM)- Distillate volume gained = 48 l
During a short test on winter 25 Dec 2012 (9:00 AM – 3:30 PM, 6.5 hours) – without heat pump (without feed pre-heating) and same flowrate (117 l/h) Distillate volume gained = 7.2 l
During a short test on winter 26 Dec 2012 (9:00 AM – 3:30 PM, 6.5 hours) – without heat pump and lower flowrate (78 l/h) Distillate volume gained = 16.2 l
From the short test, it can be concluded the feed rate and temperature will significantly affect the distillate production. Adjustment of these two parameters is needed to get the optimum operating condition. Other important parameter : thermal energy supply, solar radiation (winter vs summer), etc. Automation of the system will be tested in the near future.
References
1. Meerganz von Medeazza G. Desalination 2004;169(3):287-301.
2. Kalogirou S. Progress in Energy and Combustion Science 2005;31(3):242-281.
3. Wittholz MK, O'Neill BK, Colby CB, and Lewis D. Desalination 2008;229(1–3):10-20.
4. Karagiannis IC and Soldatos PG. Desalination 2008;223(1–3):448-456.
5. Mathioulakis E, Belessiotis V, and Delyannis E. Desalination 2007;203(1–3):346-365.
6. Younos T and Tulou KE. Journal of Contemporary Water Research & Education 2005;132(1):3-10.
7. Wade NM. Desalination 2001;136(1–3):3-12.
8. Blanco J, Malato S, Fernández-Ibañez P, Alarcón D, Gernjak W, and Maldonado MI. Renewable and Sustainable Energy Reviews 2009;13(6-7):1437-1445.
9. Banat F, Jumah R, and Garaibeh M. Renewable Energy 2002;25(2):293-305.
10. Meindersma GW, Guijt CM, and de Haan AB. Desalination 2006;187(1–3):291-301.
11. Koschikowski J, Wieghaus M, Rommel M, Ortin VS, Suarez BP, and Betancort Rodríguez JR. Desalination 2009;248(1-3):125-131.
12. Alkhudhiri A, Darwish N, and Hilal N. Desalination 2012;287:2-18.
13. Pangarkar BL, Sane MG, Parjane SB, and Guddad M. Engineering and Technology 2011;51:797-802.
14. Garcıa-Payo MC, Izquierdo-Gil MA, and Fernández-Pineda C. Journal of Membrane Science 2000;169(1):61-80.
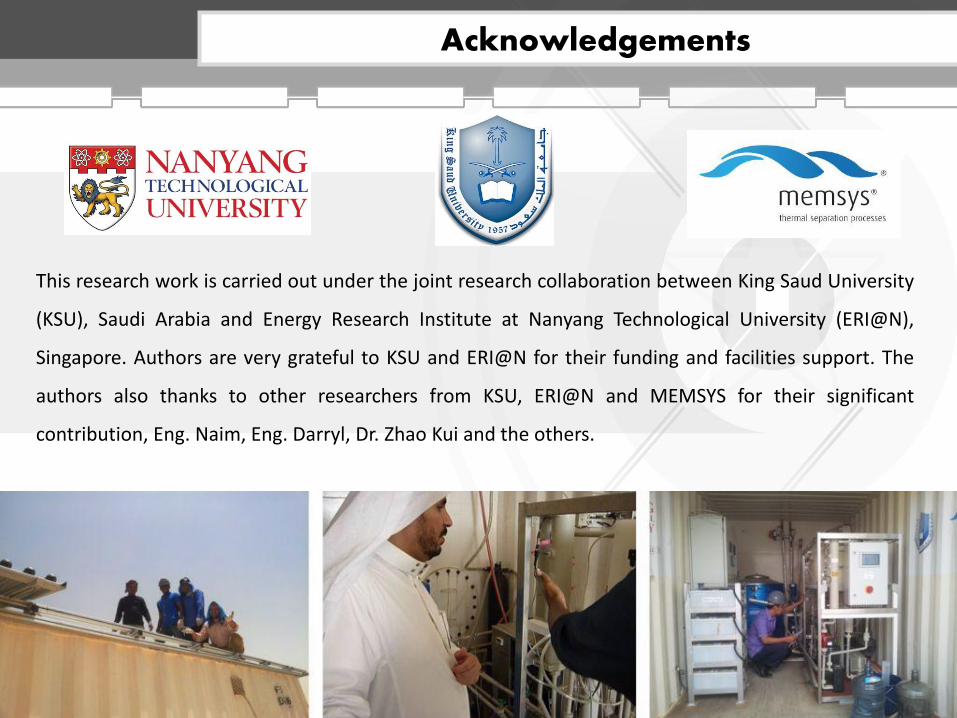
Acknowledgements
This research work is carried out under the joint research collaboration between King Saud University
(KSU), Saudi Arabia and Energy Research Institute at Nanyang Technological University (ERI@N),
Singapore. Authors are very grateful to KSU and ERI@N for their funding and facilities support. The
authors also thanks to other researchers from KSU, ERI@N and MEMSYS for their significant
contribution, Eng. Naim, Eng. Darryl, Dr. Zhao Kui and the others.