Development of an LS-DYNA Model of an ATR42-300 Aircraft for Crash Simulation Karen E. Jackson and Edwin L. Fasanella U.S. Army Research Laboratory, Vehicle Technology Directorate Mail Stop 495, 12 West Bush Road NASA Langley Research Center Hampton, VA 23681-2199 ABSTRACT This paper describes the development of an LS-DYNA simulation of a vertical drop test of an ATR42-300 twin-turboprop high-wing commuter-class airplane. A 30-ft/s drop test of this aircraft was performed onto a concrete impact surface at the FAA Technical Center on July 30, 2003. The purpose of the test was to evaluate the structural response of a commuter-class aircraft when subjected to a severe, but survivable, impact. The aircraft was configured with crew and passenger seats, anthropomorphic test dummies, forward and aft luggage, instrumentation, and onboard data acquisition systems. The wings were filled with approximately 8,700 lb. of water to represent the fuel and the aircraft weighed a total of 33,200 lb. The model, which consisted of 57,643 nodes and 62,979 elements, was developed from direct measurements of the airframe geometry, over a period of approximately 8 months. The seats, dummies, luggage, fuel, and other ballast were represented using concentrated masses. Comparisons were made of the structural deformation and failure behavior of the airframe, as well as selected acceleration time history responses. INTRODUCTION This paper describes the development of a full-scale finite element model of an ATR42 commuter-class aircraft for crash simulation. The model was developed prior to the test and pre-test predictions were generated. Model validations are necessary to gain confidence in the application of explicit transient dynamic finite element codes for crashworthy design and certification. In fact, the “validation of numerical simulations” was identified as one of five key technology shortfalls during the Workshop on Computational Methods for Crashworthiness that was held at NASA Langley Research Center in 1992 [1]. In 1998, the U.S. Army Research Laboratory Vehicle Technology Directorate (ARL- VTD) entered into an Inter-Agency Agreement (IAA) with the Federal Aviation Administration (FAA) William J. Hughes Technical Center for the purpose of validating crash simulations of airframe structures. As part of the IAA, finite element models were constructed of two 10-ft. long Boeing 737 (B737) fuselage sections, one outfitted with an auxiliary fuel tank mounted beneath the floor [2] and the other with two different overhead stowage bins and luggage [3]. Vertical drop tests of these two fuselage sections were performed at the FAA Technical Center in 1999 and 2000, respectively. These tests provided a valuable opportunity to evaluate the capabilities of computational tools for
Transcript
Development of an LS-DYNA Model of an ATR42-300 Aircraft forCrash Simulation
Karen E. Jackson and Edwin L. FasanellaU.S. Army Research Laboratory, Vehicle Technology Directorate
Mail Stop 495, 12 West Bush RoadNASA Langley Research Center
Hampton, VA 23681-2199
ABSTRACT
This paper describes the development of an LS-DYNA simulation of a vertical drop testof an ATR42-300 twin-turboprop high-wing commuter-class airplane. A 30-ft/s drop testof this aircraft was performed onto a concrete impact surface at the FAA TechnicalCenter on July 30, 2003. The purpose of the test was to evaluate the structural responseof a commuter-class aircraft when subjected to a severe, but survivable, impact. Theaircraft was configured with crew and passenger seats, anthropomorphic test dummies,forward and aft luggage, instrumentation, and onboard data acquisition systems. Thewings were filled with approximately 8,700 lb. of water to represent the fuel and theaircraft weighed a total of 33,200 lb. The model, which consisted of 57,643 nodes and62,979 elements, was developed from direct measurements of the airframe geometry,over a period of approximately 8 months. The seats, dummies, luggage, fuel, and otherballast were represented using concentrated masses. Comparisons were made of thestructural deformation and failure behavior of the airframe, as well as selectedacceleration time history responses.
INTRODUCTION
This paper describes the development of a full-scale finite element model of an ATR42commuter-class aircraft for crash simulation. The model was developed prior to the testand pre-test predictions were generated. Model validations are necessary to gainconfidence in the application of explicit transient dynamic finite element codes forcrashworthy design and certification. In fact, the “validation of numerical simulations”was identified as one of five key technology shortfalls during the Workshop onComputational Methods for Crashworthiness that was held at NASA Langley ResearchCenter in 1992 [1].
In 1998, the U.S. Army Research Laboratory Vehicle Technology Directorate (ARL-VTD) entered into an Inter-Agency Agreement (IAA) with the Federal AviationAdministration (FAA) William J. Hughes Technical Center for the purpose of validatingcrash simulations of airframe structures. As part of the IAA, finite element models wereconstructed of two 10-ft. long Boeing 737 (B737) fuselage sections, one outfitted with anauxiliary fuel tank mounted beneath the floor [2] and the other with two differentoverhead stowage bins and luggage [3]. Vertical drop tests of these two fuselage sectionswere performed at the FAA Technical Center in 1999 and 2000, respectively. These testsprovided a valuable opportunity to evaluate the capabilities of computational tools for
crash simulation through analytical/experimental correlation. Full-scale three-dimensional finite element models of the B737 fuselage sections were developed usingMSC.Dytran [4], a commercial explicit transient dynamic code, and simulations of thevertical drop tests were executed. The analytical predictions were successfully validatedthrough extensive test-analysis correlation, as documented in References 5 through 7.
In 2003, the IAA was extended for an additional five years (through 2008) and the modelvalidation work entered a new phase with the development of a full-scale finite elementmodel of the ATR42-300 aircraft. For this simulation, the model was developed usingthe pre-processing software package, MSC.Patran [8], and the final model was executedusing another commercial code, LS-DYNA [9]. The FAA performed a 30-ft/s verticaldrop test of the aircraft to determine the impact response of the airframe; the floor, seattracks, seats, and Anthropomorphic Test Dummies (ATD); and, the high-wing fuelsystem. Recently, the FAA has proposed dynamic performance criteria for seats forcommuter-class aircraft that were based on empirical information obtained from priorairplane crash test data, which did not include airplanes representative in size ofcommuter-class aircraft. Consequently, this experiment was performed to provide impactdata to evaluate the seat standards for commuter-class aircraft. The experimentalprogram, the model development process, and the test-analysis correlation are presentedin subsequent sections of the paper.
EXPERIMENTAL PROGRAM
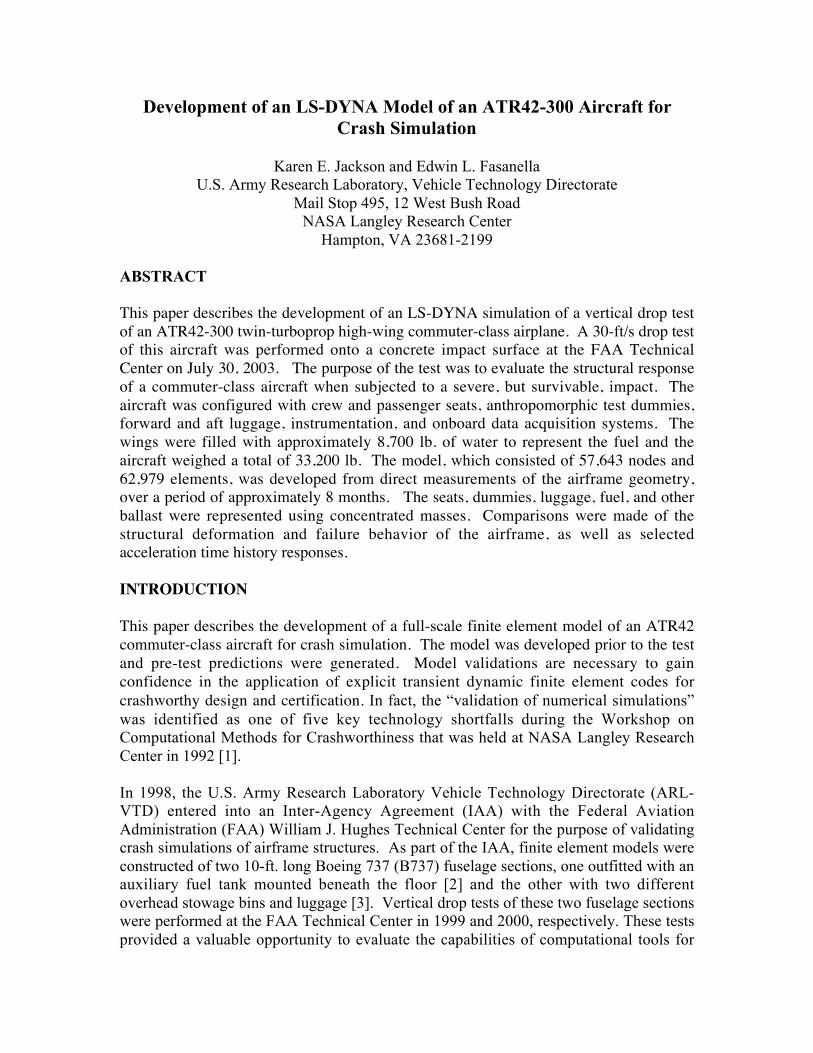
On July 30, 2003, a 30-ft/s vertical drop test of an ATR42 aircraft was conducted usingthe Dynamic Drop Test Facility located at the FAA Technical Center. A pre-testphotograph of the test article, raised to the drop height of 14-ft., is shown in Figure 1.This twin-turboprop, high-wing, commuter-class aircraft was developed andmanufactured through a joint effort by Aerospatiale in France and Aeritalia in Italy. Theaircraft has a wingspan of 80 ft., a seating capacity of 42-50 passengers, a maximumcruise speed of 304 knots/hour, and a maximum gross take-off weight of approximately41,000 lb. The drop test was performed onto a concrete surface. The purpose of the testwas to evaluate the dynamic structural response of the aircraft when subjected to asevere, but survivable, impact. Particular attention was given to the seat and occupantresponses to evaluate the FAA’s proposed dynamic seat requirements for commuter-classaircraft.
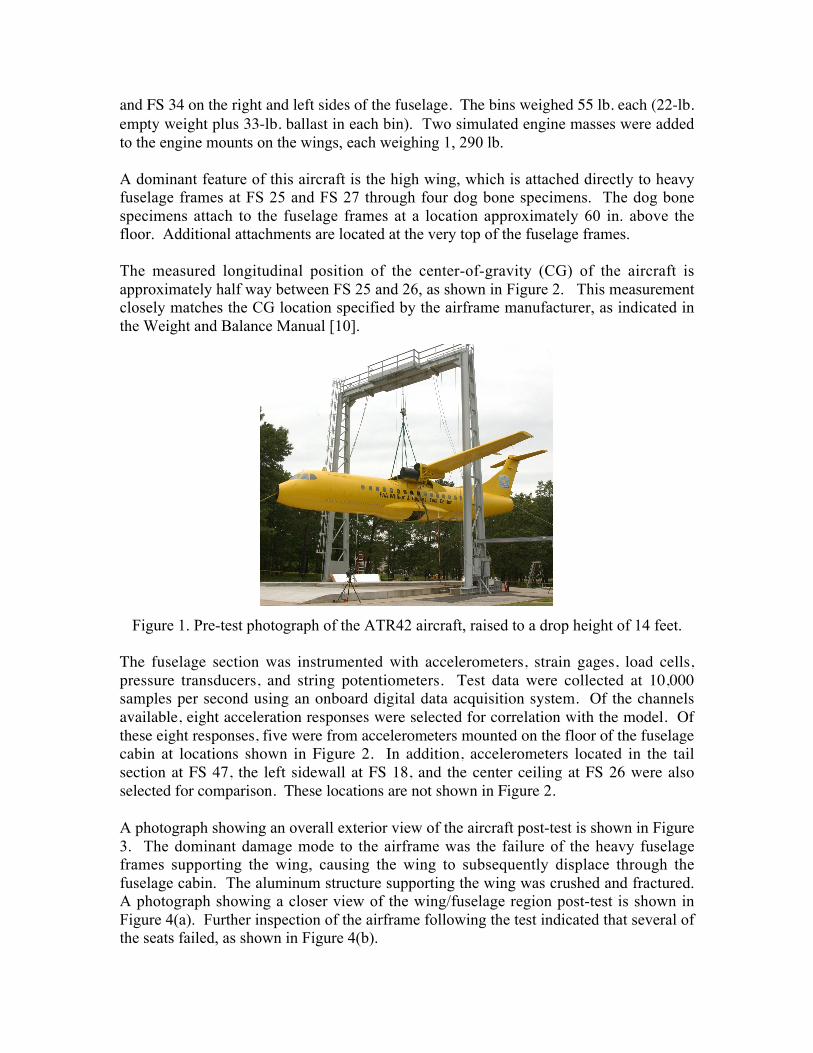
A schematic drawing of the floor of the aircraft is shown in Figure 2. The total weight ofthe aircraft prior to the drop test was 33,200 lb. A large portion of the total weight wasthe 8,700-lb. of water added to the fuel tanks in the wings to represent fuel. In addition,16 double-occupant aircraft seats weighing 51 lb. each and 3 crew seats weighing 20 lb.each were attached to seat tracks on the floor, as shown in Figure 2. Seven ATDs and 16mannequins, each weighing approximately 170 lb., were seated in various locations, asindicated in Figure 2. Ballast weights equaling 135- and 152-lb. were added to some ofthe empty seats to represent the mass of occupants. The forward and aft storagecompartments were filled with 1,450- and 739-lb. of luggage, respectively. In addition tothe ballast, two overhead stowage bins were mounted between Frame Station 30 (FS 30)
and FS 34 on the right and left sides of the fuselage. The bins weighed 55 lb. each (22-lb.empty weight plus 33-lb. ballast in each bin). Two simulated engine masses were addedto the engine mounts on the wings, each weighing 1, 290 lb.
A dominant feature of this aircraft is the high wing, which is attached directly to heavyfuselage frames at FS 25 and FS 27 through four dog bone specimens. The dog bonespecimens attach to the fuselage frames at a location approximately 60 in. above thefloor. Additional attachments are located at the very top of the fuselage frames.
The measured longitudinal position of the center-of-gravity (CG) of the aircraft isapproximately half way between FS 25 and 26, as shown in Figure 2. This measurementclosely matches the CG location specified by the airframe manufacturer, as indicated inthe Weight and Balance Manual [10].
Figure 1. Pre-test photograph of the ATR42 aircraft, raised to a drop height of 14 feet.
The fuselage section was instrumented with accelerometers, strain gages, load cells,pressure transducers, and string potentiometers. Test data were collected at 10,000samples per second using an onboard digital data acquisition system. Of the channelsavailable, eight acceleration responses were selected for correlation with the model. Ofthese eight responses, five were from accelerometers mounted on the floor of the fuselagecabin at locations shown in Figure 2. In addition, accelerometers located in the tailsection at FS 47, the left sidewall at FS 18, and the center ceiling at FS 26 were alsoselected for comparison. These locations are not shown in Figure 2.
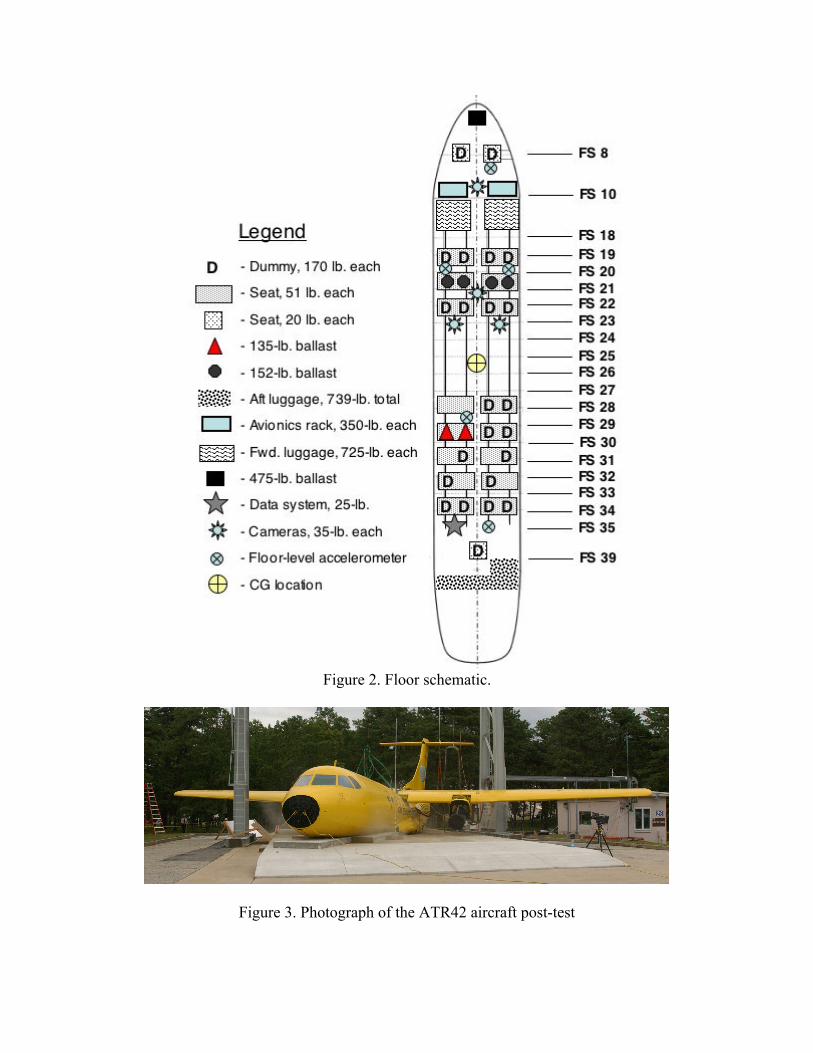
A photograph showing an overall exterior view of the aircraft post-test is shown in Figure3. The dominant damage mode to the airframe was the failure of the heavy fuselageframes supporting the wing, causing the wing to subsequently displace through thefuselage cabin. The aluminum structure supporting the wing was crushed and fractured.A photograph showing a closer view of the wing/fuselage region post-test is shown inFigure 4(a). Further inspection of the airframe following the test indicated that several ofthe seats failed, as shown in Figure 4(b).
Figure 2. Floor schematic.
Figure 3. Photograph of the ATR42 aircraft post-test
(a) Close-up view. (b) Interior view.
Figure 4. Post-test photographs.
MODEL DEVELOPMENT
The finite element model of the ATR42 aircraft was developed from geometric datagathered from direct measurements of the aircraft, which were input into MSC.Patrandatabase files. The geometric data were received from the FAA in six installments, eachcontaining increasingly more detailed information on the shape and dimensions of theairframe. As each file was received, the new information was input into a mastergeometry file of the entire aircraft. The final geometry model of the aircraft, shown inFigure 5, consisted of 25,917 points; 17,270 curves; and 17,768 surfaces. The geometrymodel was discretized into a finite element mesh, element and material properties wereassigned, contact and initial velocity conditions were defined, and the model wasexecuted to generate analytical predictions of structural deformation and time historyresponses.
Figure 5. Final geometry model of the ATR42 aircraft.
The finite element model of the ATR42 aircraft, shown in Figure 6, contained 57,643nodes and 62,979 elements including 60,197 quadrilateral shell elements; 551 triangularshell elements; 526 beam elements; and, 1,705 point elements.
(a) Front view.
(b) Side view.
(c) Top view.
(d) Three-quarter view.
Figure 6. Finite element model of the ATR42 aircraft.
An automatic contact (CONTACT_AUTOMATIC_SINGLE_SURFACE) was specifiedfor the model, which is a generic contact definition that prescribes that no node canpenetrate through any surface in the model. An impact surface was created to representthe concrete pad beneath the drop tower. This surface was modeled as a 5-in. thickaluminum plate, encompassing the total length and width of the aircraft, as shown in
Figure 6(d). Three main material properties are defined in the model for aluminumAl2024-T3, aluminum Al7076-T5, and titanium Ti-6Al-4V. These properties weredefined using the MAT_PLASTIC_KINEMATIC card in LS-DYNA for a linear elastic-plastic material with input values for density, Poisson’s ratio, Young’s modulus, yieldstress, hardening modulus, and an ultimate failure strain. Most of the sheet metal parts,such as the outer skin were assigned material properties of Al2024-T3. The forged metalparts, such as the fuselage frames, floor beams, and seat tracks were assigned materialproperties of Al7076-T5. The “dog bone” specimens used to attach the wing to thefuselage frames at FS 25 and FS 27 were assigned material properties of titanium. Thematerial property designations for each component were obtained from the aircraftmanufacturer’s Weight and Balance Manual [10] and the material property values werefound in MIL-HDBK-5H [11].
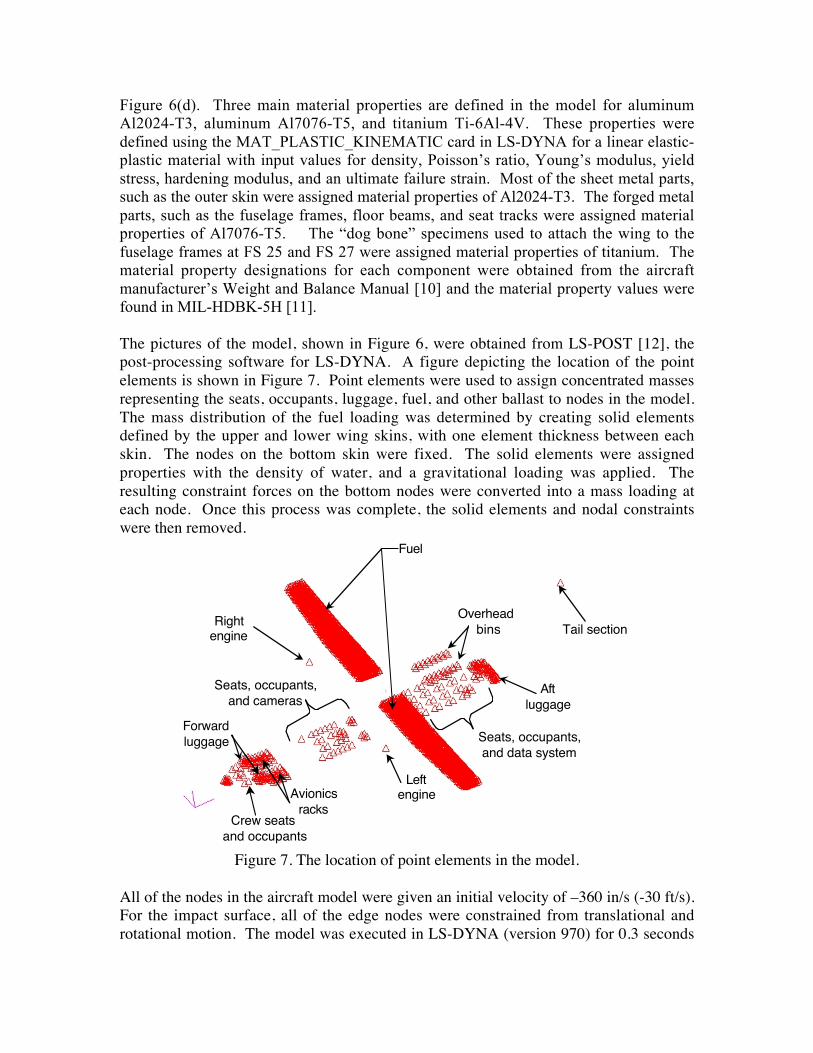
The pictures of the model, shown in Figure 6, were obtained from LS-POST [12], thepost-processing software for LS-DYNA. A figure depicting the location of the pointelements is shown in Figure 7. Point elements were used to assign concentrated massesrepresenting the seats, occupants, luggage, fuel, and other ballast to nodes in the model.The mass distribution of the fuel loading was determined by creating solid elementsdefined by the upper and lower wing skins, with one element thickness between eachskin. The nodes on the bottom skin were fixed. The solid elements were assignedproperties with the density of water, and a gravitational loading was applied. Theresulting constraint forces on the bottom nodes were converted into a mass loading ateach node. Once this process was complete, the solid elements and nodal constraintswere then removed.
Fuel
Rightengine
Leftengine
Tail sectionOverhead
bins
Aftluggage
Forwardluggage
Avionicsracks
Seats, occupants,and cameras
Seats, occupants,and data system
Crew seats and occupants
Figure 7. The location of point elements in the model.
All of the nodes in the aircraft model were given an initial velocity of –360 in/s (-30 ft/s).For the impact surface, all of the edge nodes were constrained from translational androtational motion. The model was executed in LS-DYNA (version 970) for 0.3 seconds
of simulation time, which required 130 hours of CPU on a single processor HewlettPackard workstation x4000.
As a quality check on the model, the total weight and longitudinal CG location of themodel were compared with those of the test article. The weight of the aircraft was 33,200lb. and the total weight of the aircraft model was 32,900 lb., just 300 lb. lighter than thetest article. The measured longitudinal CG position of the test article was 469.2 in. fromthe reference location. For the model, the longitudinal CG position was 474.1 in. fromthe reference location, within 5 inches of the experimental value.
TEST-ANALYSIS CORRELATION
The test-analysis correlation consists of comparisons of experimental and predictedstructural deformation and selected acceleration and velocity time history responses.
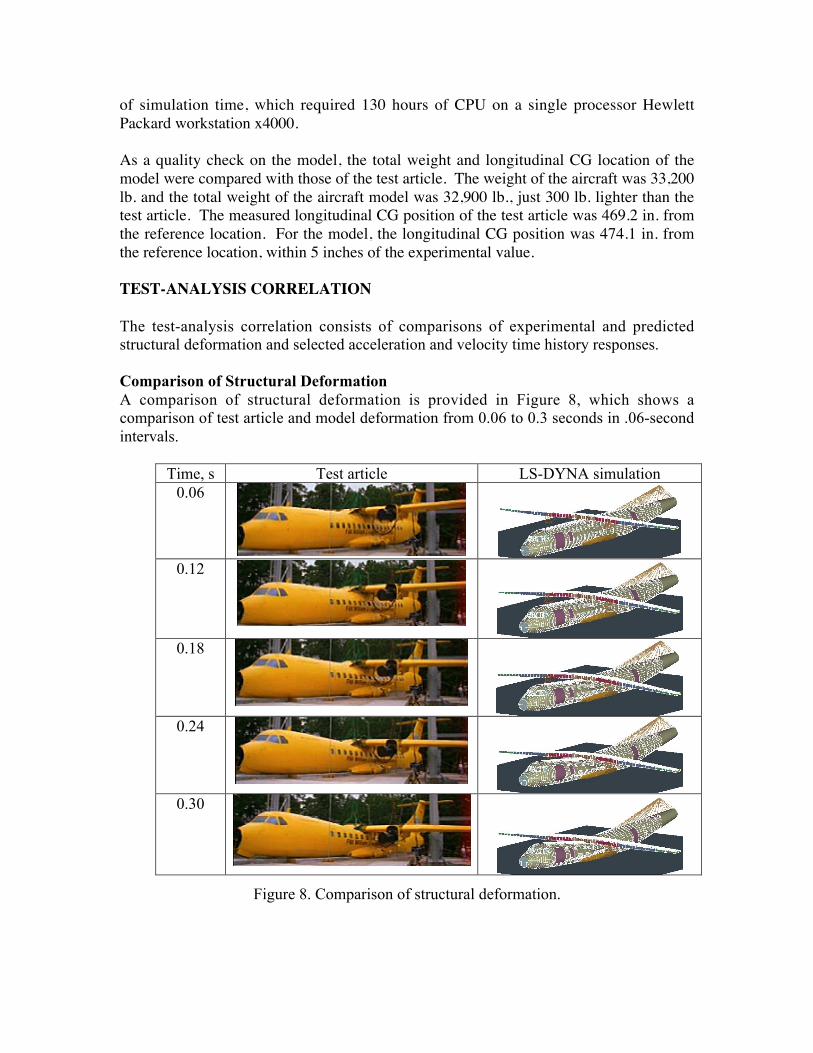
Comparison of Structural DeformationA comparison of structural deformation is provided in Figure 8, which shows acomparison of test article and model deformation from 0.06 to 0.3 seconds in .06-secondintervals.
Time, s Test article LS-DYNA simulation0.06
0.12
0.18
0.24
0.30
Figure 8. Comparison of structural deformation.
The pictures of model deformation were obtained from the post-processing file, and theexperimental pictures were captured from the high-speed video. In general, the modelaccurately predicts the structural deformation and failure behavior of the test article,including collapse and failure of the fuselage structure beneath the wing. In both the testand analysis, the failure is initiated by fracture of the fuselage frames at FS 25 and FS 27,and not failure of the dog bone specimens. The frame failures allow the wing to translatedownward through the fuselage cabin. However, some differences are noted. In themodel, the wing exhibits considerable flexure and bending at the tips and this behavior isnot seen in the test.
Comparison of Selected Acceleration Time History ResponsesThe raw experimental acceleration data were plotted versus time, integrated to obtain thevelocity time history response, and filtered using a low-pass digital filter based on theSAE J211/1 specifications [13]. A variety of filter frequencies were applied in anattempt to obtain a discernable single acceleration pulse, while at the same time notdistorting the integrated velocity response. The distortion is determined by comparingthe velocity responses obtained by integrating the raw acceleration data and byintegrating the filtered acceleration data. A filtering frequency of 33.2 Hz was selectedbecause it met these criteria. The experimental and analytical acceleration pulses shownin this section of the paper were filtered at this frequency.
The experimental and analytical acceleration responses for the left and right outer seattrack locations at FS 20 are shown in Figure 9. For the test, the main acceleration pulse isless than 0.1-second in duration, and exhibits two main peaks. For the left outer seattrack location, the first acceleration peak is smaller in magnitude than the second, whichhas a magnitude of 28 g. For the right outer seat track location, the two accelerationpeaks are of the same magnitude, about 24 g. In both cases, the predicted accelerationresponses also exhibit two peaks, with the second being higher in magnitude than thefirst. The pulse durations of the analytical responses are almost identical to that of theexperimental responses. For comparison, the raw experimental and analyticalacceleration data were integrated to obtain the velocity time history responses at thesetwo locations. The velocity responses are shown in Figure 10. The level of agreementbetween the test and analysis is good, though the test data shows a higher reboundvelocity than predicted by the analysis for the right outer seat track location.
Next, the experimental and analytical acceleration responses of the right side of thecockpit floor are plotted in Figure 11. Again, the experimental acceleration responseexhibits two peaks; however, in this case the first peak of 34 g is higher in magnitudethan the second of 28 g. The predicted acceleration response shows a single pulse, oflonger duration than the experiment, with a peak acceleration of 32 g.
The experimental and analytical acceleration responses of the left and right inner seattrack locations at FS 29 and FS 35, respectively, are plotted in Figure 12. The locationsof these two accelerometers are shown in the schematic drawing of Figure 2. Theaccelerometer at FS 29 is located slightly to the rear of the fuselage frames supporting thewings, while the accelerometer at FS 35 is located at the very rear of the aircraft. The
filtered experimental accelerations exhibit high-amplitude, low frequency responses,making it difficult to discern a single acceleration pulse. In general, the predictedacceleration responses show good agreement with the experimental data at these twolocations.
-20
-10
0
10
20
30
40
-0.05 0 0.05 0.1 0.15 0.2 0.25
ExperimentAnalysis
Acceleration, g
Time, s
-20
-10
0
10
20
30
40
-0.05 0 0.05 0.1 0.15 0.2 0.25
ExperimentAnalysis
Acceleration, g
Time, s
(a) Left outer seat track at FS 20. (b) Right outer seat track at FS 20.Figure 9. Experimental and analytical acceleration responses for the left and right outer
seat track locations at FS 20.
-400
-300
-200
-100
0
100
200
0 0.05 0.1 0.15 0.2 0.25
ExperimentAnalysis
Velocity, in/s
Time, s
-400
-300
-200
-100
0
100
200
0 0.05 0.1 0.15 0.2 0.25
ExperimentAnalysis
Velocity, in/s
Time, s(a) Left outer seat track at FS 20. (b) Right outer seat track at FS 20.
Figure 10. Experimental and analytical velocity responses for the left and right outerseat track locations at FS 20.
-10
0
10
20
30
40
-0.05 0 0.05 0.1 0.15 0.2 0.25
ExperimentAnalysis
Acceleration, g
Time, s
Figure 11. Experimental and analytical acceleration responses of the right side of thecockpit floor.
The experimental and predicted acceleration responses of the center of the tail section atFS 47 are plotted in Figure 13. Unlike the floor acceleration responses, which had pulsedurations of less than 0.1 second, this response is 0.2 seconds long. Both theexperimental and analytical acceleration responses exhibit a single pulse, ofapproximately the same duration, with magnitudes of 12 and 13 g’s, respectively.
-20
-10
0
10
20
30
40
-0.05 0 0.05 0.1 0.15 0.2 0.25
ExperimentAnalysis
Acceleration, g
Time, s
-20
-10
0
10
20
30
-0.05 0 0.05 0.1 0.15 0.2 0.25
ExperimentAnalysis
Acceleration, g
Time, s (a) Left inner seat track at FS 29. (b) Right inner seat track at FS 35.
Figure 12. Experimental and analytical acceleration responses of the left and right innerseat track locations at FS 29 and FS 35, respectively.
-5
0
5
10
15
-0.05 0 0.05 0.1 0.15 0.2 0.25
ExperimentAnalysis
Acceleration, g
Time, s
Figure 13. Experimental and analytical acceleration responses of the center of thefuselage at FS 47.
The experimental and analytical acceleration responses of the left sidewall at FS 18 areplotted in Figure 14. This accelerometer was located on the sidewall approximately 12in. above the floor and was oriented in the vertical direction. The analytical accelerationresponse closely matches the magnitude (peak acceleration of 25 g’s for the analysiscompared with 22.5 g’s for the experiment) and duration of the experimental pulse.
-10
-5
0
5
10
15
20
25
30
-0.05 0 0.05 0.1 0.15 0.2 0.25
ExperimentAnalysis
Acceleration, g
Time, s
Figure 14. Test and analysis acceleration responses of the left sidewall at FS 18.
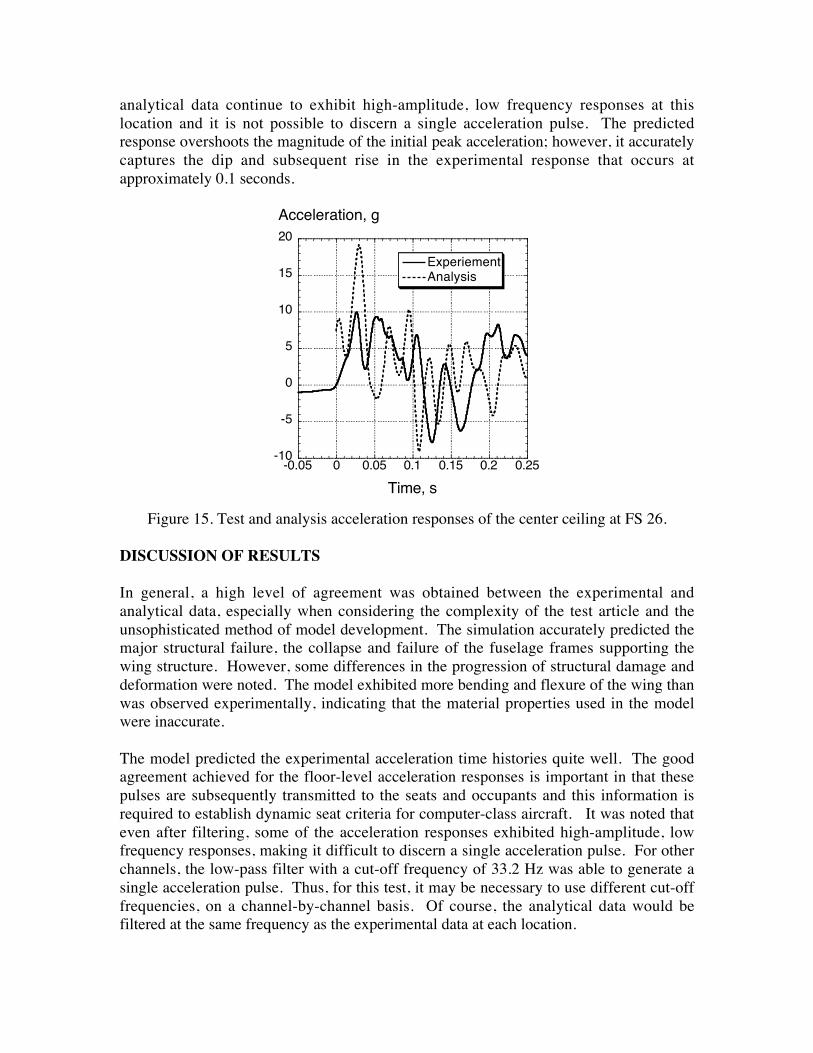
The final time history comparison is shown in Figure 15, in which the experimental andanalytical acceleration responses of the center ceiling at FS 26 are plotted. This locationis essentially at the center of the bottom skin of the wing. The filtered experimental and
analytical data continue to exhibit high-amplitude, low frequency responses at thislocation and it is not possible to discern a single acceleration pulse. The predictedresponse overshoots the magnitude of the initial peak acceleration; however, it accuratelycaptures the dip and subsequent rise in the experimental response that occurs atapproximately 0.1 seconds.
-10
-5
0
5
10
15
20
-0.05 0 0.05 0.1 0.15 0.2 0.25
ExperiementAnalysis
Acceleration, g
Time, s
Figure 15. Test and analysis acceleration responses of the center ceiling at FS 26.
DISCUSSION OF RESULTS
In general, a high level of agreement was obtained between the experimental andanalytical data, especially when considering the complexity of the test article and theunsophisticated method of model development. The simulation accurately predicted themajor structural failure, the collapse and failure of the fuselage frames supporting thewing structure. However, some differences in the progression of structural damage anddeformation were noted. The model exhibited more bending and flexure of the wing thanwas observed experimentally, indicating that the material properties used in the modelwere inaccurate.
The model predicted the experimental acceleration time histories quite well. The goodagreement achieved for the floor-level acceleration responses is important in that thesepulses are subsequently transmitted to the seats and occupants and this information isrequired to establish dynamic seat criteria for computer-class aircraft. It was noted thateven after filtering, some of the acceleration responses exhibited high-amplitude, lowfrequency responses, making it difficult to discern a single acceleration pulse. For otherchannels, the low-pass filter with a cut-off frequency of 33.2 Hz was able to generate asingle acceleration pulse. Thus, for this test, it may be necessary to use different cut-offfrequencies, on a channel-by-channel basis. Of course, the analytical data would befiltered at the same frequency as the experimental data at each location.
CONCLUDING REMARKS
A full-scale three-dimensional finite element model of a twin-turboprop high-wingcommuter-class aircraft, the ATR42-300, was developed and executed as a crashsimulation. The analytical predictions were correlated with test data obtained from a 30-ft/s vertical drop test of the aircraft that was conducted using the Dynamics Drop TestFacility at the FAA William J. Hughes Technical Center in Atlantic City, NJ. For thetest, the aircraft was configured with seats, anthropomorphic test devices, luggage in theforward and aft compartments, and 8,700-lb of water in the wings to represent the fuelloading. The finite element model of the aircraft was developed from direct geometricmeasurements and contained 57,643 nodes and 62,979 elements including 60,197quadrilateral shell elements; 551 triangular shell elements; 526 beam elements; and,1,705 point elements. The model was executed in LS-DYNA, a commercial code forperforming explicit transient dynamic simulations.
The analytical predictions correctly simulated the major damage mode seen during thetest which was collapse and failure of the fuselage structure beneath the wing. Thesestructural failures allowed the wing to displace vertically through the fuselage cabin.Finally, the predicted acceleration responses showed a high level of correlation with thetest data, which is remarkable considering the complexity of the test article and theunsophisticated method of model development. It was particularly important to obtainaccurate prediction of the floor-level acceleration responses, since these pulses aretransmitted to the seat and occupants. This data will be useful in evaluating the FAA’sproposed dynamic seat standards for commuter-class aircraft.
ACKNOWLEDGEMENTS
The authors acknowledge Gary Frings, Allan Abramowitz, Tong Vu, and Tim Smith ofthe FAA for their assistance with the geometry model development, and for providing thetest data, pre- and post-test photographs, and videos of the test. Also, we acknowledgethe support of Alan Stockwell and Hasan Abu-Khajeel of Lockheed Martin SpaceOperations at NASA Langley Research Center for their assistance with the modeldiscretization.
REFERENCES
1. Noor, A., and Carden H. C., editors, "Computational Methods for Crashworthiness,"NASA Conference Publication 3223, October 1993.
2. Abramowitz, A., Smith, T. G, Vu, T., “Vertical Drop Test of a Narrow-BodyTransport Section with a Conformable Auxiliary Fuel Tank Onboard.” DOT/FAA/AR-00/56, October 2000.
3. Abramowitz, A., Smith, T. G., Vu, T., Zvanya, J. R., "Vertical Drop Test of a Narrow-Body Transport Fuselage Section with Overhead Stowage Bins," DOT/FAA/AR-01/100,September 2002.
4. Anon., “MSC.Dytran User’s Manual Version 4.7,” The MacNeal-SchwendlerCorporation, Los Angeles, CA, 1999.
5. Jackson, K. E. and Fasanella, E. L., "Crash Simulation of a Vertical Drop Test of aB737 Fuselage Section with Overhead Bins and Luggage," Proceedings of the ThirdTriennial Aircraft Fire and Cabin Safety Conference, Atlantic City, NJ, October 22-25,2001.
6. Fasanella, E. L. and Jackson, K. E., "Crash Simulation of a Vertical Drop Test of aB737 Fuselage Section with an Auxiliary Fuel Tank," Proceedings of the Third TriennialAircraft Fire and Cabin Safety Conference, Atlantic City, NJ, October 22-25, 2001.
7. Jackson, Karen E. and Fasanella, E. L., “Crash Simulation of Vertical Drop Tests ofTwo Boeing 737 Fuselage Sections,” DOT/FAA/AR-02/62, August 2002.
8. Anon., “MSC.PATRAN,” Publication No. 903077, Version 6, The MacNeal-Schwendler Corporation, 1996.
9. Anon., “LS-DYNA Keyword User’s Manual Volume I and II - Version 960,”Livermore Software Technology Company, Livermore, CA, March 2001.
10. Anon., “Weight and Balance Manual,” Avions de Transport Regional, ServiceBulletin No. ATR42-34-0114, issued March 1992.
11. Military Handbook 5H, U.S. Department of Defense, 1 December 1998.
12. Anon., “LS-PRE/POST v. 1.0 Manual” Livermore Software Technology Company,Livermore, CA, August 27, 2002.
13. Society of Automotive Engineers, Recommended Practice: Instrumentation forImpact Test – Part 1, Electronic Instrumentation, SAE J211/1, March 1995.


![On the validation of the LS-DYNA Geo Metro numerical model · simulations. In this paper LS-DYNA finite element code [3,4] version R8.1 has been used for crash test modelling and](https://static.documents.pub/doc/80x56/606f0f3463be031cfe1f3ca4/on-the-validation-of-the-ls-dyna-geo-metro-numerical-model-simulations-in-this.jpg)


