Page 1
DEVELOPMENT OF BOVINE CARTILAGE EXTRACELLULAR
MATRIX AS A POTENTIAL SCAFFOLD FOR CHONDROGENIC
INDUCTION OF HUMAN DERMAL FIBROBLASTS
ALI MORADI
FACULTY OF ENGINEERING
UNIVERSITY OF MALAYA
KUALA LUMPUR
2015
Page 2
DEVELOPMENT OF BOVINE CARTILAGE EXTRACELLULAR
MATRIXAS A POTENTIAL SCAFFOLD FOR CHONDROGENIC
INDUCTION OF HUMAN DERMAL FIBROBLASTS
ALI MORADI
THESIS SUBMITTED INFULFILMENT OF THE
REQUIREMENTSFOR THE DEGREE OF DOCTOR OF PHILOSOPHY
FACULTY OF ENGINEERING
UNIVERSITY OF MALAYA
KUALA LUMPUR
2015
Page 3
ii
UNIVERSITY OF MALAYA
ORIGINAL LITERARY WORK DECLARATION
Name of Candidate: Ali Moradi (Passport No: H95660248)
Matric No: KHA100055
Name of Degree: Doctor of Philosophy
Title of Thesis: The development of bovine cartilage extracellular matrix
as a potential scaffold for chondrogenic induction of human dermal fibroblasts
Field of Study: Tissue Engineering
I do solemnly and sincerely declare that:
(1) I am the sole author/writer of this Work;
(2) This Work is original;
(3) Any use of any work in which copyright exists was done by way of fair
dealing and for permitted purposes and any excerpt or extract from, or
reference to or reproduction of any copyright work has been disclosed
expressly and sufficiently and the title of the Work and its authorship have
been acknowledged in this Work;
(4) I do not have any actual knowledge nor do I ought reasonably to know that
the making of this work constitutes an infringement of any copyright work;
(5) I hereby assign all and every rights in the copyright to this Work to the
University of Malaya (“UM”), who henceforth shall be owner of the
copyright in this Work and that any reproduction or use in any form or by any
means whatsoever is prohibited without the written consent of UM having
been first had and obtained;
(6) I am fully aware that if in the course of making this Work I have infringed
any copyright whether intentionally or otherwise, I may be subject to legal
action or any other action as may be determined by UM.
Candidate’s Signature Date:
Subscribed and solemnly declared before,
Witness’s Signature Date:
Name:
Designation:
Page 4
iii
ABSTRACT
Tissue engineering aims to find an ultimate solution for cartilage regeneration. Current
strategies for cartilage repair using chondrocytes are limited by the usability of cell
sources as observed in several contemporary techniques such as autologous cell
implantations. Cartilage tissue engineering strategies involving scaffold fabrication are
common. However, only few studies have described the use of scaffolds as a promoter
for chondrogenic differentiation. Cartilage extracellular matrix derived scaffolds contain
many bioactive factors that have chondrogenic potential of which if appropriately
managed, may provide the key to successful cartilage repair outcomes. The present
thesis describes a potential biomaterial derived from bovine articular cartilage that
possesses chondrogenic properties, thereby being expected to promote cartilage
regeneration.
Bovine articular cartilage matrix derived (CMD) porous scaffolds were fabricated at
three different concentrations (5%, 15% and 30%), through the use of freeze-drying
method or, physically treated for cross-linking enhancement using either ultra-violet
(UV) light or, dehydrothermal (DHT) treatment or a combination of both methods. The
scaffolds were characterized using morphology, FESEM, FTIR, TGA, DSC, and
porosimetry. UV and UVDHT treated 15% CMD scaffolds were found to be the best
scaffold possessing the best possible physical properties. Human dermal fibroblast cells
(HDF) isolated from redundant skin obtained through cosmoplastic surgery were used
as cells for the in vitro analysis. HDF cells were cultured on UV and UVDHT treated
15% CMD scaffolds for 42 days. Resazurin reduction test and DNA quantification
showed an increasing cell proliferation during the first 3 weeks. GAGs production and
the up-regulation ofSOX9, COMP, COL2A1, and ACAN genes were seenthroughout6
weeks of cell-scaffold culture. The increase or decrease in HDF cell proliferation,
Page 5
iv
GAGs production and gene expression appeared correlated with the scaffold shrinkage
and contraction patterns.
In conclusion, bovine articular CMD porous scaffolds have the potential to induce
chondrogenic differentiation in human dermal fibroblasts. Whilst the present thesis did
not demonstrate the precise underlying mechanisms by which chondroinduction is
achieved from these CMD scaffolds, it is proposed that future studies are conducted to
investigate the involved pathways to better demonstrate the chondrogenic properties of
this material.
Page 6
v
ABSTRAK
Kejuruteraan tisu bertujuan untuk mencari penyelesaian muktamad untuk pertumbuhan
semula rawan. Strategi semasa untuk pembaikan tulang rawan menggunakan kondrosit
adalah terhad dengan kebolehgunaan sumber sel seperti yang berlaku di beberapa teknik
kontemporari seperti implantations sel autologous. Strategi kejuruteraan tisu tulang
rawan yang melibatkan fabrikasi perancah adalah biasa. Walau bagaimanapun, hanya
beberapa kajian telah menggambarkan penggunaan perancah sebagai penganjur bagi
pembezaan chondrogenic. Perancah matriks extracellular tulang rawan mengandungi
banyak faktor bioaktif yang mempunyai potensi chondrogenic jika diurus dengan baik,
boleh menyediakan kunci kepada hasil pembaikan rawan berjaya. Tesis ini
menerangkan biobahan potensi berasal dari tulang rawan artikular lembu yang
mempunyai ciri-ciri chondrogenic, yang dijangka menggalakkan pertumbuhan semula
rawan.Perancah berliang matriks tulang rawan artikular lembu (CMD) yang diperolehi
telah direka di tiga kepekatan yang berbeza (5%, 15% dan 30%), dengan menggunakan
kaedah beku-pengeringan atau, fizikal dirawat untuk peningkatan hubungan silang
sama ada menggunakan ultra-ungu (UV) atau, dehydrothermal (DHT) rawatan atau
gabungan kedua-dua kaedah. Perancah telah dicirikan menggunakan morfologi,
FESEM, FTIR, TGA, DSC, dan porosimetri. Perancah CMD yang dirawat dengan 15%
UV dan UVDHT merupakan perancah terbaik yang mempunyai kemungkinan sifat-sifat
fizikal. Sel-sel kulit fibroblast manusia (HDF) diasingkan daripada kulit berlebihan
yang diperoleh melalui pembedahan cosmoplastic telah digunakan sebagai sel-sel dalam
vitro analisis. Sel HDF dikulturkan di atas perancah CMD dirawat dengan 15% UV dan
UVDHT untuk 42 hari. Pengurangan dalam ujian Resazurin dan kuantifikasi DNA
menunjukkan percambahan sel yang semakin meningkat dalam tempoh 3 minggu
pertama. Penghasilan GAGs dan kitaran atasan bagi gen SOX9, COMP, COL2A1, dan
ACAN diperhatikan sepanjang 6 minggu kultur sel-perancah. Peningkatan atau
Page 7
vi
pengurangan dalam percambahan sel HDF, penghasilan GAGs dan eksperasi gen yang
muncul dikaitkan dengan pengecutan perancah dan corak pengecutan.
Kesimpulannya, perancah berliang artikular lembu CMD mempunyai potensi untuk
mendorong pembezaan chondrogenic dalam fibroblas kulit manusia. Manakala tesis ini
tidak menunjukkan mekanisme yang tepat tentang chondroinduction yang dicapai
daripada ini perancah CMD, adalah dicadangkan bahawa kajian masa depan perlu
dijalankan untuk menyiasat laluan yang terlibat supaya lebih sifat chondrogenic bahan
ini dapat ditunjukkan.
Page 8
vii
ACKNOWLEDGEMENT
Foremost, I would like to express my sincere gratitude to my advisors namely Prof. Dr.
Belinda Murphy and Prof. Dr. Tunku Kamarul Zaman for the continuous support of my
Ph.D study and research, for their patience, motivation, enthusiasm, and immense
knowledge. Their guidance helped me in all the time of research and writing of this
thesis. I could not have imagined having better advisors and mentors for my Ph.D study.
Besides my advisor, I would like to thank Dr. Sumit Pramanik, for his encouragement,
insightful comments, and hard questions.
I thank my fellow lab-mates in Tissue Engineering Lab, Faculty of Engineering, and
Tissue Engineering Group (TEG), National Orthopaedic Centre for Research and
Learning (NOCERAL), Faculty of Medicine, University of Malaya: Dr. Havva
Dashtdar, Dr. Hussin Rothan Alwan, Eng. Haris Bin Akram, Eng. Iklil Radzi, Dr.
Forough Ataollahi, Eng. Adel Dalilottojari, Eng. K. Sayar, Dr. Yasir Muhammad Al-
Saffar, Eng. Eraj Homayoun Mirza, Eng. Poon Chi Tat, and Liyana Binti Abu, for the
stimulating discussions, for the sleepless nights we were working together before
deadlines, and for all the fun we have had in the last four years.
Last but not the least I would like to thank my family: my mother, my wife Rose, my
sons Homayoun and Hooman and my brothers and sisters for supporting me spiritually
throughout my life.
Page 9
viii
TABLE OF CONTENTS
ABSTRACT .................................................................................................................... iii
ABSTRAK ....................................................................................................................... v
ACKNOWLEDGEMENT ............................................................................................ vii
TABLE OF CONTENTS ............................................................................................. viii
LIST OF FIGURES ...................................................................................................... xii
LIST OF TABLES ........................................................................................................ xx
LIST OF SYMBOLS AND ABBREVIATIONS ....................................................... xxi
CHAPTER 1: INTRODUCTION ............................................................................. 1
1.1 Introduction ........................................................................................................ 1
1.2 Problem statement .............................................................................................. 3
1.3 Objectives ........................................................................................................... 4
1.4 Thesis layout ....................................................................................................... 4
CHAPTER 2: LITERATURE REVIEW ................................................................. 5
2.1 Introduction ........................................................................................................ 5
2.2 Biochemical Composition of Articular Cartilage ............................................... 6
2.2.1 Water ........................................................................................................... 7
2.2.2 Collagens ..................................................................................................... 8
2.2.3 Proteoglycans .............................................................................................. 8
2.3 Rationale of Current Study ................................................................................. 8
2.4 Bovine Articular Cartilage: A Potential Source of Cartilage Matrix ............... 10
2.5 Enhancing Mechanical Properties .................................................................... 11
2.5.1 Chemical cross-linking.............................................................................. 11
2.5.2 Physical cross-linking ............................................................................... 12
2.6 Human Skin: A potential source of cells (Fibroblasts) .................................... 13
CHAPTER 3: FABRICATION, CHARACTERIZATION AND
OPTIMIZATION OF CMD SCAFFOLDS ................................................................ 17
3.1 Introduction ...................................................................................................... 17
Page 10
ix
3.2 Materials and Methods ..................................................................................... 19
3.2.1 Cartilage Matrix Derived (CMD) Scaffold Preparation ........................... 19
3.2.2 Characterization of CMD Scaffolds .......................................................... 21
3.3 Results .............................................................................................................. 24
3.3.1 Bovine Articular Cartilage Water Content ................................................ 24
3.3.2 Macro and Micro Morphologies of the CMD Scaffolds ........................... 24
3.3.3 Porosity of CMD scaffolds ....................................................................... 29
3.3.4 Compressive tests ...................................................................................... 32
3.3.5 Surface Morphology.................................................................................. 33
3.3.6 Thermogravimetric Analysis (TGA) ......................................................... 34
3.3.7 Differential Scanning Calorimetry (DSC) ................................................ 35
3.3.8 FTIR .......................................................................................................... 36
3.4 Discussion ........................................................................................................ 38
CHAPTER 4: DEVELOPMENT OF MICROVOLUMETRIC
MODIFICATION OF LIQUID DISPLACEMENT METHOD FOR POROSITY
MEASUREMENT ......................................................................................................... 42
4.1 Introduction ...................................................................................................... 42
4.2 Materials and Methods ..................................................................................... 45
4.2.1 Experimental Set up .................................................................................. 45
4.2.2 Validation of Microvolumetric method .................................................... 49
4.2.3 Statistical Analysis .................................................................................... 50
4.3 Results .............................................................................................................. 50
4.4 Conclusion ........................................................................................................ 89
CHAPTER 5: ISOLATION, CULTURE AND CHARACTERIZATION OF
HUMAN DERMAL FIBROBLASTS ......................................................................... 91
5.1 Introduction ...................................................................................................... 91
5.2 Materials and Methods ..................................................................................... 91
5.2.1 Cell Isolation ............................................................................................. 91
5.2.2 Cell Harvesting.......................................................................................... 93
5.2.3 Cell Count and Viability (Dye Exclusion Method)................................... 94
Page 11
x
5.2.4 Resazurin Standard Curve for HDFs......................................................... 96
5.2.5 HDF cell doubling time ............................................................................. 99
5.2.6 Characterization of HDFs ....................................................................... 103
5.3 Results ............................................................................................................ 112
5.3.1 HDF Cell Morphology ............................................................................ 112
5.3.2 HDF Resazurin Standard Curves ............................................................ 113
5.3.3 DNA standard Curve ............................................................................... 120
5.3.4 HDF Cell Doubling Time........................................................................ 121
5.3.5 Tri-lineage differentiation ....................................................................... 121
5.3.6 Immunostaining ...................................................................................... 123
5.3.7 Gene expression ...................................................................................... 125
5.4 Discussion ...................................................................................................... 126
CHAPTER 6: CHONDROGENIC EFFECTS OF CMD SCAFFOLDS ON
HDFs 128
6.1 Introduction .................................................................................................... 128
6.2 Materials and Methods ................................................................................... 129
6.2.1 Cell Seeding ............................................................................................ 129
6.2.2 Cell Growth and Viability ....................................................................... 130
6.2.3 Cell Proliferation ..................................................................................... 130
6.2.4 Cell-scaffold Interaction Studies ............................................................. 131
6.2.5 DNA Quantification ................................................................................ 131
6.2.6 Construct Shrinkage and Contraction ..................................................... 131
6.2.7 GAGs Quantification .............................................................................. 133
6.2.8 Gene Expression...................................................................................... 133
6.2.9 Gene Expression...................................................................................... 137
6.2.10 FESEM .................................................................................................... 138
6.3 Results ............................................................................................................ 138
6.3.1 Resazurin Reduction ............................................................................... 138
6.3.2 Confocal laser scanning microscopy (CLSM) ........................................ 139
Page 12
xi
6.3.3 DNA Quantification ................................................................................ 142
6.3.4 FESEM .................................................................................................... 143
6.3.5 Scaffold Shrinkage/Contraction .............................................................. 147
6.4 Chondrogenic Differentiation ......................................................................... 151
6.4.1 GAGs Content ......................................................................................... 151
6.4.2 QPCR ...................................................................................................... 154
6.5 Discussion ...................................................................................................... 160
CHAPTER 7: DISCUSSION AND CONCLUSION ........................................... 164
REFERENCES ............................................................................................................ 167
LIST OF PUBLICATIONS ........................................................................................ 182
Page 13
xii
LIST OF FIGURES
Figure 3-1: A) lengthwise incision along the cannon bone down to metacarpophalangeal
joint, B&C) Peeling the skin off, D) Opening the joint, E) Shaving the cartilage from
bone, F) De-cartilaged bone with shaved cartilage flakes in the container. ................... 19
Figure 3-2: Fabrication process of CMD scaffolds consists of the following steps:
(A&B) mincing and shattering the cartilage flakes, (C) homogenization in PBS-EDTA-
PMSF solution, (D) yielding the slurry after several wash/centrifugation steps, and
(E&F) dispensing the diluted slurry into the holes of the Teflon mold. ......................... 21
Figure 3-3: Weight measurements of wet and freeze-dried native bovine articular
cartilage samples showed the average weight percentage of dry material in bovine
articular cartilage to be 30.9 ± 3.1%, which is the maximum solid content of BAC
samples. ........................................................................................................................... 24
Figure 3-4: Photograph of representative non-treated A) 30%, B) 15% and C) 5% CMD
scaffolds. The inset image D) depicts the spongy elastic nature of a 15% CMD scaffold.25
Figure 3-5: Percentage of shrinkage in CMD scaffolds (n≥7 for each group) with
different concentrations and treatment methods. *: P>0.05. ........................................... 26
Figure 3-6: FESEM images of CDM scaffolds with different concentration and
treatments. The scale bars represent 1 mm. Inset images with the same scale bars are
representative of colour thresholding through ImageJ® software used for pore size
measurement. .................................................................................................................. 28
Figure 3-7: Pore sizes of non-treated and treated CMD scaffolds with different
concentrations and treatments (n≥50 for each group), calculated form FESEM images
using ImageJ® software. Asterix stands for P>0.05 (non-significant difference). ......... 29
Page 14
xiii
Figure 3-8: Percentage of porosity of different scaffolds consisting of varying cartilage
matrix concentrations and different treatments (n≥11 for each group). Porosity
measurements have been done through microvolumetric modification of liquid
displacement method. *: P<0.05. .................................................................................... 30
Figure 3-9: Correlation between shrinkage and porosity among CMD scaffolds with
different concentrations and treatments. Markers with small, middle, and big sizes
indicate for 5%, 15%, and 30% cartilage matrix concentrations respectively. ............... 31
Figure 3-10: The compressive stress/strain representative curves of untreated and treated
15% and 30% UV treated CMD scaffolds. The inset graph compares the Young’s
modulus (n=7) of differently treated 15% CMD scaffolds. (*: P>0.05) ......................... 33
Figure 3-11: FESEM images of fibrous surface morphology of A) Non-treated, B) UV,
C) DHT, D) UVDHT, and E) DHTUV 15% CMD scaffolds. The scale bars represent 10
µm (for insets 1µm). ....................................................................................................... 34
Figure 3-12: TGA of all the 15% CMDD scaffolds in nitrogen gas atmosphere at
heating rate of 10°C/min, A) onset and B) offset temperatures of 1st decomposition, and
C) weight residue (%) after 1st decomposition of differently treated 15% CMD
scaffolds in TGA. ............................................................................................................ 35
Figure 3-13: DSC analysis of 15% CMD scaffolds with different treatments indicating
the melting temperature of each treatment. ..................................................................... 36
Figure 3-14: Typical FTIR absorption spectra of 15% CDM material with different
treatments. Wave numbers defined in blue and dark red are representative for collagen
and proteoglycans respectively. The two sharp peaks at 2847 and 2915 on 15%UV are
representative for alkane groups formed during UV treatment. ..................................... 37
Page 15
xiv
Figure 3-15: Alkene to alkane shifts will create new cross-linking bonds. .................... 38
Figure 4-1: Schematic diagram of the A) suspension, B) level and C) overflow methods
of measuring volume. ...................................................................................................... 44
Figure 4-2: components of Microvolumetric liquid level displacement method for
porosity measurement: A) magnetic bar, plunger from insulin syringe, and 10 ml glass
pipette end sealed with rubber cap 2) Set up and vertical alignment of the measuring
pipette and its internal components. ................................................................................ 46
Figure 4-3: Laboratory set up for modified microvolumetric level displacement method
for porosity measurement. The measuring glass pipette with its components aligned
vertically in between the light source and the digital camera. The monitor shows the
liquid level. ...................................................................................................................... 47
Figure 4-4: Microvolumetric level method for porosity measurement: A) Baseline
establishment, B) Level calibration with 100 µl volume and second level establishment,
C) V1: level elevation after immersing the sample, and D) V2: Volume depletion after
removing the sample. ...................................................................................................... 48
Figure 4-5: Digital photographs (A), Micro-CT 3D rendering images (B), and FESEM
micrographs (C-E) of representative porous alumina1, glass, and alumina2 samples
respectively. .................................................................................................................... 51
Figure 4-6: Comparison between the measured porosity through micro-volumetric and
micro-CT methods with the actual porosities of porous glass, alumina1, and alumina2.86
Figure 4-7: A) Scatter plot of measured versus actual porosity and the corresponding
regression coefficients for Micro-volumetric and Micro-CT methods, and B) scatter plot
of difference versus mean porosity of Micro-volumetric and Micro-CT with actual
Page 16
xv
porosity, and C) Bland-Altman plots of the data showing the level of agreement
between measured and actual porosities. The solid lines indicate the accuracy and the
square dotted lines represent the precision of the two techniques. 95% of the data are
expected to fall within ±1.96Ơ. ....................................................................................... 88
Figure 5-1: Outgrowth method for HDF isolation. A) Full-thickness skin washed in
DMEM + 3-10X Antibiotic solution, B & C) Dissecting infradermal fat layer, D & E)
Dissecting Epiderm from Derm, F) Mincing the Derm, G, H & I) Putting small minced
derm samples in pre-wetted T25 flask. ........................................................................... 93
Figure 5-2: The bluish Resazurin passively diffuses into the cells and gets oxidized into
pinkish Resurfin which diffuses back into the intercellular space. ................................. 96
Figure 5-3: Preparation of serial dilutions of standard DNA. ....................................... 103
Figure 5-4: Seeding HDFs in 4-Chabber glass slides for adipogenic and osteogenic
lineage differentiation. .................................................................................................. 104
Figure 5-5: Centric cell seeding for Chondrogenic Differentiation. ............................. 107
Figure 5-6: Daily serial micrographs [form A) Day 0 to L) Day 11] of HDFs seeded on
tissue culture polystyrene at an initial density of 3x10³/cm
3. ....................................... 112
Figure 5-7: Representative figures of human dermal fibroblasts: A) Typical spindle-
shaped morphology of HDF cells in monolayer culture on TCP, B) 3D culture on CMD
porous scaffold stained with Live-Dead assay, and C) FESEM micrograph of a single
HDF cell spreading its processes and attaching on CMD surface. ............................... 113
Figure 5-8: Representative inverted microscope images of HDF cells seeded on TCP at
varying densities of: A) 2x10³, B) 6X10
3, C) 2x10
4, D) 5x10
4, and E) 10
5 cells per well
Page 17
xvi
4 hours after seeding. The graph F plots the harvested cell number 4 h after seeding
against the initial seeding density (n=8 for each cell density). ..................................... 114
Figure 5-9: Reduction of AlamarBlue-DMEM as function of cell density in monolayer
culture at varying incubation times from 1 to 22 hours. ............................................... 115
Figure 5-10: Reduction of AlamarBlue-PBS as function of cell density in monolayer
culture at varying incubation times from 1 to 22 hours. ............................................... 116
Figure 5-11: Reduction of Resazurin-PBS as function of cell density in monolayer
culture at varying incubation times from 1 to 22 hours. ............................................... 117
Figure 5-12: Reduction of Resazurin-PBS as function of cell density in monolayer
culture at varying incubation times from 1 to 22 hours. ............................................... 117
Figure 5-13: Resazurin Reduction Nomogram as a practical tool for quantification of
Human Dermal Fibroblasts cell density in monolayer culture at 1 to 5 hours incubation
times. The orders of all 5 curves look reasonable and logical. ..................................... 118
Figure 5-14: Plotting the relative fluorescence units (RFU) against the DNA
concentration (µg/ml) yields a linear regression with high R2 value. This line is used as
the DNA standard curve for quantification of DNA containing cell extracts. .............. 120
Figure 5-15: Growth curves of HDF cells at P5 within 12 days culture based on A) cell
count, B) DNA quantification, and C) percentage reduction in Resazurin. The lag,
logarithmic and stationary phases are seen in graph A. ................................................ 121
Figure 5-16: Inverted microscope images of A) HBMSCs at P8, B) HDFs at P2, and C)
HDFs at P6, all treated with adipogenic differentiation induction medium for two weeks
and after Oil-Red-O staining showing the abundant lipid vacuoles in HBMSCs (A), rare
Page 18
xvii
vacuoles in HDF cells at low passage No. (B), and no evidence of lipid droplets in
HDFs at passage 6 (C)................................................................................................... 122
Figure 5-17: Alizarin-Red staining for Osteogenic differentiation shows numerous
calcification signs in HBMSCs (A) and rare ossification signs in HDF cells at P2 (B),
but no evidence of osteogenic differentiation in DHFs at P6 (C). ................................ 122
Figure 5-18: Safranin-O staining of A) HBMSCs at P8 treated with chondrogenic
differentiation induction medium for 3 weeks, and B) HDF cells at P6 with the same
treatment. ....................................................................................................................... 123
Figure 5-19: Flowcytometry scatter plots of HDF cells at P6 stained with Cy5 for CD90.
A) unstained HDF cells as control were placed in 3rd
quarter, B) pure population of Cy5
stained HDFs for CD90 as the fibroblast-specific marker, C) Histogram of Cy5 as a
single parameter. X axis represents the intensity of the signal in channel numbers while
Y axis shows the quantity of the events per channel number. ...................................... 124
Figure 5-20: Relative quantification of expression of fibroblast-specific marker and
stemness genes in primary human dermal fibroblasts (HDF) at passage 5. Human bone
marrow stem cells (HBMSC) at P8 and human adipose derived stem cells (HADSC) at
P0 were used as controls. GAPDH has been used as the housekeeping gene. ............. 125
Figure 6-1: Scaffold shrinkage test after HDF cell seeding at different time points was
tested by measuring the cross-sectional surface area of the scaffolds. Plastic white discs
with known constant diameter were used for setting the scale in each picture............. 132
Figure 6-2: Percentage reduction in Resazurin absorption in HDF seeded UV and
UVDHT treated CMD scaffolds at different weekly time-points. ................................ 139
Page 19
xviii
Figure 6-3: Confocal laser scanning micrographs of HDF cells seeded on UV and
UVDHT treated CMD scaffolds at different weekly time points. All images have been
captured after staining with LIVE/DEAD® Viability/Cytotoxicity Kit (green for
Calcein and red for Ethidium homodimer). (The scale bars in main and inset images
represent for 200µm and 50 µm respectively). ............................................................. 141
Figure 6-4: Continued form Figure 6-3. ........................................................................ 142
Figure 6-5: Total DNA by Hoechst method in papain digested cell seeded UV and
UVDHT treated CMD scaffolds (n=5 for each group) at different weekly time-points
after subtraction of average DNA in unseeded (blank) samples. .................................. 143
Figure 6-6: FESEM micrographs of unseeded (A&A’) and cell seeded UV and UVDHT
treated CMD scaffolds at weekly time points from Day 2 (B&B’) to Day 42 (H&H’).
The scale-bar for image A is 100 µm while for the rest of the images they represent for
50 µm. ........................................................................................................................... 145
Figure 6-7: Continued for Figure 6-6. ........................................................................... 146
Figure 6-8: Serial digital images of top view of representative blank (unseeded) and
HDF seeded UV and UVDHT treated CMD scaffolds at seeding time and consecutive
weekly time points. The white circular plastic discs were used as the constant fixed-
dimension scales............................................................................................................ 147
Figure 6-9: Effect of wetting on the dimensions of porous spongy scaffolds. ............. 148
Figure 6-10: Measurements of cross-sectional surface area (top view) of the seeded and
unseeded UV and UVDHT treated 15% CMD scaffolds (n=7 for seeded and n=5 for
unseeded scaffolds. Significant and non-significant differences are shown by (*:
P<0.05) and (†: P>0.0). ................................................................................................. 149
Page 20
xix
Figure 6-11: Percentage of total shrinkage in HDF seeded UV and UVDHT treated
CMD scaffolds (n=7 for seeded scaffolds and n=5 for unseeded scaffolds) at different
weekly time-points. Part of this shrinkage is due to cell mediated contraction (CMC).
Asterix stands for P<0.05. ............................................................................................. 151
Figure 6-12: Sulfated Glycosaminoglycan content in cell seeded UV and UVDHT
treated CMD scaffolds (n=5 in each group) at different weekly time points after
subtraction of the average GAGs in unseeded samples, measured through DMMB
method. .......................................................................................................................... 152
Figure 6-13: Correlation between sulfated glycosaminoglycan production and shrinkage
rate in cells seeded on UV and UVDHT treated 15% CMD scaffolds. ........................ 153
6-14: Correlation between total DNA and shrinkage rate in HDF-seeded UV and
UVDHT treated 15% CMD scaffolds. .......................................................................... 153
Figure 6-15: Quantitative gene expression of COL1A1 in HDFs seeded on UV and
UVDHT treated CMD scaffolds (n=7 in each group) at weekly time points. The data
have been normalized to GAPDH. HDF cells were used as Ctrl- . ............................... 155
Figure 6-16: A) Serial digital images of top view of representative blank (unseeded) and
HDF seeded UV and UVDHT treated CMD scaffolds at seeding time and consecutive
weekly time points. The white circular plastic discs were used as the constant fixed-
dimension scales............................................................................................................ 156
Figure 6-17: Correlation between A) COL2A1 and B) ACAN gene expression, and
DNA content, C) the DNA and D) GAGs content, and E) COL2A1 and F) ACAN
expression all against shrinkage rate. ............................................................................ 160
Page 21
xx
LIST OF TABLES
Table 2-1: Biochemical composition of articular cartilage. .............................................. 7
Table 4-1: Micro-volumetric and micro-CT porosities compared with the actual
porosity, mean and difference between each method and the actual value. ................... 52
Table 5-1: TaqMan® assays used for characterization of human dermal fibroblasts
through gene expression ................................................................................................ 110
Table 6-1: TaqMan® Assay Probes Used in QPCR. .................................................... 137
Page 22
xxi
LIST OF SYMBOLS AND ABBREVIATIONS
CMD Cartilage Matrix Derived
DBP Demineralised Bovine Powder
DMEM Dulbecco’s Modified Eagle’s Medium
DMSO Dimethylsulfoxide
EDTA ethylenediaminetetraacetic acid
FB/CS Fetal Bovine/Calf Serum
HDF Human Dermal Fibroblast
HEPES 4-(2-hydroxyethyl) piperazine-1-ethanesulfonic acid
PBS Phosphate Buffered Saline
Pen/strep penicillin-streptomycin mixture
TGF Transforming growth factor
Page 23
1
CHAPTER 1: INTRODUCTION
1.1 Introduction
For the past three centuries, it is commonly accepted that cartilage damage results in
poor healing. As described by Hunter, "If we consult the standard Chirurgical Writers
from Hippocrates down to the present Age, we shall find, that an ulcerated Cartilage is
universally allowed to be a very troublesome Disease; that it admits of a Cure with more
difficulty than carious Bone; and that, when destroyed, it is not recovered" (Hunter,
1809). Articular cartilage has limited healing capacity following an injury due to low
mitotic activity and limited supply of cells (chondrocytes). In addition, the absence of
vascular supply and blood perfusion, and limited mobility of chondrocytes to the
damaged sites further adds to this insult(Buckwalter & Mankin, 1997; Curl et al., 1997;
Kasemkijwattana, Kesprayura, & Chanlalit, 2009; McPherson & Tubo; Shelbourne,
Jari, & Gray, 2003). Over the last few decades, physicians and scientists have been
working hard to find several different strategies to repair damaged articular cartilage.
The target has always been to restore the damaged hyaline cartilage to its original
condition. In the past several different procedures have been suggested, however they
have been less attractive due to the limited repair outcomes. Arthroscopic lavage and
debridement(Finkelstein & Mayer, 1931), marrow stimulation techniques(Pridie, 1959),
osteochondral grafts(Hangody & Fules, 2003; Hangody, Kish, Karpati, Szerb, &
Udvarhelyi, 1997; Hangody et al., 2004; Jacobs, 1965; Lane, Brighton, Ottens, &
Lipton, 1977), and autologous chondrocyte implantation(Peterson, Minas, Brittberg, &
Lindahl, 2003) have been the main surgical procedures described, however none has
proved to be the ultimate solution for cartilage regeneration.
Tissue engineering repair strategies such as the use of organized delivery of suspended
cells by means of scaffold constructs can fill in the voids within cartilage defects. This
provides a superior alternative to routine surgical interventions, which has been shown
Page 24
2
to produce good mid-term outcomes. To engineer cartilage one must consider the need
to fulfil all three prerequisites of the tissue engineering triad: the cells which will
function just like chondrocytes, the appropriate extracellular matrix which provides the
signalling factors, and the appropriate tissue micro-architecture that recreates the natural
state of the cartilage microenvironment.
Tissue engineering solutions for cartilage repair using chondrocytes are limited by the
low number of available chondrocytes. This is mainly due to the limited available
sources that are required for this treatment. Moreover, additional procedure is needed to
retrieve cartilage from a donor region of the patient. In addition, we need to be mindful
that allogeneic chondrocytes may not be the most suitable cell of choices due to the
immune responses it elicits following transplantation(Hyc, Malejczyk, Osiecka, &
Moskalewski, 1997; Kyriacos A. Athanasiou, 2013; Moskalewski, Hyc, & Osiecka‐
Iwan, 2002).Tissue engineered adult cells have been said to possess chondrogenic
differentiation potential. However, harvesting these chondroprogenitors is usually no
easy task. Chondroprogenitor cells can be isolated from bone marrow (Longobardi et
al., 2006), synovium (Nishimura et al., 1999; Shirasawa et al., 2006), fat (Erickson et
al., 2002), and skin (Sommar, 2010) and be used for cartilage tissue engineering
(Johnstone, Yoo, & Stewart, 2008).
Different natural (collagen, fibrin, chitosan, hyaluronic acid, alginate gels, agarose,
silks, and etc.) and synthetic (PLA-PGA, polyurethanes, polycarbonates, polyfumarates,
PEGT-PBT block copolymers, etc.) biodegradable polymers have been used for scaffold
fabrication for cartilage tissue engineering. Extracellular matrix components can be
included during the fabrication of the scaffold (Mahmoudifar & Doran, 2012). The ideal
biomaterials for tissue engineering are supposed to be biocompatible and non-toxic. In
addition, they must provide good cell adhesion site, possess high porosity for good cell
Page 25
3
penetration, allow nutrient exchange to occur, and are bioresorbable. The biomaterial
must also provide a framework that allows proper mechanical properties for migration
and proliferation of seeded cells. This in turn allows early weight bearing to occur. A
tailored surface chemistry can enhance appropriate cellular responses in order to
maintain or promote their phenotypic expression. The scaffold design is also important
to assist in the formation of the desired tissue. This can be achieved by using cell culture
systems to generate fully functional tissues that support production of ECM components
to mimic the biochemical and mechanical properties of native articular cartilage as
closely as possible.
1.2 Problem statement
Typical approaches of cartilage tissue engineering have included the seeding of
chondrocytes or chondroinducible cells on custom made scaffolds that can simulate
chondrocyte to thrive as if these cells live within their native environment. Different
hydrogel and porous scaffolds composed of synthetic and/or natural materials have been
fabricated previously with the intentions to mimic cartilage extracellular matrix. While
different methods have been applied to fabricate biocompatible scaffolds that can
support cartilage matrix production, none of the scaffolds has shown to be ideal for
cartilage tissue engineering especially when considering these materials lack in the
ability to initiate any chondrogenic effects. Therefore, a study was conducted using a
novel biomaterial and an unconventional source of cell to demonstrate a superior
outcome based on our hypothesis that a good biomaterial using acceptable and more
abundant cell source may be adequate for the requirements needed for successful
cartilage repair to occur. In the present thesis, a potential biomaterial derived from
bovine articular cartilage matrix to induce chondrogenesis in human dermal fibroblasts
as potential chondroinducible cells are described and discussed.
Page 26
4
1.3 Objectives
i. Fabrication, characterization, and optimization of bovine articular cartilage
matrix derived porous scaffold.
ii. Isolation, culture and characterization of Human Dermal Fibroblast cells.
iii. Investigation of the chondrogenic effects of bovine articular cartilage matrix
derived porous scaffold on human dermal fibroblast cells in 3D culture.
1.4 Thesis layout
This thesis consists of six chapters. Following the introduction, the second chapter
critically reviews the relevance of this study within the current literature. The third
section will disclose the underlying theory and the experimental steps involved in the
fabrication, characterization and optimization of bovine articular cartilage matrix-
derived porous scaffolds. Chapter four outlines the procedures that lead to the isolation,
culture and characterization of human dermal fibroblasts (HDFs). The fifth chapter
discusses the methodology and rationales of assessment of chondrogenic effects of
bovine articular cartilage matrix-derived porous scaffolds on HDF cells. Finally, the
sixth chapter provides the discussion, conclusion and the suggestions for future works
of the present thesis.
Page 27
5
CHAPTER 2: LITERATURE REVIEW
2.1 Introduction
Cell-based therapies in cartilage tissue engineering take advantage of highly porous
interconnected three dimensional scaffolds that can provide enough surface area and
space for cell attachment, proliferation, extracellular matrix production and deposition
to occur; which also includes nutrient and waste exchange. Apart from selecting suitable
cells and growth factors, the use of proper scaffolds with appropriate physiochemical
structure (Pramanik, Pingguan-Murphy, & Abu-Osman, 2012) will favour cellular
biocompatibility and adhesion/proliferation. The scaffolds must possess suitable
geometry and mechanical properties (Hutmacher, 2000), has to be highly porous and
have interconnectivity between areas, possess stability and consistency in its mechanical
strength, and a proper surface micro-morphology that will support cellular
differentiation(Pramanik et al., 2012). Different three-dimensional (3D) constructs such
as complex branched helical microchannels of microfluidic hydrogels may provide good
network structures (G. Huang et al., 2013). Various types of hydrogels, polymers,
scaffolds and composites of different materials that can support cartilage matrix
production have been previously described. (Hutmacher, 2000; Lu, Zhu, Valenzuela,
Currier, & Yaszemski, 2001; Moradi, Dalilottojari, Pingguan-Murphy, & Djordjevic,
2013; Moutos & Guilak, 2008). The material from which the scaffold is fabricated plays
a key role in chondroinduction. It has been suggested that modified native extracellular
matrix (ECM) may contain bioactive factors that can contribute to cell growth,
migration, and differentiation. Different constructs that incorporates bone and cartilage
matrix components have been tested for their chondrogenic effects previously. In
addition, demineralized bone implants have been used for certain reconstructive
procedures since before 1985 (J Glowacki & Mulliken, 1985).Other studies have also
described the use of bilayer collagen porous constructs which sandwiches demineralized
Page 28
6
bone particles, which demonstrated positive chondroinductive effects on human dermal
fibroblasts (J Glowacki, 1996; J Glowacki & Mizuno, 1997; J Glowacki, Yates, Little,
& Mizuno, 1998; S Mizuno & J Glowacki, 1996; Shuichi Mizuno & Julie Glowacki,
1996; Shuichi Mizuno, Lycette, Quinto, & Glowacki, 1992). However the issue of
ossification formation was observation in these constructs. In general, the closer the
material is to cartilage native matrix the higher the probability of achieving a suitable
engineered cartilage. For this reason, pure cartilage matrix derived (CMD) scaffolds
have recently been suggested as a viable alternative. 3D culture of chondroinducible
cells on cartilage matrix components seems logical, as they are expected to provide
structural and biochemical signals at the same time (Murphy, Haugh, & O'Brien, 2010;
Rowland, Lennon, Caplan, & Guilak, 2013; Q. Yang, Peng, Guo, Huang, Zhang, Yang,
et al., 2008; Z. Yang et al., 2009).Human (Q. Yang, Peng, Guo, Huang, Zhang, Yao, et
al., 2008) and porcine (Cheng, Estes, Awad, & Guilak, 2009) articular cartilage ECM
derived scaffolds have been fabricated and shown promising results with human adipose
derived adult stem cells and canine bone marrow stem cells respectively, supporting the
hypothesis that a scaffold derived absolutely from cartilage ECM can induce
chondrogenesis.
To better understand the nature of cartilage ECM derived scaffolds a brief description of
cartilage matrix composition will be described in the subsequent sub-chapters.
2.2 Biochemical Composition of Articular Cartilage
Human cartilage is a semi-solid jelly-like connective tissue which is derived from
embryonic mesenchyme. It has four classifications based on the matrix composition:
fibro cartilage, elastic cartilage, fibro-elastic cartilage, and hyaline cartilage. The
hyaline cartilage which is bluish white when unstained is mainly seen at the diarthrodial
joints covering long bones and also forming the growth plates during the longitudinal
growth age. Articular cartilage which is composed of hyaline cartilage acts as a low-
Page 29
7
friction wear-resistant gliding surface by means of its high compressive strength
(Buckwalter & Mankin, 1997). Like all other connective tissues, the hyperhydrated
articular cartilage consists of cells and matrix. Extracellular matrix of the articular
cartilage consists of water and solids. The precise biochemical composition of the
extracellular matrix of the articular cartilage is depicted in the Table 2.2.
Table 2-1: Biochemical composition of articular cartilage.
CONSTITUENT VALUE BY WEIGHT
Water 66% - 79%
Solids 21% - 34%
Inorganic
Ash 5% - 6%
Organic
Collagen 48% - 62%
Protein 8% - 15%
Glycosaminoglycan 14% - 23%
Hyaluronate < 1%
Lipid < 1%
Lysozyme < 1%
Glycoprotein ?
2.2.1 Water
Intracellular and intercellular water account for 65-80% of the articular cartilage wet
weight with differences in distribution in superficial and deep zones (Bhosale &
Richardson, 2008). The degree of hydration varies with age and species (McDevitt,
1973). The water-macromolecules interaction within the matrix determines the
mechanical properties of the articular cartilage tissue(Hunziker, 1990).
Page 30
8
2.2.2 Collagens
Collagen forms 10-20% of wet weight(Bhosale & Richardson, 2008), i.e. 60% of the
dry weight of adult articular cartilage(McDevitt, 1973). It also forms the endoskeleton
of cartilage (Huber, Trattnig, & Lintner, 2000). The most abundant form of collagen and
the principal component of the macrofibrilar framework is type II collagen (90–95%)
which is seen as a macrofibrilar framework within cartilage tissue, and is responsible for
providing the tensile strength of the articular cartilage (Bhosale & Richardson, 2008).
2.2.3 Proteoglycans
Proteoglycans are heavily glycosylated glycoprotein molecules consisting of core
proteins with covalently attached negatively charged long linear glycosaminoglycan
(GAG) chains produced inside the chondrocytes and secreted into the cartilage matrix
(McDevitt, 1973). Proteoglycans form 10-20% of wet weight of the articular cartilage.
They are the filler substances existing between cells forming large complexes, both to
other proteoglycans and also to collagen molecules providing the compressive strength
of the articular cartilage. They are also involved in binding cations (such as sodium,
potassium and calcium) and water; creating a Donnan effect and regulating the
movement of fluid and electrolytes through the matrix(Aichroth, Burwell, & Laurence,
1972).
2.3 Rationale of Current Study
Considering the current limitations of cartilage tissue engineering strategies, this thesis
is focussed in the development of a biomaterial scaffold derived from bovine articular
cartilage extracellular matrix that would promote chondrogenic differentiation of
chondroinducible cells and hence providing evidence to the potential development of
tissue engineered constructs that closely mimic native articular cartilage.
Page 31
9
The source from which the matrix is derived is a major concern. Human sources are
impractical due to lack of supplies and the ethical issues related to their procurement.
Porcine derived products also have limitations mainly due to religious ethical
considerations. More so for a country such as Malaysia where over 60% of the
population are predominantly Muslims. Animal sources with high abundance but
without ethical issues can be solution of choice.
Preserving the integrity of native cartilage ECM components is a key factor in taking
advantage of the total capacity of bioactive factors responsible for chondrogenesis.
Therefore non-invasive fabrication methods must be considered when developing this
material.
The weak mechanical properties of absolute ECM derived scaffolds accounts for the
majority of the disadvantages that arise, especially after seeding the cells. It has been
mentioned previously that the tendency of scaffold shrinkage and contraction can be an
issue as the result of this. This limits the ability of the scaffold to induce and enhance
chondrogenic differentiation of non-chondrocytic cells.
Finally, for cartilage tissue engineering purposes, the scaffold is expected to support the
maintenance of chondrocytes or differentiation of other cells with chondrogenic
potential. Maintenance of the chondrocyte phenotype is especially important for
cartilage tissue engineering, as chondrocytes are particularly quick to lose their
phenotype during the expansion process in vitro.
All in all, to help alleviate the above-mentioned issues, four major concerns with
cartilage matrix derived scaffolds need to be addressed:
The source of cartilage harvesting is supposed to be large quantity, easy to
access and must be cost-effective.
Page 32
10
The fabrication method is to be non-invasive to and extent that the bioactive
components within the cartilage matrix are not loss or damaged.
Proper fabrication and treatment strategies must be applied to improve the
physical architecture and enhance the mechanical properties of the scaffolds.
Chondrogenic potentials of the scaffolds must be proved through in vitro
studies using chondroinducible cells.
Hence, the scaffolds need to be tailored from an abundant, cost-effective, and an
ethically acceptable source. The fabrication procedures will not cause significant
degradation in ECM components while providing a proper architecture that allows the
cells to penetrate deep into the core of the scaffold, attach, proliferate and exert
chondrogenic differentiation. In this study, bovine articular cartilage was focussed as
the potential source of cartilage matrix harvesting for tissue engineering applications
since it fulfils all of the mentioned criteria.
2.4 Bovine Articular Cartilage: A Potential Source of Cartilage Matrix
Articular cartilage with animal source has drawn attention in tissue engineering due to
its abundance. Considering that the world cattle population is estimated to be over 1.4
billion animals(Yearbook, 2012), bovine cartilage is a vast potential source of
inexpensive matrix acquisition.
Viscoelastic and mechanical properties (Charlebois, McKee, & Buschmann, 2004;
Fulcher, Hukins, & Shepherd, 2009; S. Park, Hung, & Ateshian, 2004), the structure of
high density proteoglycans (Hunter, 1809), and the three dimensional collagen
architecture (Jeffery, Blunn, Archer, & Bentley, 1991) in bovine articular cartilage have
already been investigated. However, the suitability of bovine articular cartilage matrix
in fabrication of scaffolds with chondroinductive effects remains undetermined.
Abundance, inexpensiveness and lack of religious ethical issues (unlike porcine, canine
Page 33
11
and murine) are the advantages of tailoring scaffolds derived from bovine articular
cartilage for tissue engineering applications.
2.5 Enhancing Mechanical Properties
Achieving a mechanical strength similar to that of native articular cartilage is vital to the
success of cartilage tissue engineered constructs, as one of the primary functions of the
tissue in vivo is to provide mechanical support. Although CMD scaffolds provide
numerous advantages for cartilage tissue engineering, it has been proven that the they
provide weak resistance to compressive forces(Diekman, Rowland, Lennon, Caplan, &
Guilak, 2009), leading to cell mediated contraction and shrinkage of the construct
(Zaleskas et al., 2004). As a result, the cells within the construct will have less access to
the diffused nutrients and less room for multiplication and matrix production (C. Lee,
Grodzinsky, & Spector, 2001). For this reason, various techniques have been developed
to improve one or both aspects.
Mechanical properties, resorption kinetics, and biocompatibility of collagen-based
biomaterials can be influenced by cross-linking methods(Bellincampi & Dunn, 1997; L.
Damink et al., 1995).Different methods of chemical and physical cross-linking
treatments have been used extensively to enhance the physio-mechanical and
immunogenic properties of matrix derived constructs(Bellamkonda, Ranieri, Bouche, &
Aebischer, 1995).
2.5.1 Chemical cross-linking
Chemical cross-linking of collagen fibres in animal hides is an established technique to
increase their resistance against decomposition. Collagen is the most abundant matrix
protein in the animal kingdom (Lodish et al., 2000). For medical applications, chemical
cross-linking is done to decrease collagen degradation through the use of proteinases as
well as minimizing immunogenicity of xenografts (Ratner, 2004). Several chemical
Page 34
12
cross-linkers have been used in fabrication of biologic grafts and include
glutaraldehyde(L. O. Damink et al., 1995), hexamethylene diisocyanate
(HDI)(Mendoza-Novelo, Mata-Mata, Vega-González, Cauich-Rodríguez, & Marcos-
Fernández, 2014), 1-Ethyl-3-(3dimethylaminopropyl)carbodiimide (EDC, EDAC or
EDCI)(J. Lee, Edwards, Pereira, & Samii, 1996). However, chemical cross-linking
causes changes in the molecular architecture of the constructs and therefore can
decrease cell growth significantly (S. J. Huang & Edelman, 1995; Jarman-Smith et al.,
2004; Kimuli, Eardley, & Southgate, 2004).
2.5.2 Physical cross-linking
Physical cross-linking methods have also been applied during the development of
matrix derived constructs to enhance their mechanical properties(Charulatha &
Rajaram, 2003; Weadock, Miller, Bellincampi, Zawadsky, & Dunn, 1995; Kevin S
Weadock, Edward J Miller, Eric L Keuffel, & Michael G Dunn, 1996).Physical cross-
linking strategies such as ultra violet (UV) light and dehydrothermal (DHT) treatment
for cartilage matrix components have been found to enhance mechanical properties
(Haugh, Jaasma, & O'Brien, 2009), although contradictory findings have been reported
with the use of chemicals. Carbodiimide treatment was reported to retain the original
dimensions of CMD scaffolds (Rowland et al., 2013). However, the use of
glutaraldehyde treatment results in higher stiffing effects as compared to DHT treatment
(Haugh, Murphy, McKiernan, Altenbuchner, & O'Brien, 2011). Nevertheless, the stiffer
carbodiimide or glutaraldehyde treated CMD scaffolds showed higher cell attachment,
proliferation and migration with perosteoblast cells compared to DHT treated scaffolds
(Haugh et al., 2011) while inhibition of cell attachment and alterations in newly
synthesized matrix composition in MSCs seeded on carbodiimide treated CMD
scaffolds were reported in another study (Rowland et al., 2013).
Page 35
13
Considering the disadvantages of chemical cross-linking, in this study we remained
focussed on physical treatments: ultra-violet (UV) irradiation, dehydrothermal (DHT)
treatment, and combinations of them.
2.6 Human Skin: A potential source of cells (Fibroblasts)
Scaffolds and hydrogels are mainly composed of type II collagen. It has been due to this
that these materials have been shown to induce and support the differentiation of
mesenchymal stem cells both in vitro and in vivo; with and without the addition of
growth factors. Many studies have also demonstrated that culturing stem cells in an
environment similar to that of in vivo cartilage can promote and support
chondrogenesis.
Three-dimensional culture of cells for tissue engineering necessitates the seeding of
high densities of cells i.e. 106-10
8 cell*ml-1 on 3D construct(Buckley, Thorpe, O'Brien,
Robinson, & Kelly, 2009; C.Y. Charles Huang, P.M. Reuben, G. D'Ippolito, P.C.
Schiller, & H.S. Cheung, 2004; R. Mauck, C.-B. Wang, E. Oswald, G. Ateshian, & C.
Hung, 2003a). This high number of cells must either be isolated in large quantities or
subcultured to reach these numbers. Therefore the cells with easy isolation and rapid
proliferation would be the source of choice. While harvesting stem cells from bone
marrow and through liposuction are said to be minimally invasive, other more readily
available and much easier to extract are presently available. The skin, which has an
average surface area of 1.5-2 m2 in adult, is one such source.
One issue that needs to be highlighted is that culture of chondrocytes in monolayer
yields fibroblastic cells, which may not be ideal to produce cartilaginous repair(Kim,
Cho, Hong, Rhie, & Yoon, 2008). It has been demonstrated that aggrecan-sensitive sub-
populations of cells isolated from goat dermis demonstrated multi-lineage
differentiation potential. These cells were referred to dermis-isolated adult stem cells
Page 36
14
(DIAS) have been reported to possess chondrogenic potential (Deng, Hu, & Athanasiou,
2007; Sanchez-Adams & Athanasiou, 2012). What is interesting to note is that it has
been shown that some variations of fibroblastic cell lines may be induced to
differentiate into various directions (French, Rose, Canseco, & Athanasiou, 2004;
Sommar, 2010). Monolayer culture of rabbit dermal fibroblast cell line, pre-treated with
IGF-I on aggrecan coated plates have been reported to induce chondrocytic
differentiation (French et al., 2004). Human foreskin dermal fibroblasts seeded on
collagen/demineralized bone powder constructs have shown chondrogenic
differentiation (J Glowacki, 2000; J Glowacki & Mizuno, 1997; J Glowacki et al., 1998;
J Glowacki, Zhou, & Mizuno, 2009; S Mizuno & J Glowacki, 1996; Shuichi Mizuno &
Julie Glowacki, 1996; S Mizuno & Glowacki, 2005; Shuichi Mizuno et al., 1992; Yates
& Glowacki, 2003; Zhou, Yates, Eid, & Glowacki, 2005).
Fibroblast growth factors (FGFs) are a family of growth factors involved in many
signalling pathways and the developmental processes of cells(Powers, McLeskey, &
Wellstein, 2000; Thisse & Thisse, 2005). Fibroblast growth factor-18 (FGF-18) and
Fibroblast growth factor-2 (FGF-2) have been shown to have chondroinductive effects
during cartilage repair (Chiou, Xu, & Longaker, 2006; Liu, Xu, Colvin, & Ornitz, 2002;
Moore et al., 2005). Fibroblast can be cultivated from embryonic and adult tissues, and
they also are able to differentiate into chondrocytes that are cells of mesenchymal
origin.
The environment by which cells are cultured is one of the most important of the
determining factors in the differentiation of cultured cells. The use of three-dimensional
culture of fibroblasts is not enough on its own to produce chondrocytes. Culture of
murine embryonic fibroblast cells on perlecan (an ECM cross-linker protein) has been
shown to produce massive formation of cartilaginous nodules and expression of
chondrocyte markers such as collagen II (COLII), aggrecan (ACAN) and perlecan
Page 37
15
(PLC) (French et al., 1999). In addition, the culture of rabbit dermal fibroblast cell lines
on aggrecan can lead to the formation of dense cellular aggregates rich in cartilage
matrix components (French et al., 2004).
It is possible that the forced expression of several reprogramming factors (Klf4 and c-
Myc) and one chondrogenic factor (SOX9) can be achieved through the induction of
chondrogenic cells from mouse skin fibroblasts (Hiramatsu et al., 2011; Outani et al.,
2013).
Clonal analysis of human dermal fibroblasts isolated from foreskin using standard
dermal fibroblast culture system showed that fractions of these cells are unipotent and to
certain extent, bipotential(Chen et al., 2007). In all, dermal fibroblasts are no longer
assumed to be terminally differentiated cells and hence can possess differentiation
capabilities.
The excision of dermal tissue for the isolation of fibroblastic cells is much less invasive
than the removal of cartilage. The donor site will usually heal without any complication
or resulting from chronic pain. It is preferable that non-sun-exposed areas of the skin
like the anterior aspect of thighs and buttock area used for partial thickness graft
procedure. For full thickness grafts, skin at the groin is the most commonly used as a
donor site. Cubital and postauricular areas are also considered good areas for harvest
since they leave minimal scars at the donor sites. However, the size available for harvest
is limited and there is a risk for wound infection. It is therefore important that tissues
which are aseptically handled which remains undamaged and unexposed to sunlight
areas such as the axilla, groin or foreskin are chosen for these reasons. Using Neonatal
Foreskin Fibroblasts from newly circumcised Infants is an easy way of obtaining skin
tissue(French, Liu, & Athanasiou, 2002). The human foreskin is a very good potential
source of cells since many communities around the world practice of circumcision
Page 38
16
regularly as part of their culture and religious practices(WHO/UNAIDS, 2007). It is
worth noting that the use of the preputial foreskin as an alternative donor site is not a
new idea. In any hospital, having an active maternity or paediatric surgery service, one
may obtain all the foreskins necessary. Redundant skin and leftovers from cosmoplastic
surgeries that are otherwise usually discarded can also be used for tissue engineering
applications.
In this study, scaffolds composed of decellularized bovine articular cartilage were
fabricated, characterized and optimized by different concentrations and physical
treatments. The tissue engineering and chondrogenic potential of two of the optimized
scaffold was then tested by seeding the scaffolds with human dermal fibroblasts and
evaluating the properties of the constructs and the cells after long-term static culture.
Page 39
17
CHAPTER 3: FABRICATION, CHARACTERIZATION AND
OPTIMIZATION OF CMD SCAFFOLDS
3.1 Introduction
Attempts to repair and regenerate damaged cartilage through cartilage tissue
engineering have failed to meet the needs of most patients. Despite this, tissue
engineering techniques using multi-pronged strategies are still promising approaches to
solve this problem. Apart from the difficulties in having suitable cells and growth
factors, the use of a proper scaffold with appropriate physiochemical structure
(Pramanik et al., 2012) that is biocompatible and improves cell adhesion/proliferation
appears limited. Scaffolds must not only possess suitable geometry and mechanical
properties (Hutmacher, 2000), but also need to demonstrate high porosity and
interconnectivity, stability and consistency of mechanical strength, and a proper surface
micro-morphology (Pramanik et al., 2012). Different three-dimensional (3D) constructs
such as complex branched helical microchannels of microfluidic hydrogels can provide
good network structures (G. Huang et al., 2013). The material from which the scaffold
is fabricated plays a key role in chondroinduction. Various types of hydrogels,
polymers, scaffolds and composites of different materials that can support cartilage
matrix production have been described. (Hutmacher, 2000; Lu et al., 2001; Moradi et
al., 2013; Moutos & Guilak, 2008). It has been suggested that by modifying native
extracellular matrix (ECM) that contains bioactive factors which promotes cell growth,
migration, and differentiation can be expected. In general, the closer the material is to
cartilage native matrix the higher the probability of it becoming a suitable engineered
cartilage. For this reason, cartilage matrix derived (CMD) scaffolds have recently drawn
the attention of many researchers. This is especially so since 3D culture of
chondroinducable cells on CMD components appears to provide structural and
Page 40
18
biochemical signals at the same time(Murphy et al., 2010; Rowland et al., 2013; Q.
Yang, Peng, Guo, Huang, Zhang, Yang, et al., 2008; Z. Yang et al., 2009).
Although CMD scaffolds provide numerous advantages for cartilage tissue engineering,
it has been shown that they have a weak resistance to compressive loading (Diekman et
al., 2009), leading to cell mediated contraction and shrinkage of the construct (Zaleskas
et al., 2004). As a result, the cells within the construct will have less access to the
diffused nutrients and less room for multiplication or matrix production (C. Lee et al.,
2001). In order to improve the mechanical properties, physical cross-linking strategies
such as ultra violet (UV) light and dehydrothermal (DHT) treatment are normally
recommended (Haugh, Jaasma, et al., 2009). Nevertheless this does not always appear
to produce good results. Contradictory findings have been reported with the use of
chemical methods. Carbodiimide treatment was reported to retain the original
dimensions of CMD scaffolds (Rowland et al., 2013). However glutaraldehyde
treatment results in higher stiffness as compared to DHT treatment (Haugh et al., 2011).
It has been demonstrated that the stiffer carbodiimide or glutaraldehyde treated CMD
scaffolds showed higher cell attachment, proliferation and migration with preosteoblast
cells compared to DHT treated scaffolds (Haugh et al., 2011) while a different study
showed that culture of MSCs on carbodiimide treated CMD scaffolds resulted in
inhibition of cell attachment and alterations in newly synthesized matrix
composition(Rowland et al., 2013).
Scaffolds for cartilage tissue engineering are typically polymeric/biopolymeric three-
dimensional constructs meant to provide temporary physical, mechanical and biological
support for the chondrocytes and chondroinducible cells (Izadifar, Chen, & Kulyk,
2012). The main aim of this chapter is to present the methodology of fabrication,
treatment and optimization of bovine articular CMD porous scaffolds for cartilage tissue
engineering applications. In this chapter, our study describes that how the physical
Page 41
19
structure of the CMD scaffolds is used as the main criteria for scaffold selection. Gross
morphology, pore size, porosity, and mechanical properties of the scaffolds will be
studied through different tests. Thermodynamic properties, infrared spectroscopy data
will be used as complementary tests for further characterization and additional
supportive data to rationalize the architectural characteristics of the scaffolds.
3.2 Materials and Methods
3.2.1 Cartilage Matrix Derived (CMD) Scaffold Preparation
Bovine articular cartilage (BAC) was excised from both proximal and distal surfaces of
metacarpophalangeal joints of calf hooves procured from a local slaughter house
(Figure 3-1).
Figure 3-1: A) lengthwise incision along the cannon bone down to metacarpophalangeal joint,
B&C) Peeling the skin off, D) Opening the joint, E) Shaving the cartilage from bone, F) De-
cartilaged bone with shaved cartilage flakes in the container.
Page 42
20
BAC tissues from 9 cow legs were lyophilized (FreeZone, Lanconco, USA) after
weighing. The dry weights were measured using an electronic balance with a resolution
of ±0.0005g (SHIMADZU AY220 Analytical Balance).
The rest of the cartilage tissue was pooled, minced, shattered and homogenized using a
BIOSPEC Tissue TEARORTM
(#985370-395) in 1 X phosphate buffered saline (PBS),
5 mMethylenediaminetetraacetic acid (EDTA) and 0.15 mMphenylmethylsulfonyl
fluoride (PMSF) buffer solution at pH 7.4.The resulting slurry was centrifuged at 2000
rpm for 5 min, and the collected supernatant was further centrifuged at 6000 rpm for 5
min. The tissue slurry was decellularized in 1% TritonX-100 (Fisher Scientific)
prepared in 0.01M Tris-HCl (Sigma # T5941) and left in a 4°C fridge while gentle
agitation was applied for 12 h. After 12 h, the decellularized slurry was centrifuged at
6000 rpm for 5 min, washed with PBS, and incubated for 12h at 37°C in a hybridization
oven with a low rotating speed in 50U.ml-1
DNAse I (Sigma # DN25) and 10 mM
TrisHCl (Sigma # 88438). Finally, the slurry was washed twice with PBS and
centrifuged at 6000 rpm for 5 min.
The scaffolds were produced by mixing the decellularized slurries with ultrapure water
(UPW; conductivity = 0.055 ľS/cm at 25 °C, total organic carbon value < 1 ppb;
membrapure Aquinity, Scientech, Taiwan) and placed in cylindrical Teflon molds at 3
mm depth and 7 mm diameter. Scaffolds were prepared at 5%, 15% and 30%(w/v)
concentrations, frozen at a constant temperature of -80ºC for 2 hours in a freezer, then
freeze-dried at -50ºC, 0.04 millibar for 16 hours with no additional annealing steps, and
post treated by: (A) no treatment (control), (B) exposed to ultraviolet light at an energy
concentration of 8 J/cm2
for 90min for each side (λ =254 nm) (henceforth‘UV’), (C)
dehydrothermal treatment which means heating the scaffolds in a forced-air convection
oven (Lab Companion OF-11E, China)at 120°C for 24 h (henceforth as ‘DHT’), (D)
UV follow by DHT treatment (‘UVDHT’), and E) DHT treatment followed by UV
Page 43
21
treatment (‘DHTUV’). Although all dry scaffolds will be 100% composed of cartilage
matrix, codes of the scaffolds are named as 5%, 15% and 30% CMD scaffolds based on
the preparation concentration.
Figure 3-2: Fabrication process of CMD scaffolds consists of the following steps: (A&B) mincing
and shattering the cartilage flakes, (C) homogenization in PBS-EDTA-PMSF solution, (D) yielding
the slurry after several wash/centrifugation steps, and (E&F) dispensing the diluted slurry into the
holes of the Teflon mold.
3.2.2 Characterization of CMD Scaffolds
3.2.2.1 CMD scaffold macro and micro morphologies
A digital camera (Canon PowerShot A570 IS) was used to capture cross-sectional
images of the top view of the CMD scaffolds. ImageJ®, version 1.47v software was
Page 44
22
used for cross-sectional surface area (As) measurement. Percentage of shrinkage was
calculated using Eq.1 for each type of scaffold with respect to the constant circular area
of the mold (Am) with a diameter of 7 mm.
% Shrinkage =A𝑠
A𝑚100 ... ... (Eq. 1)
3.2.2.2 Field emission scanning electron microscopy (FESEM)
A field emission scanning electron microscope (FESEM) (QuantaTM
250 FEG – FEI)
was used to assess micro-morphology, pore size, and pore distribution. All scaffolds
were gold coated (at a thickness of around 450 Å) using a 150 rotary-pumped sputter
coater (Quorum Technologies). ImageJ® software was used to calculate the pore sizes.
Colour thresholding in ImageJ® facilitates the detection of pore borders and enhances
measurement accuracy. FESEM images of n=3 samples from each group of scaffolds at
a magnification of 100 x were used for pore size measurement. Since all the identical
samples from each concentration and treatment were uniform, the data of a
representative scaffold from each group were analysed for pore size measurement. Each
image was divided into 9 virtual equal squares. Measurements were done randomly
from 3 of the squares. For each sample n ≥50 bidirectional pore diameters were
measured. The mean pore diameter was calculated from the average of maximum and
minimum diameters of a pore.
3.2.2.3 Porosity measurement
Scaffold porosity was measured using microvolumetric modification of the liquid
displacement method based on a novel method developed by the author to meet the
requirements of this study, and detailed at length in the following chapter (Moradi,
Pramanik, Ataollahi, Kamarul, & Pingguan-Murphy, 2014). Briefly, changes in hexane
level in a glass pipette after immersing (V1) and removing (V2) of each scaffold
Page 45
23
(n≥11for each type of scaffold) were recorded by a digital camera and analysed by
ImageJ® software. The percentage pore volume was calculated using Eq. 2:
Total pore volume =V2
V1+V2100 … … (Eq. 2)
3.2.2.4 Thermogravimetric analysis (TGA)
Thermal stability of CMD scaffolds (n=3 for each type of scaffold) was assessed using a
thermogravimetric analyser (TA Instruments, Q500) at a constant heating rate of
10°C/min in over a temperature range of 25 to 825 °C in a controlled nitrogen gas
atmosphere.
3.2.2.5 Differential scanning calorimetry (DSC)
Melting temperature and cross-linking of CMD scaffolds (n=3 for each type of
scaffold)were analysed using a Mettler DSC820 system (Mettler Toledo, UK) at a
constant heating rate of 10°C/min in over a temperature range of 25 to 100 °C in a
controlled nitrogen gas atmosphere.
3.2.2.6 Fourier transform infra-red (FTIR) spectroscopy
A FTIR spectrometer (Thermo Scientific® Nicolet iS10) was used to analyse the
secondary structure of proteins within the CMD scaffold (Kong & Yu, 2007; Ribeiro et
al., 2012). Spectra were acquired from a 1.5 mm diameter sampling area (n=3 for each
type of scaffold and n=3 measurements from 3 different spots per each sample) with a
diamond crystal at a resolution of 4 cm-1
in the wave number region between 4000 and
650 cm-1
.
3.2.2.7 Mechanical properties
Compressive strength and modulus of the scaffolds (n≥7 for each group) with the
dimensions of 6 mm in diameter and 2 mm height were measured in compression mode
Page 46
24
at a crosshead speed of500µm/min using an Instron 5848 micro tester. The overall
Young’s modulus was calculated obtained when materials were subjected from 0.7%
strain to 95% strain.
3.3 Results
3.3.1 Bovine Articular Cartilage Water Content
Weight measurements of wet and freeze-dried native bovine articular cartilage samples showed
at average weight percentage of dry material in bovine articular cartilage to be 31 ± 3%, which
is the maximum solid content of BAC samples (Figure 3-3).
Figure 3-3: Weight measurements of wet and freeze-dried native bovine articular cartilage samples
(n=33) showed the average weight percentage of dry material in bovine articular cartilage to be 31
± 3%, which is the maximum solid content of BAC samples.
3.3.2 Macro and Micro Morphologies of the CMD Scaffolds
Figure 3-4shows the macroscopic morphologies and surface appearance of non-treated
30% (Figure3-4: A), 15% (Figure 3-4: B), and 5% (Figure 3-4: C) CMD scaffolds.
Samples show a highly porous spongy nature (Figure 3-4: D). While 15% and 30%
CMD scaffolds retain their cylindrical shape, the 5% scaffolds look more deformed.
Scaffolds showed substantial changes in the size after freeze-drying as compared to
Page 47
25
their original mold size (shrinkage after lyophilization). Since there is a greater amount
of water present in 5% CMD samples, the amount of total heat extracted from these
samples during freeze-drying is much higher than those of 15% and 30% CMD
scaffolds, leading to a higher level of shrinkage. However, differently treated samples
displayed different rates of shrinkage suggesting that treatment plays a role in
determining the shrinkage rate of the CMD scaffolds.
Figure 3-4: Photograph of representative non-treated A) 30%, B) 15% and C) 5% CMD scaffolds.
The inset image D) depicts the spongy elastic nature of a 15% CMD scaffold.
15% and 30% UV and 15% UVDHT scaffolds showed the lowest shrinkage (25.9 ±
1.5%, 25.9 ± 2%, and 25.3 ± 2.7%, respectively) among all treated CMD scaffolds as
seen in Figure 3-5. One way analysis of variances showed no significant difference in
shrinkage between the three mentioned groups (p>0.05).
Page 48
26
Figure 3-5: Percentage of shrinkage in CMD scaffolds (n≥7 for each group) with different
concentrations and treatment methods.*: P>0.05.
FESEM images in Figure 3-6 demonstrate the uneven and irregular shaped highly
interconnected pores among the 5%, 15%, and 30% CMD scaffolds as a result of the
freeze-drying scaffold fabrication method. Pore size analysis using ImageJ® showed an
average pore diameter of 140 ± 60 µm for non-treated 5% CMD scaffolds, and 184 ± 60
µm and 194 ± 61 µm for non-treated 15% and 30% scaffolds respectively (Figure 3-6:
A-C). The average pore size in non-treated 5% CMD scaffolds is significantly lower
than that of non-treated 15% and 30 % CMD scaffolds (Figure 3-7). As it can be seen in
the FESEM images of UV treated CMD scaffolds (Figure 3-6: D-F), UV treatment did
not affect the pore size of 5% scaffolds, but did demonstrate a moderate and mild
increase in the pore sizes of 15% and 30% scaffolds respectively. The correlation
between the shrinkage and pore sizes of the CMD scaffolds was small (R2=0.097).
Shrinkage of the scaffolds during freeze-drying is not necessarily associated with a
change in pore size since this is determined by the rate of cooling and annealing during
the lyophilization process (Haugh, Murphy, & O'Brien, 2009). However, an increase in
the pore size of 15% and 30% scaffolds was coincident with an increase in shrinkage,
Page 49
27
suggesting that the degrading effect of UV on loose bands results in smaller scaffolds
with bigger pore sizes.
Image analysis of DHT treated scaffolds (Figure 3-6: G-I) shows a significant drop in
pore sizes of 5% and 30% scaffolds as compared to a decrease in 15% scaffolds.
As observed in Figure 3-9: J-L, UVDHT treated 15% and 30% scaffolds show the
biggest pore sizes while the pore sizes of 5% UVDHT are smaller than the non-treated
5% scaffolds. FESEM images of DHTUV samples (Figure 3-6: M-O) indicate big pore
sizes for 15% samples, which are almost the size of those for the 15% UVDHT.
However, a decrease in the pore sizes in 30% DHTUV scaffolds was observed.
Interestingly, 5% DHTUV samples showed the biggest pore sizes.
Page 50
28
Figure 3-6: FESEM images of CDM scaffolds with different concentration and treatments. The
scale bars represent 1 mm. Inset images with the same scale bars are representative of colour
thresholding through ImageJ® software used for pore size measurement.
Page 51
29
Figure 3-7 shows the average pore sizes of CMD scaffolds with different concentrations
and treatments (n≥50 for each group) derived from FESEM images using ImageJ®
software. The 5% DHTUV, 15% UV, UVDHT and DHTUV, and 30% UV scaffolds
showed the biggest mean pore diameters. However, one way analysis of variances
between the five mentioned groups revealed no significant difference between them
(P>0.05).
Figure 3-7: Pore sizes of non-treated and treated CMD scaffolds with different concentrations and
treatments (n≥50foreachgroup), calculated form FESEM images using ImageJ® software. Asterix
stands for P>0.05 (non-significant difference).
3.3.3 Porosity of CMD scaffolds
Porosity measurement using a modified microvolumetric Archimedes method showed
an average porosity of 94% and above for all the different CMD scaffolds (Figure 3-8).
Considering that the biggest difference between the porosities is still less than 4%
among all the different groups, it is suggested that scaffolds may still be porous. In
Page 52
30
addition, since these differences were significant, it may be that the resultant increase in
surface area may provide better cell attachment and migration.
Figure 3-8: Percentage of porosity of different scaffolds consisting of varying cartilage matrix
concentrations and different treatments (n≥11foreachgroup). Porosity measurements have been
done through microvolumetric modification of liquid displacement method.*: P<0.05.
Plotting the shrinkage against the porosity shows that by increasing the concentration of
CMD from 5% to 15% the porosity of all treated and untreated scaffolds, the outcomes
are not affected significantly (P>0.05).In contrast, a decreases in the shrinkage (P<0.05)
except for DHT (P>0.05) can be observed. However, increasing the CMD concentration
from 15% to 30% does not result in significant changes in the material shrinkage except
for the DHT group, while the differences in porosity of different treatments remain
significant (P<0.05). The results suggest that 15% CMD concentration is a critical value
beyond which significant changes in porosity and shrinkage occurs (Figure 3-9).
Page 53
31
Figure 3-9: Correlation between shrinkage and porosity among CMD scaffolds with different
concentrations and treatments. Markers with small, middle, and big sizes indicate for 5%, 15%,
and 30% cartilage matrix concentrations respectively.
All 5% and 15% treated scaffolds showed a porosity of 98%, while the highest porosity
among the 30% group was observed in UV treated scaffolds 96.7 ± 0.5%. This result
indicates that when the scaffolds were shrinking, the shape and size changed
significantly without much change in total number of pores, resulting in a homogeneous
porosity of over 94% for all specimens. Furthermore, the higher porosity in few treated
5% CMD scaffolds is indicative of breaking of the surface (as revealed in thresholding
inset images in Figure 3-6 for 5% scaffolds) as a result of increased open porosity. Since
30% CMD concentration is more than a critical value, which is in this pure water media
15% CMD, the total number of pores also decreases with greater amount compared with
5 or 15 % CMD scaffolds.
Pluralization of shrinkage, pore size, and porosity data as major criteria in scaffold
engineering suggests that although 5% and 15% DHTUV groups show big pore sizes,
Page 54
32
but simultaneously show high percentages of shrinkage which fails them for selection as
good scaffolds.
On the other hand, the 15% and 30% UV and also 15% UVDHT groups show the
lowest shrinkages, proportionally biggest pore sizes, and high porosities, and hence all
three groups can be scaffolds of choice from the view of architecture.
Considering all the above characteristics, including shrinkage, pore size and porosity of
the entire CMD scaffolds and to confirm our selection, the other data of all 15% CMD
scaffolds was assessed and characterized further.
3.3.4 Compressive tests
Figure 3-10 shows the results of mechanical testing in compression mode for all
treatments of 15% along with 30% UV treated CDM scaffolds. UV and UVDHT treated
scaffolds showed the highest compressive modulus (Ec) among other scaffolds, while
one way analysis of variances showed that the Young’s modulus of DHT treated 15%
scaffolds was not significantly different from that of UVDHT scaffolds (p=0.874). On
the other hand, the 30% UV treated scaffolds exerted weak compressive strength and
low Young’s modulus. Considering the maximum physiologic load applied on knee
joint cartilage which is said to be 0.84-3.0 MPa for an average person, the Young’s
moduli measured for 15% UVDHT and UV treated CMD scaffolds (0.274±0.05 MPa
and 0.355±0.06 MPa respectively) falls between the range of 10-42% of compression
moduli values of natural cartilage (Izadifar et al., 2012). The Young’s moduli for 15%
UVDHT and UV treated CMD scaffold are significantly higher than untreated 15%
CMD scaffolds and significantly higher than the compressive moduli reported for
potential scaffold substitutes such as 1.5% and 2% agarose (9.0±0.3 KPa and 76±5 KPa
respectively) and mechanically enhanced agarose/PEG-dimethacrylate (51±3 kPa -
93±4 kPa) hydrogels (G. Huang et al., 2012).
Page 55
33
Figure 3-10: The compressive stress/strain representative curves of untreated and treated 15% and
30% UV treated CMD scaffolds. The inset graph compares the Young’s modulus (n=7) of
differently treated 15% CMD scaffolds. (*: P>0.05)
3.3.5 Surface Morphology
Figure 3-11 illustrates the surface topography changes in 15% CMD scaffolds after
different cross-linking treatments, compared to the non-treated sample at higher
magnification. The typical nano-structure of collagen fibrils, with their bands, is
revealed in all samples by the very high magnification inset images in Figure 3-11. A
ramous surface morphology can be seen in all treated samples while non-treated
material shows no signs of dehiscence. It indicates that more cross-linking between the
collagen polymer chains in the fibrils has occurred due to the different physical
treatment. The DHT sample shows more surface cracks compared to other materials
(Figure 3-11: C). On the other hand, UV and DHTUV treated materials (Figures 3-11: B
& E) show the fewest cracks. In addition, the UV treated scaffolds show many network
structures indicative of maximum cross-linking, and the UVDHT treated scaffolds are
Page 56
34
moderately ramous. Considering these results, UV and UVDHT appear to have the
more optimal surface morphologies, compared to the other treated or non-treated
scaffolds.
Figure 3-11: FESEM images of fibrous surface morphology of A) Non-treated, B) UV, C) DHT, D)
UVDHT, and E) DHTUV 15% CMD scaffolds. The scale bars represent 10 µm (for insets 1µm).
3.3.6 Thermogravimetric Analysis (TGA)
All CMD materials show two main decomposition temperatures according to the two
major weight losses (Figure 3-12). The first weight loss (10-16 wt %) appears at around
265°C and is due to adsorbed moisture, adsorbed water and also collagen present in the
material. The next decomposition (56-66 wt %) occurs at almost 720°C and represents
the inorganic components in cartilage.
Increases in thermal stability, which is measured in terms of the first decomposition
temperature, is a result of and proportional to formation of cross-linked structures
(Rodríguez-Baeza, Neira, & Aguilera, 2003). The 15% UV scaffold group showed the
highest thermal stability of all treatments. The onset and offset temperatures of the first
decomposition of 15% UV treated sample computed at 300.85 and 393.7 °C
Page 57
35
respectively, which is higher than those of other treatments (see the inset in Figures 3-
12: A & B). The average weight residue after the first decomposition is 36 ± 4 %
regardless of treatment for all 15% samples (see the inset in Figure 3-12: C).
Figure 3-12: TGA of all the 15% CMDD scaffolds in nitrogen gas atmosphere at heating rate of
10°C/min, A) onset and B) offset temperatures of 1st decomposition, and C) weight residue (%)
after 1st decomposition of differently treated 15% CMD scaffolds in TGA.
3.3.7 Differential Scanning Calorimetry (DSC)
Figure 3-13 shows the DSC results and indicates melting points (Tm, in °C) of the 15%
CMD scaffolds with different treatments. The 15% UV treated scaffold shows a
significantly higher melting temperature compared to the other treated and non-treated
scaffolds, indicating that it may have better mechanical properties which has already
been shown in mechanical study. A higher melting point occurs due to the more cross-
linking present in the 15% UV treated scaffolds than in other non-treated or treated
scaffolds. The cross-links may have been damaged due to thermal energy in other
treated scaffolds or by other treatments.
Page 58
36
Figure 3-13: DSC analysis of 15% CMD scaffolds with different treatments indicating the melting
temperature of each treatment.
3.3.8 FTIR
The FTIR spectra of 15% CDM scaffolds with different treatments are shown in Figure
3-14. Articular cartilage extracellular matrix (ECMD) derived scaffolds mainly consist
of collagen II and proteoglycans. Amide I (C = O stretch), Amide II (N – H stretch, N –
H bend combination), Amide III (C – N stretch, N – H bend, C – C stretch) and Amide
A (N = H stretch) at wave numbers 1655, 1550, 1250 and 3330 cm-1
, respectively are
the representative bonds of collagen, while sulphate stretch (C – O – S stretch) occurred
at 1125-920 and 850 cm-1
, Amide I (C = O stretch) at 1640 cm-1
and Amide II (N – H
stretch, N – H bend combination) at 1545 cm-1
are characteristic of Proteoglycans
(Camacho, West, Torzilli, & Mendelsohn, 2001; Petra, Anastassopoulou, Theologis, &
Theophanides, 2005; Ribeiro et al., 2012; Saarakkala, Rieppo, Rieppo, & Jurvelin,
Page 59
37
2010). All the characteristic FTIR peaks, including Amides I, II, III, and A as well as
sulfate groups for collagen and proteoglycans are shown in Figure 3-14.
Figure 3-14: Typical FTIR absorption spectra of 15% CDM material with different treatments.
Wave numbers defined in blue and dark red are representative for collagen and proteoglycans
respectively. The two sharp peaks at 2847 and 2915 on 15%UV are representative for alkane
groups formed during UV treatment.
The two sharp peaks at 2847 and 2915 wave numbers on 15%UV group spectrum are
due to new alkane group formation from alkene groups during UV cross-linking
treatment (Figure 3-14). The broken bonds from the alkenes in turn help the alkanes to
make more crosslinks with the other chains of polymer collagens, as shown in Figure 3-
15. The more cross-links through UV in 15% CMD scaffolds would restrain the scaffold
structure during cell culture study better than other treated scaffolds.
Page 60
38
Figure 3-15: Alkene to alkane shifts will create new cross-linking bonds.
Considering the sensitivity of the Amide III band at 1235 cm-1
to native collagen tertiary
structure and C-H deformation related insensitivity of the absorbance at 1450 cm-1
, the
1235/1450 cm-1
ratio can help in quantification of degradation(Gilbert, 1988; Jus et al.,
2011). The ratio was 1.022 in untreated 15% CMD scaffolds and showed a decrease
after treatment with UV (1.011) and UVDHT (1.008), indicating higher cross-linkage in
initially UV treated samples, while increasing in DHT (1.030) and DHTUV (1.023)
treated scaffolds resulting from a partial degradation in samples first treated with DHT.
Our FTIR findings show that the effectiveness of physical treatment of CMD constructs
is highly dependent on the concentration of CMD content in the construct. At low CMD
concentrations (e.g., 5% CMD in our case) UV treatment causes more cross-linking,
reconfirming the findings of Bellincampi and Dunn (Bellincampi & Dunn, 1997). When
the CMD concentration is increased to 15% the DHT treatment forms a higher cross-
linking while UV treatment has more denaturation effects, which replicate the findings
of a study on collagen fibers conducted by Weadock et al (K. S. Weadock, E. J. Miller,
E. L. Keuffel, & M. G. Dunn, 1996). At the same time, alkene to alkane transitions
provide supportive cross-linkings.
3.4 Discussion
ECM-based strategies are already established in tissue engineering (Benders et al.,
2013). Native cartilage ECM-derived scaffolds have been shown to support
Page 61
39
chondrogenesis (Cheng, Estes, Young, & Guilak, 2011). Also, the effects of physical
(UV and DHT) and chemical (carbodiimide) cross-linking treatments on chondrogenic
differentiation and cell-mediated contraction of porous CMD scaffolds have already
been studied (Rowland et al., 2013). However, the purpose of the current study was
quantitative assessment of changes in the architectural and mechanical properties of
physically cross-linked CMD scaffolds.
Considering other studies done were only based on 3% (Q. Yang, Peng, Guo, Huang,
Zhang, Yao, et al., 2008) and 10% (Cheng, Estes, Awad, & Guilak, 2008); CMD
scaffolds and according to the proportional weight of dry material content in native
fresh bovine articular cartilage, we produced bovine CMD scaffolds with three different
concentrations of CMD material: 5%, 15% and 30% concentrations.
The scaffolds underwent one of the five physical treatment conditions for cross-linking
(Non-treated, UV, DHT, UVDHT, and DHTUV). Remarkable deformation and
shrinkage after treatment, and small pore size were the major criteria to eliminate the
5% scaffold group. UV and UVDHT treated15% scaffolds as well as UV treated 30%
scaffolds showed the biggest pore sizes as compared to all other samples. Although UV
treated30% scaffolds have the same concentration of dry material as the native cartilage,
they showed a lower porosity, a relatively higher shrinkage, and a very low compressive
strength compared to UV and UVDHT treated15% scaffolds. Structural stability,
sufficient surface area for cell attachment, adequate space for diffusion of nutrients, cell
migration and matrix deposition have been accounted as beneficial features of scaffolds
with 95-97% porosity (Seal, Otero, & Panitch, 2001). UV and UVDHT treated15%
CMD scaffolds showed high porosity rates (≈98%) and high Young’s moduli. The
compressive moduli of these scaffolds appeared to be higher than pure and enhanced
agarose and agarose/PEG (G. Huang et al., 2012), cell seeded porous scaffolds derived
from native porcine articular cartilage (Cheng et al., 2011), and close to PEG
Page 62
40
hydrogels(Bryant & Anseth, 2002) as potential alternative constructs for cartilage tissue
engineering.
While both UV and UVDHT treated 15% scaffolds showed high pore sizes, low
shrinkages, and high porosities; UV treated 15% scaffolds showed a higher compressive
strength, better thermal stability in TGA and DSC analyses as well as newly formed
alkane peaks in FTIR which are obvious indicative of a higher degree of cross-linking.
Crosslinking changes the mechanical strength of the scaffold due to breaking of
unsaturated bonds and converting to primary bonds between the polymer chains as
confirmed by FTIR study. The breaking of unsaturated bonds and consequent
transformation into the primary bonds are mainly responsible to change the porosity in
the CMD scaffolds as revealed in the SEM micrographs. The surface morphology of
UV treated 15% scaffolds also showed an optimal intertwined collagenous surface that
favours better cell attachment.
DHT treatment has been reported to have beneficial effects in terms of providing bigger
pore volume favouring cell attachment, proliferation, matrix production and cell-matrix
interactions (Rowland et al., 2013). DHT treatment was also reported to increase the
mechanical properties of collagen-glycosaminoglycan scaffolds (Haugh, Jaasma, et al.,
2009). Our findings indicate that although the compressive profile of DHT treated 15%
CMD scaffolds as well as its porosity are as good as UVDHT treated CMD scaffolds,
DHT treatment results in higher shrinkage and smaller pore sizes at 15% cartilage
matrix concentration as compared to UV and UVDHT treatments. UV and UVDHT
treatments on 15% CMD scaffolds can yield stiffer CMD scaffolds with low shrinkage
rates that simultaneously possess optimal microstructure and biocompatibility. Our
study employed 5%, 15% and 30% CMD scaffolds and, based upon data obtained
suggests that 15% CMD concentration is a critical value beyond, which results in
significant changes in porosity and shrinkage.
Page 63
41
Therefore, fairly simple, feasible and cost effective UV and UVDHT treatments on 15%
CMD scaffolds are promising candidates to provide the desired architecture while
preserving bioactive factors, both of which are major concerns in the tissue engineering
of scaffolds.
Future studies are required to elucidate the particular chondroinductive capabilities of
physically treated CMD scaffolds, and to further characterise the results of the present
study.
Page 64
42
CHAPTER 4: DEVELOPMENT OF MICROVOLUMETRIC
MODIFICATION OF LIQUID DISPLACEMENT METHOD
FOR POROSITY MEASUREMENT
4.1 Introduction
As discussed in Chapter 3, the measurement of porosity for light and highly porous
materials has required the development of a novel technique. In this chapter we detail
the wider background to such an undertaking, and the development of this technique.
Porous materials find widespread applications almost in all the areas, covering
engineering to medicine (Bertoldi, Farè, & Tanzi, 2011; H. Park & Miwa, 2003; Parrilli,
2010; Pramanik et al., 2012). For these applications, the porosity and pore size have
significant effect on different properties of porous materials. For instance, porosity is a
highly determinant factor in fabrication of three-dimensional (3D) scaffolds in tissue
engineering to mimic the extracellular matrix as templates onto which cells of various
tissues attach, proliferate, move and function(Johnson, Bahrampourian, Patel, &
Mequanint, 2010; Pramanik et al., 2012). Pore density is important in the fabrication of
synthetic materials used in various applications such as filtration, bioreactors, analytical
devices, prostheses etc. (Bradham, 1960; Fry, DeWeese, Kraft, & Ernst, 1964;
Furneaux, Rigby, & Davidson, 1989). Therefore, it is essential that characterizations of
the porosity of these materials be conducted accurately.
Due to the importance, various methods have been developed to characterize the
porosity, such as (BET) which uses the Archimedes’ principle based and computerized
tomographic imaging techniques. Archimedes’ principle based liquid(Calvo, Bottino,
Capannelli, & Hernández, 2008; Peinador et al., 2011) and gas(Szepes, Kovács, &
Szabóné, 2005; Westermarck, 2000; Westermarck, Juppo, Kervinen, & Yliruusi, 1998)
displacement as well as computerize tomographic imaging(Vergés, Ayala, Grau, &
Page 65
43
Tost, 2008) methods of porosity measurement are routinely used for porous material
characterization. Eligibility of application of each technique for different porous
materials depends on their physiochemical properties. Although micro-CT is assumed
as a gold standard technique for porosity measurement especially in biomedical field, it
is not applicable to non-opaque materials. Cost and time-consuming process of data
acquisition especially at high resolution rendering and the need for high performance
imaging machinery and users are still important concerns and hence measuring the
porosity through other methods is considered. Probable invalid equation due to absence
of a truly linear region, shrinkage of some samples, need of degassing thermal
preparations, limited nitrogen gas adsorption with highly porous solid samples(Kissa,
1999) and restrictions with the minimum sample size(Sharif, DiMemmo, Davidovich, &
Sarsfield) and cost are some limitations with BET surface area analysers. Cost-
effectiveness and feasibility have been the main reasons that Archimedes’ principle
based liquid displacement methods are still favourable. However, determining the
porosity of non-opaque small sized highly porous light materials through these methods
has always been a big concern. However Archimedes’ principle based and micro-
computerized tomography (micro-CT) techniques are comparatively better. In micro-
CT, pore distributions from several tomographical images, generally developed by X-
ray, are combined together to get total porosity of small 3-D scaffolds. Variations of
Archimedes’ principle based liquid displacement method are still favourable due to their
simplicity, inexpensiveness and ease of use for determination of porosity of solid
materials with irregular shapes. Suspension (Figure 4-1: A), level (Figure 4-1: B), and
overflow (Figure 4-1: C) methods are three different modifications of liquid
displacement using the same Archimedes’ principle. It has been shown that suspension
technique is the most preferred method in terms of accuracy and precision(Hughes,
2005).
Page 66
44
Figure 4-1: Schematic diagram of the A) suspension, B) level and C) overflow methods of
measuring volume.
However, there are several limitations associated with these methods. For instance, the
accuracy of each method depends on how delicate the weight or volume changes are
read. On the other hand, precision and accuracy of the method depend on the readability
of the weighing scale or volumetric readings. Moreover, the sample is to be suspended
stationary in the liquid by means of a string line, which can affect the readings by
exerting a tension effect. Considering the weight and geometry of the sample, the string
weight and volume may also not be negligible. Thus, suspension method cannot be used
for small and very lighter objects. Overflow method on the other hand may not be
applicable to very light and highly porous materials due to their geometry and the
limitations caused by surface tension.
Therefore, there is still an unmet need for a much precise method for porosity
measurement of ultra-light highly porous materials. In this study, we aim to develop a
very precise and accurate modification of the “Level” method, which is consistently
Page 67
45
applicable for very small and light objects up to the volume of only few microliters such
as those used within this thesis.
4.2 Materials and Methods
4.2.1 Experimental Set up
A 10 ml glass pipette with an internal diameter of 7.2 mm was used for the experiment.
The narrow tip of the glass pipette was cut and the other side was sealed with a rubber
cap. A small magnetic bar (29x6 mm, 3 g) along with a modified insulin syringe
plunger was inserted in the pipette to assist in taking out the soaked sample from the
glass pipette. (Figure 4-2)
Page 68
46
Figure 4-2: components of Microvolumetric liquid level displacement method for porosity
measurement: A) magnetic bar, plunger from insulin syringe, and 10 ml glass pipette end sealed
with rubber cap 2) Set up and vertical alignment of the measuring pipette and its internal
components.
An OCA 15EC optical contact angle measuring instrument, dataphysics®, Germany
was used to capture the images more perfectly during test. The sample table for contact
angle measurement was replaced with the glass pipette, which was totally aligned and
fixed vertically in between light source and the camera. (Figures 4-2: B and 4-3)
Page 69
47
Figure 4-3: Laboratory set up for modified microvolumetric level displacement method for porosity
measurement. The measuring glass pipette with its components aligned vertically in between the
light source and the digital camera. The monitor shows the liquid level.
The glass pipette was filled up to the lens vision level with liquid hexane (Fisher
Scientific # H/0421/PB17), which can be clearly observed on the computer monitor.
Hexane is as an inert, cheap, relatively safe and colourless liquid. The digital level
marker was adjusted at the liquid level after proper focusing and the image was captured
on the computer screen (Figure 4-4: A). Using a micropipette, 100 µl of hexane was
added to the previous level (Figure 4-4: A) and the second image was captured with a
new liquid level marker. The distance between the two markers was later used for scale
calibration with the image processing software (Figure 4-4: B). This calibration step is
most important to validate our technique as precise and accurate. The new level was
assigned as the new reference baseline.
4.2.1.1 Microvolumetric Measurements
Using a fine tip tweezer and side pinching with agility, the sample was moved into the
standing pipette and let to sink. Once the sample was sat on the plunger surface, the
Page 70
48
elevation of the liquid level inside the pipette from the baseline was marked with a level
cursor on the computer and the image was captured (Figure 4-4: C). An external U-
shaped permanent magnet was used to pull up the suspended sample, which was sitting
on top of the plunger, with help of inside magnetic bar in the glass pipette, and then it
was removed with the tweezer from the glass pipette. The plunger was left to settle back
down the pipette. The liquid level marker was established and the last image was
captured (Figure 4-4: D).
Figure 4-4: Microvolumetric level method for porosity measurement: A) Baseline establishment, B)
Level calibration with 100 µl volume and second level establishment, C) V1: level elevation after
immersing the sample, and D) V2: Volume depletion after removing the sample.
Changes in the hexane level in the pipette from the baseline after calibration were
recorded. When the sample was immersed in the pipette, it sank into the hexane and sat
on top of the plunger surface and the hexane level elevated to a higher level compared
to the baseline. This volume change was recorded by the digital camera and called (V1),
representing the absolute volume of the sample. After removing the sample the hexane
level dropped to a lower level compared to the baseline. The image of this volume
depression which was called (V2) and represented the pore volume in the sample was
Page 71
49
captured by the camera using a SCA20 software version 4. 2. 4. (dataphysics®
Instruments). Changes in the hexane level were precisely measured through length
measurement using ImageJ® 1.47v software. The volume calibration image was used to
convert length to volume through imageJ® software.
Percentage of total pore volume was calculated as:
Total pore volume =V2
V1+V2 100 %
Where, V1 is volume change after immersing the sample (absolute volume = volume of
solid matter without pores) and V2 is volume change after removing the sample (pore
volume).
4.2.2 Validation of Microvolumetric method
To assess the accuracy and precision of the microvolumetric method of porosimetry
three standard porous samples were prepared. Two groups of porous alumina made of
alumina/poly-(ethylene oxide) composites with different ratios were fabricated by
means of sintering. Briefly, 5.45 g and 5.62 g of poly(ethylene oxide) (density: 1.21
g/cc) were mixed homogeneously with 0.86 g and 0.81 g of Al2O3 (density: 3.95 g/cc),
respectively and then the mixture powder was pelletized in a stainless steel mould at
room temperature at 100 MPa uniaxial pressure using a hydraulic press. The pellets
(10 mm 5mm) were then sintered at 1000°C temperature for 3 hours in nitrogen
atmosphere to get 65% and 70% porous alumina structures, called alumina1 and
alumina2, respectively. Sintered porous glass bars (R & H Filter Co. Inc, Georgetown,
USA) with dimensions of 4 mm x 5 mm x 50 mm and porosity of 61.5%, as supplied by
manufacturer, also were selected as the third standard porous material (Figure 4-5: A).
Porosity measurement of standard porous samples was carried on through both
microvolumetric method and micro-CT imaging.
Page 72
50
4.2.2.1 Field Emission Scanning Electron Microscopy (FESEM)
FESEM was performed using a QuantaTM
250 FEG – FEI microscope to confirm the
outer surface porosity of the fabricated porous samples.
4.2.2.2 Micro-CT
Micro-CT has been widely used as one of the best techniques to show the total pore
volume and porosity present in a material with complex geometry (Bertoldi et al., 2011;
H. Park & Miwa, 2003; Parrilli, 2010; Zhang Yang & Xiaofeng, 2007). Therefore, three
replicates of each standard porous group were subjected to micro-CT imaging for
porosity analysis using a SkyScan-Bruker 1076 in vivo micro-CT (parameters: voltage:
59 kV, current: 100 uA, filter: Al 0.5 mm, resolution: 18 µm, rotation angle: 180°,
rotation step: 0.7°, and number of scan slice: 100). Samples were mounted on
polystyrene foam prior to CT scanning.
4.2.3 Statistical Analysis
A Bland-Altman analysis(Altman & Bland, 1983; Bland & Altman, 1986) was used to
assess agreement between two methods of porosity measurement with the actual values.
XLSTAT® version 2014.1.05 package for Excel® (2007) was used for data analysis. A
range of agreement was defined as mean bias ±2 standard deviation (SD).
4.3 Results
Actual size of the sintered porous pellets from three different porous materials is shown
in Figure 4-5(A). Micro-CT and FESEM images shown in Figures 4-5(B) and 4-5(C-E)
clearly show the porous structure of representative porous alumina1 and alumina12, and
glass samples.
Page 73
51
Figure 4-5: Digital photographs (A), Micro-CT 3D rendering images (B), and FESEM micrographs
(C-E) of representative porous alumina1, glass, and alumina2 samples respectively.
The original results of porosity measurement by micro-volumetric and micro-CT
methods along with the actual porosities for two types of porous different sintered
alumina scaffolds and glass scaffolds are illustrated in Table 4-1. As it can be seen, total
mass volume of the samples are to the scale of only few hundred microliters and volume
measurements have been done to the resolution of less than one microliter.
Page 74
52
Table 4-1: Micro-volumetric and micro-CT porosities compared with the actual porosity, mean and difference between each method and the actual value.
Samples V1
(µl)
V2
(µl)
Actual Porosity
(%)
Porosity from
micro-volumetric
(%)
Mean:
Actual and Micro-
volumetric
Difference: Actual
and Micro-
volumetric
Porosity from
micro-CT
(%)
Mean:
Actual and Micro-
CT
Difference:
Actual and Micro-
CT
Alumina 1-1 59.2 112.5 65 65.5 65.3 -0.5 40.6 52.8 24.4
Alumina 1-2 55.6 107.5 65 65.9 65.5 -0.9 74.1 69.6 -9.1
Alumina 1-3 56.6 109.5 65 65.9 65.5 -0.9 79.1 72.0 -14.1
Alumina 2-1 66.7 142.2 70 68.1 69.0 1.9 73.3 71.6 -3.3
Alumina 2-2 61.9 131.9 70 68.0 69.0 2.0 83.4 76.7 -13.4
Alumina 2-3 55.6 119.4 70 68.3 69.1 1.7 84.3 77.1 -14.3
Glass 1 172.8 274.5 61.5 61.4 61.4 0.1 55.9 58.7 5.6
Glass 2 241.4 389.9 61.5 61.8 61.6 -0.3 70.9 66.2 -9.4
Glass 3 107.5 170.8 61.5 61.4 61.4 0.1 79.6 70.5 -18.1
Page 75
86
Figure 4-6compares the measured porosity through micro-volumetric and micro-CT
methods with the actual porosity of porous glass, alumina1, and alumina2 materials.
While the values obtained from micro-volumetric method are almost equal to the actual
porosities, with small standard deviations, the values gathered from micro-CT are
different from actual porosity and have very big standard deviations.
Figure 4-6: Comparison between the measured porosity through micro-volumetric and micro-CT
methods with the actual porosities of porous glass, alumina1, and alumina2.
Figure 4-7(A) shows the scatter plot of measured porosity through micro-volumetric
and micro-CT methods versus actual porosity values. There is a strong correlation
coefficient of R2=0.92 for micro-volumetric and actual porosities while that of micro-
CT method and the actual porosities is only 0.14, indicating a weak correlation between
the micro-CT and actual porosities. Figure 4-7(B) represents the Bland-Altman plot of
the difference versus mean porosities of each pairs of data, indicating an almost
consistent difference at various average porosities between the micro-volumetric and
Page 76
87
actual porosity compared to the changing difference for different values of mean
porosity between micro-CT and the actual.
Figure 4-7(C) also shows the Bland-Altman plots of the data with the bias and precision
lines for both micro-volumetric and micro-CT methods. The accuracy (bias= -0.023)
and precision (confidence interval: -0.459, 0.413) for micro-volumetric method is much
higher than that of micro-CT method (Bias = 6.1, CI: -21, 33.1).
Page 77
88
Figure 4-7: A) Scatter plot of measured versus actual porosity and the corresponding regression
coefficients for Micro-volumetric and Micro-CT methods, and B) scatter plot of difference versus
mean porosity of Micro-volumetric and Micro-CT with actual porosity, and C) Bland-Altman plots
of the data showing the level of agreement between measured and actual porosities. The solid lines
R² = 0.925
R² = 0.1464
35.0
45.0
55.0
65.0
75.0
85.0
61 63 65 67 69 71
Mea
sure
d p
oro
sity
(%)
Actual Porosity (%)
Micro-Volumetric
Micro-CT
A
y = 0.242x - 15.451R² = 0.4359
y = -1.475x + 95.104R² = 0.7919
-25.0
-15.0
-5.0
5.0
15.0
25.0
35.0
50.0 55.0 60.0 65.0 70.0 75.0 80.0
Dif
fere
nce
in p
oro
sity
(%
)
Mean porosity (%)
Micro-volumetric vs Actual
Micro-CT vs Actual
B
-25.0
-20.0
-15.0
-10.0
-5.0
0.0
5.0
10.0
15.0
20.0
25.0
30.0
35.0
50.0 55.0 60.0 65.0 70.0 75.0 80.0
Dif
fere
nce
in p
oro
sity
(%
)
Mean porosity (%)
Micro-volumetric vs Actual
Micro-CT vs Actual
C
Page 78
89
indicate the accuracy and the square dotted lines represent the precision of the two techniques.
95% of the data are expected to fall within±1.96Ơ.
4.4 Conclusion
In this chapter, a revised modification of Archimedes’ principle based liquid level
displacement method to increase the accuracy and precision of porosity measurements
of small light highly porous materials for many advanced applications is hereby
presented. Our method consists of using a pipette as a more delicate measuring cylinder
along with the improved sample loading and removal system, and taking advantage of
digital imaging and computer assisted image processing to increase the performance of
liquid level change readings.
Our findings show that the precision and accuracy of our modification of Archimedes’
method of porosity measurement is much higher than that of Micro-CT. Although each
group of our standard samples were fabricated with constant conditions, micro-
volumetric method shows similar results with a small standard deviation for each type
of construct, while micro-CT method fails to do so. We achieved an excellent precision
and accuracy in porosity measurements. The readability of microvolumetric method is
down to 1 µl volumes.
This method is applicable to any porous material regardless of opacity, lightness, shape
and degree of porosity. Taking advantage of the magnetic bead/plunger escalator
technique instead of a variable size string to suspend the sample, high performance lens
with integrated continuous fine focusing ability, and adjustable observation and camera
tilt angle, minimize the measurement errors and brings in a high precision and accuracy
to the measurements.
Microvolumetric level method is one of the most accurate and precise methods of
porosity measurement for ultra-light highly porous materials. Simple design, feasibility,
Page 79
90
open source ImageJ® software and straight forwarded results all are the benefits of this
modification.
Page 80
91
CHAPTER 5: ISOLATION, CULTURE AND CHARACTERIZATION OF
HUMAN DERMAL FIBROBLASTS
5.1 Introduction
There are two main strategies for isolation of human dermal fibroblast cells: enzymatic
digestion of skin samples and the outgrowth (explant) method. Whilst enzymatic
digestion can shorten the HDF production time, it often yields a non-homogeneous
population of fibroblasts, therefore, the explant method is preferred when one seeks to
isolate a pure population of HDF cells within 3 to 4 weeks (Froget et al., 2003). Further,
the explant method can yield high motility cells, which are more suitable for tissue
engineering applications in terms of their better penetration into the scaffolds (Rittié &
Fisher, 2005).
In this chapter we explain the explant method for HDF cell isolation with minor
modifications. Subculture and preservation of HDF cells as well as characterization are
also described.
5.2 Materials and Methods
5.2.1 Cell Isolation
Ethical approval for this study was obtained from the University of Malaya Medical
Centre (UMMC) ethics committee (PPUM/MDU/300/04/03, 22 April 2011). Redundant
human skin from cosmoplastic surgery was procured from the UMMC operating
theatre. Preferably, skin from non-sun-exposed areas of the body of female subjects was
used for cell cultivation. The average age of the subjects was 27.5 ± 15 years. The
minimum and maximum ages were 8 and 42 years respectively. Preoperative
antimicrobial preparation (prep and drape) was done as the routine technique prior to
incision. After excising the extra full-thickness skin, in some occasions along with the
underlying fat tissue, the tissue was dipped in Povidone Iodine and then 70% ethanol,
Page 81
92
each for 5-10 seconds. The skin sample was then washed with sterile saline and
immediately transferred to a cell culture clean room in a sterile container with saline and
3-5X Antibacterial-Antifungal solution (Penicillin 100 IU/mL, Streptomycin 100
μg/mL, and Amphotericine B 0.25 μg/mL). The rest of the work was carried out inside a
laminar flow biological safety cabinet. The skin samples were transferred to another
sterile container with wash medium containing DMEM-HG (4.5g/l glucose) with L-
glutamine and Sodium Pyruvate [cellgro® #10-013-CM] and 3X Penicillin-
Streptomycin-Neomycin Solution [GIBCO # 15640]. Any remaining Infradermal fat
was removed (Figure 5-1, A-C). The skin was first cut into strips of 0.5-1 cm2. The
epidermis was dissected from dermis using scalpel and surgical blades (Figure 5-1, D).
The dermis then was minced to 0.5-1 mm2 pieces (Figure 5-1, E&F). Nunc
EasYFlask™ Nunclon™ T25 tissue culture flasks were pre-wetted with working
medium (DMEM with 4.5g/l glucose, L-glutamine and Sodium Pyruvate [cellgro® #10-
013-CM] supplemented with 20% FBS [SIGMA # F1051] and PSN [GIBCO # 15640])
and left to dry out inside the laminar flow biological safety cabinet. 5-10 minced dermal
pieces were transferred to each flask and incubated (Figure 5-1, G-I). 30-45 minutes
later 1-2 drops of working medium per each skin piece was gently added to the flasks on
top of each sample. The flasks were incubated in 5% CO2 at 37°C. The flasks were
checked for possible drying of medium and 1-2 drops of working medium was added on
top of each skin sample when necessary. After 3 days, and thereafter every 2-3 days, the
medium was changed, until the cells started to grow, then the concentration FBS in
working medium was decreased to 10%.
Page 82
93
Figure 5-1: Outgrowth method for HDF isolation. A) Full-thickness skin washed in DMEM + 3-10X
Antibiotic solution, B & C) Dissecting infradermal fat layer, D & E) Dissecting Epiderm from
Derm, F) Mincing the Derm, G, H & I) Putting small minced derm samples in pre-wetted T25 flask.
5.2.2 Cell Harvesting
After the cells started to grow, the skin pieces were removed and cultured in new flasks
with the same described method, and the same process was followed again. Cell
isolation from the same skin pieces was repeated up to six times. After the flasks
reached confluence of up to 70-100% passaging was done using TryPLE Select®
[GIBCO# 12563011]. Briefly, the medium was removed and discarded and cells were
gently washed with pre-warmed (37°C) PBS. After discarding the PBS, 2ml of TryPLE
Select® was added to each T25 flask and incubated at 37°c for 3-15 minutes with
intermittent monitoring under an inverted phase microscope (Nikon ECLIPSE TS100)
Page 83
94
for cell detachment. Cell detachment was enhanced by tapping the flask. 5 ml working
medium was added to each T25 flask to inactivate the TryPLE Select®. The cell
suspension was transferred to 15 ml centrifuge tubes and spun at 220 RCF for 5
minutes. The supernatant was gently removed and the cell pellet was resuspended in
1ml fresh medium.
5.2.3 Cell Count and Viability (Dye Exclusion Method)
Preparation of Trypan Blue Solution
0.2 gm Trypan Blue (Sigma Catalog # F-7378) was dissolved in 99.8 ml Ultra-pure
water and filtered through a 0.45µm hydrophobic membrane syringe filter (Thermo
SCIENTIFIC Catalog # 9057). 0.2% Sodium Azide (Sigma Catalog # S2002) was
added to make a stock solution. 2 ml stock solution was added to 0.43 gm Sodium
Chloride (NaCl) in 9.58 ml Ultra-pure water to make the Trypan Blue working solution.
Cell Count and Viability
20 µl of the cell suspension was transferred to a 1.5 ml micro-centrifuge tube and
topped up with the same amount of Trypan Blue working solution. After placement of a
cover slip (Hausser Scientific, Horsham, PA) on a Bright-line Haemocytometer, 20 µl
of Trypan Blue/cell suspension mixture was transferred to each of the two chambers of
the haemocytometer.
The unstained (viable) and stained (nonviable) cells were counted separately in the
haemocytometer. The total number of viable cells was multiplied by 2 (the dilution
factor for trypan blue) to obtain the total number of viable cells per ml, and the total
number of viable and nonviable cells were added up to obtain the total number of cells
per ml.
Page 84
95
5.2.3.1 Subculture of HDFs
According to the cell count results 5x10³ cells per square cm were transferred to new
T75 flasks. 12-15 ml fresh working medium was added to each flask and incubated at
37° in a 5% CO2 humidified incubator. Sub-culturing the HDF cells was continued up to
Passage 4 and then cryopreservation was done.
5.2.3.2 Cryopreservation
At passage 3, when the cells reached confluence, the medium was discarded and the
cells in the T75 cell culture flask were washed twice with 10-15ml pre-warmed
Phosphate Buffered Saline (PBS). PBS was discarded and cell harvesting was carried
out using TryPLE Express® through the previously described method. After spinning
the cell suspension at 220 RCF for 5 minutes and discarding the supernatant, the cell
pellet was resuspended in 1 ml of working medium. Cell counting was performed. The
cell suspension, with a density of 106-10
7cells/ml, was transferred to a 2 ml cryovial and
7% Dimethyl sulfoxide (DMSO) [SIGMA#2650] was added to each vial. The cryovial
was labelled, kept at room temperature for 30 minutes for equilibration, placed in a Mr
Frosty™ freezing container (Thermo Scientific), and moved to a -80ºC freezer and left
overnight. The next day, the cryovial was shifted to a liquid nitrogen tank for long-term
conservation.
Page 85
96
5.2.4 Resazurin Standard Curve for HDFs
Determining cell number and viability without the need to harvest or digest cells
provides certain advantages. It allows the researcher to track the changes in cell number
precisely, without the need of inference, and also to the see the changes to cells as the
result of external factors in real time. Resazurin (7-Hydroxy-3H-phenoxazin-3-one 10-
oxide) has been used as a non-toxic cell number/viability quantifying assay with a
variety of cell types (Dienstknecht et al., 2010; Gago et al., 2009; Jeney, Bazsó-Dombi,
Oravecz, Szabó, & Zs-Nagy, 2000), bacteria (Lorenz et al., 2008; Riekstina, Muceniece,
Cakstina, Muiznieks, & Ancans, 2008; Rutherford et al., 2002) and fungi (Xu, Rao,
Zhu, & Chai, 1993) since the reagent was first introduced in 1929 (Pesch & Simmert,
1929). The indigo blue and non-fluorescent Resazurin can easily diffuse through cell
membranes without harming the cells. A significant overtime reduction of
AlamarBlue® dye co-incubated with post-mitochondrial fractions of murine hepatic
cells has shown the role of microsomal, mitochondrial and cytosolic enzymes in
intracellular metabolism of Resazurin (R.J. Gonzalez, 2001). Resazurin is oxidized
inside the cells and turns into pink fluorescent Resurfin (Figure 5-2).
Figure 5-2: The bluish Resazurin passively diffuses into the cells and gets oxidized into pinkish
Resurfin which diffuses back into the intercellular space.
Page 86
97
Both Resazurin reduction and Resurfin production can be measured through
colorimetric and fluorometric readings respectively. This helps to visually identify the
metabolic activity of the cells which suggests that cells are indeed viable. Cost-
effectiveness, safety, ease and feasibility of long term use and good correlation to other
reference cell viability assays as well as feasibility of the application of other
chemiluminescent assays are the reasons of the superiority of Resazurin among other
assays (Chen et al., 2007; Dienstknecht et al., 2010; Rampersad, 2012).
Although Resazurin has been used to assess viability in a wide range and number of
animal and human cells including Swiss 3T3 mouse fibroblasts (Voytik-Harbin,
Brightman, Waisner, Lamar, & Badylak, 1998), rat hepatocytes (O'Brien, Wilson,
Orton, & Pognan, 2003), Retinal Pigment Epithelial Cells (RPEs) (Yu, Chung, Yu, Seo,
& Heo, 2003), and Mesenchymal Stem Cells (MSCs) (Dienstknecht et al., 2010), its
suitability for use with primary HDFs has not yet been shown.
In this study, varying densities of primary HDF cells in monolayer culture on TCP were
subjected to four different formulations from two commercial brands of Resazurin dye
at varying incubation times. We show HDF attachment rate on TCP 4 hour after cell
seeding. We report a detailed method to determine the most reliable formulation for dye
preparation, Resazurin standard curve for primary HDFs, and also suggest a “Resazurin
Reduction Nomogram” as a graphic tool for quantification of monolayer cultured
primary HDFs based on Resazurin absorbance.
5.2.4.1 Cell Seeding
HDF cells at passage 5 were seeded at different densities (2, 6, 20, 50, and 100 x103
cells/well) in quadruplicates in six separate Nunc® 24-well plates pre-wetted with
working medium. The last well in each row was left unseeded as blank. Wells including
the blank were topped up to a final volume of 500 µl with working medium and
incubated in 5% CO2at 37°C for 4 hours.
Page 87
98
5.2.4.2 Cell Attachment
Four hours after cell seeding two of the 24-well plates with different cell densities were
removed from the incubator and subjected to trypsinization and cell harvesting. The
cells from each well were collected in separate 1.5 ml microcentrifuge tubes and span
for 5 min at 220 RCF. After removing the supernatant, the cell pellets were resuspended
in 200 µl of fresh medium and cell count using the Trypan-blue and haemocytometer
method was performed. The average ± SD cell number attached on TCP surface, 4
hours after seeding varying cell densities was calculated.
5.2.4.3 Dye Preparation
To prepare the stock solutions, the Resazurin sodium salt powder (Sigma-Aldrich #
R7017) was dissolved in Phosphate Buffered Saline (Sigma-Aldrich # P4417) solution
and Phenol red-free Dulbecco’s Modified Eagle’s Medium (DMEM) (Sigma-Aldrich,
Cat No.: D5921) separately at a concentration of 140mg/liter according to the
instructions from Sigma technical support team. AlamarBlue® (Life Technologies #
DAL1100) readymade stock solution was also purchased from a local company. The
stock solutions where then re-diluted with either PBS or Phenol red-free DMEM to
make 10% working solutions.
5.2.4.4 Resazurin Assay
4 hours after cell seeding and incubation the 24-well plates were also checked under an
inverted microscope for cell attachment. The working medium was removed gently and
discarded. 3ml of either pre-warmed 10% AlamarBlue® in PBS or AlamarBlue® in
DMEM or Resazurin in PBS or Resazurin in DMEM was added to each well and the
well-plates were re-incubated. After 50 minutes all four well-plates were wrapped in
aluminum foil and shaken at 60 rpm for 10 minutes on an orbital shaker. Duplicates of
100 µl of the dye from each well were transferred to a TPP 96-well-plate and the
Page 88
99
absorbance was measured in the plate reader (FLUOstar OPTIMA (BMG LABTECH)
at 570nm and 595 nm. Measurements were repeated every 1-2 hour up to 22 hours. The
following manufacturer’s formula (Gang et al., 2004) was used to calculate the
percentage of AlamarBlue®/Resazurin dye reduction:
(εOX)λ2 Aλ1 − (εOX)λ1 Aλ2 of test agent dilution
(εOX)λ2 A°λ1 − (εOX)λ1 A°λ2 of untreated positive growth control x 100
Where:
εOX = molar extinction coefficient of AlamarBlue oxidized form (BLUE)
εRED = molar extinction coefficient of AlamarBlue reduced form (RED)
A = absorbance of test wells
A° = absorbance of positive growth control well
λ1 = 570nm
λ2 = 600nm
% reduction in Resazurin at different cell densities was plotted against time to get the
Resazurin Standard Curve for Human Dermal Fibroblasts.
5.2.5 HDF cell doubling time
Cells in culture proliferate on a binary fission basis; on the other hand each cell cleaves
into two equal cells at an invariant rate. When the duration of time per cell repartition is
known, population sizes can easily be predicted. The mean generational time (the time
the cells need to double) can be calculated from population sizes at given times.
Generation of a growth curve is useful in evaluating the growth characteristics of the
cells particularly when growth kinetics of cells on a special material is considered. From
a growth curve, the lag time, logarithmic population doubling time and the stationary
phase (saturation) density can be determined. The results are plotted on a log-linear
scale, then the population-doubling time can be determined by identifying the cell
Page 89
100
number along the exponential phase of the curve, tracing the curve until that number has
doubled, and calculating the time between the two.
Methods
HDF cells were seeded at a density of 25x103 cells/well in pentaplicates in 6-well plates
(TPP, Switzerland) pre-wetted with 500 μl of working medium. The last well in each
plate was left unseeded as the blank. After 4 hours of incubation in 5% CO2 and 37°C
all wells including the blank were topped up to a final volume of 3ml with working
medium and re-incubated.
Five aliquots of cell suspension with the same density (2.5 X 10⁴) were also prepared
for total DNA quantification through Hoechst 33258 method.
Resazurin reduction test, cell count, and DNA quantification were performed at 24 h
intervals every day.
DNA Quantification
Preparation of EDTA/PBE solution
10 mM (0.02922g) Ethylenediaminetetraacetic acid (EDTA) white powder (SIGMA
#E6758) was dissolved in 100ml PBE (pH=7.8) and labelled properly, then autoclaved
and left to cool down. (The EDTA will not dissolve in PBE unless its pH is adjusted to
7.8)
Preparation of DNA Standard
5 mg Deoxyribonucleic acid sodium salt from calf thymus Type 1 fibres (SIGMA
#D1501) was weighed using a SHIMADZU AY220 Analytical Balance in sterile
condition and dissolved in 5.00 ml of EDTA/PBE solution in a small sterile glass
container inside the laminar flow hood. The container was left in a 0-4°C fridge
overnight (≥16 hours). Once in a while the container was shaken gently. After around
Page 90
101
12 hours the DNA started to make a gel. To shear the DNA, it was pipetted up and
down several times using a sterile glass pipette. The DNA was filtered through a 0.45
µm syringe filter (minisart SRP15, Sartorius, Germany) after it was fully dissolved. The
precise DNA concentration was checked with a Nanodrop ND2000 (Thermo Scientific).
As DNA tends to be absorbed onto the plastic surfaces, it was aliquoted in 1-2ml bijou
tubes and frozen at -20ºc. (This way the DNA standard solution can be stored for
several months without significant degradation)
Hoechst Stock Solution
50mg of Hoechst 33258 (SIGMA #861405) was dissolved in 25.00 ml of ultra-pure
water in a light-tight bottle to make 2mg/ml Hoechst stock solution.
Preparation of TEN Buffer
A mixture of 10 mM Tris, 0.2 M NaCl, and 1 mM EDTA in PBS was prepared,
autoclaved, and the pH was adjusted to 7.4. The TEN buffer was used for diluting the
Hoechst stock solution to a working solution of 0.2 µg/ml.
Papain Digestion
Page 91
102
1.5625µg/
ml
3.125µg/
ml
6.25µg/ml 12.5µg/ml 25µg/ml 50µg/ml
At each daily time point, pentaplicates of cells in the 6-well plate were trypsinized and
harvested and subjected to Papain digestion after performing a Resazurin test and cell
count.
1 ml of digest buffer with the following formula was added to each cell pellet.
Digest buffer ingredients:
L-Cystein HCl (Sigma # C1276) 0.1576 g
EDTA (Sigma # E6758) 0.0806 g
PBS 100.00 ml
3 µl (~5 KU) of Papain (Sigma # P5306) was added to each tube and incubated in a 65ºc
oven for 1 hour with intermittent vortex-mixings. The digests were centrifuged at
10,000 RPM for 10 min to sediment the residual debris. The supernatants were then
ready for DNA quantification.
Standard DNA Curve
Serial dilutions of standard DNA were made at 50, 25, 12.5, 6.25, 3.125, 1.5625, and
0.78125 µg/ml with PBE (Figure 5-3). Triplicates of 40µl of each dilution along with
triplicates of each cell digest sample were transferred to a black, flat dense bottom 96-
well-plate (Falcon, Corning # 3916). 200 µl of the working Hoechst solution (0.2
µg/ml) was added to each well in a dark room. Wrapped in Aluminium foil the 96-well-
plate was transferred to the microplate reader (FLUOstar OPTIMA BMG LABTECH)
and absorbance was read at excitation: 570 nm and 595 nm. An R2-value of ≥ 0.95 for
the standard DNA dilution concentration against optical density was accepted.
Page 92
103
Figure 5-3: Preparation of serial dilutions of standard DNA.
5.2.6 Characterization of HDFs
5.2.6.1 Morphology:
The morphology of HDFs on tissue culture polystyrene was studied using an inverted
phase microscope. Also Confocal and FESEM micrographs of HDFs seeded on collagen
scaffolds (precisely described in Chapter 5) were used for HDF cell morphology.
5.2.6.2 Tri-lineage Differentiation
Tri-lineage differentiation was performed to rule out the possibility of presence of stem
cells in HDF population. HDF cells at passage 4 were used for Tri-lineage
differentiation. Human Bone Marrow Stem Cells (HBMSC) was also used as the
positive control group. Immediately after thawing the cells they were washed with fresh
medium and centrifuged at 220 RCF for 5 minutes. The supernatant was discarded and
the cell pellet was resuspended in 1 ml of fresh medium. Cell count and viability test
was done using Trypan Blue solution and Neobar Hemocytometer.
Adipogenic Differentiation
Page 93
104
Cells were plated in Lab-Tek®II 4-Chamber glass slides (Figure 5-4) at a density of
2500-3500 cells per cm2 (≈6000 cell/chamber) and incubated at 37° in a 5% CO2
humidified incubator for 2 hours, then topped up with working medium.
Figure 5-4: Seeding HDFs in 4-Chabber glass slides for adipogenic and osteogenic lineage
differentiation.
The medium was replaced every 3 days until the cells were 100% confluent. Upon
reaching a state of confluency, the medium was replaced by Adipogenesis induction
medium (STEMPRO® Adipogenic Differentiation Kit- A10070-01) and this medium
change is made reference to differentiation day 1. The adipogenic differentiation
medium was changed every 2-3 days for up 21 days. Inverted phase microscopic
monitoring for lipid droplets was performed every day for both test and control groups.
At day 21 the medium was discarded and the cells were washed very gently with pre-
warmed PBS and then Oil-Red O staining was carried out.
Page 94
105
Oil-Red O Staining
Dye Preparation
0.5g Oil-Red-O (Sigma # O0625) was dissolved in 100 ml Isopropanol (Fisher #
P/7500/17) in a warm water bath to prepare stock solution.Three parts of Oil-Red-O
stock solution were mixed with 2 parts of ultra-pure water to make the work solution.
Staining
The medium was removed and discarded. Cells were washed with PBS. Fixation was
carried on through incubating the cells with 4% Paraformaldehyde for 30 minutes at
room temperature. After discarding the fixing solution the cells were washed with PBS
three times and then 0.5 ml ultra-pure water one time. 0.5 ml of Oil-Red-O working
solution was added to the cells in each chamber and incubated for 50 minutes at room
temperature. Removal of the dye was followed by gentle washing with ultra-pure water
three times. 0.5 ml Hematoxylin was added to each chamber and incubated for 10
minutes at room temperature. Hematoxylin was removed and cells were washed with
ultra-pure water again. Stained cells were watched under inverted phase microscope and
pictures were snapped.
Osteogenic Differentiation
Cell seeding was done with the same method described for adipogenic differentiation.
After getting confluency the working medium was replaced with Osteogenesis induction
medium (STEMPRO® Osteogenic Differentiation Kit- A10072-01) and this medium
change corresponded to differentiation day 1. The Osteogenesis differentiation medium
was changed every 2-3 days for 21 days. Inverted phase microscopic monitoring was
performed every day for both test and control groups. At day 21 the medium was
Page 95
106
discarded and the cells were washed very gently with pre-warmed PBS and then
Alizarin-Red staining was carried out.
Alizarin-Red Staining
Dye Preparation
2.0 g Alizarin-Red (Sigma # A5533) was dissolved in 100 ml ultra-pure water and
Filtered through a 0.45 µm filter paper. pH was adjusted to 4.2 using 10% Ammonium
Hydrochloride.
Staining
After discarding the medium the cells were washed with PBS, and then fixed through
incubating with 10% Formaldehyde for 30 minutes at room temperature. Fixative
removal was followed by gentle washing with PBS three times and ultra-pure water one
time. Addition of 1 ml Alizarin Red to each chamber was followed by incubation at
room temperature for 30 minutes. The dye was removed and cells were washed with
ultra-pure water three times, each time with gentle shaking for 5 minutes. Image
acquisition was done after addition of 1 ml ultra-pure water.
Chondrogenic Differentiation
Small droplets of cell suspension were put in a centric order in previously medium
coated 6-well plate (Figure 5-5) at a total density of 103 cells per square cm and
incubated.
Page 96
107
Figure 5-5: Centric cell seeding for Chondrogenic Differentiation.
Two hours later, 2 ml of chondrogenesis differentiation medium (STEMPRO®
Chondrogenic Differentiation Kit- A10071-01) was added to each well and incubated.
The Chondrogenesis differentiation medium was changed every 2-3 days for up to 21
days. Inverted phase microscopic monitoring was performed every day for both test and
control groups. At day 21, the medium was discarded and the cells were washed very
gently with pre-warmed PBS and then Safranin O staining was carried out.
Safranin-O Staining
Cells were rinsed with PBS and then fixed with 10% Formaldehyde for 30 minutes at
room temperature. Washing the cells with ultra-pure water was followed by putting 2 ml
1.5% aqueous Safranin-O for 40 minutes. The dye was removed and cells were washed
with ultra-pure water three times. 2 ml of 0.02% alcoholic fast green was added and
removed after 30 seconds. 2 ml of 1% acetic acid was added and removed after 3
seconds and cells were rinsed quickly with ultra-pure water and watched under an
inverted phase microscope.
Page 97
108
5.2.6.3 Immunologic Differentiation
Flowcytometry
Cryopreserved HDF cells at P6 were used for flowcytometry. Bovine Aortic Endothelial
Cells (BAECs) were used as negative control. Immediately after thawing the cell
suspension was diluted with fresh pre-warmed complete work medium and centrifuged
at 220 rpm for 5 minutes. The supernatant was discarded and the cell pellet was
resuspended in 1ml fresh medium. Cell count was performed through Trypan Blue and
Haemocytometer chamber method. Cells were washed with 15 ml of wash medium
(0.5% Bovine Serum Albumin [aMReSCO # 0332-25g] in PBS) and centrifuged at
2000 rpm 5 minutes. The cell pellet was resuspended again in 12 ml wash medium and
filtered through a 70 µM BD FalconTM
nylon cell strainer [REF 352350]. Filtered cells
were counted again and then divided into three separate tubes along with one tube for
BAECs, each containing ≥106 cells and incubated on ice at 4°c for 20 minutes. After
centrifuging at 2000 rpm for 5 minutes, the supernatants were discarded. The BAECs
sample as the negative control and one of the HDF tubes were planned to be stained
with CD90 (Anti-Fibroblast Antigen Mouse monoclonal Antibody) (AS02)
[Calbiochem® # CP28] as the primary antibody. The second HDF tube was aimed to be
stained with FITC conjugated CD31 CO.3E1D4 IgG2a antibody [GeneTex #
GTX43622] as the negative control-2 and the last HDF was meant to remain unstained.
The BAEC negative control-1and HDF Sample were resuspended respectively in 85 µl
of sheath fluid [BD FACSFlowTM
# 342003] + 3 µg/15 µl of CD90. The HDF negative
control-2 cells were resuspended in 90 µl of sheath fluid + 10 µl of CD31, and the last
HDFs were resuspended in 100 µl of sheath fluid. All tubes were incubated at room
temperature for 45 minutes. (Saalbach et al., 1996; Saalbach, Aust, Haustein, Herrmann,
& Anderegg, 1997) After removing the primary antibody, cells were washed two times
with sheath fluid and centrifuged at 2000 rpm 5 minutes. BAEC negative control-1and
Page 98
109
HDF Sample were resuspended in 90 µl of Sheath fluid and 10 µl of Cy5 conjugated
Goat Anti-Mouse IgG Secondary Antibody [Thermo SCIENTIFIC # PA1 -28523],
wrapped in Aluminium foil and incubated for another 45 minutes at room temperature.
After washing out the secondary antibody all samples were centrifuged at 2000 rpm and
resuspended in 500 µl of sheath fluid and taken for flowcytometry. The final evaluation
was done by using the FACS CANTO II.
Page 99
110
QPCR
In the present study, two fibroblast specific markers along with four stemness markers
were used for fibroblast characterization through gene expression. Table 3-1 shows the
particulars of different gene assays used for QPCR.
Table 5-1: TaqMan® assays used for characterization of human dermal fibroblasts through gene
expression
Markers Gene name Abbrev. NCBI Ref. Seq. Assay No.
Endogenous
Control
Glyceraldehyde 3-phosphate
dehydrogenase
GAPDH NM_001256799.1 Hs02758991_g1
Fibroblast Markers Fibroblast Specific Protein 1 S100A4 NM_002961.2 Hs00243202_m1
Fibroblast Surface Antigen THY1 NM_006288.3 Hs00264235_s1
Stemness Markers Octamer-binding transcription factor OCT4 NM_001173531.1 Hs04260367_gH
Sex Determining Region Y-Box 2 SOX2 NM_003106.3 Hs01053049_s1
NANOG NANOG NM_024865.2 Hs04260366_g1
Rex1 ZFP42 NM_174900.3 Hs01938187_s1
Fibroblast-specific protein 1 (FSP1) is a cyto/nucleoplasmic and extracellular
calcium-binding protein that is encoded by S100A4 gene. FSP1 is assumed as a
fibroblast marker in different organs (Österreicher et al., 2011; Strutz et al., 1995).
Fibroblast surface antigen, known also as CD90 and Thy-1 (thymocyte
differentiation antigen 1) is a heavy cell surface protein which is encoded by THY1
gene. In humans, Thy-1 is expressed by endothelial, smooth muscle, some of bone
marrow cells, and also of fibroblasts of most vertebrate species studied (Saalbach et al.,
1997; Vaheri et al., 1976).
Page 100
111
OCT4 is a protein encoded in human by POU5F1 gene and is involved in the
self-renewal of undifferentiated embryonic stem cells.
Sex Determining Region Y-Box 2 (SOX2) is a transcription factor responsible
for pluripotency of stem cells.
NANOG is also a transcription factor in embryonic stem cells and is responsible
for maintaining the pluripotency and self-renewal.
REX1 is protein encoded by ZFP42 gene and is responsible for maintaining the
pluripotency of mesenchymal stem cells.
Page 101
112
5.3 Results
5.3.1 HDF Cell Morphology
Fibroblast cells are known for their spindle shape morphology. Although they bear
irregular round shapes when suspended, they start spreading when attaching on plastic
surfaces. They align parallel while featuring wavy whirling arrangements in confluent
states (Figure 5-6).
Figure 5-6: Daily serial micrographs [form A) Day 0 to L) Day 11] of HDFs seeded on tissue culture
polystyrene at an initial density of 3x10³/cm
3.
Page 102
113
Confocal laser scanning micrographs of HDFs in 3D culture on CMD porous scaffolds
also shows their spindle-shaped morphology (Figure 5-7: B). FESEM micrograph of a
spreading HDF cells with its cell processes is shown in Figure 5-7: C.
Figure 5-7: Representative figures of human dermal fibroblasts: A) Typical spindle-shaped
morphology of HDF cells in monolayer culture on TCP, B) 3D culture on CMD porous scaffold
stained with Live-Dead assay, and C) FESEM micrograph of a single HDF cell spreading its
processes and attaching on CMD surface.
5.3.2 HDF Resazurin Standard Curves
Four (4) Hour HDF Cell Attachment on TCP
Page 103
114
Cell attachment on tissue culture polystyrene plates four hours after seeding 2-
100X103HDFs was found to be 35.9±7.8% (Figure 5-8). Based on this data, the
Resazurin standard curves were plotted on the basis of the number of the attached cells
rather than the seeded density.
Figure 5-8: Representative inverted microscope images of HDF cells seeded on TCP at varying
densities of: A) 2x10³, B) 6X10
3, C) 2x10
4, D) 5x10
4, and E) 10
5 cells per well 4 hours after seeding.
The graph F plots the harvested cell number 4 h after seeding against the initial seeding density
(n=8 for each cell density).
HDF cell number quantification in a wide incubation time and cell density range was
feasible through AlamarBlue®/Resazurin dye diluted with either PBS or Phenol-red-
free DMEM.
Page 104
115
Our data did not follow a normal distribution pattern. As such, Kruskal-Wallis Test was
conducted and revealed no statistically significant difference in % reduction of the dye
among four different formulations at each cell seeding density (P > 0.05).
When % reduction in AlamarBlue®
-DMEM was plotted against the cell number at
different incubation time points the standard curve remained linear with correlation
coefficients almost above 0.95 except for 1 and 4 hours (0.62 and 0.82 respectively),
while regression lines showed overlappings at 1 and 2 hours and at 3 and 4 hours, and
also dislocations at 3, 4, 6, and 12 hours (Figure 5-9).
Figure 5-9: Reduction of AlamarBlue-DMEM as function of cell density in monolayer culture at
varying incubation times from 1 to 22 hours.
The correlation obtained between % reduction in AlamarBlue®
-PBS and cell number at
different incubation time points remained linear with correlation coefficients almost all
above 0.95 except for 1, 6 and 22 hours, which were 0.75, 0.91, and 0.89 respectively,
Page 105
116
while regression lines showed overlapping at 1 and 2 hours and at 4 and 6 hours, and
also dislocations at 2, 5, and 12 hours (Figure 5-10).
Figure 5-10: Reduction of AlamarBlue-PBS as function of cell density in monolayer culture at
varying incubation times from 1 to 22 hours.
Plotting % reduction in Resazurin-DMEM versus cell number at different incubation
time points showed linear correlation with coefficients almost above 0.94 except for 1,
3, 4, and 6 hours (0.83, 0.83, 0.85 and 0.92 respectively), while regression lines showed
overlappings at 3 and 4 hours and at 5 and 6 hours, and also dislocation at 4, 6, and 14
hours (Figure 5-11).
Page 106
117
Figure 5-11: Reduction of Resazurin-PBS as function of cell density in monolayer culture at
varying incubation times from 1 to 22 hours.
The correlation between % reduction in Resazurin diluted in PBS and cell number at
different incubation time points remained linear with correlation coefficients all above
0.95 with almost no significant overlapping or dislocation (Figure 5-12).
Figure 5-12: Reduction of Resazurin-PBS as function of cell density in monolayer culture at
varying incubation times from 1 to 22 hours.
Page 107
118
The Friedman Test showed a significant difference between all the first 5 time points at
every given cell density in the Resazurin-PBS group (P < 0.05) (Figure 5-13).
Figure 5-13: Resazurin Reduction Nomogram as a practical tool for quantification of Human
Dermal Fibroblasts cell density in monolayer culture at 1 to 5 hours incubation times. The orders of
all 5 curves look reasonable and logical.
Our results confirm that the % reduction in Resazurin/ AlamarBlue® has a linear
correlation with HDF cell number and that there is no statistically significant difference
between the two different commercial dyes regardless of the dye preparation
formulation is. Although there was no significant difference in the % reduction of the
dye among four different formulations at every cell density, however, considering the
correlation coefficients, the order and the regularity of the curves, Resazurin-PBS
reduction nomogram is suggested as a practical graphic tool for determination of HDF
cell number at different incubation times from 1-5 hours (Figure 5-13).
The linearity of the correlation between the Resazurin reduction and HDF cell number
appears to support the previous findings (Al-Nasiry, Geusens, Hanssens, Luyten, &
Pijnenborg, 2007; Voytik-Harbin et al., 1998; Yu et al., 2003). Although our findings
Page 108
119
showed similar features to the previous studies, however, the wide dye concentration as
well as the cell density and type in our study are the advantages of our results.
The correlation between the Resazurin dye absorption and the cell number has been
studied with different cell types. AlamarBlue® dye has been shown to have a good
constant correlation with Swiss 3T3 Mouse Fibroblast cell number in a wide range of
dye concentration and cell density(Voytik-Harbin et al., 1998). The correlation between
the optical density of AlamarBlue® dye and Retinal Pigment Epithelial Cell number has
been reported to be linear with a correlation coefficient of 0.951 through absorbance
method at 2, 4, 6, 9, 12, and 24 hour time points(Yu et al., 2003), and eventually
plotting the AlamarBlue® % reduction against the logarithm of choriocarcinoma cell
density (16.6– 500 X 103) was also reported to be linear with regression coefficients of
0.73 – 0.81(Al-Nasiry et al., 2007).
Although comparison between the four different dye formulations showed no significant
difference between the four formulations at any given cell density, the correlation
graphs look quite different in terms of the order of the curves and their correlation
coefficients (Figure 5-12). As mentioned in the results section, several curve
displacements and overlappings can be seen in both AlamarBlue® groups while curves
in both Resazurin groups are more regular, with less overlapping/displacements.
Correlation curves in Resazurin-PBS group look even more attenuable. Instructions
from different companies generally recommend 2 to 4 hours of cell-dye incubation. Our
results also show the lowest correlation coefficients for the 1st hour of incubation
(0.62≤R2≤0.83) among all groups except for the Resazurin-PBS group (R
2=0.95).
Although the correlations between % reduction in Resazurin diluted in PBS and cell
concentrations at different incubation time points were high-R2 linear, the nomogram
was modified, summarized and focused on the first 5 hours of incubation as most
researchers prefer shorter incubation times.
Page 109
120
All in all, Resazurin-PBS shows the best graph in terms of order, accuracy, and
correlation coefficients. Our findings suggest the Resazurin-PBS reduction nomogram
as the practical choice tool for determination of primary HDF cell number in monolayer
cultures. HDF cell number can easily be determined with a high accuracy by having the
% reduction of Resazurin at any incubation time between 1 to 5 hours using the
suggested nomogram.
5.3.3 DNA standard Curve
The micro-plate readers are designed to present the data from serial dilutions of
standard DNA in the form of a scatter graph plotting the relative fluorescence units
against DNA concentration. In a short range between 1-50 µg/ml of DNA the regression
line is linear with a high correlation coefficient. An R2≥0.95 is usually acceptable
(Figure 5-14).
Figure 5-14: Plotting the relative fluorescence units (RFU) against the DNA concentration (µg/ml)
yields a linear regression with high R2 value. This line is used as the DNA standard curve for
quantification of DNA containing cell extracts.
Page 110
121
5.3.4 HDF Cell Doubling Time
Figure 5-6 depicts the daily serial inverted microscopic images of HDF cells seeded at a
density of 3x10³ cells/cm
2 on tissue culture polystyrene. As it can be seen in Figure 5-
15(A) HDF cells show a lag period of 2-3 days after seeding. The logarithmic phase
starts at the 3rd
day and continues until 7-8th
day.
Figure 5-15: Growth curves of HDF cells at P5 within 12 days culture based on A) cell count, B)
DNA quantification, and C) percentage reduction in Resazurin. The lag, logarithmic and stationary
phases are seen in graph A.
5.3.5 Tri-lineage differentiation
The adipogenic differentiation medium tends to induce stem cells to produce lipid
vacuoles while having no effects on non-stem cells. Oil-Red-O staining of HDF cells
fed with Adipogenic differentiation induction medium for two weeks showed few
lipidification signs in HDF cells at passage 2 due to cell contamination with fat cells at
low passages while no signs of lipidification in HDF cells at Passage 6. Human bone
Page 111
122
marrow stem cells (HBMSCs) as the positive control cells showed lipid vacuoles after
staining (Figure 5-16).
Figure 5-16: Inverted microscope images of A) HBMSCs at P8, B) HDFs at P2, and C) HDFs at P6,
all treated with adipogenic differentiation induction medium for two weeks and after Oil-Red-O
staining showing the abundant lipid vacuoles in HBMSCs (A), rare vacuoles in HDF cells at low
passage No. (B), and no evidence of lipid droplets in HDFs at passage 6 (C).
Alizarin red staining of HDF cells at P2 and P6 and HBMSCs at P8 treated with
osteogenic differentiation induction medium for two weeks shows vast calcification
signs in HBMSCs and few in HDF cells at P2 while no signs of ossification are seen in
HDFs at P6 (Figure 5-17).
Figure 5-17: Alizarin-Red staining for Osteogenic differentiation shows numerous calcification
signs in HBMSCs (A) and rare ossification signs in HDF cells at P2 (B), but no evidence of
osteogenic differentiation in DHFs at P6 (C).
Chondrogenic differentiation medium also failed to induce HDF cells to go through
chondrogenesis. Figure 5-18 depicts Safranin-O stained HBMSCs (A) and HDF cells
(B) both treated with chondrogenic differentiation induction medium for three weeks.
Page 112
123
While HBMSCs show chondrogenic differentiation, no changes are seen in HDF cells
toward chondrogenesis (Figure 5-18).
Figure 5-18: Safranin-O staining of A) HBMSCs at P8 treated with chondrogenic differentiation
induction medium for 3 weeks, and B) HDF cells at P6 with the same treatment.
The results of the tri-lineage differentiation test show that although HDF cells at low
passages may show some weak evidences of lineage differentiation, which is due to the
contamination with other cells, at higher proper passages they get more and more
purified and do not show any evidence of lineage differentiation.
5.3.6 Immunostaining
5.3.6.1 FlowCytometry
Flowcytometry graphs of HDF cells at passage 6 show a single cell population stained
for CD90 as the fibroblast-specific marker. Non-stained cells were used as negative
control, taking place in the 3rd quarter indicating that cells did not show any signal for
CD90 marker (Figure 5-19-A). Cells positive for CD90 only were located in the Q4
quarter (Figure 5-19-B). Figure 5-19-C also shows the histogram of cells stained with
mouse monoclonal antibody to CD90. The X-axis of the histogram represents the signal
value in channel numbers, while the Y-axis shows the number of events per channel
number. Signals with identical intensities accumulate in the same channel. Therefore,
Page 113
124
this histogram shows that the majority of events accumulated in the Cy5 channel and
were positive for CD90.
Figure 5-19: Flowcytometry scatter plots of HDF cells at P6 stained with Cy5 for CD90. A)
unstained HDF cells as control were placed in 3rd
quarter, B) pure population of Cy5 stained HDFs
for CD90 as the fibroblast-specific marker, C) Histogram of Cy5 as a single parameter. X axis
represents the intensity of the signal in channel numbers while Y axis shows the quantity of the
events per channel number.
Page 114
125
5.3.7 Gene expression
Results of gene expression profile of HDF cells are shown in Figure 5-20. The THY1
gene, which is contains information for production of fibroblast specific antigen (FSA)
was expressed twice much in HDF cells at P5 compared to HBMSCs (P8) and HADSCs
(P0). The S100A4 gene encoding the data for fibroblast-specific protein 1 showed the
same expression value in HBMSCs as in HDF cells but a much lower expression in
HADSCs.
Desmin expression in fibroblasts was much higher than HBMSCs, but almost the same
in HADSCs.
All four stemness markers (REX1, SOX2, NANOG, and OCT4) showed much higher
expression values in both HBMSCs and HADSCs compared to HDF cells.
Figure 5-20: Relative quantification of expression of fibroblast-specific marker and stemness genes
in primary human dermal fibroblasts (HDF) at passage 5. Human bone marrow stem cells
(HBMSC) at P8 and human adipose derived stem cells (HADSC) at P0 were used as controls.
GAPDH has been used as the housekeeping gene.
Page 115
126
Fibroblastic contamination in HADSCs used at P0 can be the reason for equal
expression of Desmin in these cells with HDFs. On the other hand the expression of
stemness genes in fibroblast populations is not supposed to be zero (Page et al., 2009).
5.4 Discussion
In this study we used the outgrowth technique for the isolation of HDF cell. Although
the outgrowth method might seem a slower method, and it yields a lower recovery of
cells compared to the enzymatic digestion methods, yet this provides the opportunity of
multiple reuses of the skin explants for cell isolation. As compared to the enzymatic
digestion method of cell isolation, the outgrowth method tends to isolate cells with a
higher motility. When cell motility is a concern, especially when the cells are meant to
be seeded on porous materials and the ability of cells to penetrate deep into the inner
layers of the scaffolds is a matter of importance, the outgrowth method is the technique
of choice for selecting the migrating cells (Rittié & Fisher, 2005). Moreover, even
though the first isolation from freshly cut skin might take 2-3 weeks, the same skin
pieces can be shifted to new culture dishes for the next course of isolation which will
yield cells much faster (within 3-7 days). This process can be repeated several times,
resulting in a high total cell yield.
HDF morphology was confirmed through the use of inverted phase, confocal and
scanning electron microscopes. Application of tri-lineage differentiation induction
media proved the purity of HDF cell populations at proper passage (≥ 5th
) and being free
from stem cells.
As an immunophenotyping test flowcytometry of HDF cells stained with Cy5 for CD90
(THY1) as a fibroblast-specific cell surface protein confirmed the identity of the HDF
cells.
Page 116
127
The gene expression profile of HDF cells was also compared with that of two types of
stem cells, which revealed that our HDF cell population is significantly different from
stem cells.
In conclusion, we managed to isolate a high motility pure population of human dermal
fibroblasts which is perfectly suitable for tissue engineering application.
Page 117
128
CHAPTER 6: CHONDROGENIC EFFECTS OF CMD SCAFFOLDS ON HDFs
6.1 Introduction
Cell-based therapies in cartilage tissue engineering take advantage of highly
interconnected porous scaffolds capable of providing enough surface area and space for
cell attachment, proliferation, nutrient and waste exchange as well as extracellular
matrix production and deposition. The material from which the scaffold is fabricated
plays a key role in chondroinduction. Various types of hydrogels, polymers, and
composites of different materials that can support cartilage matrix production have been
tried. (Hutmacher, 2000; Lu et al., 2001; Moradi et al., 2013; Moutos & Guilak, 2008).
It has been suggested that modified native extracellular matrix (ECM) may contain
bioactive factors that can contribute to cell growth, migration, and chondrogenic
differentiation(Badylak, 2002; Benders et al., 2013; Izadifar et al., 2012). Human (Q.
Yang, Peng, Guo, Huang, Zhang, Yao, et al., 2008) and porcine (Cheng et al., 2009)
articular cartilage ECM derived scaffolds have shown promising results with the use
ofhuman adipose derived adult stem cells and canine bone marrow stem cells
respectively, supporting the hypothesis that a scaffold derived absolutely from cartilage
ECM can induce chondrogenesis. The source from which the matrix is derived is a big
concern. Human sources cannot be practically reliable on a high throughput rout due to
lack of abundance. Porcine derived products also have limitations due to religious and
ethical considerations. Animal sources with high abundance but without ethical issues
can be the solutions of choice. Preserving the integrity of native cartilage ECM
components is a key factor in ensuring that the total capacity of bioactive factors
responsible for chondrogenesis. For cartilage tissue engineering purposes, the scaffold is
supposed to support the maintenance of chondrocytes or differentiation of other cells
with chondrogenic potential.
Page 118
129
In chapter 3 we presented the detailed process of fabrication, characterization and
optimization of bovine articular cartilage matrix derived porous scaffolds for cartilage
tissue engineering applications. We showed that UV and UVDHT treated 15% CMD
scaffolds possessed optimal geometry and architecture. In this chapter we present the
detailed methods of assessment for the chondrogenic effects of bovine articular cartilage
matrix derived porous scaffolds on human dermal fibroblast cells. To assess the
biocompatibility of the optimized CMD scaffolds HDF cell viability and proliferation
were qualitatively and quantitatively assessed through serial Resazurin reduction, DNA
quantification, and confocal laser scanning and field emission scanning electron
microscopy images. The chondroinductive potential of the CMD scaffolds was assessed
through serial relative quantification of the expression of the chondrogenic genes as
well as the production of sulphated glycosaminoglycans. Also, changes in scaffold size
and shape were quantified and the correlation between scaffold shrinkage and cell
proliferation and chondrogenic differentiation was described.
6.2 Materials and Methods
6.2.1 Cell Seeding
HDF cells at passage 4 were resuspended in Chondrogenic medium at a final density of
10 x106 ml
-1. The Chondrogenic medium consisted of DMEM-HG supplemented with
20% (v/v) FBS, 1% Penicillin-Streptomycin, 1% HEPES, 1% non-essential amino-
acids, 1% ITS+Premix, 50 µg/ml L-ascorbic acid, 40 µg/ml L-Proline, 10 nM
Dexamethasone, 10 nM TGF-β3 (Cheng et al., 2009; Cheng et al., 2011; Q. Yang, Peng,
Guo, Huang, Zhang, Yang, et al., 2008; Zheng et al., 2011). UV and UVDHT treated
CMD scaffolds (n=17 for each group at every time point) were pre-wetted with 50 μl of
chondrogenic medium and incubated in a 37°C humidified 5% CO2 incubator for 15
minutes. 50 μl of HDF cell suspension (5 x 10⁵
cells) was gently seeded on each
scaffold. The scaffolds were incubated in a 37°C humidified 5% CO2 incubator for 3
Page 119
130
hours, then topped up very gently with 1 ml of pre-warmed fresh chondrogenic medium.
Chondrogenic medium was changed every two days. Cell viability tests, scanning
electron microscopy for cell-matrix interaction study, and biochemical and molecular
analyses were performed at Day 2, 8, 15, 22, 29, 35, and 42 time points.
6.2.2 Cell Growth and Viability
Cell viability was determined using LIVE/DEAD®
Viability/ Cytotoxicity Kit
(Invitrogen, UK). 1 μl of Calcein AM (4mM in anhydrous DMSO) added to2.5 μl of
Ethidium homodimer (2mM in DMSO/H2O 1:4 (V/V) (Molecular probes® -
Lifetechnologies™
, USA) were diluted in 1 ml pre-warmed 37ºC PBS. At every weekly
time point one out of each seeded scaffold groups (UV and UVDHT) underwent
staining through incubation with 500 μl of the diluted dye solution at 37ºC, 5% CO2 for
45-60 mins prior to imaging.
Imaging was performed with green fluorescence at ex/em ~495 nm/~515 nm for live
cells and red fluorescence at ex/em ~495 nm/~635 nm for dead cells using a confocal
laser scanning microscope (Leica TCS SP5 II, Germany).
6.2.3 Cell Proliferation
Cell proliferation was assessed via the Resazurin reduction assay (Dienstknecht et al.,
2010; Voytik-Harbin et al., 1998; Yu et al., 2003). At days 2, 8, 15, 22, 29, 35, and 42
the seeded and non-seeded CMD scaffolds (n=16 for each group including the unseeded
control sample) were incubated (37°c, 5% CO2) with 1 ml of pre-warmed 10%
Resazurin in PBS for four hours. The absorbance was measured by a plate reader
(FLUOstar OPTIMA BMG LABTECH, Germany) at 570 nm and 595 nm. Percentage
reduction in Resazurin was calculated using the manufacturer defined formula (Gang et
al., 2004).
Page 120
131
6.2.4 Cell-scaffold Interaction Studies
The seeded scaffolds were preserved in 2.5% Glutaraldehyde and underwent
dehydration in a graded ethanol series (25%, 40%, 60%, 80%, 95% and 100%, each for
30 min), followed by freeze-drying overnight. The freeze-dried samples were then
coated with gold-palladium (Quorum, Q150R s) and scanned using a QuantaTM
250
FEG – FEI microscope for cell-scaffold interaction studies.
6.2.5 DNA Quantification
Scaffolds (n≥5) were subjected to Papain digestion as described elsewhere (Caroline D.
Hoemann, 2004; Moradi, Pramanik, Ataollahi, Abdul-Khalil, et al., 2014). Briefly,
scaffolds were digested by incubating in 1 ml of Papain digest buffer (0.01 M L-
cysteine, 0.01M Na2EDTA, and 0.125 mg/mL papain in 0.1M sodium phosphate buffer)
for overnight at 65°c with intermittent agitations. After precipitating the remaining
debris, the digest solution was analysed for DNA content using Hoechst 33258 dye(0.1
µl.ml-1
in TEN buffer) with calf thymus DNA(Sigma D1501) as standard. Plate reading
was performed at (ex/em ~355 nm/~460 nm) in a microplate reader (FLUOstar
OPTIMA BMG LABTECH, Germany).
6.2.6 Construct Shrinkage and Contraction
A separate 48 well plate with seeded and non-seeded UV and UVDHT treated scaffolds
(n=7 for seeded and n=5 for non-seeded) was used for shrinkage test. Sterile plastic
discs with known constant diameter of 9 mm were used as the scales (Figure 6-1). All
scaffolds were treated with the same media exactly like the other plates. The media
were removed every other day for quantification of sulfated glycosaminoglycan (GAGs)
production using a 1,9-dimethylmethylene blue (DMMB) assay (Sigma, USA). Digital
images of top views of the plate were captured after discarding the medium and were
Page 121
132
analysed the by ImageJ® software for cross-sectional surface area changes. The plastic
discs were used for setting the scales in each picture in ImageJ®.
Figure 6-1: Scaffold shrinkage test after HDF cell seeding at different time points was tested by
measuring the cross-sectional surface area of the scaffolds. Plastic white discs with known constant
diameter were used for setting the scale in each picture.
Total shrinkage was calculated by dividing the cross-sectional surface area at each time
point to that of the original scaffold:
𝑇𝑜𝑡𝑎𝑙 𝑆ℎ𝑟𝑖𝑛𝑘𝑎𝑔𝑒 (%) = 100 − (𝑐𝑟𝑜𝑠𝑠 𝑠𝑒𝑐𝑡𝑖𝑜𝑛𝑎𝑙 𝑠𝑢𝑟𝑓𝑎𝑐𝑒 𝑎𝑟𝑒𝑎
𝑜𝑟𝑖𝑔𝑖𝑛𝑎𝑙 𝑐𝑟𝑜𝑠𝑠 𝑠𝑒𝑐𝑡𝑖𝑜𝑛𝑎𝑙 𝑠𝑢𝑟𝑓𝑎𝑐𝑒 𝑎𝑟𝑒𝑎∗ 100)
To determine the cell-mediated contraction (CMC) the contraction of seeded scaffolds
was minused from that of non-seeded controls (C. Lee et al., 2001; Schulz Torres, M
Freyman, Yannas, & Spector, 2000).
Page 122
133
𝐶𝑀𝐶 = (𝑜𝑟𝑖𝑔𝑖𝑛𝑎𝑙 𝑡𝑜𝑝 𝑠𝑢𝑟𝑓𝑎𝑐𝑒 𝑎𝑟𝑒𝑎 − 𝑡𝑜𝑝 𝑠𝑢𝑟𝑓𝑎𝑐𝑒 𝑎𝑟𝑒𝑎
𝑜𝑟𝑖𝑔𝑖𝑛𝑎𝑙 𝑡𝑜𝑝 𝑠𝑢𝑟𝑓𝑎𝑐𝑒 𝑎𝑟𝑒𝑎)
𝑆𝑒𝑒𝑑𝑒𝑑
− (𝑜𝑟𝑖𝑔𝑖𝑛𝑎𝑙 𝑡𝑜𝑝 𝑠𝑢𝑟𝑓𝑎𝑐𝑒 𝑎𝑟𝑒𝑎 − 𝑡𝑜𝑝 𝑠𝑢𝑟𝑓𝑎𝑐𝑒 𝑎𝑟𝑒𝑎
𝑜𝑟𝑖𝑔𝑖𝑛𝑎𝑙 𝑡𝑜𝑝 𝑠𝑢𝑟𝑓𝑎𝑐𝑒 𝑎𝑟𝑒𝑎)
𝑁𝑜𝑛−𝑠𝑒𝑒𝑑𝑒𝑑
6.2.7 GAGs Quantification
The sulfated glycosaminoglycan (GAGs) content in medium (n≥15) and the papain
digested samples (n≥5) was assessed using a Dimethyl-methylene blue (16mg.ml-1
)
assay with a chondroitin-4-sulfate standard as described elsewhere (Caroline D
Hoemann, 2004). Absorbance reading was performed at ex~595 nm in a miroplate
reader.
6.2.8 Gene Expression
6.2.8.1 RNA Isolation
RNA isolation from seeded scaffolds was done using Tri-Reagent® solution
(Lifetechnologies™
#AM9738) and according to the instructions from the
manufacturer(Biosystems, 2008). The scaffolds were gently washed with PBS and
transferred to 1.5 ml microcentrifuge labelled tubes. Mechanical shredding and
homogenization of the scaffolds were done using pestles in 1.5 ml micro-centrifuge
tubes. 500 ul Chloroform (Fisher # BP 1145-1) was added to each tube, vortex-mixed,
and incubated at room temperature for 15minutes, followed by centrifugation at 12000
RCF, 4°C, 15 min. The upper clear layer containing RNA (250 ul) was transferred to a
new tube and the two remaining lower layers containing DNA were frozen @ -80 in the
same tube for further DNA quantification through Hoechst assays. 500 ul Isopropanol
(Sigma # I9516) was added to the RNA and vortex mixed, and then incubated at room
temperature for 5minutes. Centrifugation was performed at 12000 RCF, 4°C, for 10
min. The supernatant was discarded. 1 ml of 75% Ethanol (prepared from absolute
Ethanol and Ultra-Pure distilled RNAse/DNAse-free water) was added to each RNA
Page 123
134
pellet, vortex-mixed, and incubated at room temperature for 5minutes. Centrifugation at
7500 RCF, 4°C, for 5 min was followed by removal of supernatant Ethanol. The RNA
pellet was re-suspended in 20 ul Ultra-Pure distilled RNAse/DNAse-free water
(Invitrogen # 10977), vortex-mixed and subjected to RNA quantification using the
Nanodrop ND2000 (Thermo Scientific).
6.2.8.2 cDNA Synthesis
cDNA synthesis was done using the High-Capacity RNA-to-cDNA™
Kit (Applied
Biosystems # 4387406). Up to 2000 ng of RNA from each sample plus Ultra-Pure
distilled RNAse/DNAse-free water, collectively to a total volume of 9 μl was
transferred to a 0.2 ml PCR tube, and topped up with 10 µl of 2X RT Buffer Mix
(includes dNTPs, random octamers, and oligo dT-16) and finally 1 μl of 20X Enzyme
mix (MuLV and RNase inhibitor protein). RT- PCR was performed using a MyGene
Series Peltier Thermal Cycler Model MG96G.
6.2.8.3 TaqMan® Gene Assays
Collagen, type 1, alpha 1, provides genetic information for the construction of the type 1
collage macromolecule that is the most abundant form of collagen in the human body
and acts as the supporting and strengthening of tissues like bone, tendon, cartilage and
skin. Molecular location of this gene is on the long arm of chromosome 17(National
Library of Medicine, 2014b).
Triple-stranded rope-like procollagen macromolecules are composed of two pro-alpha
1(I) and one pro-alpha 2(II) (encoded by COL1A2 gene) chains that twist together.
Processed procollagens make mature collagen molecules which auto-arrange and form
long thin collagen fibrils. Cross-linkage of these thin fibrils results in formation of
extracellular strong collagen I fibrils(National Library of Medicine, 2014c).
Page 124
135
Located on chromosome 12, “collagen, Type 2, alpha 1” gene, also known as COL2A1
is responsible for encoding the production of pro-alpha 1(II) chain, a subcomponent of
collagen type II which is primarily found in cartilage tissue. It is also found in the
vitreous (eyeball gel), the inner ear and the nucleus pulposus (the central part of the
inter-vertebrate disc).Mutations in COL2A1 gene have been shown to cause defective
collage type II and end up with several disorders(National Library of Medicine, 2014d).
Aggrecan, the most abundant proteoglycan in the cartilage, is a protein with several
adjunct sugar molecules. Attaching to the other components of cartilage, Aggrecan
organizes and reinforces molecular network within the cartilage. The gel-like structure
of cartilage comes from the water molecules attached to the sugar part of Aggrecan. The
gene that contains the information for production of Aggrecan in called ACAN, a
member of PG family of genes(National Library of Medicine, 2014a).
Proteoglycan 4 is a large protein synthesised specifically by the superficial
chondrocytes of the articular cartilage acting as a boundary lubricant at the cartilage
surface. The protein is encoded by PRG4 gene located on the long arm of chromosome
1(National Library of Medicine, 2014e).
SOX9 is the official symbol for SRY (sex determining region Y)-box 9 gene which
provides instructions for production ofSOX9 protein that plays a critical role in
development of the skeleton and reproductive system during the embryonic term. The
protein acts as a transcription factor binding to specific regions of DNA and regulating
the activity of other genes. It acts as a transcription factor for the HMG (high mobility
group) domain expressed in cartilage cells. SOX9 gene is expressed in cartilage
coincidentally with COL2A1 gene(Bell et al., 1997). SOX9 protein binds to and
activates the essential chondrocyte-specific enhancer sequences in non-chondrocytic
cells(Veronique Lefebvre, Huang, Harley, Goodfellow, & de Crombrugghe, 1997; Ng et
Page 125
136
al., 1997; Wright et al., 1995; Zhao, Eberspaecher, Lefebvre, & de Crombrugghe,
1997).
Cartilage oligomeric matrix protein encoded by COMP gene on chromosome 19 is one
of the calcium-binding proteins found in the ECM spaces surrounding chondrocytes. It
has been shown that COMP enhances matrix assembly during chondrogenesis of human
mesenchymal stem cells (Haleem‐Smith, Calderon, Song, Tuan, & Chen, 2012; Kipnes
et al., 2003).
Page 126
137
Table 6-1: TaqMan® Assay Probes Used in QPCR.
Gene name Abbrev. Transcript
Variant
NCBI Ref. Seq. Assay No.
Collagen I Col1A1 NM_000088.3 Hs00164004_m1
Col1A2 NM_000089.3 Hs00164099_m1
Collagen II Col2A1 1 NM_001844.4 Hs00264051_m1
2 NM_033150.2
Cartilage
Oligomeric Matrix
Protein
COMP NM_000095.2 Hs00164359_m1
Sex Determining
Region Y-Box 9
SOX9 NM_000346.3 Hs01001343_g1
Aggrecan ACAN 1 NM_001135.3 Hs00153936_m1
2 NM_013227.3
Proteoglycan 4 PRG4 A NM_005807.3 Hs00981633_m1
B NM_001127708.1
C NM_001127709.1
D NM_001127710.1
Glyceraldehyde 6-
Phosphate
Dehydrogenase
GAPDH 1 NM_002046.4 Hs02758991_g1
2 NM_001256799.1
6.2.9 Gene Expression
To assess the quantitative expression of each of the genes listed in table 1, triplicates of
1 µl of cDNA sample were transferred to a 96 well PCR plate (MicroAmp®
InduraPlate™, Applied Biosystems®), topped up with 10 µl of TaqMan® master mix, 8
µl of Nuclease-free water, and 1 µl of the target/housekeeping gene (TaqMan® Assay).
Page 127
138
The plate was sealed with adhesive film (MicroAmp®, Applied Biosystems®). QPCR
was performed using a StepOnePlus™ Real-Time PCR System - Life Technologies.
Relative quantification (RQ) of expressed genes was calculated from threshold cycle
(Ct) values using the following formula:
𝑅𝑄 = 2−(∆𝐶𝑡𝑇𝑎𝑟𝑔𝑒𝑡 − ∆𝐶𝑡𝑅𝑒𝑓𝑒𝑟𝑒𝑛𝑐𝑒)
Where:
∆𝐶𝑡𝑇𝑎𝑟𝑔𝑒𝑡 = 𝐶𝑡𝑇𝑎𝑟𝑔𝑒𝑡𝑇𝑎𝑟𝑔𝑒𝑡 𝐺𝑒𝑛𝑒− 𝐶𝑡𝑇𝑎𝑟𝑔𝑒𝑡𝐻𝑜𝑢𝑠𝑒𝑘𝑒𝑒𝑝𝑖𝑛𝑔 𝐺𝑒𝑛𝑒
And:
∆𝐶𝑡𝑅𝑒𝑓𝑒𝑟𝑒𝑛𝑐𝑒 = 𝐶𝑡𝑅𝑒𝑓𝑒𝑟𝑒𝑛𝑐𝑒𝑇𝑎𝑟𝑔𝑒𝑡 𝐺𝑒𝑛𝑒− 𝐶𝑡𝑅𝑒𝑓𝑒𝑟𝑒𝑛𝑐𝑒𝐻𝑜𝑢𝑠𝑒𝑘𝑒𝑒𝑝𝑖𝑛𝑔 𝐺𝑒𝑛𝑒
6.2.10 FESEM
The same samples used for confocal laser scanning microscopy were preserved after the
scanning session in 2.5% Glutaraldehyde and underwent dehydration process in graded
ethanol series (25%, 40%, 60%, 80% and 100%, each for 30 min), followed by freeze-
drying. The dry samples were then coated with gold-palladium (Quorum, Q150R s) and
scanned using a QuantaTM
250 FEG – FEI microscope for cell-scaffold interaction
studies.
6.3 Results
6.3.1 Resazurin Reduction
Figure 6-2 depicts the results of percentage reduction in Resazurin absorption in HDF
seeded UV and UVDHT treated CMD scaffolds. A steep increase was seen in Resazurin
reduction in UV treated scaffolds during the first three weeks after cell seeding,
Page 128
139
indicating of cell proliferation within the porous spaces of the scaffolds. This rapid rise
was followed by a mild drop and the subsequent monotonic plateau resulting from the
retardation in cell growth due to lack of space and cell-cell contact inhibition.
Figure 6-2: Percentage reduction in Resazurin absorption in HDF seeded UV and UVDHT treated
CMD scaffolds at different weekly time-points.
Significant increases in Resazurin reduction (P<0.05) in UV group during the first three
weeks of culture was indicating the cell proliferation which was followed by a drop in
the fourth week followed by an almost constant trend up to the 6th
week. Resazurin
reduction showed a milder steep during the first three weeks but the same steady trend
during the rest of time points.
6.3.2 Confocal laser scanning microscopy (CLSM)
Serial CLSM graphs of HDF cells seeded on both groups of CMD scaffolds clearly
illustrated the cell attachment and progressive proliferation and infiltration of the
growing cells into and filling the pores of the porous scaffolds. Although cells seeded
on UVDHT scaffolds showed a slower growth during the first 2 weeks, they reached the
Page 129
140
same confluent state at third week as those seeded on UV treated CMD scaffolds. Both
groups keep showing the same constant dense features in confocal images after the third
week of culture. Cell morphology in both groups remained fibroblastic during the
culture period (Figure 6-3&4).
Page 130
141
Figure 6-3: Confocal laser scanning micrographs of HDF cells seeded on UV and UVDHT treated
CMD scaffolds at different weekly time points. All images have been captured after staining with
LIVE/DEAD® Viability/Cytotoxicity Kit (green for Calcein and red for Ethidium homodimer).
(The scale bars in main and inset images represent for 200µm and 50 µm respectively).
Page 131
142
Figure 6-4: Continued form Figure 6-3.
6.3.3 DNA Quantification
DNA quantification of papain digested scaffolds shows a sharp upward trend in the
DNA content during the first three weeks after culture indicating an increasing
proliferation of cells on both UV and UVDHT treated CMD scaffolds. The steep slope
collapses after the third week to a mild decreasing trend. Shrinkage and contraction of
the scaffolds diminishes the growth area and attenuates the cell proliferation.
Page 132
143
Figure 6-5: Total DNA by Hoechst method in papain digested cell seeded UV and UVDHT treated
CMD scaffolds (n=5 for each group) at different weekly time-points after subtraction of average
DNA in unseeded (blank) samples.
A two-way between-groups analysis of variances was conducted to determine the
differences in Total DNA concentration between the two groups (cell seeded UV and
UVDHT treated CMD scaffolds) at different time points. The significance value for
Levene's test of homogeneity of variances was 0.066 (greater than 0.05), indicating that
the assumption of homogeneity of variance has not been violated.
Post-hoc comparisons using the Tukey HSD test indicated that although the DNA
content was not significantly higher at Day8 compared to Day2, however, a significant
increase in the DNA content happened at the 2nd and 3rd
weeks of culture, which was
followed by a drop at the 4th
week which remained constant until the Day42 with
another significant decrease. No significant difference was seen in the DNA content
between the UV and UVDHT groups at different time points (P≥0.05).
6.3.4 FESEM
Serial FESEM micrographs of HDF seeded UV and UVDHT treated CMD scaffolds at
weekly time points are shown in Figure 6-6&7. The first couple of images (A and A’)
Page 133
144
are representative for the unseeded UV and UVDHT treated scaffolds, showing the
wrinkled morphology of surfaces and filamentous structures of interconnected pores.
Cell attachment and proliferation on all over the surfaces and inside the pores of both
types of CMD scaffolds clearly shows the gradual growth and spreading of the cells,
progressively filling all the spaces and covering the surfaces, resulting in entirely
consistent cell-coated surfaces all over the constructs at Day22. FESEM images of the
samples at any time point after Day22 show surfaces covered with intertwined visually
inseparable cells.
Page 134
145
Figure 6-6: FESEMmicrographs of unseeded (A&A’) and cell seeded UV and UVDHT treated
CMD scaffolds at weekly time points fromDay 2 (B&B’) to Day 42 (H&H’). The scale-bar for
image A is 100 µm while for the rest of the images they represent for 50 µm.
Page 135
146
Figure 6-7: Continued for Figure 6-6.
Page 136
147
6.3.5 Scaffold Shrinkage/Contraction
Serial digital top images of representative scaffolds captured at weekly time points are
shown in Figure 6-8. Decreases in the size of scaffolds, especially the seeded ones are
clearly visible. Surface area measurements using ImageJ® was applied to conduct a
quantitative study.
Figure 6-8: Serial digital images of top view of representative blank (unseeded) and HDF seeded
UV and UVDHT treated CMD scaffolds at seeding time and consecutive weekly time points. The
white circular plastic discs were used as the constant fixed-dimension scales.
Figure 6-10 shows the average cross-sectional (top) surface area of dry, unseeded and
seeded wet UV and UVDHT treated 15% CMD scaffolds (n=7 for seeded and n=5 for
Page 137
148
unseeded scaffolds) at seeding time and different weekly time points. All wetted
scaffolds either with cell suspension or equivalent volume of culture medium showed a
slight non-significant (P>0.05) increase in the cross-sectional surface area immediately
after wetting, which is expected due to the spongy nature of the scaffolds and the
surface tension of the medium as demonstrated in Figure 6-9.
Figure 6-9: Effect of wetting on the dimensions of porous spongy scaffolds.
A two-way (between-groups) analysis of variances was conducted to determine the
differences in cross-sectional surface area between the four groups (Seeded and
Unseeded UV and UVDHT treated 15% CMD scaffolds) at different time points. Post-
hoc comparisons using the Tukey HSD test was used to find the differences between the
different groups at different time points. A value of P≥0.05 was assumed as non-
significant.
As the cells attached on the surfaces and inside the pores of the scaffolds, shrinkage
started and the top surface area showed a rapid fall during the first three weeks
concurrently with increasing proliferation of the cells as previously shown and
confirmed in Resazurin reduction, DNA content, confocal laser microscopy and FESEM
images. However, the sharp decrease in the surface area got tapered down after Day22
of culture. Even unseeded scaffolds showed a downward trend of surface area, which
slowed down and showed a mild slope after the Day8. This suggests that not all the
shrinkage is cell induced and at least part of scaffold shrinkage results from scaffold
contraction and degradation processes. Although the difference in cross-sectional
Page 138
149
surface area of cell seeded UV and UVDHT treated 15% CMD scaffolds is not
significant at different time points (P>0.05), however the significant difference between
Unseeded UV and UVDHT treated 15% CMD scaffolds started from Day22 and
onwards, showing a significantly bigger drop in the cross-sectional surface area of
Unseeded UVDHT scaffolds compared to Unseeded UV treated scaffolds, reconfirming
the higher stiffness of UV treated scaffolds. Although 15% UV and UVDHT treated
CMD scaffolds have been shown to possess higher cross-linking among other CMD
scaffolds, apart from the degradation effect, cell mediated contraction of the scaffolds is
still shrinking the scaffolds in a significant scale.
Figure 6-10: Measurements of cross-sectional surface area (top view) of the seeded and unseeded
UV and UVDHT treated 15% CMD scaffolds (n=7 for seeded and n=5 for unseeded scaffolds.
Significant and non-significant differences are shownby(*:P<0.05)and(†:P>0.0).
Results of total shrinkage (%) and cell-mediated contraction (%) at different weekly
time points are shown in Figure 6-11. A two-way between-groups analysis of variances
was conducted to determine the differences in percentage shrinkage between the UV
Page 139
150
and UVDHT treated 15% CMD scaffolds at different time points. Post-hoc comparisons
using the Tukey HSD test was used to find the differences between the two groups at
different time points. A value of P≥0.05 was assumed as non-significant.
As it can be clearly seen HDF seeded UV treated CMD constructs show a sharp
decrease in the size during the first three weeks after seeding but then reach a steady
state with a gentle increase in shrinkage and contraction during the next four weeks.
UVDHT treated CMD scaffolds continue their sharp rise in shrinkage until the fourth
week of seeding and while cell-mediated contraction has a considerably weaker effect
on UVDHT treated scaffolds they exert the same degree of total shrinkage in the size as
UV treated scaffolds.
Also, having considered the equal porosity among both group of scaffolds, although cell
mediated contraction (CMC) in UV group is significantly higher due to a higher rate of
cell proliferation compared to the UVDHT group in almost all time points, there is no
significant difference in total shrinkage between the UV and UVDHT groups. The
higher CMC in UV group is contemporaneous and legitimizable with the higher cell
growth and proliferation in UV group shown in Resazurin reduction test results. The
bigger CMC in UV group due to higher cell proliferation has been compensated by the
higher stiffness, resulting in a total shrinkage rate similar to the UVDHT group with a
proportionally lower cell proliferation as well as lower stiffness.
Page 140
151
Figure 6-11: Percentage of total shrinkage in HDF seeded UV and UVDHT treated CMD scaffolds
(n=7 for seeded scaffolds and n=5 for unseeded scaffolds) at different weekly time-points. Part of
this shrinkage is due to cell mediated contraction (CMC). Asterix stands for P<0.05.
6.4 Chondrogenic Differentiation
6.4.1 GAGs Content
Attempts to measure GAGs through DMMB method failed to show any GAGs in the
medium up to Day42. This means that no significant amounts of GAGs either released
from the scaffolds as a result of biodegradation or from the HDF cells seeded on the
CMD scaffolds as their extracellular matrix production could be detected by DMMB
method.
Unlike the medium, Papain digested constructs at different weekly time points showed a
good trend of GAGs accumulation within the cells. Figure 6-12 displays the GAGs
content of papain digested cell seeded UV and UVDHT scaffolds after subtraction of
average GAGs content in papain-digested unseeded samples (blanks). A peak in GAGs
production in both groups is achieved within two weeks after cell seeding, followed by
Page 141
152
a reduction in the third week and then a plateau, but always higher compared to the
Day2.
Figure 6-12: Sulfated Glycosaminoglycan content in cell seeded UV and UVDHT treated CMD
scaffolds (n=5 in each group) at different weekly time points after subtraction of the average GAGs
in unseeded samples, measured through DMMB method.
When the GAGs production is plotted against shrinkage rate (Figure 6-13), the effect of
available surface area and space for the cells to grow and deposit ECM molecules like
GAGs is revealed more clearer. These results clearly demonstrate the HDF cells
tendency to produce GAGs when they are seeded on CMD scaffolds, however, GAGs
production slowed down coincidentally with the scaffold shrinkage. This trend suggests
that scaffold shrinkage and contraction is a potential cause of the reduction in GAGs
production. As demonstrated previously(Buckley et al., 2009; C‐Y Charles Huang, Paul
M Reuben, Gianluca D'Ippolito, Paul C Schiller, & Herman S Cheung, 2004; R. Mauck,
C. Wang, E. Oswald, G. Ateshian, & C. Hung, 2003b), increasing the proportional cell
density favors chondrogenesis in terms of cartilage matrix production, but at a certain
critical point when cells lack physical space, their growth and ECM producibility
diminishes.
Page 142
153
Figure 6-13: Correlation between sulfated glycosaminoglycan production and shrinkage rate in
cells seeded on UV and UVDHT treated 15% CMD scaffolds.
A similar correlation exists between the DNA content and the shrinkage rate of cell
seeded UV and UVDHT treated CMD constructs (Figure 6-14), reconfirming the effect
of scaffold shrinkage on proliferation pattern of cells seeded on these porous scaffolds.
6-14: Correlation between total DNA and shrinkage rate in HDF-seeded UV and UVDHT treated
15% CMD scaffolds.
Page 143
154
6.4.2 QPCR
Although an initial down regulation of COL1A1 gene was seen in Day 2 compared to
the negative control HDF cells, the overall trend was increasing in both UV and
UVDHT groups during the culture period with a significant higher expression (P<0.05)
in UV group and up to 3-4 folds compared to the negative control. (Figure 6-15, A).
COL1A2 gene showed an upward trend in both UV and UVDHT groups during the first
3 weeks of culture, followed by a drop and the consequent plateau in both groups during
the rest of the culture period (Figure 6-15, B). The expression of Col1A2 was
significantly higher (P<0.05) in UVDHT group in all time points (P<0.05).
COL2A1 as the cartilage specific gene clearly showed two phases of expression: an
almost constant expression with even some mild down regulation during the first 2-3
weeks, followed by the second phase with a sharp upregulation in both groups, with a
significantly higher trend in UVDHT group (P<0.05). An overall increase up to over
three and four folds in expression of COL2A1 was seen during the 7 weeks of culture in
both UV and UVDHT groups (Figure 6-15, C).
The expression of ACAN, the gene encoding the cartilage proteoglycan molecule,
Aggrecan, clearly showed a drastically increasing trend in both groups with a
significantly higher trend in UVDHT group compared to the negative control (Figure 6-
15, D).
SOX9, the gene containing the data for production of the transcription factor for the
high mobility group domain expressed in cartilage cells, and COMP gene which is in
charge of matrix assembly enhancement during chondrogenesis, both showed sharp
upward steeps during the first three weeks of culture, followed by a sharp drop in SOX9
to a level even lower that negative control, while an almost steady state for COMP but
still much higher than the negative control (Figure 6-15, E and F).
Page 144
155
Figure 6-15: Quantitative gene expression of COL1A1 in HDFs seeded on UV and UVDHT treated
CMD scaffolds (n=7 in each group) at weekly time points. The data have been normalized to
GAPDH. HDF cells were used as Ctrl- .
6.4.2.1 Scaffold Shrinkage/Contraction
Serial digital top images of representative scaffolds captured at weekly time points are
shown in Figure 6-16, A. Decreases in the scaffold sizes during the time, especially in
the seeded ones are clearly visible. Surface area measurements using ImageJ® was
applied to conduct a quantitative study.
Page 145
156
Figure 6-16: A) Serial digital images of top view of representative blank (unseeded) and HDF
seeded UV and UVDHT treated CMD scaffolds at seeding time and consecutive weekly time points.
The white circular plastic discs were used as the constant fixed-dimension scales.
B) Measurements of cross-sectional surface area (top view) of the seeded and unseeded UV and
UVDHT treated CMD scaffolds (n=7 for seeded and n=5 for unseeded scaffolds). Significant and
non-significantdifferencesareshownby(*:P<0.05)and(†:P>0.0).
C) The initial effect of wetting on the dimensions of porous spongy scaffolds.
D) Percentage of total shrinkage in HDF seeded UV and UVDHT treated CMD scaffolds (n=7 for
seeded scaffolds and n=5 for unseeded scaffolds) at different weekly time-points. Part of this
shrinkage is due to cell mediated contraction (CMC). Asterix stands for P<0.05.
Page 146
157
Figure 6-16, B shows the average cross-sectional (top) surface area of dry, unseeded
and seeded wet UV and UVDHT treated 15% CMD scaffolds (n=7 for seeded and n=5
for unseeded scaffolds) at seeding time and sequential weekly time points. Wetted
scaffolds, either with cell suspension or equivalent volume of culture medium, showed a
non-significant (P>0.05) increase in the cross-sectional surface area immediately after
wetting. This may be due to the hydrophilic spongy nature of the scaffolds and the
surface tension of the medium compressing the scaffold, resulting in a light decrease in
the height and a simultaneous slight increase in the top surface area as demonstrated in
Figure 6-16, C.
As the cells attached on the surfaces and inside the pores of the scaffolds, shrinkage
increased and the top surface area showed a rapid fall during the first three weeks
concurrently with increasing proliferation of the cells as previously shown and
confirmed in DNA content, confocal laser microscopy and FESEM images. However
the sharp decrease in the surface area got tapered down after Day22 of culture.
Unseeded scaffolds showed a downward trend of surface area during the first week of
immersion in the culture medium, which slowed down and showed a mild slope after
Day8. This suggests that not all the shrinkage is cell induced and at least part of scaffold
shrinkage results from scaffold contraction and degradation processes. Although the
difference between the cross-sectional surface area of seeded UV and UVDHT scaffolds
was not significant at different time points (P>0.05), however a significant difference
between Unseeded UV and UVDHT scaffolds started from Day22 and onwards,
showing a significantly bigger drop in the cross-sectional surface area of Unseeded
UVDHT scaffolds compared to Unseeded UV treated scaffolds, reconfirming the higher
stiffness of UV treated scaffolds. Although 15% UV and UVDHT treated CMD
scaffolds have been shown to possess higher cross-linking among other CMD scaffolds
Page 147
158
(Moradi, Pramanik, Ataollahi, Abdul-Khalil, et al., 2014), cell mediated contraction of
the scaffolds is still shrinking the scaffolds in a significant scale.
Results of total shrinkage (%) and cell-mediated contraction (%) at different weekly
time points are shown in Figure 6-16, D. As it can be clearly seen HDF seeded UV
treated CMD constructs show a sharp decrease in the size during the first three weeks
after seeding but then reach a steady state with a gentle increase in shrinkage and
contraction during the next four weeks. UVDHT treated CMD scaffolds continue their
sharp rise in shrinkage until the fourth week of seeding. While cell-mediated contraction
has a considerably weaker effect on UVDHT treated scaffolds they exert the same
degree of total shrinkage in the size as UV treated scaffolds.
Also, having considered the equal porosity among both groups of scaffolds, there was
no significant difference in total shrinkage between the UV and UVDHT groups.
6.4.2.2 The correlation between the Shrinkage, Cell Proliferation and
Chondrogenesis
The correlation between COL2A1 and ACAN gene expression and the DNA content
(Figure 6-17, A&B) clearly showed two distinct phases of gene expression during the
42 days of cell culture. The first phase was determined by an increase in the DNA
content with a plateau state of COL2A1 and ACAN genes expression within the first 2-
3 weeks of culture. The second phase was defined by a cessation in the DNA content
and a simultaneous increase in the expression of COL2A1 and ACAN genes. The
asynchronicity of cell proliferation with differentiation has already been addressed in
other works (Strehl, Schumacher, de Vries, & Minuth, 2002; Topisirovic & Sonenberg,
2014). Also, chondrogenic differentiation has been shown to be dependent on high cell
density (Buckley et al., 2009; C‐Y Charles Huang et al., 2004; Mauck et al., 2003b).
Page 148
159
During the first phase, cell proliferation provides the high density as a prerequisite for
the second phase of differentiation.
Plotting the DNA content as a function of cell proliferation against the shrinkage rate
also showed a biphasic trend indicating that as the cells proliferate progressively, they
contract and shrink the scaffolds accordingly until a certain critical point when a
scarcity in the surface area and space leaves no sufficient room for cell proliferation
(Figure 6-17, C). Beyond this critical point any further increases in the shrinkage was
contemporaneous with a slump in cell proliferation. This finding was in agreement with
the previous studies (C. Lee et al., 2001; Schulz Torres et al., 2000).
The correlation between GAGs production and the shrinkage rate is presented in Figure
6-17, D. The HDF cells clearly showed a tendency to produce GAGs when seeded on
CMD scaffolds. GAGs production was drowsed off coincidentally with the scaffold
shrinkage and contraction pattern. This trend suggests that scaffold shrinkage and
contraction is a potential cause of the reduction in GAGs production. As addressed in
other works increasing the proportional cell density favours chondrogenesis in terms of
cartilage matrix production, but at a certain critical point when the cells face lack of
enough space, their growth and ECM producibility diminishes (C‐Y Charles Huang et
al., 2004; Mauck et al., 2003a).
The correlation between the expression of COL2A1 and ACAN genes and the scaffold
shrinkage (Figure 6-17, E & F) reconfirmed the biphasic trend of cell proliferation-
differentiation and revealed that the cell proliferation phase and the increasing shrinkage
were concurrent with steady state of slow chondrogenic gene expression, but during the
second phase the fast increasing expression of COL2A1 and ACAN genes was
simultaneous with an invariant shrinkage.
Page 149
160
Figure 6-17: Correlation between A) COL2A1 and B) ACAN gene expression, and DNA content, C)
the DNA and D) GAGs content, and E) COL2A1 and F) ACAN expression all against shrinkage
rate.
6.5 Discussion
Chondrogenic potential of porcine(Cheng et al., 2009) and human(Q. Yang, Peng, Guo,
Huang, Zhang, Yao, et al., 2008) CMD constructs on various stem cells has been
previously investigated. It is also apparent, cell mediated contraction and shrinkage of
non-treated and structurally enhanced matrix derived scaffolds and their effects on
chondrogenesis have been studied in previous studies(Zaleskas et al., 2004). In this
chapter we discussed the methods of evaluating the chondrogenic potential of
structurally tailored and optimized bovine articular CMD porous scaffolds on cultured
Page 150
161
primary human dermal fibroblasts as semi-differentiated cells of mesenchymal origin.
The probability of cell mediated contraction and scaffold shrinkage in physically treated
CMD scaffolds and their effects on chondrogenic differentiation of HDF cells were also
investigated.
Serial measurements of DNA content and Resazurin reduction as well as imaging
techniques (CLSM and FESEM) demonstrated that physically treated bovine CMD
scaffolds are suitable biocompatible constructs for HDF cell attachment and
proliferation. This was a completely expected outcome as the main component of CMD
scaffolds is collagen which has been shown to be a perfect biomaterial for different
types of cells (Chevallay & Herbage, 2000; Julie Glowacki & Mizuno, 2008; Parenteau-
Bareil, Gauvin, & Berthod, 2010).
Chondrogenic potential of bovine CMD scaffolds was also studied through
quantification of their sulphated glycosaminoglycan content and also the expression of
chondrogenic genes at sequential time points. Our findings showed that primary human
dermal fibroblast cells are capable of GAGs production provided that they are placed in
a proper chondrogenic environment.
Upregulation of cartilage tissue specific genes like collagen type II, aggrecan, SOX9
and COMP confirmed the differentiation of dermal fibroblasts to chondrocytes under
proper chondrogenic 3D culture conditions. Some of the signalling mechanisms
involved in chondrogenesis have already been described. It has been reported that Sox9
is one of the earliest markers expressed in the mesenchymal condensations (Véronique
Lefebvre, Li, & de Crombrugghe, 1998).As a key transcription factor in
chondrogenesis, Sox9 is known for its role in activation of the expression of several
cartilage-specific genes, including Col2a1, ACAN and COMP (Taipaleenmäki,
Page 151
162
2010).During chondrogenesis, the expression of SOX-9 is up-regulated by TGF-β
signalling (Shanmugarajan, Kim, Lee, & Im, 2011).
We showed that scaffold shrinkage have inconsistent effects on cell chondrogenesis.
Our findings revealed two distinct phases during the 6-week culture period. The
simultaneous cell proliferations and scaffold shrinkage during the proliferation phase
speeds up and facilitates the cell condensation which has been reported to be critically
essential for chondrogenesis (Kavalkovich, 2000). This phase was synchronous with
sharp increases in SOX9 gene expression as a chondrogenesis enhancer (Ng et al., 1997;
Wright et al., 1995; Zhao et al., 1997). This suggests that the cell condensation at least
partly triggers the up-regulation of the SOX9 expression which in turn activates the
expression of COMP, COL2A1 and ACAN.
The second phase starts at the peak point of cell proliferation and scaffold shrinkage
with a suspension in cell proliferation, increases in expression of Col2A1 and ACAN
genes as major chondrogenic differentiation markers. The biphasic trend suggests the
presence of a critical state of cell density and cell-scaffold interaction in which the
chondrogenic mechanisms are triggered. This compulsory critical state was shown to
be achievable partially through scaffold shrinkage which has so far been thought to have
only limitative effects on chondrogenesis.
Although our previous results showed a higher degree of cross linkage and hence
improved mechanical properties in UV treated compared to UVDHT treated CMD
scaffolds, UVDHT group showed significantly higher levels of Col2A1 and ACAN
genes expression.
In conclusion, physically treated bovine articular cartilage matrix derived scaffolds are
capable of inducing chondrogenic differentiation in human dermal fibroblasts. Although
this chondroinductive effect can be traced back to SOX9 level, however the precise
Page 152
163
mechanism/s through which the cartilage matrix up-regulates SOX9 expression remain
to be explored in other studies.
Page 153
164
CHAPTER 7: DISCUSSION AND CONCLUSION
It has been shown that extracellular matrix derived scaffolds from different sources have
the potential to promote cartilage regeneration using tissue engineering applications.
The source of biomaterial, the method of fabrication and the efficacy of chondrogenic
differentiation have always been the main concerns related to engineering cartilage
tissue oriented matrix derived scaffolds. Apart from the abundance of the source and
ease of harvesting, the fabrication method has always been a major concern to retrieve
the maximal bioactive chondroinductive ingredients of CMD scaffolds. Moreover,
matrix derived scaffolds have poor mechanical properties and therefore, non-invasive
treatments are necessary to increase their cross-linking and enhance the physical and
structural properties of such scaffolds. The development of cartilage matrix derived
scaffolds that possess suitable mechanical properties and chondroinductive abilities
provide substantial advantage to the efforts of cartilage tissue engineering. Hence, the
studies in this thesis were conducted to assess the chondroinductive potential of
architecturally optimized CMD scaffolds.
The first aim of the current study was to fabricate optimized CMD scaffolds by
conducting a quantitative assessment of the changes in the architectural and the
mechanical properties of physically cross-linked CMD scaffolds. We have reported the
detailed processes of fabrication, physical treatment and methods of optimization of
CMD scaffolds with bovine origin(Moradi, Pramanik, Ataollahi, Abdul-Khalil, et al.,
2014). A simple, restorative and non-invasive method of freeze-drying was used to
fabricate scaffolds with different concentrations of CMD material. The scaffolds were
treated with one of the five conditions to create cross-linking (Non-treated, UV, DHT,
UVDHT, and DHTUV). In order to optimize the scaffold architecture, physical
characterization was performed using FTIR, TGA, DSC, FESEM, porosimetry,
mechanical tests and post-treatment shrinkage measurement.
Page 154
165
A simple, highly accurate and precise method was developed to measure the porosity of
highly porous ultra-light materials such as the CMD scaffolds in one of our
experiments. We demonstrated that at15% concentration of cartilage matrix material,
the fabrication of CMD porous scaffolds was optimal, beyond which the architecture of
the scaffolds can drastically change to become unfavourable. We also demonstrated that
UV and UVDHT treatment of 15% CMD scaffolds yielded optimized and properly
tailored scaffolds for cartilage tissue engineering applications.
The isolation, culture and characterization of primary human dermal fibroblast cells
were discussed in chapter five. The cells were later used to assess the chondroinductive
potential of UV and UVDHT treated 15% CMD scaffolds. Seeding the HDF cells on
UV and UVDHT treated 15% bovine CMD scaffolds demonstrated that the materials
were biocompatible constructs that allow HDF cells to attach, proliferate and produce
cartilage matrix proteins e.g. GAGs. In addition, this results in the triggering of the
mechanisms that upregulate the expression of cartilage specific genes including
collagen type II, Aggrecan, SOX9, and COMP.
Although UV and UVDHT treated 15% CMD scaffolds have demonstrated higher
mechanical properties, the3D culture of primary HDF cells on these scaffolds led to
substantial shrinkage, part of which was found to be due to cell mediated contractions.
Of interest was also the fact that we demonstrated a biphasic process of proliferation-
chondroinduction during the cell culture. The synchronous trend of cell proliferation
with the shrinkage of constructs clearly revealed that the cessation and subsequent drop
in cell proliferation was a consequence of the reduction in construct size. While scaffold
shrinkage has been reported to have inhibitory effects on chondrogenesis, our findings
revealed that it may have contradictory effects. The initial period of upward slope in cell
proliferation provided a high-density population of cells, resulting in a higher magnitude
of cell-mediated contraction of the scaffold. These augmented cell condensations
Page 155
166
appeared to have ambivalent effects on chondrogenesis: preventing the cells to deposit
more extracellular matrix due to the space scarcity, and simultaneous up-regulation of
SOX9 gene expression; resulting in an increased expression of COMP, COL2A1 and
ACAN as cartilage specific genes. Upregulation of SOX9 gene during the cell
condensation phase resulting in an increased expression of COL2A1 and ACAN genes
during the chondroinductive phase suggest that TGFβ signalling pathway might be
involved in the chondroinduction of HDF cells using CMD scaffolds.
In conclusion, the present thesis suggests that bovine articular CMD porous scaffolds
have the potential to induce chondrogenic differentiation in human dermal fibroblasts,
thus making it a potential biomaterial with likely future clinical applications. However,
the present thesis lacks study that identifies the precise underlying mechanisms of which
chondroinduction by CMD scaffolds was controlled. Hence, this remains to be studied
in future studies. Of note, although scaffold shrinkage has an opposite effect on the
chondrogenic properties of CMD scaffolds, improving the mechanical properties of
CMD scaffolds may minimize the shrinkage and increase matrix deposition. This too
will need to be looked at more deeply in future research undertakings.
Page 156
167
REFERENCES
Aichroth, P., Burwell, R., & Laurence, M. (1972). Transplantation of synovial joint
surfaces: An experimental study. J. Bone Joint Surg. 54B, 747.
Al-Nasiry, S., Geusens, N., Hanssens, M., Luyten, C., & Pijnenborg, R. (2007). The use
of Alamar Blue assay for quantitative analysis of viability, migration and
invasion of choriocarcinoma cells. Human reproduction, 22(5), 1304-1309. doi:
10.1093/humrep/dem011
Altman, D. G., & Bland, J. M. (1983). Measurement in medicine: the analysis of
method comparison studies. The statistician, 307-317. doi: 10.2307/2987937
Badylak, S. F. (2002). The extracellular matrix as a scaffold for tissue reconstruction.
Paper presented at the Seminars in Cell & Developmental Biology.
Bell, D. M., Leung, K. K., Wheatley, S. C., Ng, L. J., Zhou, S., Ling, K. W., . . . Cheah,
K. S. (1997). SOX9 directly regulates the type-II collagen gene. Nature
Genetics, 16(2), 174-178. doi: 10.1038/ng0697-174
Bellamkonda, R., Ranieri, J. P., Bouche, N., & Aebischer, P. (1995). Hydrogel‐based
three‐dimensional matrix for neural cells. Journal of Biomedical Materials
Research, 29(5), 663-671. doi: 10.1002/jbm.820290514
Bellincampi, L. D., & Dunn, M. G. (1997). Effect of crosslinking method on collagen
fiber-fibroblast interactions. Journal of Applied Polymer Science, 63(11), 1493-
1498. doi: 10.1002/(SICI)1097-4628(19970314)63:11<1493::AID-
APP11>3.0.CO;2-3
Benders, K. E., Weeren, P., Badylak, S. F., Saris, D. B., Dhert, W. J., & Malda, J.
(2013). Extracellular matrix scaffolds for cartilage and bone regeneration.
TRENDS in Biotechnology, 31(3), 169-176. doi: 10.1016/j.tibtech.2012.12.004 T
Bertoldi, S., Farè, S., & Tanzi, M. C. (2011). Assessment of scaffold porosity: the new
route of micro-CT. Journal of Applied Biomaterials & Biomechanics, 9(3). doi:
10.5301/JABB.2011.8863
Bhosale, A., & Richardson, J. (2008). Articular cartilage: structure, injuries and review
of management. British medical bulletin, 87(1), 77.
Biosystems, A. (2008). TRI Reagent® Solution. In A. Biosystems (Ed.): Ambion.
Bland, J. M., & Altman, D. G. (1986). Statistical methods for assessing agreement
between two methods of clinical measurement. The Lancet, 327(8476), 307-310.
doi: 10.1016/S0140-6736(86)90837-8
Bradham, R. R. (1960). The importance of porosity in vascular prostheses. The
American Journal of Surgery, 100(4), 557-560. doi: 10.1016/0002-
9610(60)90321-4
Bryant, S. J., & Anseth, K. S. (2002). Hydrogel properties influence ECM production
by chondrocytes photoencapsulated in poly (ethylene glycol) hydrogels. Journal
of Biomedical Materials Research, 59(1), 63-72. doi: 10.1002/jbm.1217
Page 157
168
Buckley, C. T., Thorpe, S. D., O'Brien, F. J., Robinson, A. J., & Kelly, D. J. (2009). The
effect of concentration, thermal history and cell seeding density on the initial
mechanical properties of agarose hydrogels. Journal of the Mechanical Behavior
of Biomedical Materials, 2(5), 512-521. doi: 10.1016/j.jmbbm.2008.12.007
Buckwalter, J., & Mankin, H. (1997). Instructional Course Lectures, The American
Academy of Orthopaedic Surgeons-Articular Cartilage. Part I: Tissue Design
and Chondrocyte-Matrix Interactions*{{dagger}}. The Journal of Bone and
Joint Surgery, 79(4), 600.
Calvo, J. I., Bottino, A., Capannelli, G., & Hernández, A. (2008). Pore size distribution
of ceramic UF membranes by liquid–liquid displacement porosimetry. Journal
of Membrane Science, 310(1), 531-538. doi: 10.1016/j.memsci.2007.11.035
Camacho, N. P., West, P., Torzilli, P. A., & Mendelsohn, R. (2001). FTIR microscopic
imaging of collagen and proteoglycan in bovine cartilage. Biopolymers, 62(1), 1-
8. doi: 10.1002/1097-0282(2001)62:1<1::AID-BIP10>3.0.CO;2-O
Charlebois, M., McKee, M. D., & Buschmann, M. D. (2004). Nonlinear tensile
properties of bovine articular cartilage and their variation with age and depth.
Journal of Biomechanical Engineering, 126(2), 129-137. doi:
10.1115/1.1688771
Charles Huang, C. Y., Reuben, P. M., D'Ippolito, G., Schiller, P. C., & Cheung, H. S.
(2004). Chondrogenesis of human bone marrow‐derived mesenchymal stem
cells in agarose culture. The Anatomical Record Part A: Discoveries in
Molecular, Cellular, and Evolutionary Biology, 278(1), 428-436. doi:
10.1002/ar.a.20010
Charles Huang, C. Y., Reuben, P. M., D'Ippolito, G., Schiller, P. C., & Cheung, H. S.
(2004). Chondrogenesis of human bone marrow derived mesenchymal stem cells
in agarose culture. The Anatomical Record Part A: Discoveries in Molecular,
Cellular, and Evolutionary Biology, 278(1), 428-436.
Charulatha, V., & Rajaram, A. (2003). Influence of different crosslinking treatments on
the physical properties of collagen membranes. Biomaterials, 24(5), 759-767.
doi: 10.1016/S0142-9612(02)00412-X
Chen, F. G., Zhang, W. J., Bi, D., Liu, W., Wei, X., Chen, F. F., . . . Cao, Y. (2007).
Clonal analysis of nestin–vimentin+ multipotent fibroblasts isolated from human
dermis. Journal of Cell Science, 120(16), 2875.
Cheng, N.-C., Estes, B. T., Awad, H. A., & Guilak, F. (2008). Chondrogenic
differentiation of adipose-derived adult stem cells by a porous scaffold derived
from native articular cartilage extracellular matrix. Tissue Engineering Part A,
15(2), 231-241. doi: doi:10.1089/ten.tea.2008.0253.
Cheng, N.-C., Estes, B. T., Awad, H. A., & Guilak, F. (2009). Chondrogenic
Differentiation of Adipose-Derived Adult Stem Cells by a Porous Scaffold
Derived from Native Articular Cartilage Extracellular Matrix. ITissue
Engineering: Part A, 15(2), 231-241. doi: 10.1089/ten.tea.2008.0253
Page 158
169
Cheng, N.-C., Estes, B. T., Young, T.-H., & Guilak, F. (2011). Engineered cartilage
using primary chondrocytes cultured in a porous cartilage-derived matrix.
Regenerative Medicine, 6(1), 81-93. doi: 10.2217/rme.10.87.
Chevallay, B., & Herbage, D. (2000). Collagen-based biomaterials as 3D scaffold for
cell cultures: applications for tissue engineering and gene therapy. Medical and
Biological Engineering and Computing, 38(2), 211-218.
Chiou, M., Xu, Y., & Longaker, M. T. (2006). Mitogenic and chondrogenic effects of
fibroblast growth factor-2 in adipose-derived mesenchymal cells. Biochemical
and biophysical research communications, 343(2), 644-652. doi:
10.1016/j.bbrc.2006.02.171
Curl, W. W., Krome, J., Gordon, E. S., Rushing, J., Smith, B. P., & Poehling, G. G.
(1997). Cartilage Injuries: A Review of 31,516 Knee Arthroscopies.
Arthroscopy: The Journal of Arthroscopic and Related Surgery,, 13(4), 456-460.
Damink, L., Dijkstra, P., Van Luyn, M., Van Wachem, P., Nieuwenhuis, P., & Feijen, J.
(1995). Changes in the mechanical properties of dermal sheep collagen during in
vitro degradation. Journal of Biomedical Materials Research, 29(2), 139-147.
doi: 10.1002/jbm.820290202
Damink, L. O., Dijkstra, P., Van Luyn, M., Van Wachem, P., Nieuwenhuis, P., &
Feijen, J. (1995). Glutaraldehyde as a crosslinking agent for collagen-based
biomaterials. Journal of Materials Science: Materials in Medicine, 6(8), 460-
472. doi: 10.1007/BF00123371
Deng, Y., Hu, J. C., & Athanasiou, K. A. (2007). Isolation and chondroinduction of a
dermis‐isolated, aggrecan‐sensitive subpopulation with high chondrogenic
potential. Arthritis & Rheumatism, 56(1), 168-176. doi: 10.1002/art.22300
Diekman, B. O., Rowland, C. R., Lennon, D. P., Caplan, A. I., & Guilak, F. (2009).
Chondrogenesis of adult stem cells from adipose tissue and bone marrow:
induction by growth factors and cartilage-derived matrix. Tissue Engineering
Part A, 16(2), 523-533. doi: 10.1089/ten.tea.2009.0398
Dienstknecht, T., Ehehalt, K., Jenei-Lanzl, Z., Zellner, J., Müller, M., Berner, A., . . .
Angele, P. (2010). Resazurin dye as a reliable tool for determination of cell
number and viability in mesenchymal stem cell culture. Bulletin of experimental
biology and medicine, 150(1), 157-159.
Erickson, G., Gimble, J., Franklin, D., Rice, H., Awad, H., & Guilak, F. (2002).
Chondrogenic potential of adipose tissue-derived stromal cells in vitro and in
vivo. Biochemical and biophysical research communications, 290(2), 763-769.
Finkelstein, H., & Mayer, L. (1931). The arthroscope: A new method of examining
joints. The Journal of Bone and Joint Surgery, 13(3), 583.
French, M., Liu, E., & Athanasiou, K. (2002). In vitro differentiation of neonatal
foreskin fibroblasts to chondrocytes.
French, M., Rose, S., Canseco, J., & Athanasiou, K. (2004). Chondrogenic
differentiation of adult dermal fibroblasts. Annals of biomedical engineering,
32(1), 50-56.
Page 159
170
French, M., Smith, S., Akanbi, K., Sanford, T., Hecht, J., Farach-Carson, M., & Carson,
D. (1999). Expression of the heparan sulfate proteoglycan, perlecan, during
mouse embryogenesis and perlecan chondrogenic activity in vitro. The Journal
of cell biology, 145(5), 1103. doi: 10.1083/jcb.145.5.1103
Froget, S., Barthelemy, E., Guillot, F., Soler, C., Coudert, M. C., Benbunan, M., &
Dosquet, C. (2003). Wound healing mediator production by human dermal
fibroblasts grown within a collagen‐GAG matrix for skin repair in humans.
European Cytokine Network, 14(1), 60-64.
Fry, W., DeWeese, M., Kraft, R., & Ernst, C. (1964). Importance of porosity in arterial
prostheses. Archives of Surgery, 88(5), 836. doi:
10.1001/archsurg.1964.01310230112022.
Fulcher, G. R., Hukins, D. W., & Shepherd, D. E. (2009). Viscoelastic properties of
bovine articular cartilage attached to subchondral bone at high frequencies. BMC
Musculoskeletal Disorders, 10(1), 61. doi: 10.1186/1471-2474-10-61
Furneaux, R., Rigby, W., & Davidson, A. (1989). The formation of controlled-porosity
membranes from anodically oxidized aluminium. Nature, 337(6203), 147-149.
doi: 10.1038/337147a0
Gago, N., Pérez‐López, V., Sanz‐Jaka, J. P., Cormenzana, P., Eizaguirre, I., Bernad, A.,
& Izeta, A. (2009). Age‐Dependent Depletion of Human Skin‐Derived
Progenitor Cells. Stem Cells, 27(5), 1164-1172.
Gang, E. J., Hong, S. H., Jeong, J. A., Hwang, S. H., Kim, S. W., Yang, I., . . . Kim, H.
(2004). In vitro mesengenic potential of human umbilical cord blood-derived
mesenchymal stem cells. Biochemical and biophysical research
communications, 321(1), 102-108.
Gilbert, D. L. (1988). Collagen macromolecular drug delivery systems. The University
of Utah, Utah, USA.
Glowacki, J. (1996). Cellular reactions to bone-derived material. Clinical Orthopaedics
and Related Research, 324, 47.
Glowacki, J. (2000). In vitro engineering of cartilage. In vitro, 37(2), 171-178.
Glowacki, J., & Mizuno, S. (1997). Cell induction device: Google Patents.
Glowacki, J., & Mizuno, S. (2008). Collagen scaffolds for tissue engineering.
Biopolymers, 89(5), 338-344. doi: 10.1002/bip.20871
Glowacki, J., & Mulliken, J. (1985). Demineralized bone implants. Clinics in plastic
surgery, 12(2), 233.
Glowacki, J., Yates, K., Little, G., & Mizuno, S. (1998). Induced chondroblastic
differentiation of human fibroblasts by three-dimensional culture with
demineralized bone matrix. Materials Science and Engineering: C, 6(4), 199-
203.
Page 160
171
Glowacki, J., Zhou, S., & Mizuno, S. (2009). Mechanisms of
Osteoinduction/Chondroinduction by Demineralized Bone. Journal of
Craniofacial Surgery, 20, 634.
Haleem‐Smith, H., Calderon, R., Song, Y., Tuan, R. S., & Chen, F. H. (2012). Cartilage
oligomeric matrix protein enhances matrix assembly during chondrogenesis of
human mesenchymal stem cells. Journal of cellular biochemistry, 113(4), 1245-
1252. doi: 10.1002/jcb.23455
Hangody, L., & Fules, P. (2003). Autologous osteochondral mosaicplasty for the
treatment of full-thickness defects of weight-bearing joints: ten years of
experimental and clinical experience. The Journal of Bone and Joint Surgery,
85(Supplement 2), 25.
Hangody, L., Kish, G., Karpati, Z., Szerb, I., & Udvarhelyi, I. (1997). Arthroscopic
autogenous osteochondral mosaicplasty for the treatment of femoral condylar
articular defects A preliminary report. Knee Surgery, Sports Traumatology,
Arthroscopy, 5(4), 262-267.
Hangody, L., Rathonyi, G., Duska, Z., Vasarhelyi, G., Fules, P., & Modis, L. (2004).
Autologous osteochondral mosaicplasty. Surgical technique. The Journal of
Bone and Joint Surgery, 86(Supplement 1), 65.
Haugh, M. G., Jaasma, M. J., & O'Brien, F. J. (2009). The effect of dehydrothermal
treatment on the mechanical and structural properties of collagen‐GAG
scaffolds. Journal of Biomedical Materials Research Part A, 89(2), 363-369.
doi: 10.1002/jbm.a.31955
Haugh, M. G., Murphy, C. M., McKiernan, R. C., Altenbuchner, C., & O'Brien, F. J.
(2011). Crosslinking and mechanical properties significantly influence cell
attachment, proliferation, and migration within collagen glycosaminoglycan
scaffolds. Tissue Engineering Part A, 17(9-10), 1201-1208. doi:
10.1089/ten.TEA.2010.0590
Haugh, M. G., Murphy, C. M., & O'Brien, F. J. (2009). Novel freeze-drying methods to
produce a range of collagen–glycosaminoglycan scaffolds with tailored mean
pore sizes. Tissue Engineering Part C: Methods, 16(5), 887-894. doi:
10.1089/ten.TEC.2009.0422.
Hiramatsu, K., Sasagawa, S., Outani, H., Nakagawa, K., Yoshikawa, H., & Tsumaki, N.
(2011). Generation of hyaline cartilaginous tissue from mouse adult dermal
fibroblast culture by defined factors. The Journal of clinical investigation,
121(2), 640-657. doi: 10.1172/JCI44605
Hoemann, C. D. (2004). Molecular and Biochemical Assays of Cartilage Components.
In F. D. Ceuninck, M. Sabatini & P. Pastoureau (Eds.), Cartilage and
Osteoarthritis : Volume 2: Structure and In Vivo Analysis (Vol. 2, pp. 127-156):
Humana Press.
Hoemann, C. D. (2004). Molecular and biochemical assays of cartilage components. In
F. D. C. Massimo Sabatini, Philippe Pastoureau (Ed.), Cartilage and
osteoarthritis (Vol. 2, pp. 127-156). Totowa, New Jersey, United States of
America: Springer.
Page 161
172
Huang, G., Wang, S., He, X., Zhang, X., Lu, T. J., & Xu, F. (2013). Helical spring
template fabrication of cell‐laden microfluidic hydrogels for tissue engineering.
Biotechnology and bioengineering, 110(3), 980-989.
Huang, G., Zhang, X., Xiao, Z., Zhang, Q., Zhou, J., Xu, F., & Lu, T. J. (2012). Cell-
encapsulating microfluidic hydrogels with enhanced mechanical stability. Soft
Matter, 8(41), 10687-10694. doi: 10.1039/C2SM26126J
Huang, S. J., & Edelman, P. G. (1995). An overview of biodegradable polymers and
biodegradation of polymers Degradable Polymers (pp. 18-28): Springer.
Huber, M., Trattnig, S., & Lintner, F. (2000). Anatomy, biochemistry, and physiology
of articular cartilage. Investigative radiology, 35(10), 573.
Hughes, S. W. (2005). Archimedes revisited: a faster, better, cheaper method of
accurately measuring the volume of small objects. Physics education, 40(5),
468. doi: 10.1088/0031-9120/40/5/001
Hunter, W. (1809). On the structure and diseases of articular cartilage. In G. S. Charles
Hutton, Richard Pearson (Ed.), The Philosophical Transactions of the Royal
Society of London, from Their Commencement in 1665 to the Year 1800 (Vol. 3,
pp. 690-691).
Hunziker, J. (1990). Articular cartilage: composition, structure, response to injury, and
methods of facilitating repair. Articular cartilage and knee joint function: basic
science and arthroscopy, 19.
Hutmacher, D. W. (2000). Scaffolds in tissue engineering bone and cartilage.
Biomaterials, 21(24), 2529-2543. doi: 10.1016/S0142-9612(00)00121-6
Hyc, A., Malejczyk, J., Osiecka, A., & Moskalewski, S. (1997). Immunological
response against allogeneic chondrocytes transplanted into joint surface defects
in rats. Cell Transplantation, 6(2), 119-124. doi: 10.1016/S0963-
6897(96)00254-0
Izadifar, Z., Chen, X., & Kulyk, W. (2012). Strategic design and fabrication of
engineered scaffolds for articular cartilage repair. Journal of Functional
Biomaterials, 3(4), 799-838. doi: 10.3390/jfb3040799
Jacobs, J. (1965). Patellar graft for severely depressed comminuted fractures of the
lateral tibial condyle. The Journal of Bone and Joint Surgery, 47(4), 842.
Jarman-Smith, M. L., Bodamyali, T., Stevens, C., Howell, J. A., Horrocks, M., &
Chaudhuri, J. B. (2004). Porcine collagen crosslinking, degradation and its
capability for fibroblast adhesion and proliferation. Journal of Materials
Science: Materials in Medicine, 15(8), 925-932. doi:
10.1023/B:JMSM.0000036281.47596.cc
Jeffery, A., Blunn, G., Archer, C., & Bentley, G. (1991). Three-dimensional collagen
architecture in bovine articular cartilage. Journal of Bone & Joint Surgery,
British Volume, 73(5), 795-801.
Page 162
173
Jeney, F., Bazsó-Dombi, E., Oravecz, K., Szabó, J., & Zs-Nagy, I. (2000).
Cytochemical studies on the fibroblast-preadipocyte relationships in cultured
fibroblast cell lines. Acta Histochemica, 102(4), 381-389.
Johnson, T., Bahrampourian, R., Patel, A., & Mequanint, K. (2010). Fabrication of
highly porous tissue-engineering scaffolds using selective spherical porogens.
Bio-Medical Materials and Engineering, 20(2), 107-118. doi: 10.3233/BME-
2010-0621.
Johnstone, B., Yoo, J., & Stewart, M. (2008). Cell Sources for Cartilage Tissue
Engineering. European Cells and Materials, 16(2), 40.
Jus, S., Stachel, I., Schloegl, W., Pretzler, M., Friess, W., Meyer, M., . . . Guebitz, G.
(2011). Cross-linking of collagen with laccases and tyrosinases. Materials
Science and Engineering: C, 31(5), 1068-1077. doi: 10.1016/j.msec.2011.03.007
Kasemkijwattana, C., Kesprayura, S., & Chanlalit, C. (2009). Autologous Chondrocytes
Implantation for Traumatic Cartilage Defects of the Knee. J Med Assoc Thai,
92(5), 648-653.
Kavalkovich, K. W. B., R ; Murphy, J M. ; Barry, F P. . (2000). Effect of cell density on
chondrogenic differentiation of mesenchymal stem cells. Paper presented at the
46th Annual Meeting, Orthopaedic Research Society, Orlando, Florida.
http://www.ors.org/Transactions/46/0975.pdf
Kim, S., Cho, J., Hong, M., Rhie, J., & Yoon, H. (2008). Induction of chondrogenic
differentiation in cultured fibroblasts isolated from the inferior turbinate.
Otolaryngology-Head and Neck Surgery, 139(1), 143-148.
Kimuli, M., Eardley, I., & Southgate, J. (2004). In vitro assessment of decellularized
porcine dermis as a matrix for urinary tract reconstruction. BJU international,
94(6), 859-866. doi: 10.1111/j.1464-410X.2004.05047.x
Kipnes, J., Carlberg, A., Loredo, G., Lawler, J., Tuan, R., & Hall, D. (2003). Effect of
cartilage oligomeric matrix protein on mesenchymal chondrogenesis< i> in
vitro</i>. Osteoarthritis and Cartilage, 11(6), 442-454. doi: 10.1016/S1063-
4584(03)00055-4
Kissa, E. (1999). Dispersions: Characterization, Testing, and Measurement: CRC
Press.
Kong, J., & Yu, S. (2007). Fourier transform infrared spectroscopic analysis of protein
secondary structures. Acta biochimica et biophysica Sinica, 39(8), 549-559. doi:
10.1111/j.1745-7270.2007.00320.x
Kyriacos A. Athanasiou, E. M. D., Jerry C. Hu, Grayson D. DuRaine, A. Hari Reddi.
(2013). Presprctives on the transitional aspects of articular cartilage biology
Articular Cartilage (Vol. 1, pp. 286). London, UK: CRC Press.
Lane, J., Brighton, C., Ottens, H., & Lipton, M. (1977). Joint resurfacing in the rabbit
using an autologous osteochondral graft. The Journal of Bone and Joint Surgery,
59(2), 218.
Page 163
174
Lee, C., Grodzinsky, A., & Spector, M. (2001). The effects of cross-linking of collagen-
glycosaminoglycan scaffolds on compressive stiffness, chondrocyte-mediated
contraction, proliferation and biosynthesis. Biomaterials, 22(23), 3145-3154.
doi: 10.1016/S0142-9612(01)00067-9
Lee, J., Edwards, H., Pereira, C., & Samii, S. (1996). Crosslinking of tissue-derived
biomaterials in 1-ethyl-3-(3-dimethylaminopropyl)-carbodiimide (EDC).
Journal of Materials Science: Materials in Medicine, 7(9), 531-541. doi:
10.1007/BF00122176
Lefebvre, V., Huang, W., Harley, V. R., Goodfellow, P. N., & de Crombrugghe, B.
(1997). SOX9 is a potent activator of the chondrocyte-specific enhancer of the
pro alpha1 (II) collagen gene. Molecular and Cellular Biology, 17(4), 2336-
2346.
Lefebvre, V., Li, P., & de Crombrugghe, B. (1998). A new long form of Sox5 (L‐Sox5),
Sox6 and Sox9 are coexpressed in chondrogenesis and cooperatively activate the
type II collagen gene. The EMBO journal, 17(19), 5718-5733. doi:
10.1093/emboj/17.19.5718
Liu, Z., Xu, J., Colvin, J., & Ornitz, D. (2002). Coordination of chondrogenesis and
osteogenesis by fibroblast growth factor 18. Genes & development, 16(7), 859.
doi: 10.1101/gad.965602
Lodish, H., Berk, A., Zipursky, S. L., Matsudaira, P., Baltimore, D., & Darnell, J.
(2000). Collagen: the fibrous proteins of the matrix (4th ed.).
Longobardi, L., O'Rear, L., Aakula, S., Johnstone, B., Shimer, K., Chytil, A., . . .
Spagnoli, A. (2006). Effect of IGF I in the Chondrogenesis of Bone Marrow
Mesenchymal Stem Cells in the Presence or Absence of TGF Signaling. Journal
of Bone and Mineral Research, 21(4), 626-636.
Lorenz, K., Sicker, M., Schmelzer, E., Rupf, T., Salvetter, J., Schulz‐Siegmund, M., &
Bader, A. (2008). Multilineage differentiation potential of human dermal skin‐derived fibroblasts. Experimental dermatology, 17(11), 925-932.
Lu, L., Zhu, X., Valenzuela, R. G., Currier, B. L., & Yaszemski, M. J. (2001).
Biodegradable polymer scaffolds for cartilage tissue engineering. Clinical
Orthopaedics and Related Research, 391, S251-S270.
Mahmoudifar, N., & Doran, P. M. (2012). Chondrogenesis and cartilage tissue
engineering: the longer road to technology development. TRENDS in
Biotechnology, 30(3), 166-176. doi: 10.1016/j.tibtech.2011.09.002
Mauck, R., Wang, C.-B., Oswald, E., Ateshian, G., & Hung, C. (2003a). The role of cell
seeding density and nutrient supply for articular cartilage tissue engineering with
deformational loading. Osteoarthritis and Cartilage, 11(12), 879-890. doi:
10.1016/j.joca.2003.08.006
Mauck, R., Wang, C., Oswald, E., Ateshian, G., & Hung, C. (2003b). The role of cell
seeding density and nutrient supply for articular cartilage tissue engineering with
deformational loading. Osteoarthritis and Cartilage, 11(12), 879-890.
Page 164
175
McDevitt, C. A. (1973). Biochemistry of articular cartilage: Nature of proteoglycans
and collagen of articular cartilage and their role in aging and in osteoarthrosis.
Ann Rheum Dis, 32(364).
McPherson, J. M., & Tubo, R. Articular Cartilage Injury. In R. P. Lanza, R. Langer & J.
Vacanti (Eds.), Principles of Tissue Engineering (2nd ed., pp. 697-709):
Academic Press.
Mendoza-Novelo, B., Mata-Mata, J. L., Vega-González, A., Cauich-Rodríguez, J. V., &
Marcos-Fernández, Á. (2014). Synthesis and characterization of protected
oligourethanes as crosslinkers of collagen-based scaffolds. Journal of Materials
Chemistry B, 2(19), 2874-2882. doi: 10.1039/c3tb21832e
Mizuno, S., & Glowacki, J. (1996). Chondroinduction of human dermal fibroblasts by
demineralized bone in three-dimensional culture. Experimental cell research,
227(1), 89-97.
Mizuno, S., & Glowacki, J. (1996). Three-dimensional composite of demineralized
bone powder and collagen for in vitro analysis of chondroinduction of human
dermal fibroblasts. Biomaterials, 17, 1819-1825.
Mizuno, S., & Glowacki, J. (2005). Low oxygen tension enhances chondroinduction by
demineralized bone matrix in human dermal fibroblasts in vitro. Cells Tissues
Organs, 180(3), 151-158.
Mizuno, S., Lycette, C., Quinto, C., & Glowacki, J. (1992). A Collagen/DBP sponge
system designed for in vitro analysis of chondroinduction.
Moore, E., Bendele, A., Thompson, D., Littau, A., Waggie, K., Reardon, B., &
Ellsworth, J. (2005). Fibroblast growth factor-18 stimulates chondrogenesis and
cartilage repair in a rat model of injury-induced osteoarthritis. Osteoarthritis and
Cartilage, 13(7), 623-631. doi: 10.1016/j.joca.2005.03.003
Moradi, A., Dalilottojari, A., Pingguan-Murphy, B., & Djordjevic, I. (2013). Fabrication
and characterization of elastomeric scaffolds comprised of a citric acid-based
polyester/hydroxyapatite microcomposite. Materials & Design, 50, 446-450.
doi: 10.1016/j.matdes.2013.03.026
Moradi, A., Pramanik, S., Ataollahi, F., Abdul-Khalil, A., Kamarul, T., & Pingguan-
Murphy, B. (2014). A comparison study of different physical treatments on
cartilage matrix derived porous scaffolds for tissue engineering applications.
Science and Technology of Advanced Materials. doi: 10.1088/1468-
6996/15/6/065001
Moradi, A., Pramanik, S., Ataollahi, F., Kamarul, T., & Pingguan-Murphy, B. (2014).
Archimedes revisited: computer assisted micro-volumetric modification of the
liquid displacement method for porosity measurement of highly porous light
materials. Analytical Methods, 6(12), 4396-4401. doi: 10.1039/C4AY00666F
Moskalewski, S., Hyc, A., & Osiecka‐Iwan, A. (2002). Immune response by host after
allogeneic chondrocyte transplant to the cartilage. Microscopy Research and
Technique, 58(1), 3-13. doi: 10.1002/jemt.10110
Page 165
176
Moutos, F. T., & Guilak, F. (2008). Composite scaffolds for cartilage tissue
engineering. Biorheology, 45(3), 501-512. doi: 10.3233/BIR-2008-0491
Murphy, C. M., Haugh, M. G., & O'Brien, F. J. (2010). The effect of mean pore size on
cell attachment, proliferation and migration in collagen–glycosaminoglycan
scaffolds for bone tissue engineering. Biomaterials, 31(3), 461-466. doi:
10.1016/j.biomaterials.2009.09.063
National Library of Medicine. (2014a, June 23, 2014). ACAN. Genes. from
http://ghr.nlm.nih.gov/gene/ACAN
National Library of Medicine. (2014b, June 23, 2014). COL1A1. Genes. Retrieved
June 29, 2014, June 23, 2014, from http://ghr.nlm.nih.gov/gene/COL1A1
National Library of Medicine. (2014c). COL1A2. Available from National Library of
Medicine Retrieved June 29, 2014, from Genetics Home Reference
http://ghr.nlm.nih.gov/gene/COL1A2
National Library of Medicine. (2014d, June 23, 2014). COL2A1. Genes. 39/06/2014,
from http://ghr.nlm.nih.gov/gene/COL2A1
National Library of Medicine. (2014e). PRG4. Genes. Retrieved 29/06/2014, 2014,
from http://ghr.nlm.nih.gov/gene/PRG4
Ng, L.-J., Wheatley, S., Muscat, G. E., Conway-Campbell, J., Bowles, J., Wright, E., . .
. Koopman, P. (1997). SOX9 binds DNA, activates transcription, and
coexpresses with type II collagen during chondrogenesis in the mouse.
Developmental biology, 183(1), 108-121. doi: 10.1006/dbio.1996.8487
Nishimura, K., Solchaga, L., Caplan, A., Yoo, J., Goldberg, V., & Johnstone, B. (1999).
Chondroprogenitor cells of synovial tissue. Arthritis & Rheumatism, 42(12),
2631-2637.
O'Brien, J., Wilson, I., Orton, T., & Pognan, F. (2003). Investigation of the Alamar Blue
(resazurin) fluorescent dye for the assessment of mammalian cell cytotoxicity.
European Journal of Biochemistry, 267(17), 5421-5426.
Österreicher, C. H., Penz-Österreicher, M., Grivennikov, S. I., Guma, M., Koltsova, E.
K., Datz, C., . . . Brenner, D. A. (2011). Fibroblast-specific protein 1 identifies
an inflammatory subpopulation of macrophages in the liver. Proceedings of the
National Academy of Sciences, 108(1), 308-313. doi: 10.1073/pnas.1017547108
Outani, H., Okada, M., Yamashita, A., Nakagawa, K., Yoshikawa, H., & Tsumaki, N.
(2013). Direct induction of chondrogenic cells from human dermal fibroblast
culture by defined factors. PloS one, 8(10), e77365. doi:
10.1371/journal.pone.0077365
Page, R. L., Ambady, S., Holmes, W. F., Vilner, L., Kole, D., Kashpur, O., . . .
Dominko, T. (2009). Induction of stem cell gene expression in adult human
fibroblasts without transgenes. Cloning and Stem Cells, 11(3), 417-426. doi:
10.1089/clo.2009.0015
Page 166
177
Parenteau-Bareil, R., Gauvin, R., & Berthod, F. (2010). Collagen-based biomaterials for
tissue engineering applications. Materials, 3(3), 1863-1887. doi:
10.3390/ma3031863
Park, H., & Miwa, K. (2003). X-ray computed tomography for micro porosity in AZ 91
D alloy. Materials Transactions, 44(11), 2326-2333.
Park, S., Hung, C., & Ateshian, G. (2004). Mechanical response of bovine articular
cartilage under dynamic unconfined compression loading at physiological stress
levels. Osteoarthritis and Cartilage, 12(1), 65-73. doi:
10.1016/j.joca.2003.08.005
Parrilli, A. F., M.; Salamanna, F.; Veronesi, F.; Giardino, R. (2010). Evaluation of the
porosity of biomaterials with micro-CT. Journal of Applied Biomaterials &
Biomechanics, 8(2), 120.
Peinador, R. I., Calvo, J. I., ToVinh, K., Thom, V., Prádanos, P., & Hernández, A.
(2011). Liquid–liquid displacement porosimetry for the characterization of virus
retentive membranes. Journal of Membrane Science, 372(1), 366-372. doi:
10.1016/j.memsci.2011.02.022
Pesch, K. L., & Simmert, U. (1929). Combined assays for lactose and galactose by
enzymatic reactions. Milchw Forsch, 8, 551.
Peterson, L., Minas, T., Brittberg, M., & Lindahl, A. (2003). Treatment of
osteochondritis dissecans of the knee with autologous chondrocyte
transplantation: results at two to ten years. The Journal of Bone and Joint
Surgery, 85(Supplement 2), 17.
Petra, M., Anastassopoulou, J., Theologis, T., & Theophanides, T. (2005). Synchrotron
micro-FT-IR spectroscopic evaluation of normal paediatric human bone. Journal
of Molecular Structure, 733(1), 101-110. doi: 10.1016/j.molstruc.2004.07.041
Powers, C., McLeskey, S., & Wellstein, A. (2000). Fibroblast growth factors, their
receptors and signaling. Endocrine-related cancer, 7(3), 165-197.
Pramanik, S., Pingguan-Murphy, B., & Abu-Osman, N. A. (2012). Progress of key
strategies in development of electrospun scaffolds: bone tissue. Science and
Technology of Advanced Materials, 13(4), 043002. doi: 10.1088/1468-
6996/13/4/043002
Pridie, K. (1959). A method of resurfacing osteoarthritic knee joints. J Bone Joint Surg
Br, 41(3), 618-619.
R.J. Gonzalez, J. B. T. (2001). Evaluation of hepatic subcellular fractions for Alamar
blue and MTT reductase activity, Toxicology In Vitro, pp. 257-259.
Rampersad, S. N. (2012). Multiple Applications of Alamar Blue as an Indicator of
Metabolic Function and Cellular Health in Cell Viability Bioassays. Sensors,
12(12), 12347-12360. doi: 10.3390/s120912347
Ratner, B. D. (2004). Biomaterials science: an introduction to materials in medicine:
Academic press.
Page 167
178
Ribeiro, A., Barbaglio, A., Oliveira, M., Santos, R., Coelho, A., Ribeiro, C., . . .
Barbosa, M. (2012). Correlations Between the Biochemistry and Mechanical
States of a Sea-Urchin Ligament: A Mutable Collagenous Structure.
Biointerphases, 7(1-4), 1-15. doi: 10.1007/s13758-012-0038-6
Riekstina, U., Muceniece, R., Cakstina, I., Muiznieks, I., & Ancans, J. (2008).
Characterization of human skin-derived mesenchymal stem cell proliferation
rate in different growth conditions. Cytotechnology, 58(3), 153-162.
Rittié, L., & Fisher, G. (2005). Isolation and culture of skin fibroblasts. Methods in
molecular medicine, 117, 83.
Rodríguez-Baeza, M., Neira, C., & Aguilera, J. (2003). Thermogravimetric study of the
formation of cross-linked structures in the synthesis of poly (methylsiloxane).
Journal of the Chilean Chemical Society, 48(2), 75-77. doi: 10.4067/S0717-
97072003000200013
Rowland, C. R., Lennon, D. P., Caplan, A. I., & Guilak, F. (2013). The effects of
crosslinking of scaffolds engineered from cartilage ECM on the chondrogenic
differentiation of MSCs. Biomaterials, 34(2013), 5802-5812. doi:
10.1016/j.biomaterials.2013.04.027
Rutherford, R. B., Moalli, M., Franceschi, R. T., Wang, D., Gu, K., & Krebsbach, P. H.
(2002). Bone morphogenetic protein-transduced human fibroblasts convert to
osteoblasts and form bone in vivo. Tissue engineering, 8(3), 441-452.
Saalbach, A., Anderegg, U., Bruns, M., Schnabel, E., Herrmann, K., & Haustein, U. F.
(1996). Novel fibroblast-specific monoclonal antibodies: properties and
specificities. Journal of investigative dermatology, 106(6), 1314-1319. doi:
10.1111/1523-1747.ep12349035
Saalbach, A., Aust, G., Haustein, U., Herrmann, K., & Anderegg, U. (1997). The
fibroblast-specific MAb AS02: a novel tool for detection and elimination of
human fibroblasts. Cell and tissue research, 290(3), 593-599.
Saarakkala, S., Rieppo, L., Rieppo, J., & Jurvelin, J. (2010). Fourier transform infrared
(FTIR) microspectroscopy of immature, mature and degenerated articular
cartilage. In J. D. A. Mendez-Vilas (Ed.), MICROSCOPY: SCIENCE,
TECHNOLOGY, APPLICATIONS AND EDUCATION (4 ed., Vol. 4, pp. 403-
414): Formatex Research Center.
Sanchez-Adams, J., & Athanasiou, K. A. (2012). Dermis isolated adult stem cells for
cartilage tissue engineering. Biomaterials, 33(1), 109-119. doi:
10.1016/j.biomaterials.2011.09.038
Schulz Torres, D., M Freyman, T., Yannas, I. V., & Spector, M. (2000). Tendon cell
contraction of collagen–GAG matrices in vitro: Effect of cross-linking.
Biomaterials, 21(15), 1607-1619. doi: 10.1016/S0142-9612(00)00051-X
Seal, B., Otero, T., & Panitch, A. (2001). Polymeric biomaterials for tissue and organ
regeneration. Materials Science and Engineering: R: Reports, 34(4), 147-230.
doi: 10.1016/S0927-796X(01)00035-3
Page 168
179
Shanmugarajan, T., Kim, B.-S., Lee, H., & Im, G.-I. (2011). Growth factors and
signaling pathways in the chondrogenic differentiation of mesenchymal stem
cells. Tissue Eng Regen Med, 8, 292.
Sharif, S., DiMemmo, L., Davidovich, M., & Sarsfield, B. Applicability of Specific
Surface Area Determination on Pharmaceuticals by Inverse Gas
Chromatography. The Open-Access Journal for the Basic Principles of Diffusion
Theory, Experiment and Application.
Shelbourne, K., Jari, S., & Gray, T. (2003). Outcome of untreated traumatic articular
cartilage defects of the knee: a natural history study. The Journal of Bone and
Joint Surgery, 85(Supplement 2), 8.
Shirasawa, S., Sekiya, I., Sakaguchi, Y., Yagishita, K., Ichinose, S., & Muneta, T.
(2006). In vitro chondrogenesis of human synovium derived mesenchymal stem
cells: Optimal condition and comparison with bone marrow derived cells.
Journal of cellular biochemistry, 97(1), 84-97.
Sommar, P. (2010). Differentiation of human dermal fibroblasts and applications in
tissue engineering.
Strehl, R., Schumacher, K., de Vries, U., & Minuth, W. W. (2002). Proliferating cells
versus differentiated cells in tissue engineering. Tissue engineering, 8(1), 37-42.
doi: 10.1089/107632702753503036
Strutz, F., Okada, H., Lo, C. W., Danoff, T., Carone, R. L., Tomaszewski, J. E., &
Neilson, E. G. (1995). Identification and characterization of a fibroblast marker:
FSP1. The Journal of cell biology, 130(2), 393-405. doi: 10.1083/jcb.130.2.393
Szepes, A., Kovács, J., & Szabóné, R. P. (2005). [Use of mercury porosimetry, assisted
by nitrogen adsorption in the investigation of the pore structure of tablets]. Acta
Pharmaceutica Hungarica, 76(3), 119-125.
Taipaleenmäki, H. (2010). Factors Regulating Chondrogenic Differentiation. (PhD),
Annales Universitatis Turkuensis D 938, Annales Universitatis Turkuensis D
938. Retrieved from http://www.doria.fi/handle/10024/66244
Thisse, B., & Thisse, C. (2005). Functions and regulations of fibroblast growth factor
signaling during embryonic development. Developmental biology, 287(2), 390-
402. doi: 10.1016/j.ydbio.2005.09.011
Topisirovic, I., & Sonenberg, N. (2014). Distinctive tRNA Repertoires in Proliferating
versus Differentiating Cells. Cell, 158(6), 1238-1239. doi:
10.1016/j.cell.2014.08.031
Vaheri, A., Ruoslahti, E., Linder, E., Wartiovaara, J., Keski‐Oja, J., Kuusela, P., &
Saksela, O. (1976). Fibroblast surface antigen (SF): molecular properties,
distribution in vitro and in vivo, and altered expression in transformed cells.
Journal of Supramolecular Structure, 4(1), 63-70. doi: 10.1002/jss.400040107
Vergés, E., Ayala, D., Grau, S., & Tost, D. (2008). Virtual porosimeter. Computer-
Aided Design and Applications, 5(1-4), 557-564. doi: 10.3722/cadaps.2008.557-
564
Page 169
180
Voytik-Harbin, S. L., Brightman, A. O., Waisner, B., Lamar, C. H., & Badylak, S. F.
(1998). Application and evaluation of the alamarBlue assay for cell growth and
survival of fibroblasts. In Vitro Cellular & Developmental Biology-Animal,
34(3), 239-246.
Weadock, K. S., Miller, E. J., Bellincampi, L. D., Zawadsky, J. P., & Dunn, M. G.
(1995). Physical crosslinking of collagen fibers: comparison of ultraviolet
irradiation and dehydrothermal treatment. Journal of Biomedical Materials
Research, 29(11), 1373-1379.
Weadock, K. S., Miller, E. J., Keuffel, E. L., & Dunn, M. G. (1996). Effect of physical
crosslinking methods on collagen-fiber durability in proteolytic solutions.
Journal of Biomedical Materials Research, 32(2), 221-226. doi:
10.1002/(SICI)1097-4636(199610)32:2<221::AID-JBM11>3.0.CO;2-M
Weadock, K. S., Miller, E. J., Keuffel, E. L., & Dunn, M. G. (1996). Effect of physical
crosslinking methods on collagen‐fiber durability in proteolytic solutions.
Journal of Biomedical Materials Research, 32(2), 221-226. doi:
10.1002/(SICI)1097-4636(199610)32:2<221::AID-JBM11>3.0.CO;2-M
Westermarck, S. (2000) Use of mercury porosimetry and nitrogen adsorption in
characterisation of the pore structure of mannitol and microcrystalline cellulose
powders, granules and tablets. Helisinki: University of Helsinki Helsinki,
Finland.
Westermarck, S., Juppo, A. M., Kervinen, L., & Yliruusi, J. (1998). Pore structure and
surface area of mannitol powder, granules and tablets determined with mercury
porosimetry and nitrogen adsorption. European Journal of Pharmaceutics and
Biopharmaceutics, 46(1), 61-68. doi: 10.1016/S0939-6411(97)00169-0
WHO/UNAIDS. (2007). Male circumcision: Global trends and determinants of
prevalence, safety and acceptability.
Wright, E., Hargrave, M. R., Christiansen, J., Cooper, L., Kun, J., Evans, T., . . .
Koopman, P. (1995). The Sry-related gene Sox9 is expressed during
chondrogenesis in mouse embryos. Nature Genetics, 9(1), 15-20. doi:
10.1038/ng0195-15
Xu, R., Rao, H., Zhu, Y., & Chai, B. (1993). Effects of osteogenesis on dermal
fibroblasts cultured in vitro. Chinese medical journal, 106(11), 825.
Yang, Q., Peng, J., Guo, Q., Huang, J., Zhang, L., Yang, F., . . . Lu, S. (2008). A
cartilage ECM-derived 3-D porous acellular matrix scaffold for in vivo cartilage
tissue engineering with PKH26-labeled chondrogenic bone marrow-derived
mesenchymal stem cells. Biomaterials, 29(2008), 2378-2387. doi:
10.1016/j.biomaterials.2008.01.037
Yang, Q., Peng, J., Guo, Q., Huang, J., Zhang, L., Yao, J., . . . Wang, A. (2008). A
cartilage ECM-derived 3-D porous acellular matrix scaffold for in vivo cartilage
tissue engineering with PKH26-labeled chondrogenic bone marrow-derived
mesenchymal stem cells. Biomaterials, 29(15), 2378-2387. doi:
10.1016/j.biomaterials.2008.01.037
Page 170
181
Yang, Z., Shi, Y., Wei, X., He, J., Yang, S., Dickson, G., . . . Li, G. (2009). Fabrication
and Repair of Cartilage Defects with a Novel Acellular Cartilage Matrix
Scaffold. Tissue Engineering Part C: Methods, 16(5), 865-876. doi:
10.1089/ten.TEC.2009.0444.
Yang, Z., & Xiaofeng, P. (2007). Micro‐CT scanning analysis for inner structure of
porous media. Heat Transfer—Asian Research, 36(4), 208-214. doi:
10.1002/htj.20155
Yates, K., & Glowacki, J. (2003). Gene expression changes in an in vitro model of
chondroinduction: a comparison of two methods. Wound Repair and
Regeneration, 11(5), 386-392.
Yearbook, F. S. (2012). Statistical Yearbook of the Food And Agriculture. In S. D.
(FAOSTAT) (Ed.): Food and Agriculture Organization of the United Nations.
Yu, H. G., Chung, H., Yu, Y. S., Seo, J. M., & Heo, J. W. (2003). A new rapid and non-
radioactive assay for monitoring and determining the proliferation of retinal
pigment epithelial cells. Korean Journal of Ophthalmology, 17(1), 29-34.
Zaleskas, J. M., Kinner, B., Freyman, T. M., Yannas, I. V., Gibson, L. J., & Spector, M.
(2004). Contractile forces generated by articular chondrocytes in collagen-
glycosaminoglycan matrices. Biomaterials, 25(7), 1299-1308. doi:
10.1016/j.biomaterials.2003.08.005
Zhao, Q., Eberspaecher, H., Lefebvre, V., & de Crombrugghe, B. (1997). Parallel
expression of Sox9 and Col2a1 in cells undergoing chondrogenesis.
Developmental dynamics, 209(4), 377-386. doi: 10.1002/(SICI)1097-
0177(199708)209:4<377
Zheng, X.-F., Lu, S.-B., Zhang, W.-G., Liu, S.-Y., Huang, J.-X., & Guo, Q.-Y. (2011).
Mesenchymal stem cells on a decellularized cartilage matrix for cartilage tissue
engineering. Biotechnology and Bioprocess Engineering, 16(3), 593-602. doi:
10.1007/s12257-010-0348-9
Zhou, S., Yates, K., Eid, K., & Glowacki, J. (2005). Demineralized bone promotes
chondrocyte or osteoblast differentiation of human marrow stromal cells
cultured in collagen sponges. Cell and tissue banking, 6(1), 33-44.
Page 171
182
LIST OF PUBLICATIONS
Moradi, A., Dalilottojari, A., Pingguan-Murphy, B., & Djordjevic, I. (2013). Fabrication
and characterization of elastomeric scaffolds comprised of a citric acid-based
polyester/hydroxyapatite microcomposite. Materials & Design, 50, 446-450.
doi: 10.1016/j.matdes.2013.03.026
Moradi, A., Pramanik, S., Ataollahi, F., Kamarul, T., & Pingguan-Murphy, B. (2014).
Archimedes revisited: computer assisted microvolumetric modification of liquid
displacement method for porosity measurement of highly porous light materials.
Analytical Methods. doi: 10.1039/C4AY00666F
Moradi, A., Pramanik, S., Ataollahi, F., Abdul Khalil, A., Kamarul, T., & Pingguan-
Murphy, B. (2014). A Comparison Study of Different Physical Treatments on
Cartilage Matrix Derived Porous Scaffolds for Tissue Engineering Applications.
Science and Technology of Advanced Materials. doi: 10.1039/C4AY00666F
Ataollahi F, Pramanik S, Moradi A, Dalilottojari A, Pingguan-Murphy B, Abas W, et al.
Endothelial cell responses in terms of adhesion, proliferation, and morphology to
stiffness of polydimethylsiloxane elastomer substrates. Journal of Biomedical
Materials Research Part A. 2014.
Ataollahi F, Pingguan-Murphy B, Moradi A, Bakar Wan Abas WA, Chua KH, Abu
Osman NA. New method for the isolation of endothelial cells from large vessels.
Cytotherapy. 2014.


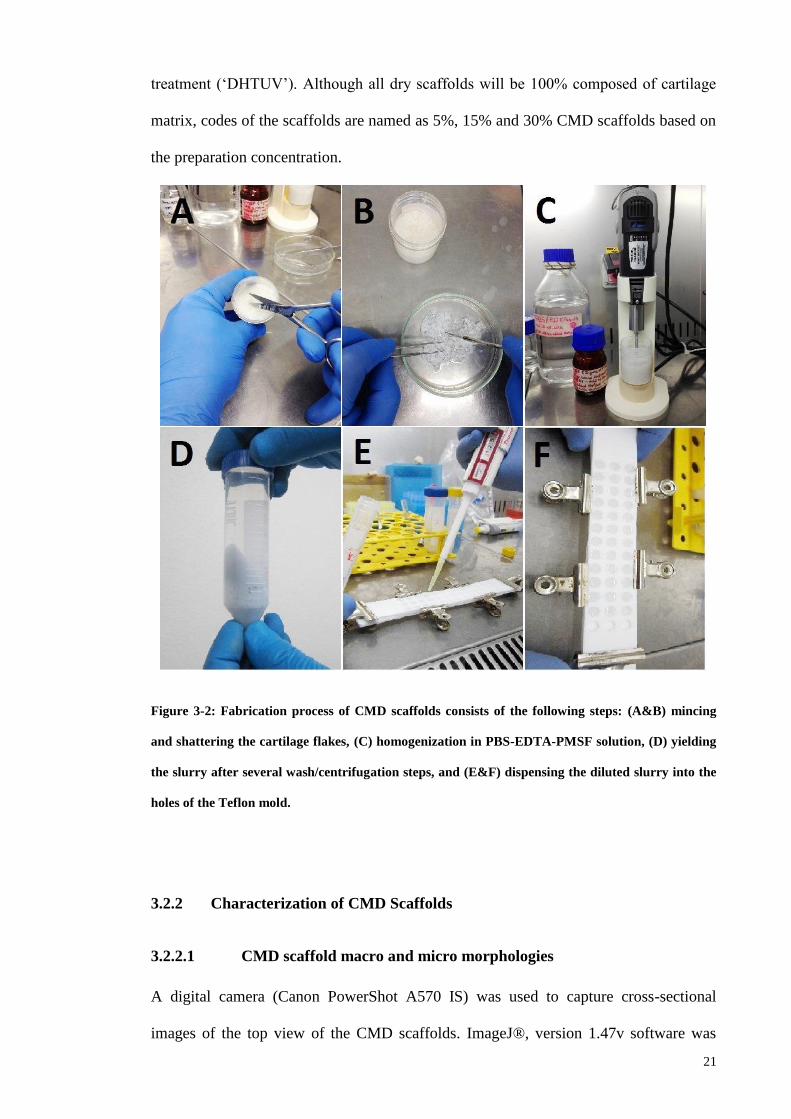


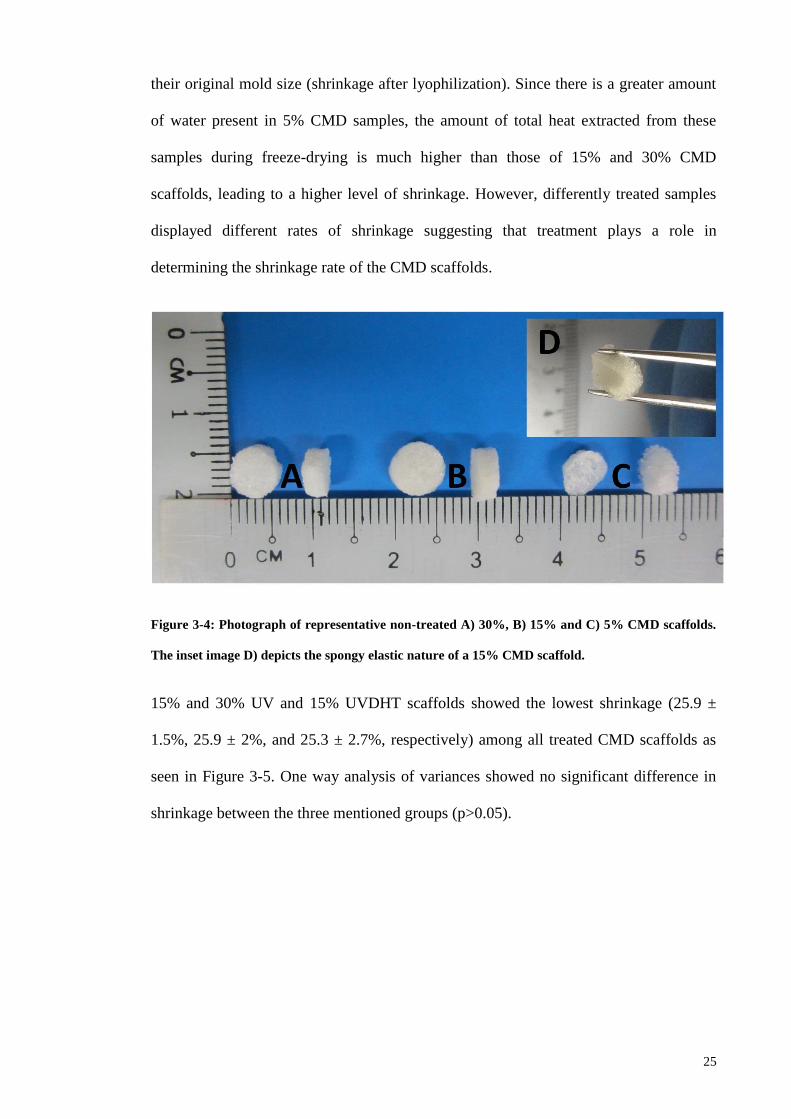


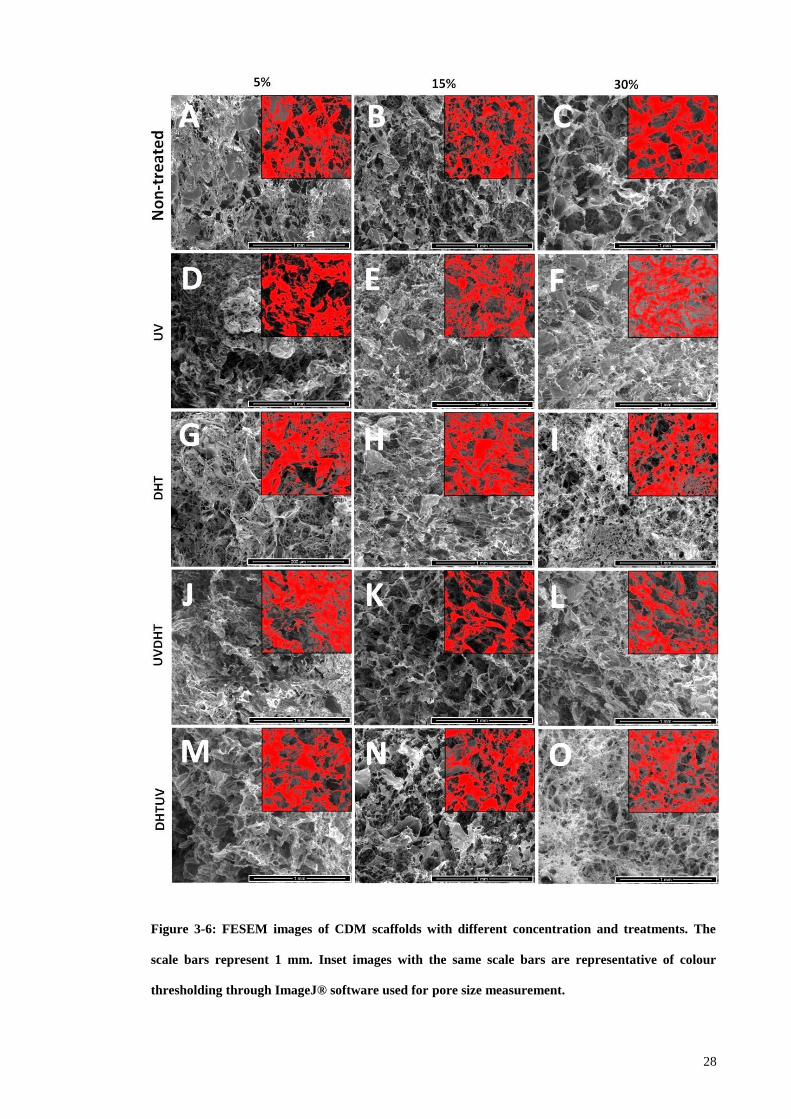
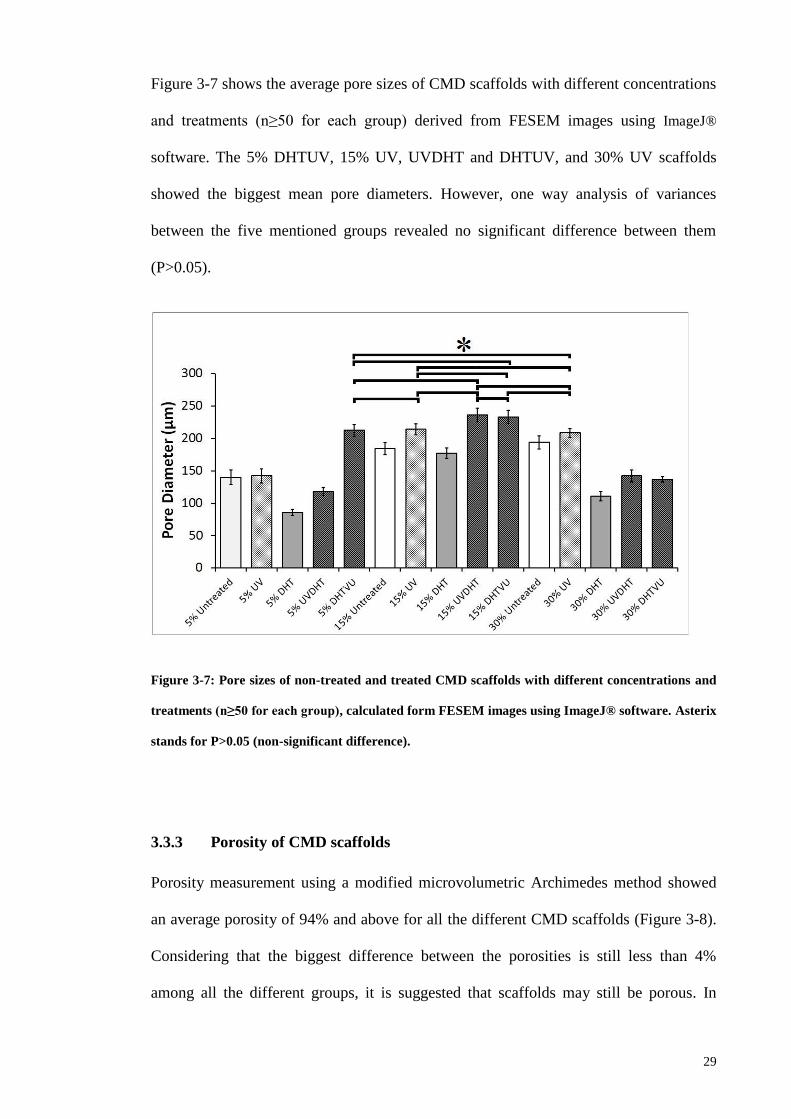


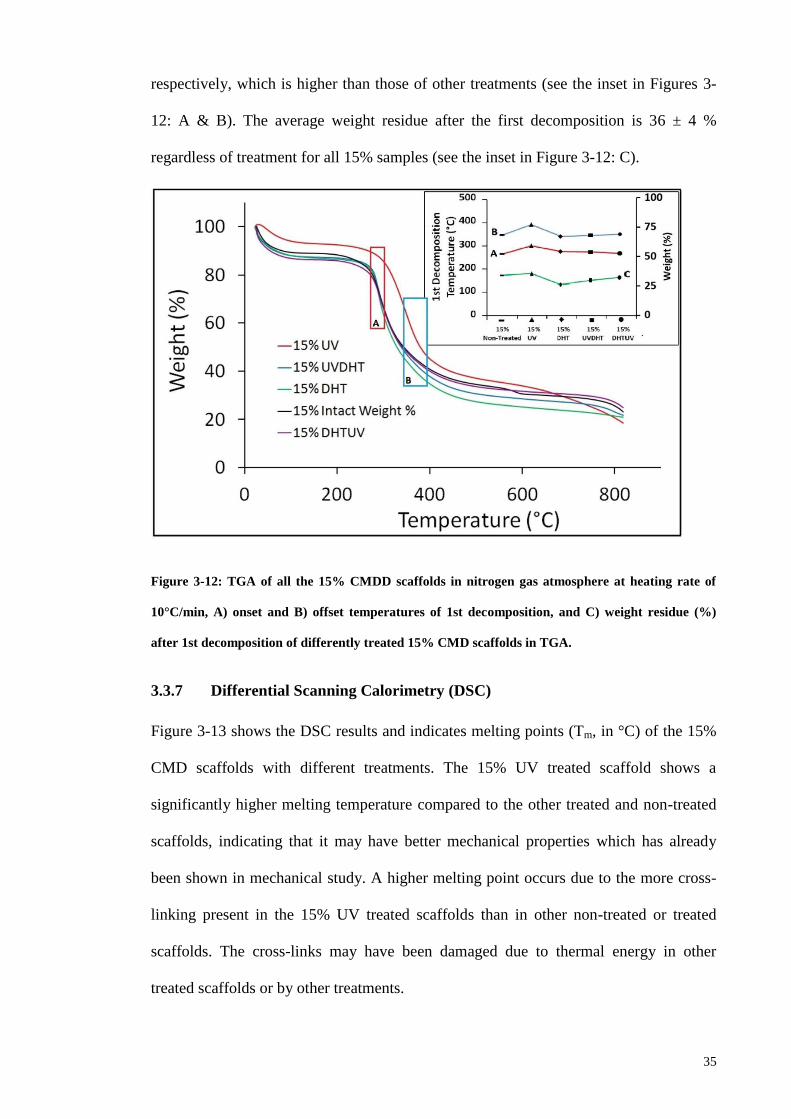


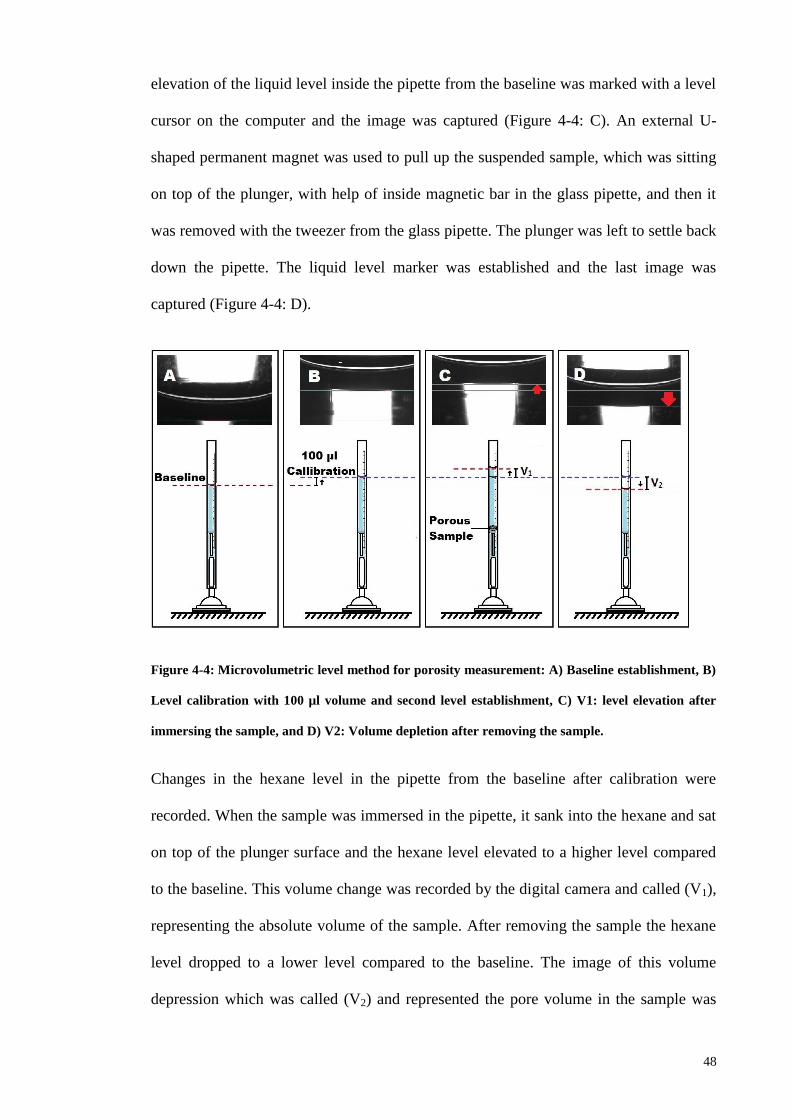
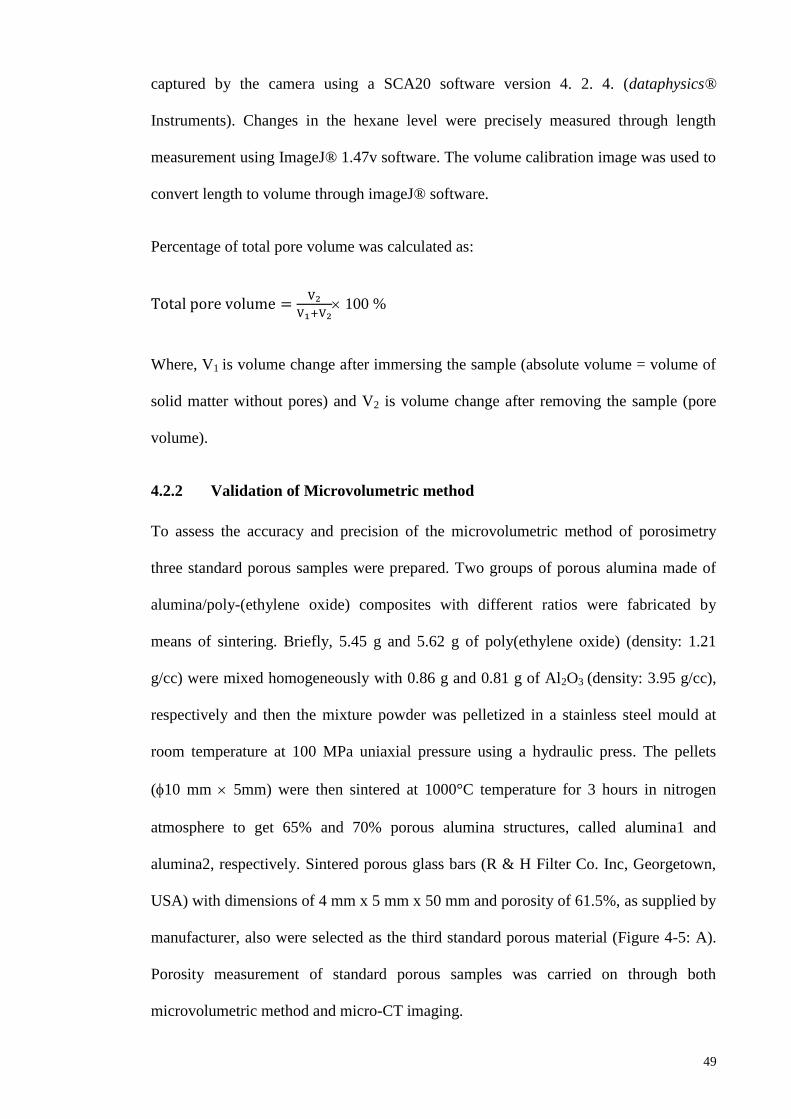


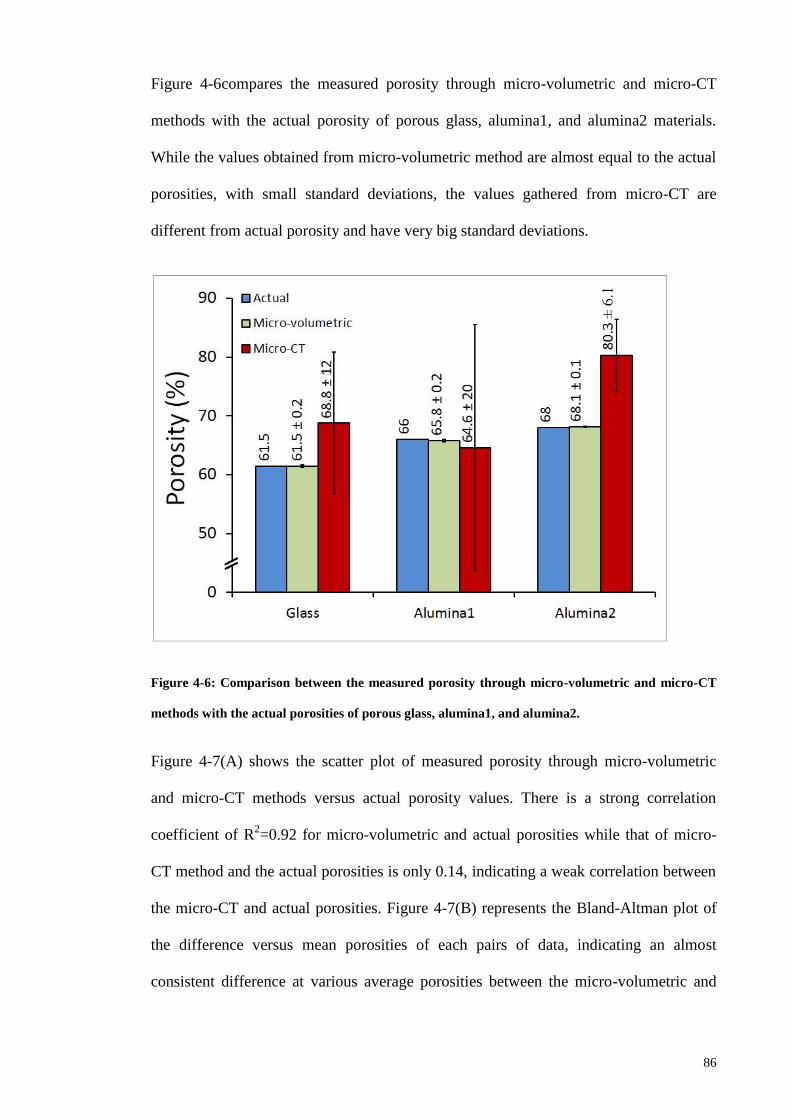


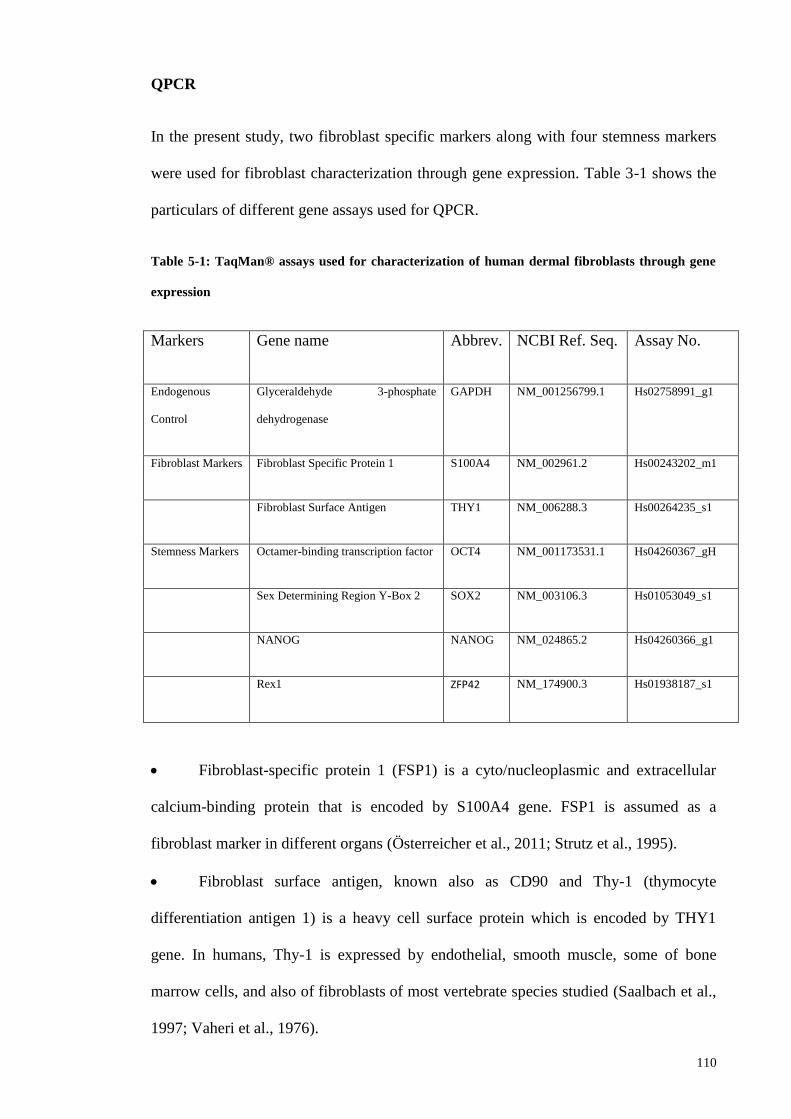


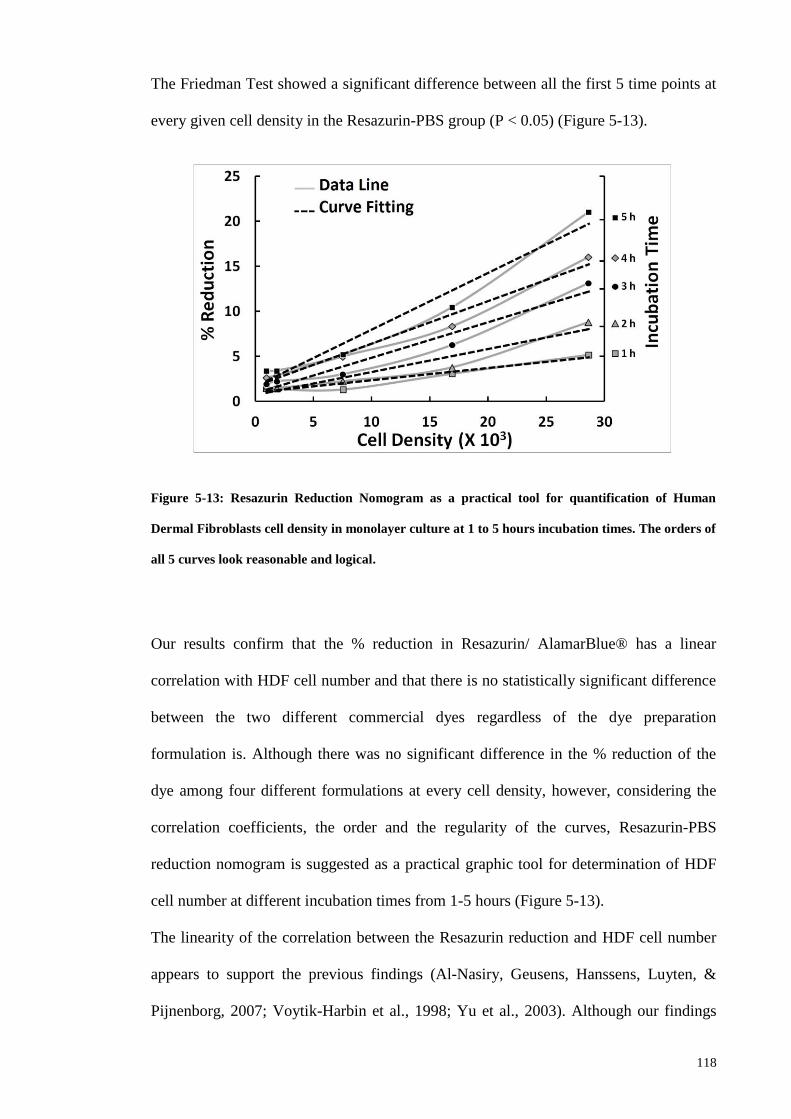


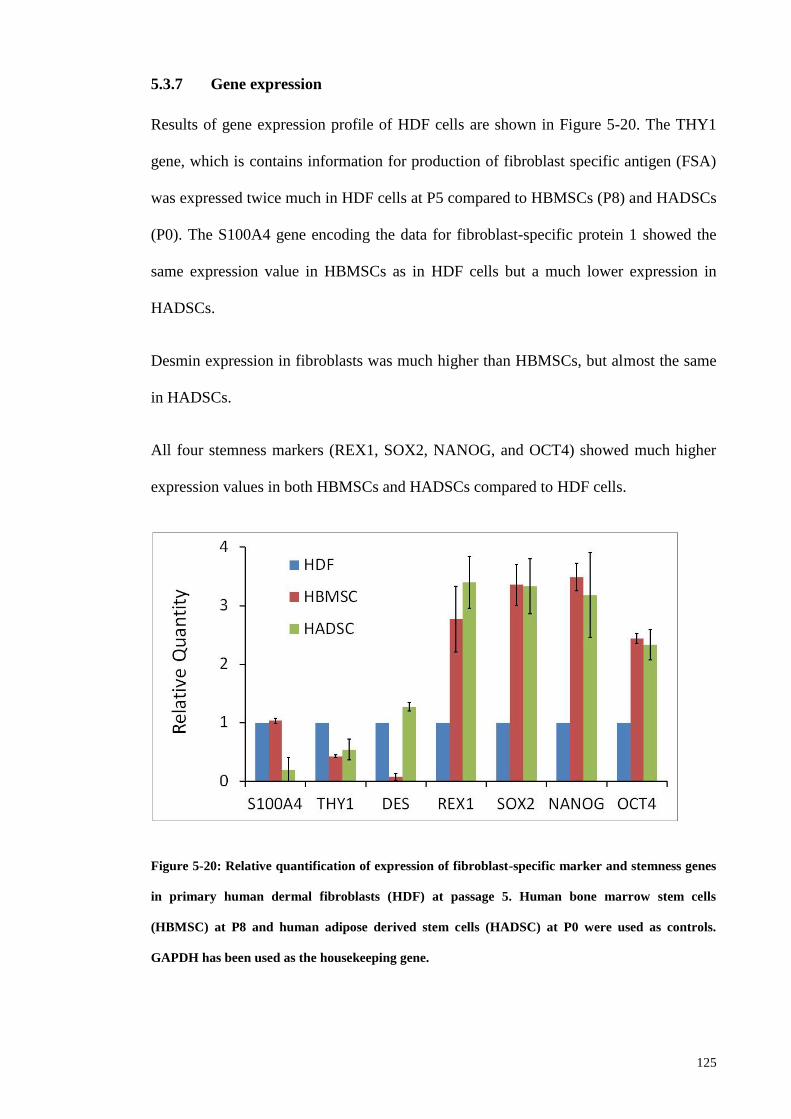


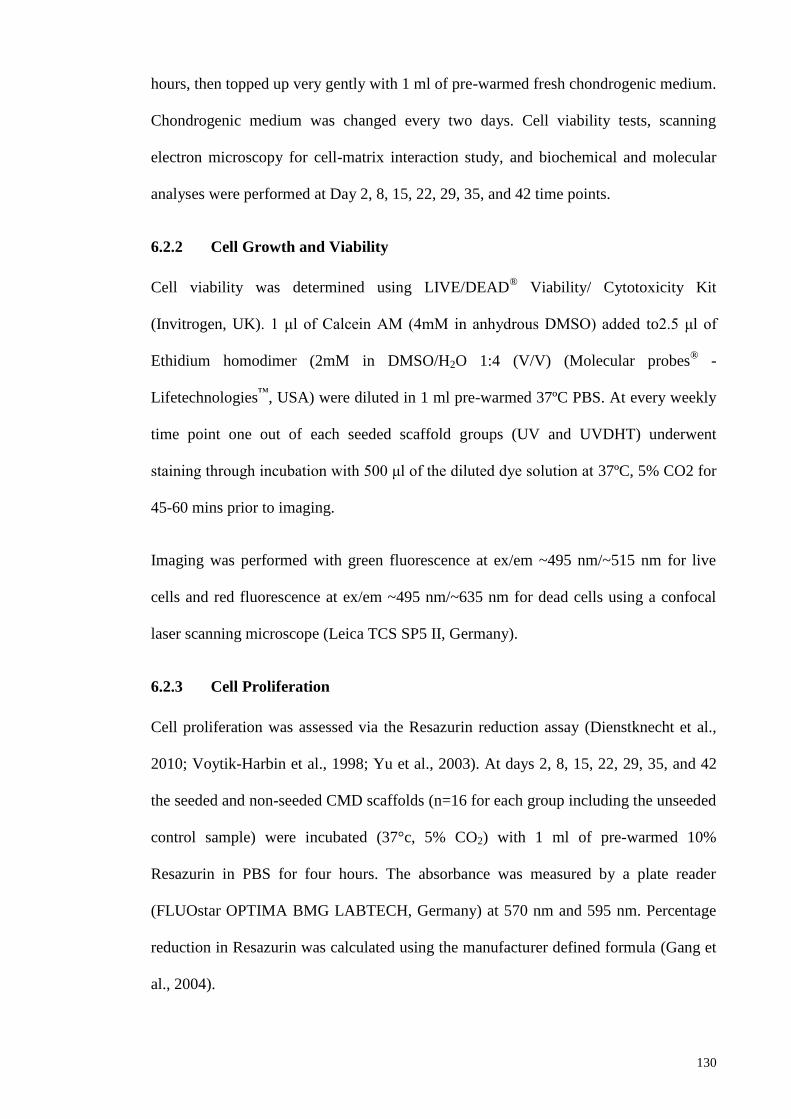


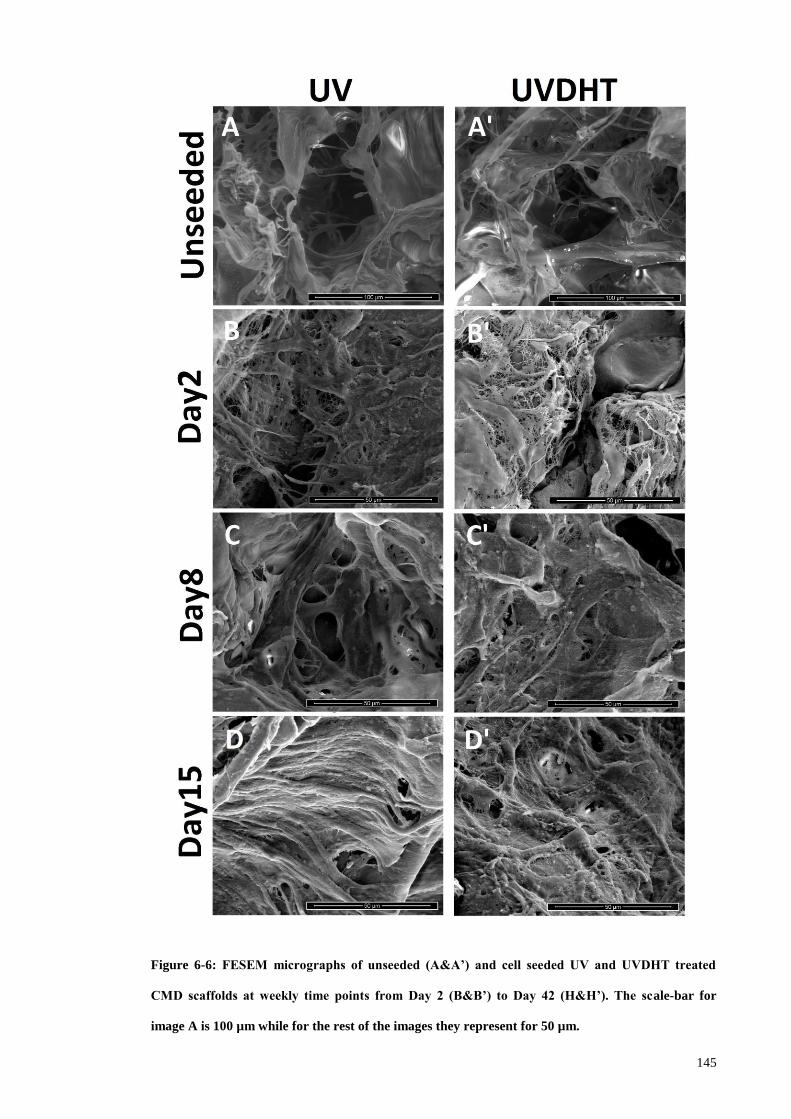

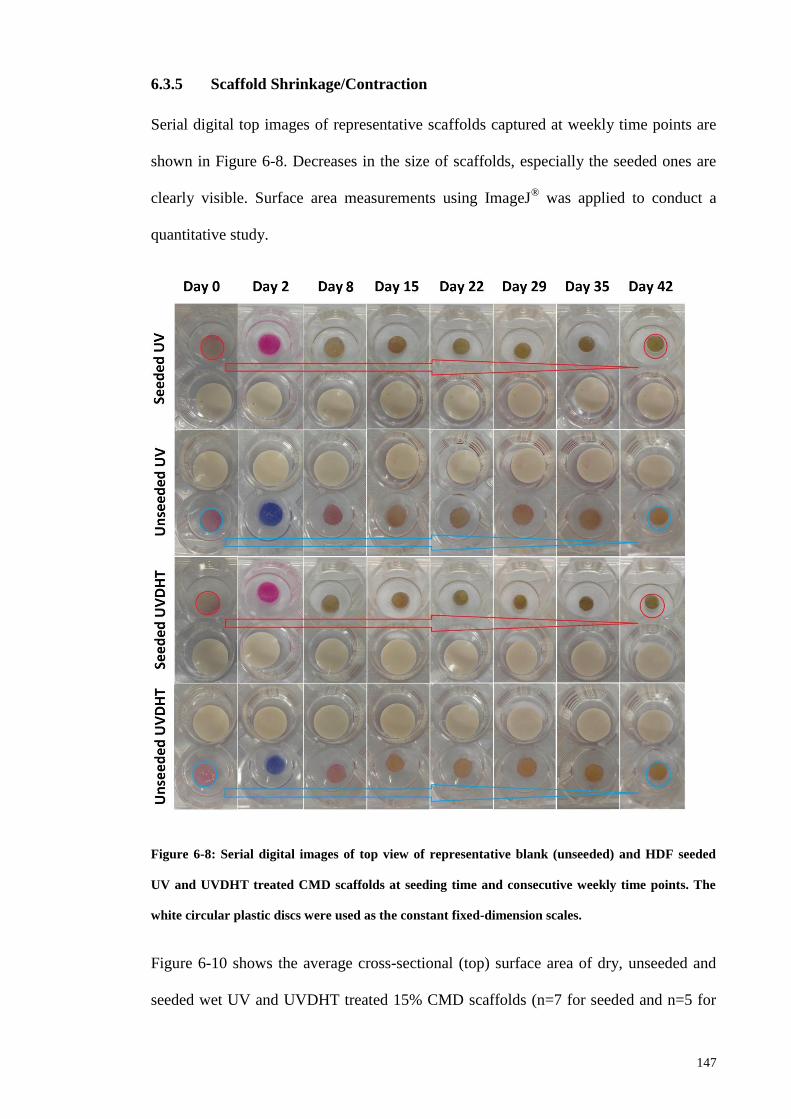


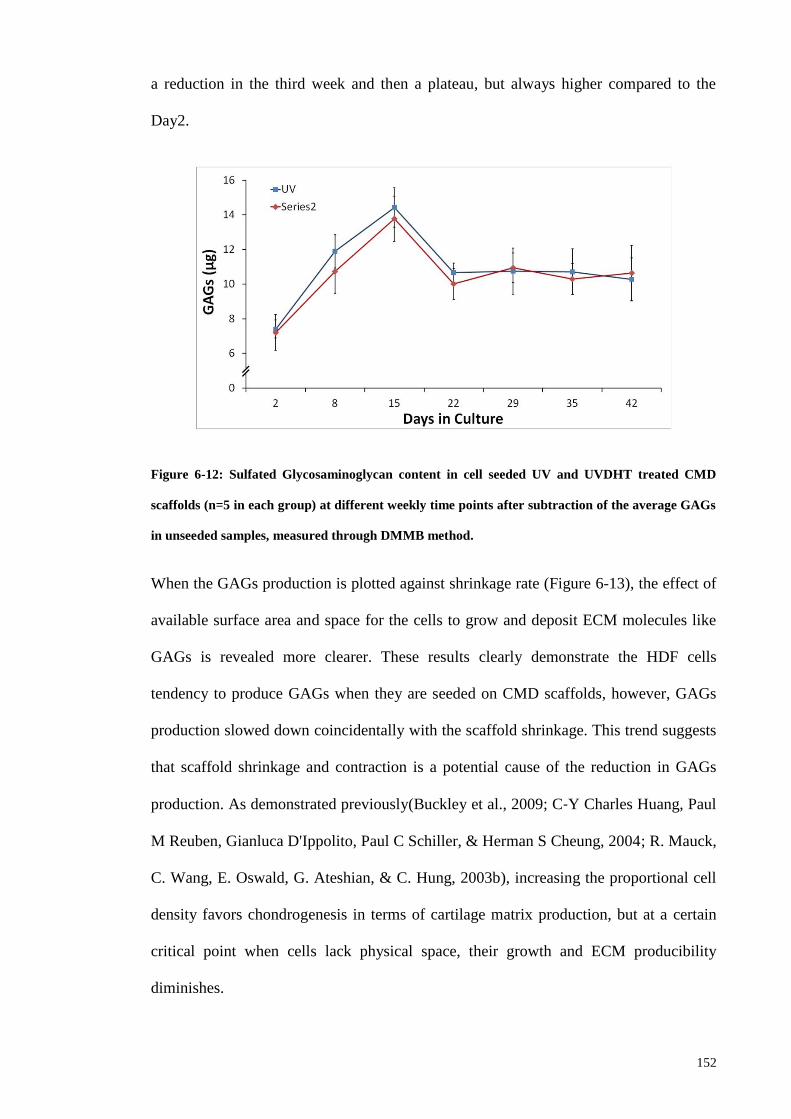


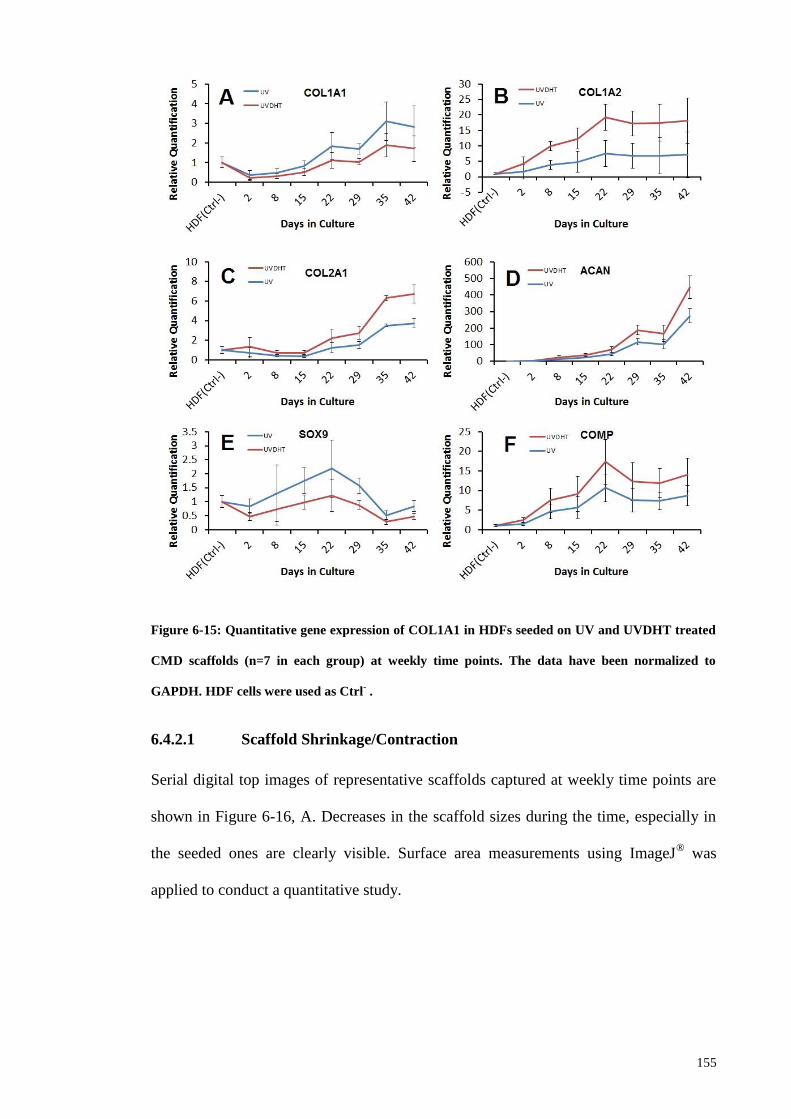


![Three-dimensional Hierarchical Metal oxide-Carbon ... · resazurin) with hydrogen as the electron donor (H 2-CO 2 [80:20]) at 30 °C under strict anaerobic conditions as previously](https://static.documents.pub/doc/80x56/5f7faa0b53f9093a5339e0d3/three-dimensional-hierarchical-metal-oxide-carbon-resazurin-with-hydrogen-as.jpg)


