52
| Date post: | 05-Jun-2019 |
| Category: |
Documents |
| Upload: | hoangkhanh |
| View: | 214 times |
| Download: | 0 times |

I | P a g e
AKNOWLEDGMENTS
I would like to express my gratitude to Professor Lars Wågberg for his help, guidance and trust
throughout this project, and my supervisor and everyone in the Fiber and Polymer Technology
Department for their help. I would especially like to thank Dr. Michael Reid, without whom this
project would have been impossible to accomplish.
I would also like to thank Alexandros E. Alexakis for his invaluable help and support. Finally yet
importantly, I would like to thank my mother, for without her guidance and support I would not
have been who I am today.

II | P a g e
ABSTRACT
In this study, the development of a cellulose-based membrane for use in Vanadium Redox Flow
Cell Batteries (VRFBs) was investigated. Cellulose is the most abundant biopolymer on earth and
due to its versatility it finds multiple applications. However, cellulose and its derivatives can be
easily hydrolyzed in the amorphous regions, under acidic conditions. In order to bypass this
problem and use this tough material in the highly acidic and oxidative environment of a VRFB,
two approaches were utilized. First, cellulose nanocrystals (CNCs) were employed, which
basically lack amorphous regions, to minimize the effect of hydrolysis. An additional advantage
is that CNCs can create films with specific stereochemistry, as they pack closely, in helical
structures. Second, the surface of the CNCs was modified with the use of trichloro(1H,1H,2H,2H-
perfluorooctyl)silane (TCPOS). This molecule has a long fluorocarbon chain, which acts
protectively towards hydrolysis of the CNCs. The choice of silane was made in order to produce
a material that can resemble Nafion, the most popular copolymer used in VRFBs. Nafion has a
fluorocarbon, Teflon-like, backbone and a hydrophilic side chain that consists of a sulfonic acid
groups.
The first step was to make a material that is stable under the VRFB conditions. The membranes
were characterized with AFM imaging, FTIR spectroscopy, contact angle measurements, and
tensile testing. With the use of the product of alkoxylation of TCPOS (TMPOS), hydrophobic
membranes were produced that exhibit contact angle with water larger than that of Nafion.
Young’s modulus of the membranes with TMPOS was larger compared to the one of CNC
membranes without TMPOS. To determine stability against acidic conditions, Dynamic Light
Scattering (DLS) was used. Additionally, stability of the membranes after acid and Vanadium
solution treatment was performed with gravimetric measurements. From the results, 67% of the
samples tested remained intact under high ionic strength and acidic conditions. In addition, the
effect of the amount of silane on the membranes was evaluated. The results of this study are
promising and encourages further research on this direction.
III | P a g e
SAMMANFATTNING
I denna studie undersöktes utvecklingen av ett cellulosabaserat membran för användning i
Vanadin redoxflödesbatterier (VRFB, en.). Cellulosa är den mest förekommande biopolymeren
på jorden och med dess mångsidighet finns många tillämpningar. Cellulosa, och dess derivat, kan
dessvärre enkelt hydrolyseras i amorfa regioner under sura förhållanden. För att kringgå detta
problem och för att kunna använda materialet i den sura och oxidativa miljö som förekommer i
ett VRFB, användes två tillvägagångssätt. Först användes cellulosananokristaller (CNC, en.) för
att minimera effekten av hydrolys, då de huvudsakligen saknar amorfa regioner. Ytterligare en
fördel är att man med CNC kan skapa filmer med specifik stereokemi, då de packas tätt i
spiralformade strukturer. Det andra tillvägagångssättet var att modifiera CNC-ytan med hjälp av
trikloro(1H,1H,2H,2H-perfluoroktyl)silan (TCPOS, en.). Denna molekyl har en lång fluorvätekedja,
som skyddar mot hydrolys av CNC. Silan valdes för att skapa ett material som liknar Nafion, som
är den vanligaste co-polymeren i VRFB. Nafion har en huvudkedja av fluorväte, liknande Teflon,
och en hydrofil sidokedja bestående av sulfonsyragrupper.
Det första steget var att göra ett material som är stabilt under de förhållanden som råder i ett
VRFB. Membranen karaktäriserades med hjälp av AFM, FTIR-spektroskopi,
kontaktvinkelmätningar och dragprov. Alkoxyleringsprodukten som erhölls ifrån TCPOS-
behandlingen användes för att tillverka hydrofoba membran med en kontaktvinkel mot vatten
som är större än för Nafion. Youngs modul för membran med TMPOS var större än för CNC-
membran utan TMPOS. För att klarlägga stabiliteten under sura förhållanden ändvändes DLS.
Dessutom testades membranens stabilitet efter syra- och vanadinlösningsbehandling genom
olika gravimetriska mätningar. Resultaten visade att 67 % av de testade proverna förblev intakta
under förhållanden med hög jonstyrka och surhet. Effekten av mängden använt silan i
membranen utvärderades också. Resultaten från denna studie är lovande och uppmuntrar till
vidare forskning i denna riktning.

IV | P a g e
LIST OF ABBREVIATIONS
CNC Cellulose Nanocrystal CNF Cellulose Nanofibril TCPOS Trichloro(1H,1H,2H,2H-perfluorooctyl)silane TMPOS Trimethoxy(1H,1H,2H,2H-perfluorooctyl)silane FTIR Fourier Transform Infrared DLS Dynamic Light Scattering NMR Nuclear Mass Spectroscopy RFB Redox Flow Cell Battery VRFB Vanadium Redox Flow Cell Battery
V | P a g e
Contents
AKNOWLEDGMENTS ......................................................................................................... I
ABSTRACT ........................................................................................................................ II
SAMMANFATTNING ........................................................................................................ III
LIST OF ABBREVIATIONS .................................................................................................. IV
1. Introduction ............................................................................................................. 1
2. Background .............................................................................................................. 3
3 Materials and Methods ............................................................................................. 8
3.1 Materials ......................................................................................................................... 8
3.2 Methods ......................................................................................................................... 8
3.2.1 Production of Cellulose Nanocrystals (CNCs) dispersion (CNC_LAB) (0.5 wt.%). ... 8
3.2.2 Aldehyde modified CNC (CNC-CHO) dispersion ..................................................... 9
3.2.3 Aldehyde modified cellulose nanofibril dispersion (CNF-CHO) .............................. 9
3.2.4 Production of CNC dispersion (CNC_M) (1.23 wt.%) ............................................ 10
3.2.5 Production of CNC dispersion (CNC_S) (2.23 wt.%) ............................................. 10
3.2.6 Production of CNC dispersion (CNC_mixed) (1.56 wt.%) ..................................... 10
3.2.7 Production of CNC dispersion (CNC_S1) (1 wt.%) ................................................ 10
3.2.8 Production of CNC_TMPOS dispersions ............................................................... 10
3.2.9 Production of Membrane CNC_plain ................................................................... 11
3.2.10 Production of Membrane CNC_TCPOS ................................................................. 11
3.2.11 Production of Membrane CNC_TCPOS_ultra ....................................................... 11
3.2.12 Alkoxylation of TCPOS .......................................................................................... 12
3.2.13 Production of Membrane CNC_TMPOS1 ............................................................. 12
3.2.14 Production of Membrane CNC_CHO .................................................................... 12
3.2.15 Production of Membrane CNC/CNF_CHO_TCPOS ............................................... 12
3.2.16 Production of CNC_TMPOS series of Membranes ............................................... 13
3.3 Characterizations .......................................................................................................... 13
3.3.1 Dynamic Light Scattering (DLS) ............................................................................. 13

VI | P a g e
3.3.2 Zeta potential ....................................................................................................... 14
3.3.3 Atomic Force Microscopy (AFM) .......................................................................... 14
3.3.4 Fourier Transform Infrared Spectrophotometry (FTIR) ........................................ 14
3.3.5 Contact Angle Measurements .............................................................................. 14
3.3.6 Nuclear Magnetic Resonance (NMR) ................................................................... 14
3.3.7 Optical Microscopy ............................................................................................... 14
3.3.8 Tensile strength measurements ........................................................................... 15
3.3.9 Stability measurements. ....................................................................................... 15
4 Results and Discussion ............................................................................................ 16
4.1 Dynamic Light Scattering (DLS) and zeta potential ...................................................... 16
4.2 Production of TMPOS from TCPOS ............................................................................... 17
4.3 Production of the membranes ..................................................................................... 18
4.4 Membrane Stability ...................................................................................................... 23
4.5 Fourier Transform Infrared Spectroscopy. ................................................................... 25
4.6 Microscopy and Optical Observations.......................................................................... 27
4.6.1 CNC_plain membrane........................................................................................... 29
4.6.2 CNC_TCPOS_ultra membrane .............................................................................. 30
4.6.3 CNC_TMPOS1 membrane ..................................................................................... 31
4.6.4 CNC_CHO membrane ........................................................................................... 32
4.6.5 CNC_TMPOS series of membranes....................................................................... 32
4.7 Contact Angle Measurements ...................................................................................... 34
4.8 Tensile testing ............................................................................................................... 35
5 Conclusions ............................................................................................................ 37
6 References ............................................................................................................. 38
Appendix I ..................................................................................................................... 40
Appendix II .................................................................................................................... 42
Appendix III ................................................................................................................... 43
Appendix IV ................................................................................................................... 44
1 | P a g e
1. Introduction
According to international organizations in Europe, in 2015, approximately 72.5% of all energy
was produced from non-renewable, fossil sources, such as coal and petroleum. Among the
countries of the European union, only Sweden, France and Finland exhibit energy consumption
from fossil sources below 50% 1. The Paris agreement, an agreement within the United Nations
Framework Convention on Climate Change (UNFCCC) brought together all nations at the climate
change front. Among the goals of the agreement that was signed by 194 states and the European
Union, is the increase of use of renewable sources of energy 2.
In terms of taking advantage of all renewable sources that our planet offers, an ideal solution
could be to store energy from solar panels in the Sahara and transfer it to cities close to the Arctic
Polar circle, which during winter have limited hours of light. In order to do so, technology such
as batteries and supercapacitors should be developed more, to become more efficient, among
other things, in terms of stability.
Batteries and supercapacitors are the dominant, so far, energy storage devices and according to
the different technology they employ, energy is stored within the electrode structure, in the
reactants that are fed externally in the cell, or in the redox species that flow into the
cell 3. The most desirable energy storage device would be able to store a great amount of energy,
have minimum or no energy loss, and provide energy on demand 4-5. In addition, it would be safe
and easy to use, economical, and would produce zero waste, being environmentally friendly. For
this purpose, scientists have been trying to improve the technology of batteries and
supercapacitors. From this effort, different types of batteries have been introduced during the
past years, each of them having advantages that make them suitable for energy storage devices
of choice and disadvantages which lead to a less broad use.
A technology that offers most of the desirable advantages is the one engaged in redox flow cell
batteries. These batteries were first employed by the National Aeronautic and Space
Administration in the United States of America (NASA) 6-9, in 1970 and have evolved ever since
to become only what could be considered as a better version. Energy and power separation is
the main advantage of these batteries, turning them into tailor made tools for energy storage
needs 3-5, 7, 10-11. One of the most studied system is the all-Vanadium Redox Flow Cell Battery
(VRFB), developed by the group of Skyllas-Kazacos, at the University of New South Wales 12.
A VRFB employs among other compartments, an ion-exchange membrane between the two
cells.

2 | P a g e
The material that is mostly used for a membrane of choice in a VRFB is Nafion, because it is stable
in the conditions of the cell and has satisfactory ion selectivity. However, this membrane still has
high Vanadium permeability 13. In addition, Nafion membranes are not considered to be “green”
and they are expensive 13-14. Replacing Nafion with a greener, less expensive membrane, that is
also stable under the cell conditions and ion selective is quite a challenge.
Cellulose is the most abundant biopolymer produced on earth and it is estimated that its annual
global production has reached 180 billion tons 15-16. It can be extracted from various organisms
such as plants, tunicates and some bacteria 17. Regardless of the organism from which this
biopolymer is extracted, its properties are almost identical. Multiple modifications for cellulose
have been developed, such as covalent or non-covalent surface modification, polymer grafting
and oxidation, to name a few 16. These modifications are aimed at giving cellulose unique and
very useful properties, namely flexibility, high mechanical strength and resistance to a variety of
demanding conditions 16-17.
In this study, the development of membranes for flow cells from Cellulose Nanocrystals (CNCs)
was attempted. CNCs were produced from the hydrolysis of cellulose fibers from cotton, which
is a cellulose rich substrate. Hydrolysis of the fibers results in cutting the amorphous regions of
cellulose fibers and fibrils. A basic absence of the amorphous regions gives CNCs a greater
stability under acidic conditions and the ability to pack tighter, leading to the production of
membranes with smaller pore size than what cellulose nanofibrils (CNFs) or fibers could create.
Even if CNC films can degrade slower in acidic conditions, it is hard to compete Nafion.
Modification of the CNCs before casting the films was required in order to achieve a higher level
of protection from the conditions in the VRFB. The compound of choice was a fluorinated silane,
more specifically, trichloro(1H,1H,2H,2H-perfluorooctyl)silane (TCPOS). Silane reactions with
cellulose have been extensively studied 16, 18-21. Silanization of the hydroxyl groups of the cellulose
repeating units and further polymerization of neighboring silane molecules can produce a
supporting network that acts as a protective agent for the CNC film as it reduces the direct
contact with acid in theory should increase the lifetime of the membrane. In addition, it can keep
the CNCs together when the film is exposed in aqueous solutions and becomes softer.
Additionally, the silane molecules that are not polymerized, act as softeners for the film, making
it less brittle, as they interfere with the interactions between the crystal structure.
Developing cellulose-based materials that can be employed under such hard conditions such as
the high acid concentration and highly oxidizing agents, such as Vanadium (V), sets the bar high.
Cellulose is known for being tough and versatile. However, it is easily hydrolyzed, even under
mild conditions. As a result, a cellulose-based material that can withstand the harsh conditions
of a VRFB, has various applications, not only limited to the electrochemistry field of science.

3 | P a g e
2. Background
Due to the energy crisis, i.e. the use of non-renewable energy sources, that is getting more
intense every year there is a lot of research dedicated on improving electrochemical energy
storage technologies, such as supercapacitors, regenerative fuel cells, Li-ion batteries and flow
batteries. The discharge time, lifetime, efficiency and typical power can vary significantly for
these technologies, as exhibited in Table 1.
Table 1: Electrochemical energy-storage technologies for stationary applications4
Technology
Typical
Power
(MW)
Discharge
Time
Storage
Capacity
Cost
($/kWh)
Life time
(cycle/years)
Efficiency
(%)
Drawbacks
Supercapacitors
0.25
<1 min
500-3000
500000/20
>90
Explosion hazard,
low energy density,
cost
Regenerative fuel
cells with
hydrogen storage
10
>5h
13
40-50
Low-density
storage, high cost,
safety
Li-ion batteries
1-5 h
400-600
750-3000/6-8
80-90
Cost, safety, short
lifetime,
self-discharge,
temperature
sensitive
Vanadium flow
battery
0.5-12 10 h 150-2500 500-2000/10 70 Low energy density
2.1 Redox Flow Cell Batteries (RFBs)
2.1.1 History and Development
The first redox flow cell battery was employed by L. H. Thaller, in the 1970s, for the National
Aeronautic and Space Administration in America (NASA) 6-9. After trying different redox couples
and electrolytes, the final system employed as redox couple Cr3+/Cr2+ and Fe3+/Fe2+.

4 | P a g e
(a) (b)
Other metals such as Titanium and Vanadium were also evaluated, and discarded, mainly due to
high cost. The iron RFB was preferred because of its high cell potential and low cost.
The system presents some important advantages, such as simple and electrochemically
reversible reactions and high exchange current densities. The use of mixed electrolytes and
catalysts were employed in order to improve the performance of the battery. Additionally, the
use of microporous membranes was evaluated and rejected as an improvement, because it
causes lower current efficiency 7.
The main advantage of the system is the ability to separate power and energy. This tailor made
approach is one of the main reasons why RFBs are appealing to the energy industry. Many
different technologies have been employed in flow batteries since they were first introduced. To
name a few, all-liquid flow batteries with aqueous electrolytes such as the iron-chromium
battery, the all-Vanadium RFB (VRFB), the polysulfide-bromine RFB, flow batteries with metal
anode, such as zinc-halogen RFBs, flow batteries with hydrogen anode and others 4. In Figure 1,
an all-liquid flow cell and a flow cell with gas cathode are schematically presented. All of these
systems have undeniable advantages, but also disadvantages that prevent them from being
widely commercialized. Flow batteries can be utilized mainly in stationary applications, such as
household electrical needs. However, systems under development, offer the possibility of use in
means of transportation 4, 11. There are also certain configurations of the flow cell systems, in
which there is no actual flow of material in the cell. The energy is stored in the electrolyte, which
takes part in redox reactions on the electrode surface. This is one of RFB’s main advantages; the
possibility to store energy in the electrolyte, which is stored externally of the cell 5, 7, 11, 22.
Figure 1: Schematics of (a) an all-liquid redox flow cell and (b) a redox flow cell with a gas cathode 4.
2.1.2 Operation
Redox Flow Batteries (RFB) use the electrons transferred between two species of the redox
couple they employ. The electrolyte is stored in external tanks and flows in the cell with the use
of pumps. The electrolyte of the anode is called anolyte and the electrolyte of the cathode is
called catholyte.
5 | P a g e
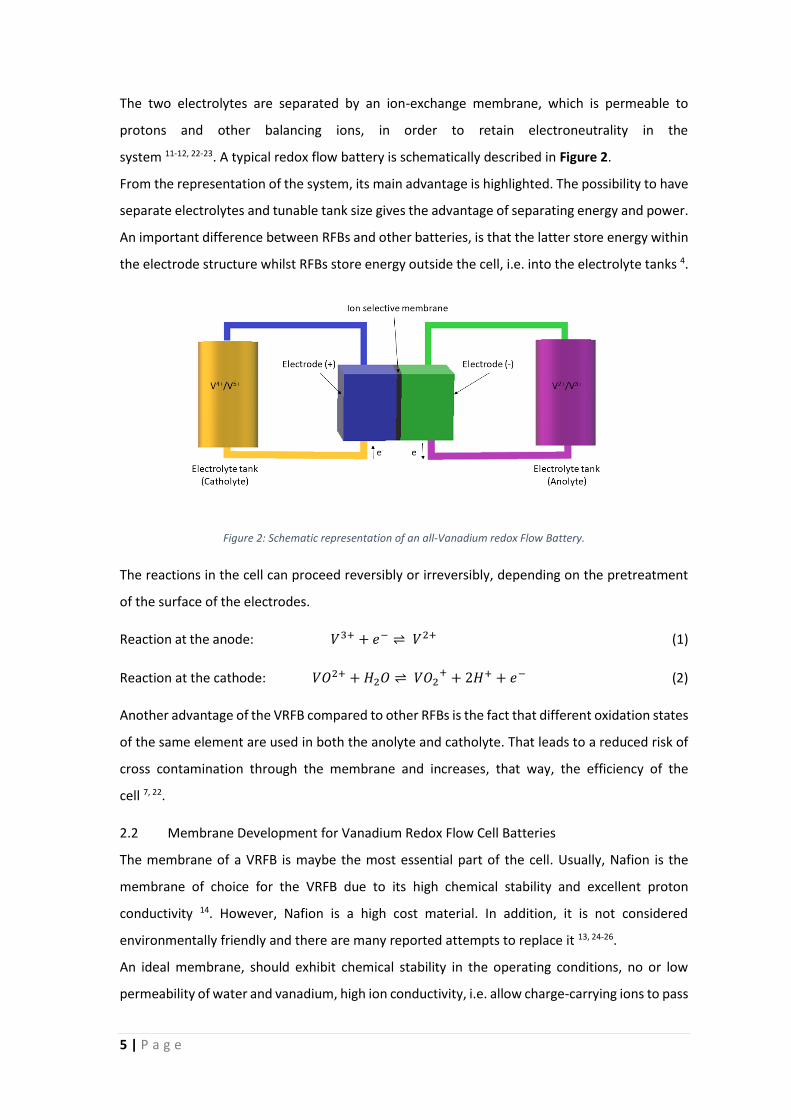
The two electrolytes are separated by an ion-exchange membrane, which is permeable to
protons and other balancing ions, in order to retain electroneutrality in the
system 11-12, 22-23. A typical redox flow battery is schematically described in Figure 2.
From the representation of the system, its main advantage is highlighted. The possibility to have
separate electrolytes and tunable tank size gives the advantage of separating energy and power.
An important difference between RFBs and other batteries, is that the latter store energy within
the electrode structure whilst RFBs store energy outside the cell, i.e. into the electrolyte tanks 4.
Figure 2: Schematic representation of an all-Vanadium redox Flow Battery.
The reactions in the cell can proceed reversibly or irreversibly, depending on the pretreatment
of the surface of the electrodes.
Reaction at the anode: 𝑉3+ + 𝑒− ⇌ 𝑉2+ (1)
Reaction at the cathode: 𝑉𝑂2+ + 𝐻2𝑂 ⇌ 𝑉𝑂2+ + 2𝐻+ + 𝑒− (2)
Another advantage of the VRFB compared to other RFBs is the fact that different oxidation states
of the same element are used in both the anolyte and catholyte. That leads to a reduced risk of
cross contamination through the membrane and increases, that way, the efficiency of the
cell 7, 22.
2.2 Membrane Development for Vanadium Redox Flow Cell Batteries
The membrane of a VRFB is maybe the most essential part of the cell. Usually, Nafion is the
membrane of choice for the VRFB due to its high chemical stability and excellent proton
conductivity 14. However, Nafion is a high cost material. In addition, it is not considered
environmentally friendly and there are many reported attempts to replace it 13, 24-26.
An ideal membrane, should exhibit chemical stability in the operating conditions, no or low
permeability of water and vanadium, high ion conductivity, i.e. allow charge-carrying ions to pass

6 | P a g e
through, in order to preserve electroneutrality of the electrolytes, excellent proton conductivity,
since protons participate in the redox reactions (reaction of cathode, (2)).
In addition, it should have low cost and low resistivity to maximize efficiency by minimizing
energy loss in the cell 13, 25-26.
Nafion is a copolymer of perfluorinated vinyl ether with tetrafluoroethylene, developed by the
E. I, Du Pont Company in the late 1960s 27.
As it is presented in Figure 3, Nafion has a fluorocarbon,
Teflon-like, backbone and a hydrophilic side chain that
consists of sulfonic acid groups. The main advantage of
Nafion that makes it ideal for fuel-cell applications is its
excellent proton conductivity. The copolymer creates a
specific structure of channels that is presented in
Figure 4. This structure was suggested by Gierke et. al,
in 1981 and it is thought to be responsible for this high
conductivity 28.
The morphology of Nafion has been extensively studied, since the membrane has good proton
conducting properties, serving as a suitable membrane for fuel cells applications. There are
different models to explain the structure and different methods, such as small angle X-ray
scattering (SAXR), Fourier-Transform Infrared spectroscopy (FTIR) and Transmission Electron
Microscopy (TEM). The conclusions from the studies are that there is no long-range patterned
organization of the Nafion molecules, i.e. sulfonic acid group clusters in a hydrophobic,
perfluorocarbon, phase. Additionally, the hydrophilic-hydrophobic interfaces do not exhibit a
phase discontinuity but they are rather characterized as “rough” 14, 27.
Figure 4: Schematic representation of the model of hydrated Nafion 27.
One of the goals of this study is to test if a structure of cellulose and a fluorocarbon material
similar to Nafion is possible.
Figure 3: Basic structure of Nafion
copolymer.
7 | P a g e
2.3 Cellulose and cellulose-based materials
Cellulose is the most abundant biopolymer with an annual global production exceeding 180
billion tons 16. Cellulose is a polysaccharide of D-glucose units connected via β(1,4)-glucosidic
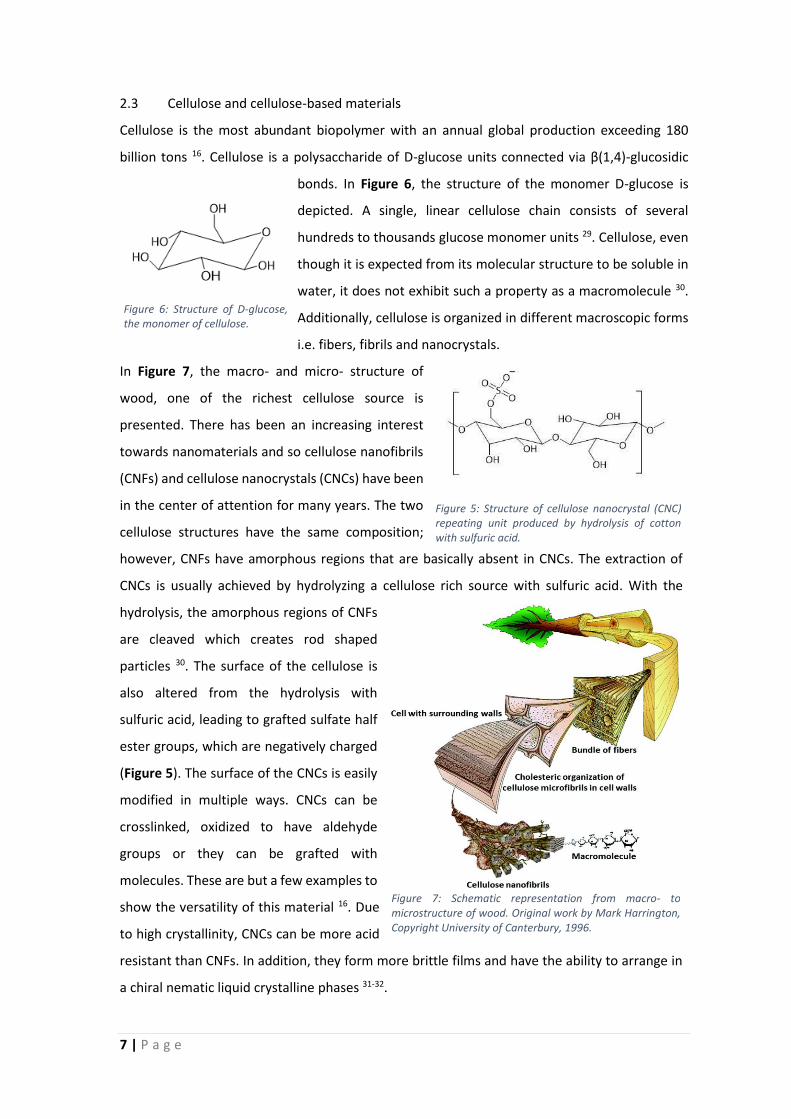
bonds. In Figure 6, the structure of the monomer D-glucose is
depicted. A single, linear cellulose chain consists of several
hundreds to thousands glucose monomer units 29. Cellulose, even
though it is expected from its molecular structure to be soluble in
water, it does not exhibit such a property as a macromolecule 30.
Additionally, cellulose is organized in different macroscopic forms
i.e. fibers, fibrils and nanocrystals.
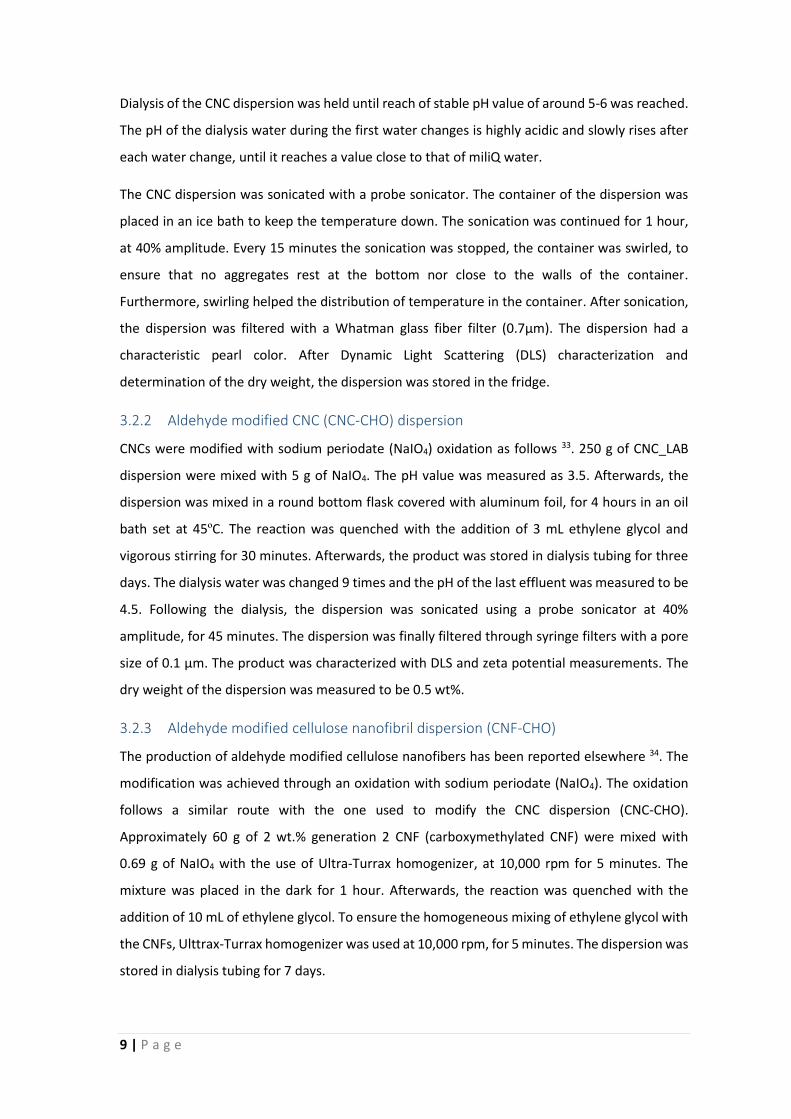
In Figure 7, the macro- and micro- structure of
wood, one of the richest cellulose source is
presented. There has been an increasing interest
towards nanomaterials and so cellulose nanofibrils
(CNFs) and cellulose nanocrystals (CNCs) have been
in the center of attention for many years. The two
cellulose structures have the same composition;
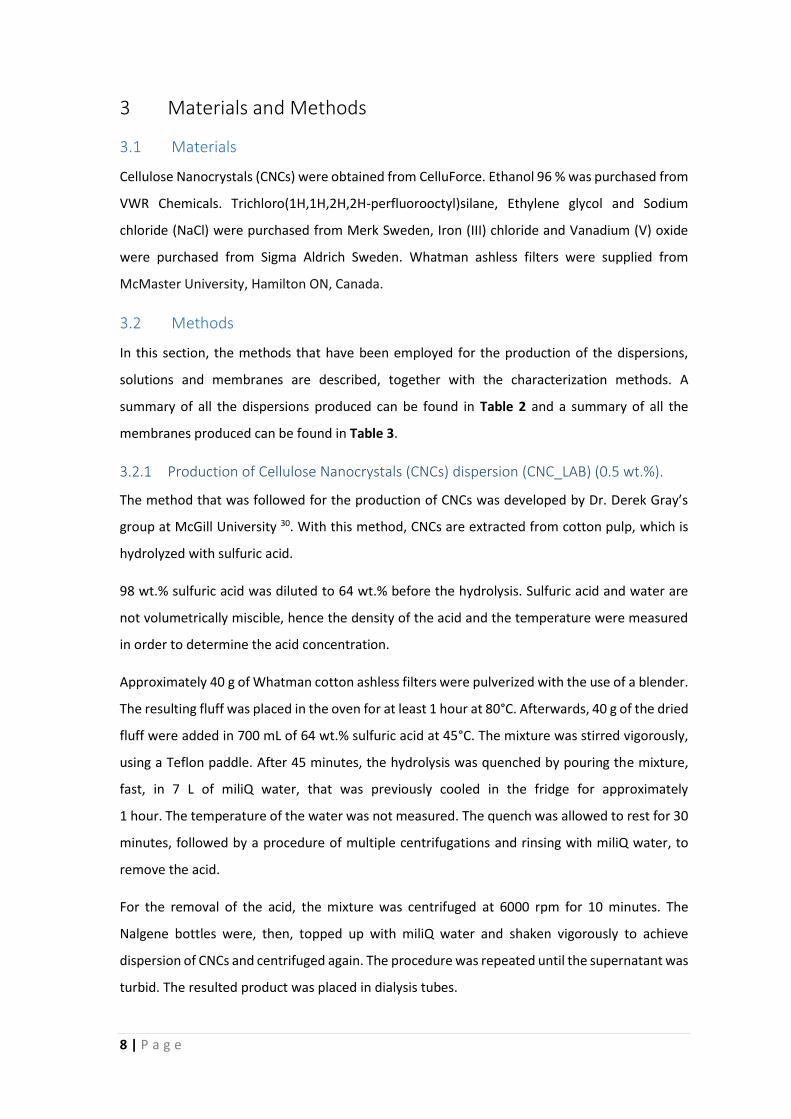
however, CNFs have amorphous regions that are basically absent in CNCs. The extraction of
CNCs is usually achieved by hydrolyzing a cellulose rich source with sulfuric acid. With the
hydrolysis, the amorphous regions of CNFs
are cleaved which creates rod shaped
particles 30. The surface of the cellulose is
also altered from the hydrolysis with
sulfuric acid, leading to grafted sulfate half
ester groups, which are negatively charged
(Figure 5). The surface of the CNCs is easily
modified in multiple ways. CNCs can be
crosslinked, oxidized to have aldehyde
groups or they can be grafted with
molecules. These are but a few examples to
show the versatility of this material 16. Due
to high crystallinity, CNCs can be more acid
resistant than CNFs. In addition, they form more brittle films and have the ability to arrange in
a chiral nematic liquid crystalline phases 31-32.
Figure 6: Structure of D-glucose, the monomer of cellulose.
Figure 7: Schematic representation from macro- to microstructure of wood. Original work by Mark Harrington, Copyright University of Canterbury, 1996.
Figure 5: Structure of cellulose nanocrystal (CNC) repeating unit produced by hydrolysis of cotton with sulfuric acid.
8 | P a g e
3 Materials and Methods
3.1 Materials
Cellulose Nanocrystals (CNCs) were obtained from CelluForce. Ethanol 96 % was purchased from
VWR Chemicals. Trichloro(1H,1H,2H,2H-perfluorooctyl)silane, Ethylene glycol and Sodium
chloride (NaCl) were purchased from Merk Sweden, Iron (III) chloride and Vanadium (V) oxide
were purchased from Sigma Aldrich Sweden. Whatman ashless filters were supplied from
McMaster University, Hamilton ON, Canada.
3.2 Methods
In this section, the methods that have been employed for the production of the dispersions,
solutions and membranes are described, together with the characterization methods. A
summary of all the dispersions produced can be found in Table 2 and a summary of all the
membranes produced can be found in Table 3.
3.2.1 Production of Cellulose Nanocrystals (CNCs) dispersion (CNC_LAB) (0.5 wt.%).
The method that was followed for the production of CNCs was developed by Dr. Derek Gray’s
group at McGill University 30. With this method, CNCs are extracted from cotton pulp, which is
hydrolyzed with sulfuric acid.
98 wt.% sulfuric acid was diluted to 64 wt.% before the hydrolysis. Sulfuric acid and water are
not volumetrically miscible, hence the density of the acid and the temperature were measured
in order to determine the acid concentration.
Approximately 40 g of Whatman cotton ashless filters were pulverized with the use of a blender.
The resulting fluff was placed in the oven for at least 1 hour at 80°C. Afterwards, 40 g of the dried
fluff were added in 700 mL of 64 wt.% sulfuric acid at 45°C. The mixture was stirred vigorously,
using a Teflon paddle. After 45 minutes, the hydrolysis was quenched by pouring the mixture,
fast, in 7 L of miliQ water, that was previously cooled in the fridge for approximately
1 hour. The temperature of the water was not measured. The quench was allowed to rest for 30
minutes, followed by a procedure of multiple centrifugations and rinsing with miliQ water, to
remove the acid.
For the removal of the acid, the mixture was centrifuged at 6000 rpm for 10 minutes. The
Nalgene bottles were, then, topped up with miliQ water and shaken vigorously to achieve
dispersion of CNCs and centrifuged again. The procedure was repeated until the supernatant was
turbid. The resulted product was placed in dialysis tubes.
9 | P a g e
Dialysis of the CNC dispersion was held until reach of stable pH value of around 5-6 was reached.
The pH of the dialysis water during the first water changes is highly acidic and slowly rises after
each water change, until it reaches a value close to that of miliQ water.
The CNC dispersion was sonicated with a probe sonicator. The container of the dispersion was
placed in an ice bath to keep the temperature down. The sonication was continued for 1 hour,
at 40% amplitude. Every 15 minutes the sonication was stopped, the container was swirled, to
ensure that no aggregates rest at the bottom nor close to the walls of the container.
Furthermore, swirling helped the distribution of temperature in the container. After sonication,
the dispersion was filtered with a Whatman glass fiber filter (0.7μm). The dispersion had a
characteristic pearl color. After Dynamic Light Scattering (DLS) characterization and
determination of the dry weight, the dispersion was stored in the fridge.
3.2.2 Aldehyde modified CNC (CNC-CHO) dispersion
CNCs were modified with sodium periodate (NaIO4) oxidation as follows 33. 250 g of CNC_LAB
dispersion were mixed with 5 g of NaIO4. The pH value was measured as 3.5. Afterwards, the
dispersion was mixed in a round bottom flask covered with aluminum foil, for 4 hours in an oil
bath set at 45ºC. The reaction was quenched with the addition of 3 mL ethylene glycol and
vigorous stirring for 30 minutes. Afterwards, the product was stored in dialysis tubing for three
days. The dialysis water was changed 9 times and the pH of the last effluent was measured to be
4.5. Following the dialysis, the dispersion was sonicated using a probe sonicator at 40%
amplitude, for 45 minutes. The dispersion was finally filtered through syringe filters with a pore
size of 0.1 μm. The product was characterized with DLS and zeta potential measurements. The
dry weight of the dispersion was measured to be 0.5 wt%.
3.2.3 Aldehyde modified cellulose nanofibril dispersion (CNF-CHO)
The production of aldehyde modified cellulose nanofibers has been reported elsewhere 34. The
modification was achieved through an oxidation with sodium periodate (NaIO4). The oxidation
follows a similar route with the one used to modify the CNC dispersion (CNC-CHO).
Approximately 60 g of 2 wt.% generation 2 CNF (carboxymethylated CNF) were mixed with
0.69 g of NaIO4 with the use of Ultra-Turrax homogenizer, at 10,000 rpm for 5 minutes. The
mixture was placed in the dark for 1 hour. Afterwards, the reaction was quenched with the
addition of 10 mL of ethylene glycol. To ensure the homogeneous mixing of ethylene glycol with
the CNFs, Ulttrax-Turrax homogenizer was used at 10,000 rpm, for 5 minutes. The dispersion was
stored in dialysis tubing for 7 days.
10 | P a g e
The following dispersions were produced by re-dispersing CNCs in miliQ water. The aiming dry
weight was 1 wt.% and since an amount of CNC aggregated particles were unable to disperse
with sonication, they were removed with filtration. As a result, dispersions with various dry
weight were produced, which then were diluted or concentrated, to obtain the aiming dry
weight.
3.2.4 Production of CNC dispersion (CNC_M) (1.23 wt.%)
1.5 g of CNC (CelluForce) were added in 100 mL of miliQ water under vigorous stirring. The
dispersion was stirred overnight. Afterwards, the dispersion was sonicated using a probe
sonicator at 35% amplitude and then filtered with 1.2 μm syringe filters with supor membrane
(Acrodisc). The dispersion was characterized with DLS and the dry weight was measured.
3.2.5 Production of CNC dispersion (CNC_S) (2.23 wt.%)
2.5 g of CNC (CelluForce) were added in 100 mL miliQ water under vigorous stirring The
dispersion was stirred overnight. Afterwards, the dispersion was sonicated using a probe
sonicator at 35% amplitude and then filtered with 1.2 μm syringe filters with Supor membrane
(Acrodisc). The dispersion was characterized with DLS and the dry weight was measured.
3.2.6 Production of CNC dispersion (CNC_mixed) (1.56 wt.%)
16 mL from dispersion CNC_M were diluted to a final concentration of 0.5 wt.% and mixed with
8 mL of dispersion CNC_S. The final concentration of dispersion CNC_mixed was calculated to be
1.56 wt.%.
3.2.7 Production of CNC dispersion (CNC_S1) (1 wt.%)
1.1015 g of CNC from CelluForce were added in 100 mL of miliQ water under vigorous stirring.
The dispersion was stirred overnight and sonicated, as described in the production of dispersion
CNC_Cellu_S. The dispersion CNC_Cellu_S1 was mixed with a volume of dispersion CNC_Cellu_S,
until final dry content of 1 wt.%.
3.2.8 Production of CNC_TMPOS dispersions
Four dispersions with different concentrations of the product of methoxylation of
trichloro(1H,1H,2H,2H-perfluorooctyl)silane (TCPOS) were prepared. The product, TMPOS, was
heated to 60 ºC for 1 hour and the product was immediately used in the dispersions. In the first
dispersion (CNC_0TMPOS), no TMPOS was added. In the second (CNC_0.5TMPOS), third
(CNC_TMPOS) and last one (CNC_1.5TMPOS), 0.0945 g, 0.1890 g and 0.2835 g of TMPOS were
added dropwise, respectively, under vigorous stirring.

11 | P a g e
Table 2: Summary of all the dispersions prepared.
Dispersion Name Composition and dry weight
CNC_LAB CNCs, 0.5 wt.%
CNC-CHO Aldehyde modified CNCs, 0.5 wt.%
CNF-CHO Aldehyde modified CNFs, 0.7 wt.%
CNC_M CNCs from CelluForce, 1.23 wt.%
CNC_S CNCs from CelluForce, 2.23 wt.%
CNC_mixed CNCs from CelluForce, 1.56 wt.%
CNC_S1 CNCs from CelluForce, 1 wt.%
CNC_0TMPOS Lab made CNCs 0.9 wt. %
CNC_0.5TMPOS Lab made CNCs 0.9 wt. % TMPOS 0.0945 g
CNC_TMPOS Lab made CNCs 0.9 wt. % TMPOS 0.1890 g
CNC_1.5TMPOS Lab made CNCs 0.9 wt. % TMPOS 0.2835 g
3.2.9 Production of Membrane CNC_plain
8 mL of ethanol were added in 32 mL of dispersion CNC_S, slowly, under stirring. The dispersion
was added into two Petri dishes of 7.5 cm diameter and left to dry under the fumehood.
3.2.10 Production of Membrane CNC_TCPOS
8 mL of ethanol were added in 32 mL of dispersion CNC_S, slowly, under stirring. In the
dispersion, 0.6343 g of trichloro(1H,1H,2H,2H-perfluorooctyl)silane (TCPOS) were added
dropwise, under vigorous stirring. The dispersion was casted into two Petri dishes of 7.5 cm
diameter and left to dry under the fumehood.
3.2.11 Production of Membrane CNC_TCPOS_ultra
75 mL of dispersion CNC_S1 were slowly mixed with 25mL of ethanol. In the mixture 0.13 g of
TCPOS were added dropwise, under vigorous stirring. Afterwards, the mixture was added in a
stirred Amicon ultrafiltration cell (Millipore), employed with an isopore membrane (0.05μm
VMTP). MiliQ water was added continuously, until the effluent had a pH value close to the value
of miliQ water, between 5 and 6. The process lasted 3 days. The mixture in the stirred cell was
casted into a Petri dish of 7.5 cm diameter and left to dry in the fumehood.

12 | P a g e
3.2.12 Alkoxylation of TCPOS
The reaction was performed following the work of Wakabayasi et.al.35-36
2.41 g of TCPOS was added to a mixture of 1.95 mL methyl tertbutyl ether (MTBE) and 0.008 g
iron (III) chloride (FeCl3), under stirring, in a round bottom flask. The flask was placed in an ice
bath and left in the fumehood overnight. The temperature of the ice bath was not controlled,
leading to a progressive temperature increase overnight. The conversion follows the reaction in
Figure 8. The product of the reaction was studied with silicon and proton Nuclear Magentic
Resonance (NMR). After receiving the results, the product was heated up to 60ºC, in order to
remove the byproduct tertbutyl chloride, for 1 hour 37 and the product was, afterwards, used for
the production of membranes CNC_TMPOS1 (3.2.13). Additional proton-NMR characterization
was performed after this purification method.
Figure 8: Conversion of chlorosilane to methoxysilane with iron (III) chloride as catalyst.
3.2.13 Production of Membrane CNC_TMPOS1
The product received from the alkoxylation of chlorosilane (TMPOS) was used after the
purification step, for casting the membrane. 0.12 g of the TMPOS were vigorously mixed with 40
mL of CNC dispersion CNC_S1 (3.2.7). The membrane was casted into two Petri dishes of 7.5 cm
diameter.
3.2.14 Production of Membrane CNC_CHO
16 mL of the aldehyde modified CNC dispersion (CNC-CHO) were slowly mixed with 4 mL of
ethanol. The mixture was casted into two Petri dishes of 7.5 cm diameter and left to dry slowly
in the laboratory, under ambient conditions.
3.2.15 Production of Membrane CNC/CNF_CHO_TCPOS
28 mL CNC-CHO (0.5 wt.%) dispersion were mixed with 12 mL of CNF-CHO dispersion (0.7 wt.%).
The ratio of CNC:CNF in the membrane was 70:30. In the mixture, 6 mL of ethanol were added
slowly, under stirring. The total amount of cellulose was 0.224 g. Afterwards, 0.710 g of TCPOS
were added dropwise, under vigorous stirring. The mixture was casted into two Petri dishes of
7.5 cm diameter and left to dry slowly, in the laboratory, under ambient conditions.

13 | P a g e
3.2.16 Production of CNC_TMPOS series of Membranes
252 mL of CNC_LAB dispersion, with dry content of 0.9 wt.% were equally divided into four
beakers. Mixing with TMPOS as described in Section 3.2.8 followed casting into Petri dishes, to
receive the membranes which are named accordingly, i.e. membrane CNC_TMPOS was casted
from dispersion CNC_TMPOS. The membranes were casted in Petri dishes of 3.5 cm diameter
and left to dry slowly in the laboratory, under ambient conditions.
A summary of all the membranes produced is presented in Table 3.
Table 3: Summary of all membranes produced.
Membrane Name Composition
CNC_plain CNC_S, 80:20 H2O:EtOH
CNC_TCPOS CNC_S, 80:20 H2O:EtOH, TCPOS
CNC_TCPOS_ultra CNC_S1 80:20 H2O:EtOH, TCPOS
CNC_TMPOS1 CNC_S1 TMPOS
CNC_CHO CNC-CHO, 80:20 H2O:EtOH
CNC/CNF_CHO_TCPOS CNC-CHO, CNF-CHO (70:30), ethanol, TCPOS
CNC_0TMPOS CNC_LAB
CNC_0.5TMPOS CNC_LAB, TMPOS 0.0945 g
CNC_TMPOS CNC_LAB, TMPOS 0.1890 g
CNC_1.5TMPOS CNCLAB, TMPOS 0.2835 g
3.3 Characterizations
3.3.1 Dynamic Light Scattering (DLS)
The size of the particles in all the dispersions produced were characterized by DLS from Malvern
Instruments, model NanoZS. For the measurements, disposable plastic cuvettes were used.
The samples were diluted so that their concentration was approximately between
0.01-0.02 wt.%. For the dilution, a 5 mM sodium chloride (NaCl) solution was used, since the
same samples were used for the zeta potential measurement, which follows in
Section 3.3.2. The DLS instrument is set to take 3 measurements, 11 runs each. The average size
is given as a result for each measurement. In Section 4.1, the average value from the three
measurements is reported.

14 | P a g e
3.3.2 Zeta potential
For the zeta potential measurements, the DLS instrument was employed, with the use of a
Malvern, Zetasizer nanoseries dip cell. The reported value in Section 4.1 is the average of 3
measurements, 100 runs each. The instrument is set to automatically stop when the most
accurate value is found and this is the value reported for each of the 3 measurements.
3.3.3 Atomic Force Microscopy (AFM)
For imaging AFM, a Bruker, MultiMode 8 instrument was employed, with an E head, at scan asyst
mode. The model of the cantilevers was Scanasyst-air with spring constant 0.4 N/m and back
side coating of reflective Aluminum.
3.3.4 Fourier Transform Infrared Spectrophotometry (FTIR)
The instrument used was a Perkin-Elmer, Spectrum 2000 IR/Raman spectrophotometer. The
samples were directly measured without any pretreatment. The number of scans was 16 and the
wavenumber region scanned was between 4000-600 cm-1.
3.3.5 Contact Angle Measurements
The contact angle measurements were performed with a KSV Instruments LTD, CAM 200
instrument. The solvent used was distilled water and the volume of the drops was 3 μL. The
membrane samples were cut and taped on microscope slides.
3.3.6 Nuclear Magnetic Resonance (NMR)
Proton and Silicon NMR was performed to study the reaction of alkoxylation of TCPOS
(Section 3.2.12). For both measurements, a Bruker, 400 Ultrashield, 400 MHz instrument was
used. Relaxation time for the silicon NMR was 10 seconds and the number of scans was 3600.
For the proton NMR, the relaxation delay was 1 second and the number of scans was 256. For
the preparation of the samples, deuteriated chloroform (CDCl3) was used as solvent for all the
samples. In addition, for the samples for the silicon NMR, trace amounts of Chromium(III)
acetylacetonate (Cr(acac)3) were added to reduce the silicon spin lattice relaxation time 35-36. For
the NMR analysis and measurements, the work of Wakabayasi et.al was followed 36.
3.3.7 Optical Microscopy
For the measurements, a Nikon optical microscope was used, employed with OCD camera. The
magnification for the CNC_TMPOS membrane samples was 20× while for all other samples 50×.
15 | P a g e
3.3.8 Tensile strength measurements
For the tensile strength measurements, a Mini-tensile tester from Deben, model 200N
Microtester was employed. The pieces from the membranes were cut, and their thickness and
width was measured (Appendix I). All tests were performed at room temperature and humidity.
The samples were not conditioned prior to testing.
3.3.9 Stability measurements.
Two stability measurements were performed. In the first one, samples from CNC_TCPOS_ultra
were weighed and placed in vials with miliQ water, 3M sulfuric acid (H2SO4), 4M H2SO4 and a
Vanadium (V) solution of approximately 3M in 4M H2SO4. A sample from CNC_plain was weighed
and placed in a 3M H2SO4. After one week, the samples were removed from the vials, rinsed with
water and ethanol, free dried and weighed again.
In the second experiment, a piece from the membranes CNC_0.5TMPOS, CNC_TMPOS and
CNC_1.5TMPOS were weighed and placed in pre-weighed vials. The vials contained 4 mL of miliQ
water, 3M H2SO4 and a Vanadium (V) solution of approximately 3M in 4M H2SO4. The samples
remained in the vials for one week. Afterwards, the solution was removed from each vial, the
samples were rinsed with 0.1M sodium chloride (NaCl) and placed in a vacuum desiccator for
one week. Finally, the weight of the vials containing the dried sample was measured. The
measurements were performed in triplicates.

16 | P a g e
4 Results and Discussion
In this section, the results from the production and characterization of the dispersions and
membranes will be discussed. For ease of reference, Table 3, which contains the names and
compositions of the membranes produced is also presented here.
Table 3: Summary of all membranes produced.
Membrane Name Composition
CNC_plain CNC_S, 80:20 H2O:EtOH
CNC_TCPOS CNC_S, 80:20 H2O:EtOH, TCPOS
CNC_TCPOS_ultra CNC_S1 80:20 H2O:EtOH, TCPOS
CNC_TMPOS1 CNC_S1, TMPOS
CNC_CHO CNC-CHO, 80:20 H2O:EtOH
CNC/CNF_CHO_TCPOS CNC-CHO, CNF-CHO (70:30), ethanol, TCPOS
CNC_0TMPOS CNC_LAB
CNC_0.5TMPOS CNC_LAB, TMPOS 0.0945 g
CNC_TMPOS CNC_LAB, TMPOS 0.1890 g
CNC_1.5TMPOS CNCLAB, TMPOS 0.2835 g
4.1 Dynamic Light Scattering (DLS) and zeta potential
All CNC dispersions that were produced as described in Section 3.2 were characterized by DLS
and zeta potential. The results of the characterization is summarized in Table 4. DLS
characterization is a straightforward method, which measures the Brownian motion of the
particles and relates it to their volume. However, for the reported values, there is the assumption
that the particles are spherical. As a result, for the CNCs that are rod-shaped, this is of course not
correct and there is hence an error in the DLS measurement. To overcome this problem, AFM
images of the dispersion on a silicon wafer were taken, for comparison of the DLS results by
measuring individualized CNCs.
The z-average value reported is referred to the diameter of the particles, meaning that this is the
measured size of the CNCs. In addition, Mob is the electrophoretic mobility of the particles,
collected during the ζ-potential measurements.

17 | P a g e
Table 4: Summary of the results of DLS measurements, ζ-potential in 1 mM NaCl and Mob.
Dispersion name z-average (𝒏𝒎) ζ-potential (𝒎𝑽) Mob (𝒎𝟐
𝑽𝒔⁄ × 𝟏𝟎−𝟖)
CNC_M 76 ± 0 −34 ± 3 −2.665 ± 0.208
CNC_S 78 ± 1 −35 ± 3 −2.754 ± 0.226
CNC_LAB 68 ± 0 −42 ± 1 −3.269 ± 0.089
CNC-CHO 70 ± 1 −36 ± 1 −2.834 ± 0.079
Before performing the measurement, the dry mass of the dispersions was measured, in order to
calculate the dilution factor necessary to reach a concentration of 0.01-0.02 wt.%. This was the
concentration limit for measuring the CNC dispersion. From the results in Table 4, there is a
difference in the size of the particles dispersed from dry, CelluForce CNCs and the ones that were
made in the lab from hydrolysis of cotton. The level of hydrolysis has an important role on the
size of CNCs. Higher level of hydrolysis can lead to smaller CNCs. In addition, the dispersions were
sonicated and filtered before the measurements, to ensure that big aggregates and other
impurities will not affect the results. Longer sonication times can lead to smaller particle size, as
most of the aggregates are re-dispersed. Maybe, the CelluForce dispersions, i.e. CNC_M and
CNC_S, were not sonicated enough, causing a bigger particle size. However, the differences are
really small and there is no considerable big difference in the ζ-potential values, which means
that the particles had similar charge on their surface, regardless of their source.
The results for the ζ-potential of the CNC_LAB dispersion were evaluated compared to the results
of conductometric titration with sodium hydroxide 0.002N. These results are in agreement with
the DLS results, giving a 0.66% sulfur content.
An additional DLS measurement regarding the size of the CNCs in acid will be reported and
discussed in Section 4.4. It is more convenient to draw conclusions from these results when
compared to the membrane stability measurements that are discussed in the same section.
4.2 Production of TMPOS from TCPOS
The production of TMPOS is described in Section 3.2.12. In order to ensure that the reaction
resulted at the desired product, proton and silicon NMR measurements were performed as
described in the same section. Silicon NMR did not give any peaks, due to unknown reasons.
However, the spectra can be found in Appendix II.
The proton NMR spectra of the product before and after heating at 60ºC for 1 hour are presented
overlapped (Figure 9), to highlight the change the heating caused to the mixture.
18 | P a g e
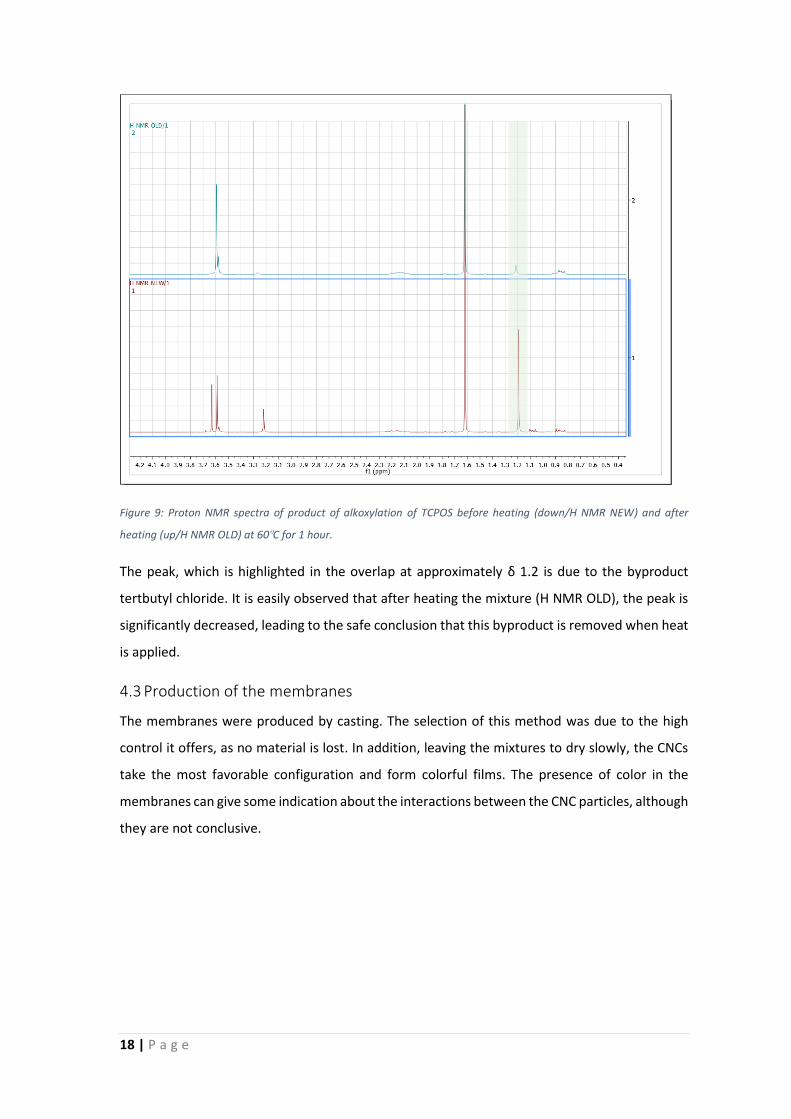
Figure 9: Proton NMR spectra of product of alkoxylation of TCPOS before heating (down/H NMR NEW) and after
heating (up/H NMR OLD) at 60ºC for 1 hour.
The peak, which is highlighted in the overlap at approximately δ 1.2 is due to the byproduct
tertbutyl chloride. It is easily observed that after heating the mixture (H NMR OLD), the peak is
significantly decreased, leading to the safe conclusion that this byproduct is removed when heat
is applied.
4.3 Production of the membranes
The membranes were produced by casting. The selection of this method was due to the high
control it offers, as no material is lost. In addition, leaving the mixtures to dry slowly, the CNCs
take the most favorable configuration and form colorful films. The presence of color in the
membranes can give some indication about the interactions between the CNC particles, although
they are not conclusive.
19 | P a g e
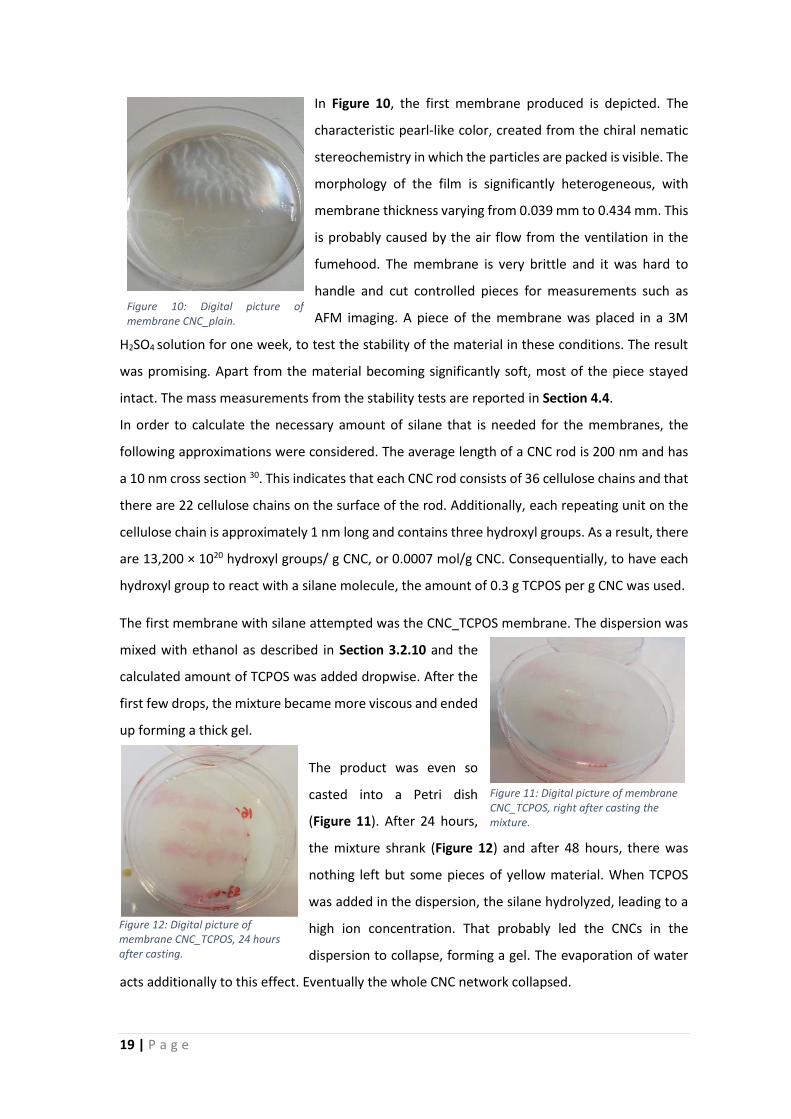
In Figure 10, the first membrane produced is depicted. The
characteristic pearl-like color, created from the chiral nematic
stereochemistry in which the particles are packed is visible. The
morphology of the film is significantly heterogeneous, with
membrane thickness varying from 0.039 mm to 0.434 mm. This
is probably caused by the air flow from the ventilation in the
fumehood. The membrane is very brittle and it was hard to
handle and cut controlled pieces for measurements such as
AFM imaging. A piece of the membrane was placed in a 3M
H2SO4 solution for one week, to test the stability of the material in these conditions. The result
was promising. Apart from the material becoming significantly soft, most of the piece stayed
intact. The mass measurements from the stability tests are reported in Section 4.4.
In order to calculate the necessary amount of silane that is needed for the membranes, the
following approximations were considered. The average length of a CNC rod is 200 nm and has
a 10 nm cross section 30. This indicates that each CNC rod consists of 36 cellulose chains and that
there are 22 cellulose chains on the surface of the rod. Additionally, each repeating unit on the
cellulose chain is approximately 1 nm long and contains three hydroxyl groups. As a result, there
are 13,200 × 1020 hydroxyl groups/ g CNC, or 0.0007 mol/g CNC. Consequentially, to have each
hydroxyl group to react with a silane molecule, the amount of 0.3 g TCPOS per g CNC was used.
The first membrane with silane attempted was the CNC_TCPOS membrane. The dispersion was
mixed with ethanol as described in Section 3.2.10 and the
calculated amount of TCPOS was added dropwise. After the
first few drops, the mixture became more viscous and ended
up forming a thick gel.
The product was even so
casted into a Petri dish
(Figure 11). After 24 hours,
the mixture shrank (Figure 12) and after 48 hours, there was
nothing left but some pieces of yellow material. When TCPOS
was added in the dispersion, the silane hydrolyzed, leading to a
high ion concentration. That probably led the CNCs in the
dispersion to collapse, forming a gel. The evaporation of water
acts additionally to this effect. Eventually the whole CNC network collapsed.
Figure 10: Digital picture of membrane CNC_plain.
Figure 11: Digital picture of membrane CNC_TCPOS, right after casting the mixture.
Figure 12: Digital picture of membrane CNC_TCPOS, 24 hours after casting.
20 | P a g e
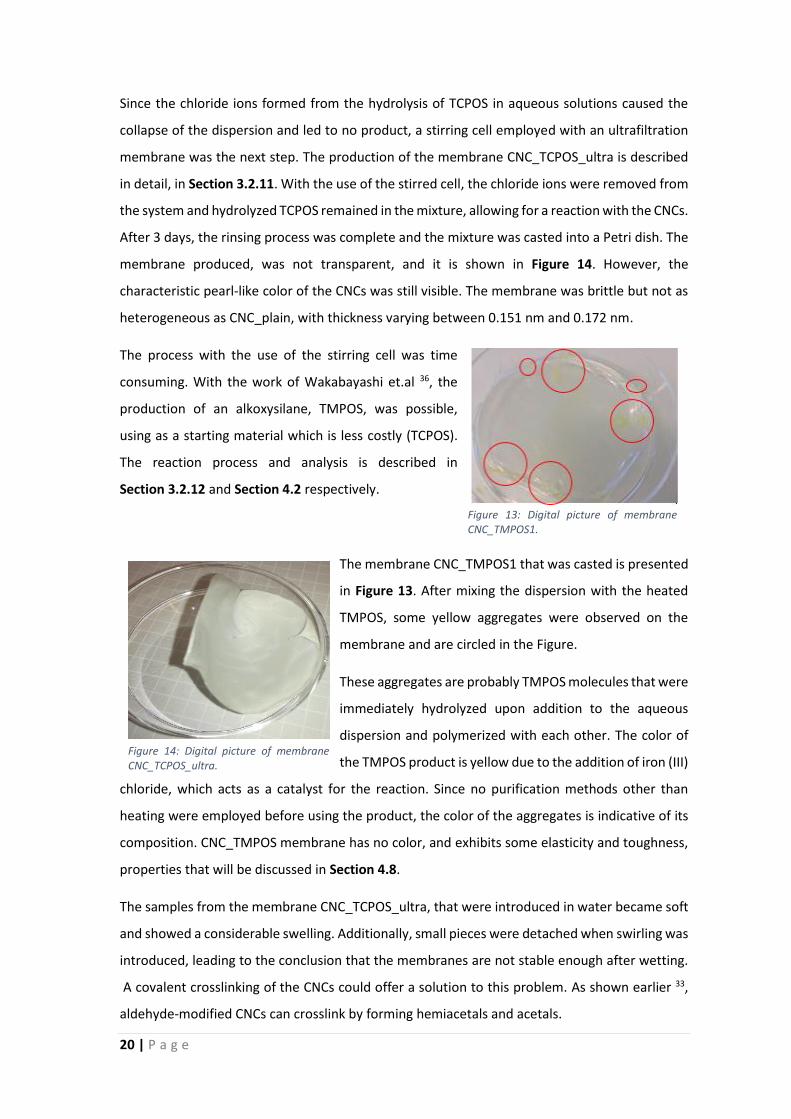
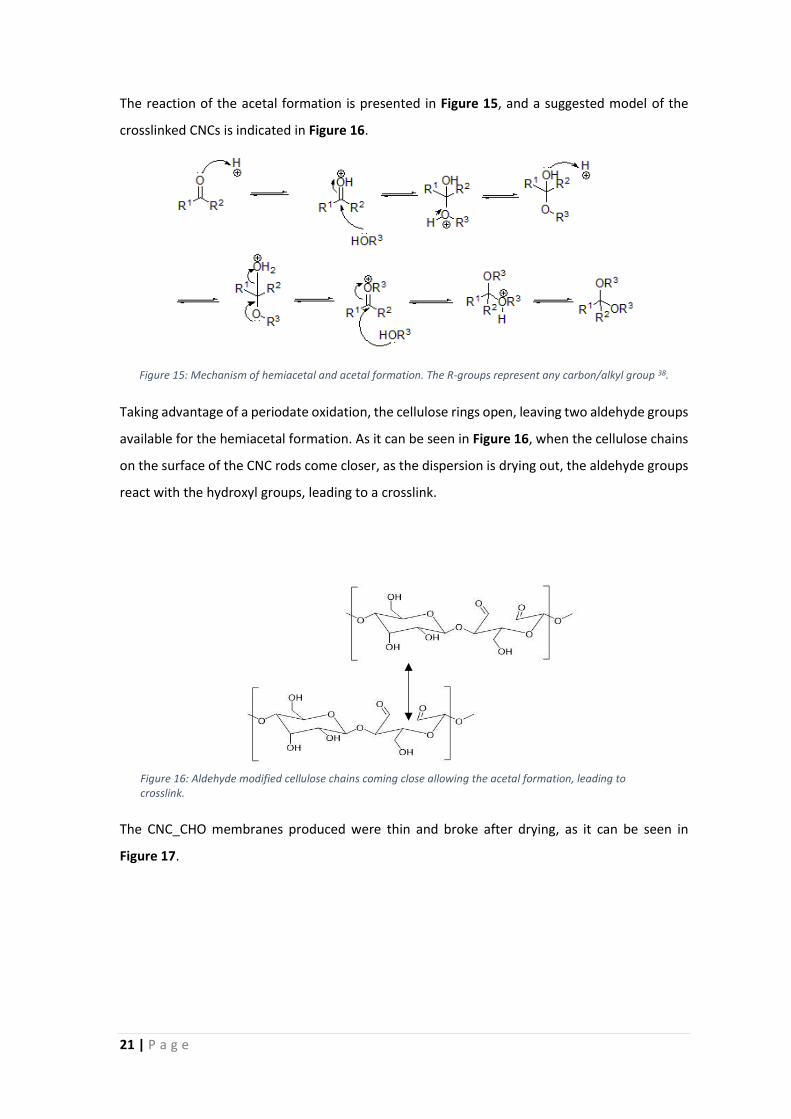
Since the chloride ions formed from the hydrolysis of TCPOS in aqueous solutions caused the
collapse of the dispersion and led to no product, a stirring cell employed with an ultrafiltration
membrane was the next step. The production of the membrane CNC_TCPOS_ultra is described
in detail, in Section 3.2.11. With the use of the stirred cell, the chloride ions were removed from
the system and hydrolyzed TCPOS remained in the mixture, allowing for a reaction with the CNCs.
After 3 days, the rinsing process was complete and the mixture was casted into a Petri dish. The
membrane produced, was not transparent, and it is shown in Figure 14. However, the
characteristic pearl-like color of the CNCs was still visible. The membrane was brittle but not as
heterogeneous as CNC_plain, with thickness varying between 0.151 nm and 0.172 nm.
The process with the use of the stirring cell was time
consuming. With the work of Wakabayashi et.al 36, the
production of an alkoxysilane, TMPOS, was possible,
using as a starting material which is less costly (TCPOS).
The reaction process and analysis is described in
Section 3.2.12 and Section 4.2 respectively.
The membrane CNC_TMPOS1 that was casted is presented
in Figure 13. After mixing the dispersion with the heated
TMPOS, some yellow aggregates were observed on the
membrane and are circled in the Figure.
These aggregates are probably TMPOS molecules that were
immediately hydrolyzed upon addition to the aqueous
dispersion and polymerized with each other. The color of
the TMPOS product is yellow due to the addition of iron (III)
chloride, which acts as a catalyst for the reaction. Since no purification methods other than
heating were employed before using the product, the color of the aggregates is indicative of its
composition. CNC_TMPOS membrane has no color, and exhibits some elasticity and toughness,
properties that will be discussed in Section 4.8.
The samples from the membrane CNC_TCPOS_ultra, that were introduced in water became soft
and showed a considerable swelling. Additionally, small pieces were detached when swirling was
introduced, leading to the conclusion that the membranes are not stable enough after wetting.
A covalent crosslinking of the CNCs could offer a solution to this problem. As shown earlier 33,
aldehyde-modified CNCs can crosslink by forming hemiacetals and acetals.
Figure 13: Digital picture of membrane CNC_TMPOS1.
Figure 14: Digital picture of membrane CNC_TCPOS_ultra.
21 | P a g e
The reaction of the acetal formation is presented in Figure 15, and a suggested model of the
crosslinked CNCs is indicated in Figure 16.
Figure 15: Mechanism of hemiacetal and acetal formation. The R-groups represent any carbon/alkyl group 38.
Taking advantage of a periodate oxidation, the cellulose rings open, leaving two aldehyde groups
available for the hemiacetal formation. As it can be seen in Figure 16, when the cellulose chains
on the surface of the CNC rods come closer, as the dispersion is drying out, the aldehyde groups
react with the hydroxyl groups, leading to a crosslink.
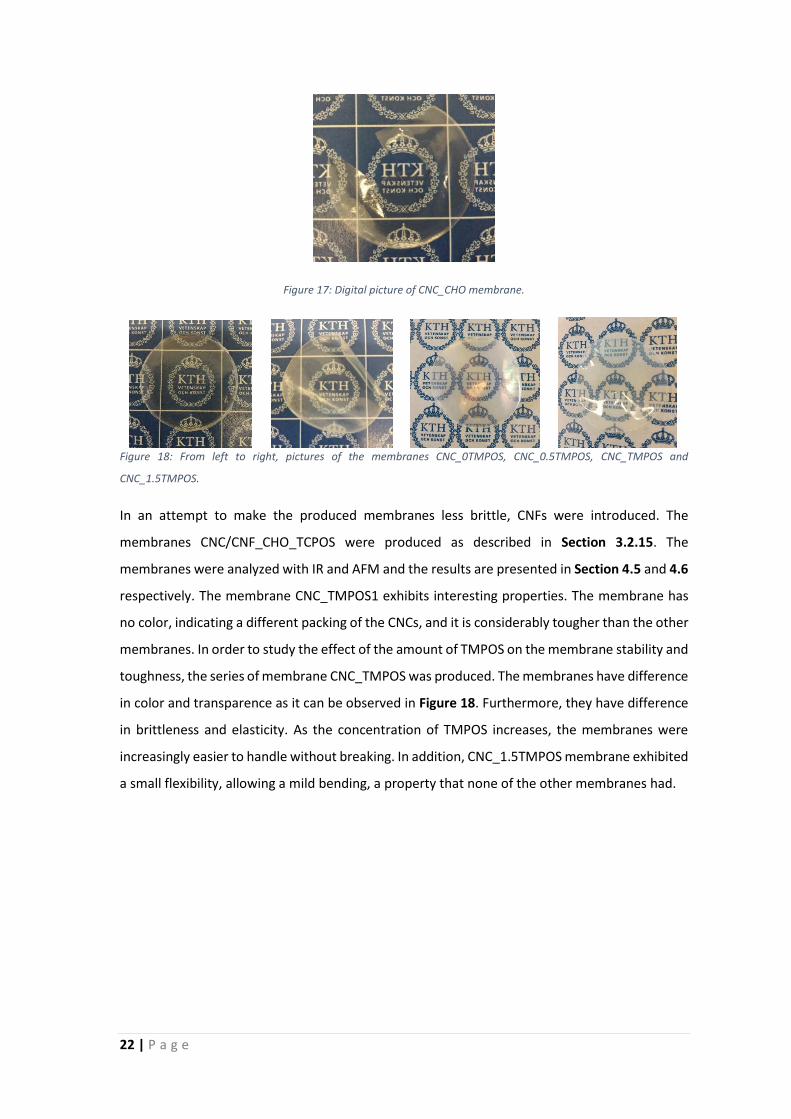
The CNC_CHO membranes produced were thin and broke after drying, as it can be seen in
Figure 17.
Figure 16: Aldehyde modified cellulose chains coming close allowing the acetal formation, leading to crosslink.
22 | P a g e
Figure 17: Digital picture of CNC_CHO membrane.
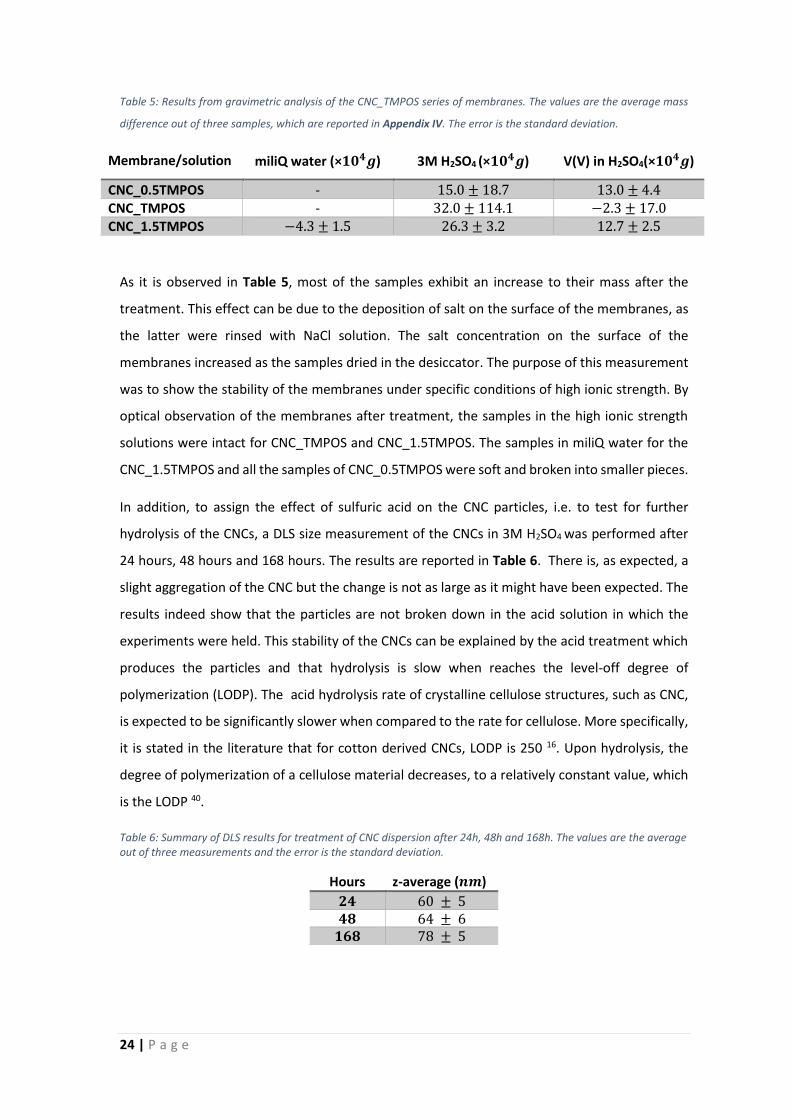
Figure 18: From left to right, pictures of the membranes CNC_0TMPOS, CNC_0.5TMPOS, CNC_TMPOS and
CNC_1.5TMPOS.
In an attempt to make the produced membranes less brittle, CNFs were introduced. The
membranes CNC/CNF_CHO_TCPOS were produced as described in Section 3.2.15. The
membranes were analyzed with IR and AFM and the results are presented in Section 4.5 and 4.6
respectively. The membrane CNC_TMPOS1 exhibits interesting properties. The membrane has
no color, indicating a different packing of the CNCs, and it is considerably tougher than the other
membranes. In order to study the effect of the amount of TMPOS on the membrane stability and
toughness, the series of membrane CNC_TMPOS was produced. The membranes have difference
in color and transparence as it can be observed in Figure 18. Furthermore, they have difference
in brittleness and elasticity. As the concentration of TMPOS increases, the membranes were
increasingly easier to handle without breaking. In addition, CNC_1.5TMPOS membrane exhibited
a small flexibility, allowing a mild bending, a property that none of the other membranes had.

23 | P a g e
4.4 Membrane Stability
The membranes were studied for their stability in acidic and oxidative conditions. The process
for the stability measurements is described in Section 3.3.9. The results are summarized in
Table . The values reported are the average mass difference of three samples. The samples were
treated for one week.
After 24 hours, samples A of 1 i.e., the membranes CNC_0.5TMPOS in miliQ water were
completely dissolved. The same effect was observed for the CNC_TMPOS in miliQ water (samples
A of 2) after 48 hours (Figure 19). The solution from each vial was removed after one week and
the membranes were rinsed with 0.1 M NaCl solution and left in a vacuum desiccator for 5 days.
NaCl solution was selected for the rinsing in order to keep the ionic strength of the membrane
environment high, reinforcing the interaction between the CNCs. Low ionic strength could lead
to dissolution of the membrane, as the Debye length increases with decrease of ionic strength,
leading the charged CNCs to be separated 39. The increase of the Debye length is also the reason
that the membranes in miliQ water were dissolved rather fast. In the high ionic strength
solutions, i.e. the Vanadium and sulfuric acid solutions, the Debye length is much smaller, leading
to high van der Waals interactions. The hydrophobicity of the CNC_1.5TMPOS membrane, which
will be further discussed in Section 4.7, may be contributing to the delay of dissolution in miliQ
water.
All membranes became considerably softer when introduced to solution. This is a problem in
need of optimization, since it prevents the use of the material in a broad spectrum of
applications.
Figure 19: Digital pictures of the vials with samples after 24h. The vials labeled as A contain miliQ water, the ones labeled as B contain sulfuric acid and the ones labeled as C contain Vanadium (V). The samples in picture 1 are CNC_0.5TMPOS, in picture 2 are CNC_TMPOS and in picture 3 are CNC_1.5TMPOS.
A B C
1
A B C
2
A B C
3
24 | P a g e
Table 5: Results from gravimetric analysis of the CNC_TMPOS series of membranes. The values are the average mass
difference out of three samples, which are reported in Appendix IV. The error is the standard deviation.
Membrane/solution miliQ water (×𝟏𝟎𝟒𝒈) 3M H2SO4 (×𝟏𝟎𝟒𝒈) V(V) in H2SO4(×𝟏𝟎𝟒𝒈)
CNC_0.5TMPOS - 15.0 ± 18.7 13.0 ± 4.4 CNC_TMPOS - 32.0 ± 114.1 −2.3 ± 17.0 CNC_1.5TMPOS −4.3 ± 1.5 26.3 ± 3.2 12.7 ± 2.5
As it is observed in Table 5, most of the samples exhibit an increase to their mass after the
treatment. This effect can be due to the deposition of salt on the surface of the membranes, as
the latter were rinsed with NaCl solution. The salt concentration on the surface of the
membranes increased as the samples dried in the desiccator. The purpose of this measurement
was to show the stability of the membranes under specific conditions of high ionic strength. By
optical observation of the membranes after treatment, the samples in the high ionic strength
solutions were intact for CNC_TMPOS and CNC_1.5TMPOS. The samples in miliQ water for the
CNC_1.5TMPOS and all the samples of CNC_0.5TMPOS were soft and broken into smaller pieces.
In addition, to assign the effect of sulfuric acid on the CNC particles, i.e. to test for further
hydrolysis of the CNCs, a DLS size measurement of the CNCs in 3M H2SO4 was performed after
24 hours, 48 hours and 168 hours. The results are reported in Table 6. There is, as expected, a
slight aggregation of the CNC but the change is not as large as it might have been expected. The
results indeed show that the particles are not broken down in the acid solution in which the
experiments were held. This stability of the CNCs can be explained by the acid treatment which
produces the particles and that hydrolysis is slow when reaches the level-off degree of
polymerization (LODP). The acid hydrolysis rate of crystalline cellulose structures, such as CNC,
is expected to be significantly slower when compared to the rate for cellulose. More specifically,
it is stated in the literature that for cotton derived CNCs, LODP is 250 16. Upon hydrolysis, the
degree of polymerization of a cellulose material decreases, to a relatively constant value, which
is the LODP 40.
Table 6: Summary of DLS results for treatment of CNC dispersion after 24h, 48h and 168h. The values are the average out of three measurements and the error is the standard deviation.
Hours z-average (𝒏𝒎)
𝟐𝟒 60 ± 5 𝟒𝟖 64 ± 6
𝟏𝟔𝟖 78 ± 5
25 | P a g e
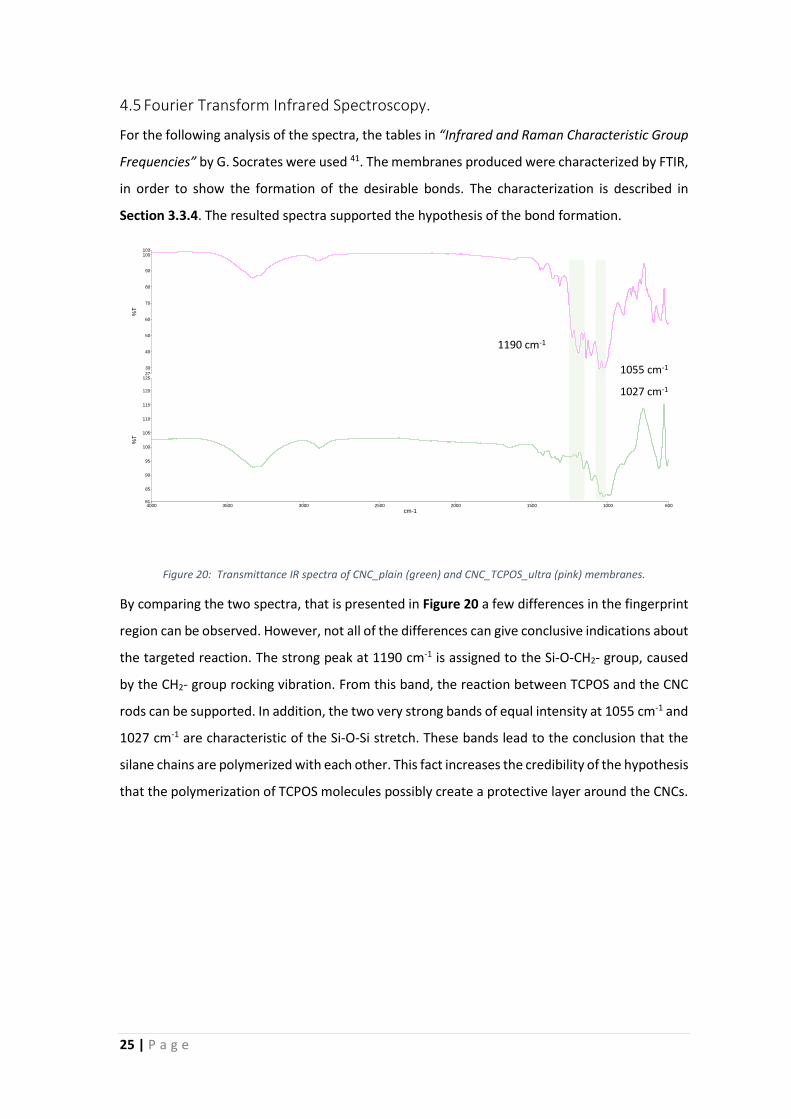
4.5 Fourier Transform Infrared Spectroscopy.
For the following analysis of the spectra, the tables in “Infrared and Raman Characteristic Group
Frequencies” by G. Socrates were used 41. The membranes produced were characterized by FTIR,
in order to show the formation of the desirable bonds. The characterization is described in
Section 3.3.4. The resulted spectra supported the hypothesis of the bond formation.
Figure 20: Transmittance IR spectra of CNC_plain (green) and CNC_TCPOS_ultra (pink) membranes.
By comparing the two spectra, that is presented in Figure 20 a few differences in the fingerprint
region can be observed. However, not all of the differences can give conclusive indications about
the targeted reaction. The strong peak at 1190 cm-1 is assigned to the Si-O-CH2- group, caused
by the CH2- group rocking vibration. From this band, the reaction between TCPOS and the CNC
rods can be supported. In addition, the two very strong bands of equal intensity at 1055 cm-1 and
1027 cm-1 are characteristic of the Si-O-Si stretch. These bands lead to the conclusion that the
silane chains are polymerized with each other. This fact increases the credibility of the hypothesis
that the polymerization of TCPOS molecules possibly create a protective layer around the CNCs.
CNC silanes ultrafiltration
CNC 80.20
Name
Sample 006 By Administrator Date Wednesday, May 09 2018
Sample 005 By Administrator Date Wednesday, May 09 2018
Description
4000 6003500 3000 2500 2000 1500 1000
cm-1
103
27
30
40
50
60
70
80
90
100
%T
125
81
85
90
95
100
105
110
115
120
%T
1190 cm-1
1055 cm-1
1027 cm-1

26 | P a g e
Figure 21: Transmittance IR spectra of CNC_plain (pink) and CNC_TMPOS1 (blue) membranes.
Similar conclusions can be drawn from the overlap of the IR spectra for CNC_plain and
CNC_TMPOS1 membranes that are presented in Figure 21. The bands that are assigned in the
graph are assigned to the same groups as the ones mentioned for Figure 20.
The next spectra presented (Figure 22), represent the CNC_TMPOS series of membranes. The
membranes that were studied are CNC_0TMPOS (pink line), CNC_0.5TMPOS (black line),
CNC_TMPOS (blue line) and CNC_1.5TMPOS (red line).
Figure 22: Transmittance IR spectra of CNC_0TMPOS (pink), CNC_0.5TMPOS (black), CNC_TMPOS (blue) and CNC_1.5TMPOS (red) membranes.
As it is observed, the spectra for CNC_0.5TMPOS (black line), CNC_TMPOS (blue line) and
CNC_1.5TMPOS (red line) are similar, with no noteworthy differences. It is difficult to quantify
the TMPOS in the membranes using FTIR. However, the purpose of the analysis, which was to
give qualitative results about the reaction between TMPOS and the CNCs is successfully served.
cnc alkoxysilane
CNC 80.20
Name
1%CNC with alkoxysilane
Sample 005 By Administrator Date Wednesday, May 09 2018
Description
4000 6003500 3000 2500 2000 1500 1000
cm-1
101
35
40
45
50
55
60
65
70
75
80
85
90
95
100
%T
125
81
85
90
95
100
105
110
115
120
%T
cnc05bt
cnc15bt
cnc1bt
CNC 80.20
Name
Sample 004 By Administrator Date Friday, June 29 2018
Sample 006 By Administrator Date Friday, June 29 2018
Sample 005 By Administrator Date Friday, June 29 2018
Sample 005 By Administrator Date Wednesday, May 09 2018
Description
4000 6003500 3000 2500 2000 1500 1000
cm-1
101
31
40
50
60
70
80
90
%T
100
60
65
70
75
80
85
90
95
%T
101
61
65
70
75
80
85
90
95
%T
125
8185
90
95
100
105
110
115
120
%T
Black
1160 cm-1
1052 cm-1
1027 cm-1
Red
Blue
Pink

27 | P a g e
4.6 Microscopy and Optical Observations
In this section, the results from AFM, optical microscopy and pictures collected with the use of
polarized filters will be presented. All these methods are supplementary and offer a pictorial
representation of the surface and the packing of the CNCs in the membranes.
In order to measure the length of the CNC rods in the dispersions produced, a silicon wafer was
incubated with a 0.02% poly(allylamine hydrochloride) (PAH) solution in 5mM NaCl. PAH is a
commonly used polyelectrolyte to form a cationic adhesion layer. Following the first incubation,
the silicon wafer was incubated with the CNC dispersion (CNC_LAB). The process followed is
described in details in the review by Foster, J., E. et.al. 42. From the collected image, the length
of isolated CNCs was measured and found approximately 200 nm, as expected from the
experimental procedure followed for their production (Section 3.2.1). In Figure 23, a
representative, isolated CNC rod is marked with an orange line, and its length is reported.
197.05 nm
Figure 23: AFM image of CNC particles on a silicon wafer, incubated in PAH. The scale is 2.5 μm.

28 | P a g e
The membranes exhibit color when placed between two vertically arranged polarized sheets due
to the packing of the particles. This effect is more easily explained with the help of
Figure 24.
As unpolarized light from the light source passes through the first filter, which is horizontally
polarized, light rays that are not horizontal are screened out. Afterwards, polarized light rays
pass through the membrane. The light ray gets scattered on the particles of the membrane and
it is no more solely horizontally polarized. Thereafter, the scattered light passes through the
vertically polarized filter. As a result, the horizontally polarized light is screened out and light
altered by the organized structures in the membrane can be observed. These colors give an
indication about the organization of the particles in the membrane. An orientation of the
particles is indicated by colorful membranes whereas phase separation can lead to absence of
color.
Light source
Unpolarized light Horizontally
polarized filter
Horizontally
polarized
light ray
Membrane
Polarized light ray
Vertically
polarized filter
Figure 24: Schematic representation of the working principle of the polarized filters.
29 | P a g e
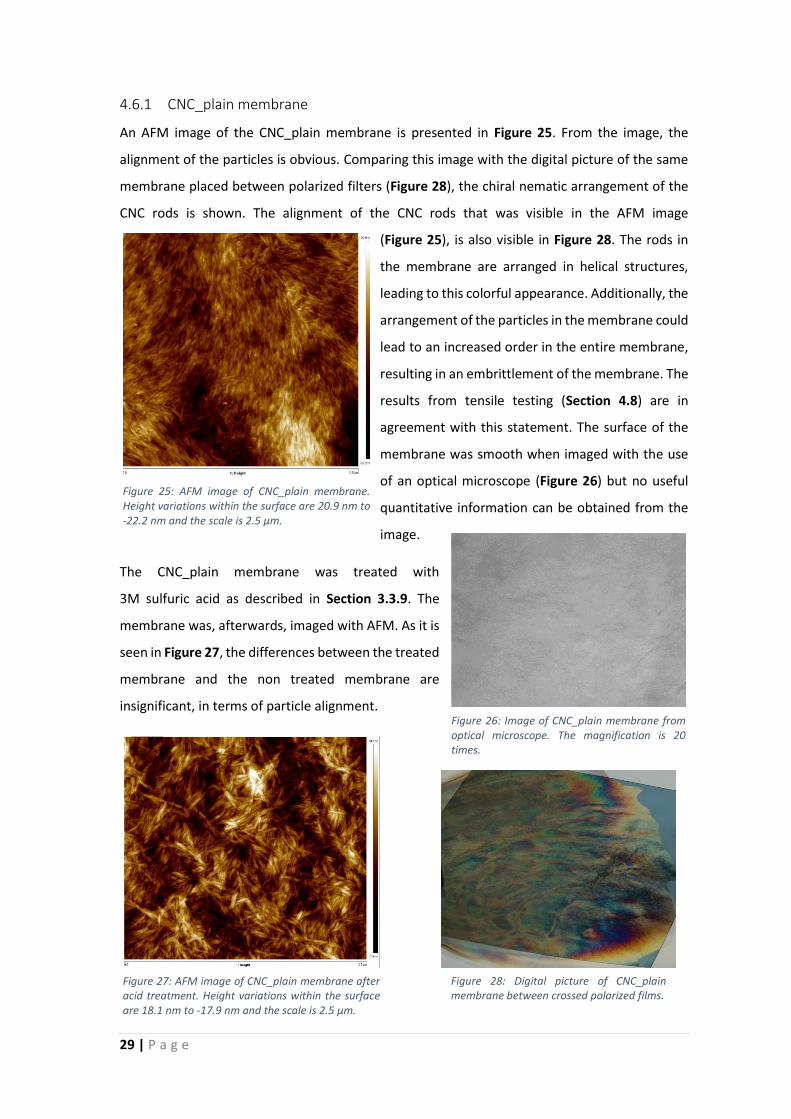
4.6.1 CNC_plain membrane
An AFM image of the CNC_plain membrane is presented in Figure 25. From the image, the
alignment of the particles is obvious. Comparing this image with the digital picture of the same
membrane placed between polarized filters (Figure 28), the chiral nematic arrangement of the
CNC rods is shown. The alignment of the CNC rods that was visible in the AFM image
(Figure 25), is also visible in Figure 28. The rods in
the membrane are arranged in helical structures,
leading to this colorful appearance. Additionally, the
arrangement of the particles in the membrane could
lead to an increased order in the entire membrane,
resulting in an embrittlement of the membrane. The
results from tensile testing (Section 4.8) are in
agreement with this statement. The surface of the
membrane was smooth when imaged with the use
of an optical microscope (Figure 26) but no useful
quantitative information can be obtained from the
image.
The CNC_plain membrane was treated with
3M sulfuric acid as described in Section 3.3.9. The
membrane was, afterwards, imaged with AFM. As it is
seen in Figure 27, the differences between the treated
membrane and the non treated membrane are
insignificant, in terms of particle alignment.
Figure 28: Digital picture of CNC_plain membrane between crossed polarized films.
Figure 26: Image of CNC_plain membrane from optical microscope. The magnification is 20 times.
Figure 25: AFM image of CNC_plain membrane. Height variations within the surface are 20.9 nm to -22.2 nm and the scale is 2.5 μm.
Figure 27: AFM image of CNC_plain membrane after acid treatment. Height variations within the surface are 18.1 nm to -17.9 nm and the scale is 2.5 μm.
30 | P a g e
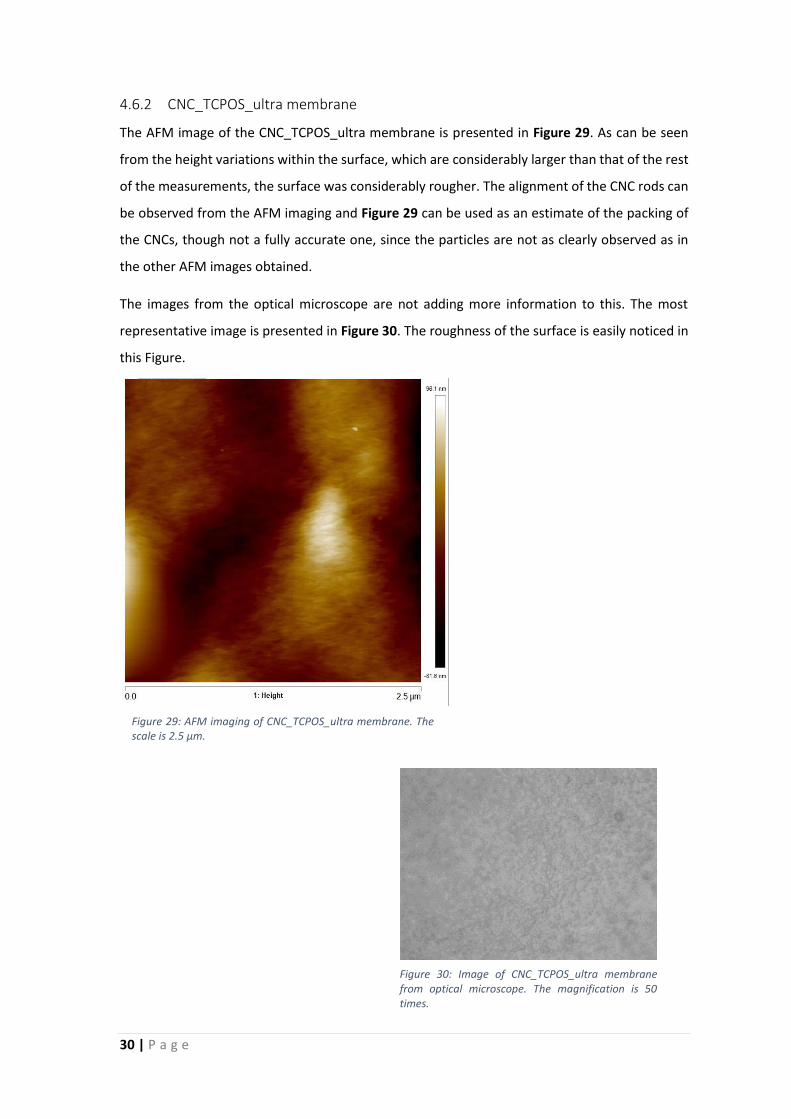
4.6.2 CNC_TCPOS_ultra membrane
The AFM image of the CNC_TCPOS_ultra membrane is presented in Figure 29. As can be seen
from the height variations within the surface, which are considerably larger than that of the rest
of the measurements, the surface was considerably rougher. The alignment of the CNC rods can
be observed from the AFM imaging and Figure 29 can be used as an estimate of the packing of
the CNCs, though not a fully accurate one, since the particles are not as clearly observed as in
the other AFM images obtained.
The images from the optical microscope are not adding more information to this. The most
representative image is presented in Figure 30. The roughness of the surface is easily noticed in
this Figure.
Figure 29: AFM imaging of CNC_TCPOS_ultra membrane. The scale is 2.5 μm.
Figure 30: Image of CNC_TCPOS_ultra membrane from optical microscope. The magnification is 50 times.
31 | P a g e
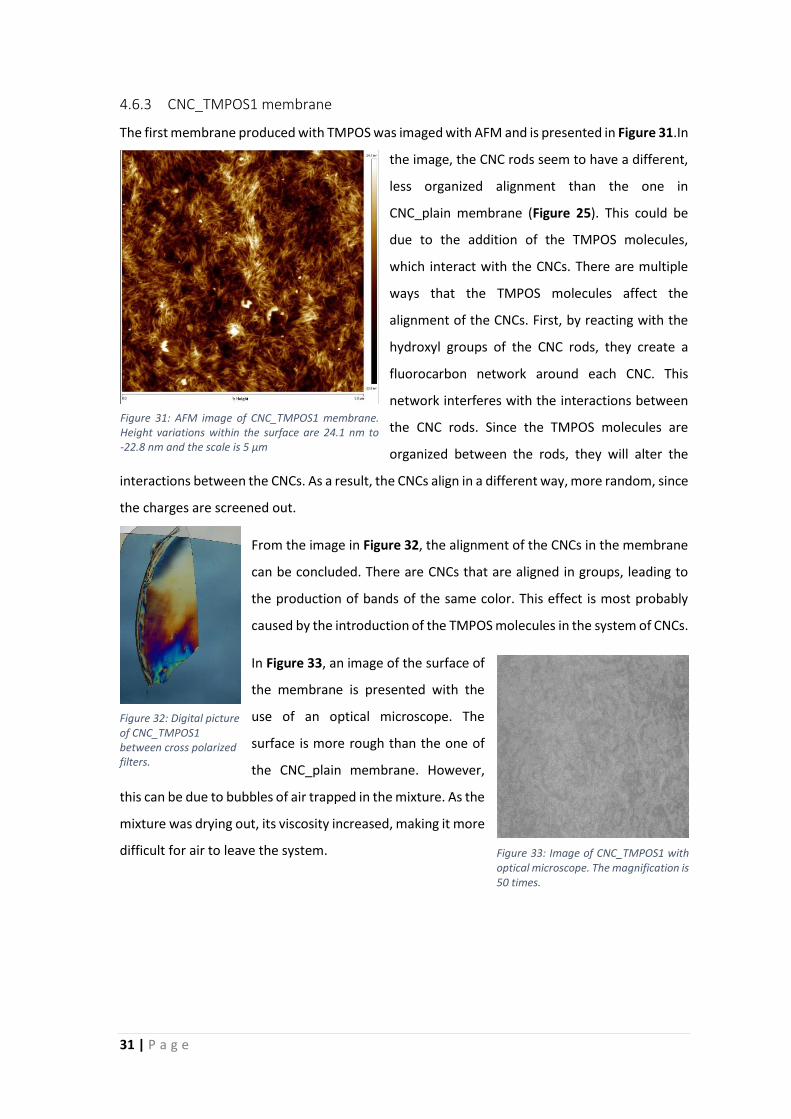
4.6.3 CNC_TMPOS1 membrane
The first membrane produced with TMPOS was imaged with AFM and is presented in Figure 31.In
the image, the CNC rods seem to have a different,
less organized alignment than the one in
CNC_plain membrane (Figure 25). This could be
due to the addition of the TMPOS molecules,
which interact with the CNCs. There are multiple
ways that the TMPOS molecules affect the
alignment of the CNCs. First, by reacting with the
hydroxyl groups of the CNC rods, they create a
fluorocarbon network around each CNC. This
network interferes with the interactions between
the CNC rods. Since the TMPOS molecules are
organized between the rods, they will alter the
interactions between the CNCs. As a result, the CNCs align in a different way, more random, since
the charges are screened out.
From the image in Figure 32, the alignment of the CNCs in the membrane
can be concluded. There are CNCs that are aligned in groups, leading to
the production of bands of the same color. This effect is most probably
caused by the introduction of the TMPOS molecules in the system of CNCs.
In Figure 33, an image of the surface of
the membrane is presented with the
use of an optical microscope. The
surface is more rough than the one of
the CNC_plain membrane. However,
this can be due to bubbles of air trapped in the mixture. As the
mixture was drying out, its viscosity increased, making it more
difficult for air to leave the system.
Figure 32: Digital picture of CNC_TMPOS1 between cross polarized filters.
Figure 33: Image of CNC_TMPOS1 with optical microscope. The magnification is 50 times.
Figure 31: AFM image of CNC_TMPOS1 membrane. Height variations within the surface are 24.1 nm to -22.8 nm and the scale is 5 μm

32 | P a g e
4.6.4 CNC_CHO membrane
Images from AFM analysis of the aldehyde modified CNCs forming the CNC_CHO membrane are
shown in Figure 34. The alignment of the particles in the membrane is more ordered compared
with CNC_plain membrane (Figure 25). Additionally, the
packing is obviously much tighter than the first. Both
results can be explained from the crosslinking through the
aldehyde groups, which bring the rods close to each other.
No significant conclusions can be drawn from the images
from the optical microscope, other than the surface is
rough (Figure 36).The digital picture with the use of
polarized filters showed some alignment. However, the
membrane was too thin and brittle and no larger piece
could be handled. The sample shown in Figure 35 is the
largest possibly obtained. The high order of the system, due to basically absence of amorphous
regions and heterogeneities, leads to
the production of a fragile material
that is hard to handle and
characterize. Tensile testing was
hence not possible for this
membrane.
4.6.5 CNC_TMPOS series of membranes
These membranes are presented as a group, because the main purpose for their preparation was
to study the effect of the TMPOS amount in the properties of the membrane. AFM imaging of
these membranes was not possible, due to high roughness of the surface. However, the pictures
with the use of polarized sheets are of particular interest (Figure 37). The pictures could explain
why CNC_0TMPOS membranes are brittle, since a phase separation can be observed in the
middle of the membrane. The CNC_0.5TMPOS membranes were all curved and this is the reason
why only a piece was used for the picture. In addition, phase separation is observed in the
Figure 36: CNC_CHO membrane imaged by optical microscope. The magnification is 50 times.
Figure 35: Digital picture of CNC_CHO membrane between crossed polarized filters.
Figure 34: AFM image of the CNC_CHO membrane. The distance from the surface is 12.9 nm and the scale is 5 μm.

33 | P a g e
CNC_TMPOS membrane. This could be caused by the interaction of the CNCs with the TMPOS
molecules.
Since TMPOS is hydrophobic, it is possible that the molecules form a network between the CNCs
to decrease surface tension, separating from the aqueous solution. As a result, the CNCs are
pushed closer together, not being able to orient in the most preferable way, thus, the membrane
does not exhibit any color. Absence of color could mean that the CNCs are no longer organized
in a chiral nematic stereochemistry, which is favorable, and they have now taken a forced non-
optimized structure in the membrane. In the membrane CNC_1.5TMPOS, the color observed to
the bottom right could be a result of drying unevenly, with CNCs packing closer only on this
specific spot. Again, a phase separation can indeed be observed in this membrane, indicating
that there might be a critical ratio between the CNC and the TMPOS which has to be passed
before new organized phases can be formed consisted of the different compounds but this has
to be clarified in future investigations.
The images from the optical microscope, presented in Figure 38, show the roughness of the
surface. The removal of air bubbles could most probably lead to the production of smoother
membranes.
Figure 37: From left to right, digital pictures of CNC_0TMPOS, CNC_0.5TMPOS, CNC_TMPOS and CNC_1.5TMPOS membranes between crossed polarized filters.
Figure 38: Images of membranes CNC_0.5TMPOS, CNC_TMPOS and CNC_1.5TMPOS with optical microscope. The magnification is 50 times.

34 | P a g e
4.7 Contact Angle Measurements
The contact angle measurements performed with water as a test liquid because the purpose of
the measurements was to study the hydrophobicity induced from the addition of TMPOS and
TCPOS.
The images presented in Figure 39 are for the CNC_TMPOS series of membranes. The rest of the
images are reported in Appendix III. From the measurements, which are reported and
summarized for all the membranes in Table 7, the expected increase of hydrophobicity by
increasing the amount of TMPOS is shown.
Figure 39: Images from contact angle measurements, for membranes (A) CNC_0TMPOS, (B) CNC_0.5TMPOS, (C) CNC_TMPOS and (D) CNC_1.5TMPOS
A B
C D
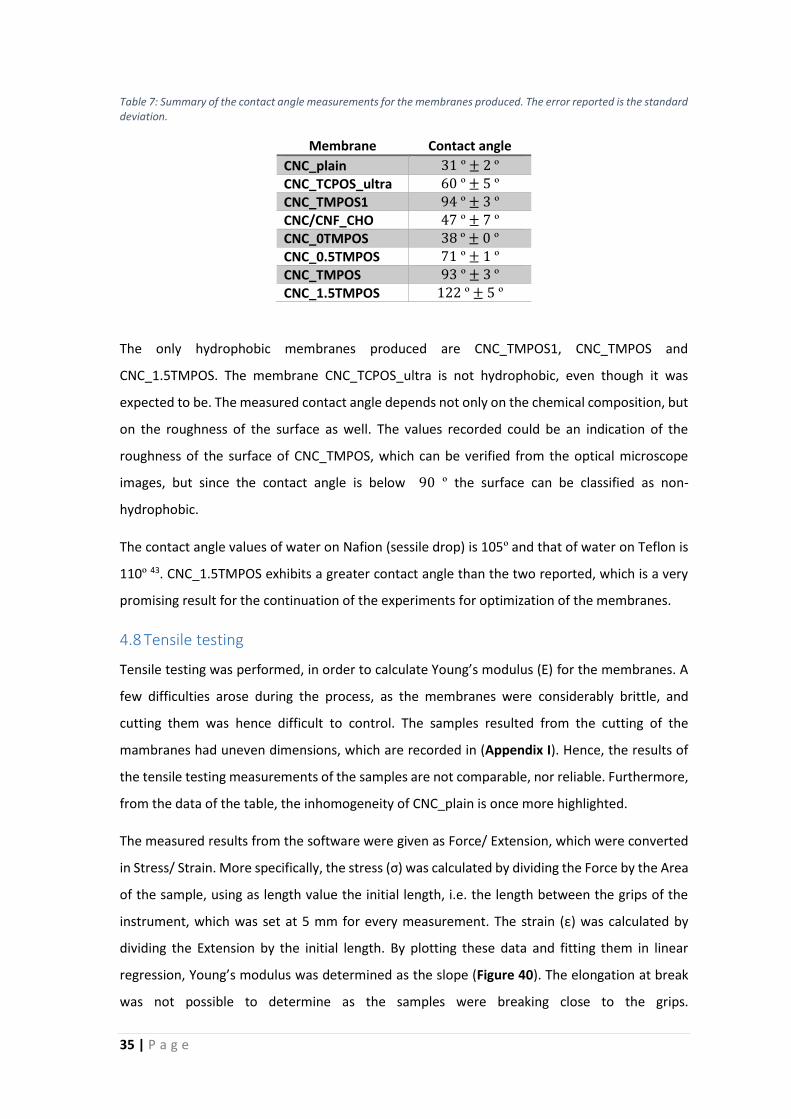
35 | P a g e
Table 7: Summary of the contact angle measurements for the membranes produced. The error reported is the standard deviation.
Membrane Contact angle
CNC_plain 31 º ± 2 º
CNC_TCPOS_ultra 60 º ± 5 º
CNC_TMPOS1 94 º ± 3 º
CNC/CNF_CHO 47 º ± 7 º
CNC_0TMPOS 38 º ± 0 º
CNC_0.5TMPOS 71 º ± 1 º
CNC_TMPOS 93 º ± 3 º
CNC_1.5TMPOS 122 º ± 5 º
The only hydrophobic membranes produced are CNC_TMPOS1, CNC_TMPOS and
CNC_1.5TMPOS. The membrane CNC_TCPOS_ultra is not hydrophobic, even though it was
expected to be. The measured contact angle depends not only on the chemical composition, but
on the roughness of the surface as well. The values recorded could be an indication of the
roughness of the surface of CNC_TMPOS, which can be verified from the optical microscope
images, but since the contact angle is below 90 º the surface can be classified as non-
hydrophobic.
The contact angle values of water on Nafion (sessile drop) is 105º and that of water on Teflon is
110º 43. CNC_1.5TMPOS exhibits a greater contact angle than the two reported, which is a very
promising result for the continuation of the experiments for optimization of the membranes.
4.8 Tensile testing
Tensile testing was performed, in order to calculate Young’s modulus (E) for the membranes. A
few difficulties arose during the process, as the membranes were considerably brittle, and
cutting them was hence difficult to control. The samples resulted from the cutting of the
mambranes had uneven dimensions, which are recorded in (Appendix I). Hence, the results of
the tensile testing measurements of the samples are not comparable, nor reliable. Furthermore,
from the data of the table, the inhomogeneity of CNC_plain is once more highlighted.
The measured results from the software were given as Force/ Extension, which were converted
in Stress/ Strain. More specifically, the stress (σ) was calculated by dividing the Force by the Area
of the sample, using as length value the initial length, i.e. the length between the grips of the
instrument, which was set at 5 mm for every measurement. The strain (ε) was calculated by
dividing the Extension by the initial length. By plotting these data and fitting them in linear
regression, Young’s modulus was determined as the slope (Figure 40). The elongation at break
was not possible to determine as the samples were breaking close to the grips.

36 | P a g e
Unfortunately, the results for most of the samples were not reliable, since the membrane was
breaking with minimum Force (Appendix I).
In Figure 40, the stress versus strain curves for the CNC_plain (black line) and CNC_TMPOS
(red line) are depicted. From the diagram, it is obvious that E is larger for the CNC_TMPOS
membrane, i.e. this membrane is stiffer.
Figure 40: Stress versus Strain curve for CNC_plain (black) and CNC_TMPOS (red).
The results for the membranes CNC_plain and CNC_TMPOS are summarized in Table 8. These
are the most representative results, as it was possible to run three measurements for these
membranes. For the rest of the membranes, the results are not satisfactory (Appendix). This can
be due to the uneven network structure of the membranes from CNC_TMPOS membranes which
will cause a large variation in the mechanical properties.
Table 8: Young's modulus for CNC_plain and CNC_TMPOS membranes.
Samples Young’s modulus( 𝑮𝑷𝒂)
CNC_plain 0.84 ± 0.56 CNC_TMPOS 2.40 ± 0.46
37 | P a g e
5 Conclusions
The preparation of a cellulose based membrane for use in Vanadium Redox Flow Cell Batteries
(VRFB) was investigated in this study. In order to obtain an acid resistant material, CNCs were
preferred to CNFs. However, this choice lead to higher brittleness of the material, compared to
a possible CNF containing membrane. The use of the product of alkoxylation of
trichloro(1H,1H,2H,2H-perfluorooctyl)silane, which is referred to as TMPOS, gave the
opportunity for further protection of the surface of the CNC films. Creating a protecting network
around each CNC rod, TMPOS interfered with the interactions between the rods, leading to
altered properties, in terms of toughness, packing and acid resistance. With the addition of
TMPOS, membranes that exhibited higher contact angle compared to the Nafion with water
were produced.
Optimization studies and further investigation of the ionic selectivity and permeability of the
membranes need to be conducted. However, the results are already promising and show that
this is a step in the right direction to produce cellulose-based materials for VRFB applications.
38 | P a g e
6 References
1. Eurostat-statistics explained. http://ec.europa.eu/eurostat/statistics-explained/index.php/Energy_trends. 2. United Nations Framework Convention on Climate Change. http://bigpicture.unfccc.int/#content-the-paris-agreemen. 3. Dunn, B.; Kamath, H.; Tarascon, J.-M., Electrical Energy Storage for the Grid: A Battery of Choices. Science 2011, 334 (6058), 928-935. 4. Soloveichik, G. L., Flow Batteries: Current Status and Trends. Chemical Reviews 2015, 115, 11533-11558. 5. Park, M.; Ryu, J.; Wang, W.; Cho, J., Material design and engineering of next-generation flow-battery technologies. Nature Reviews Materials 2016, 2 (1). 6. Thaller, L. H., Electrically rechargeable redox flow cells. In Ninth Intersociety Energy Convention Engineering, San Fransisco, California, 1974. 7. Noack, J.; Roznyatovskaya, N.; Herr, T.; Fischer, P., The Chemistry of Redox-Flow Batteries. Angew Chem Int Ed Engl 2015, 54 (34), 9776-809. 8. Skyllas-Kazacos, M.; Cao, L.; Kazacos, M.; Kausar, N.; Mousa, A., Vanadium Electrolyte Studies for the Vanadium Redox Battery-A Review. ChemSusChem 2016, 9 (13), 1521-43. 9. Ulaganathan, M.; Aravindan, V.; Yan, Q.; Madhavi, S.; Skyllas-Kazacos, M.; Lim, T. M., Recent Advancements in All-Vanadium Redox Flow Batteries. Advanced Materials Interfaces 2016, 3 (1). 10. Qizhao Huang, Q. W., Next-Generation, High-Energy-Density Redox Flow Batteries. ChemPlusChem 2015, 80 (2), 312-322. 11. Weber, A. Z.; Mench, M. M.; Meyers, J. P.; Ross, P. N.; Gostick, J. T.; Liu, Q., Redox flow batteries: a review. Journal of Applied Electrochemistry 2011, 41 (10), 1137-1164. 12. M. Skyllas-Kazacos; M. Rychcik; R. G. Robins; Fane, A. G., New all-vanadium redox flow cell. Journal of Electrochemical Society 1986, 133 (5), 1057-1058. 13. Prifti, H.; Parasuraman, A.; Winardi, S.; Lim, T. M.; Skyllas-Kazacos, M., Membranes for redox flow battery applications. Membranes (Basel) 2012, 2 (2), 275-306. 14. Schwenzer, B.; Zhang, J.; Kim, S.; Li, L.; Liu, J.; Yang, Z., Membrane Development for Vanadium Redox Flow Batteries. ChemSusChem 2011, 4 (10), 1388-1406. 15. Youssef Habibi, L. A. L., Orlando J. Rojas, Cellulose Nanocrystals: Chemistry, Self-Assembly, and Applications. Chemical Reviews 2010, 110, 3479-3500. 16. Habibi, Y., Key advances in the chemical modification of nanocelluloses. Chem Soc Rev 2014, 43 (5), 1519-42. 17. Moon, R. J.; Martini, A.; Nairn, J.; Simonsen, J.; Youngblood, J., Cellulose nanomaterials review: structure, properties and nanocomposites. Chem Soc Rev 2011, 40 (7), 3941-94. 18. Brochier Salon, M.-C.; Belgacem, M. N., Hydrolysis-Condensation Kinetics of Different Silane Coupling Agents. Phosphorus, Sulfur, and Silicon and the Related Elements 2011, 186 (2), 240-254. 19. Salon, M. C.; Abdelmouleh, M.; Boufi, S.; Belgacem, M. N.; Gandini, A., Silane adsorption onto cellulose fibers: hydrolysis and condensation reactions. J Colloid Interface Sci 2005, 289 (1), 249-61. 20. Salon, M. C.; Gerbaud, G.; Abdelmouleh, M.; Bruzzese, C.; Boufi, S.; Belgacem, M. N., Studies of interactions between silane coupling agents and cellulose fibers with liquid and solid-state NMR. Magn Reson Chem 2007, 45 (6), 473-83. 21. Cypryk, M., Hydrolysis of Fluorosilanes: A Theoretical Study. Journal of physical chemistry 2005, 109 (51), 12020-12026. 22. Chen, R.; Kim, S.; Chang, Z., Redox Flow Batteries: Fundamentals and Applications. In Redox - Principles and Advanced Applications, 2017.
39 | P a g e
23. Perry, M. L.; Weber, A. Z., Advanced Redox-Flow Batteries: A Perspective. Journal of The Electrochemical Society 2015, 163 (1), A5064-A5067. 24. Chen, D.; Hickner, M. A.; Wang, S.; Pan, J.; Xiao, M.; Meng, Y., Directly fluorinated polyaromatic composite membranes for vanadium redox flow batteries. Journal of Membrane Science 2012, 415-416, 139-144. 25. Doan, T. N. L.; Hoang, T. K. A.; Chen, P., Recent development of polymer membranes as separators for all-vanadium redox flow batteries. RSC Advances 2015, 5 (89), 72805-72815. 26. Li, X.; Zhang, H.; Mai, Z.; Zhang, H.; Vankelecom, I., Ion exchange membranes for vanadium redox flow battery (VRB) applications. Energy & Environmental Science 2011, 4 (4). 27. Kenneth A. Mauritz, R. B. M., State of Understanding of Nafion. Chemical Reviews 2004, 104, 4535-4585. 28. D., G. T.; E., M. G.; C., W. F., The morphology in nafion perfluorinated membrane products, as determined by wide‐ and small‐angle x‐ray studies. Journal of Polymer Science: Polymer Physics Edition 1981, 19 (11), 1687-1704. 29. Updegraff, D. M., Semimicro determination of cellulose inbiological materials. Analytical Biochemistry 1969, 32 (3), 420-424. 30. Reid, M. S.; Villalobos, M.; Cranston, E. D., Benchmarking Cellulose Nanocrystals: From the Laboratory to Industrial Production. Langmuir 2017, 33 (7), 1583-1598. 31. Tran, A.; Hamad, W. Y.; MacLachlan, M. J., Tactoid Annealing Improves Order in Self-Assembled Cellulose Nanocrystal Films with Chiral Nematic Structures. Langmuir 2018, 34 (2), 646-652. 32. Kun, Y.; Qijun, M.; Vincent, B.; Qi, Z., Flexible and Responsive Chiral Nematic Cellulose Nanocrystal/Poly(ethylene glycol) Composite Films with Uniform and Tunable Structural Color. Advanced Materials 2017, 29 (28), 1701323. 33. Hollertz, R.; Durán, V. L.; Larsson, P. A.; Wågberg, L., Chemically modified cellulose micro- and nanofibrils as paper-strength additives. Cellulose 2017, 24 (9), 3883-3899. 34. Erlandsson, J.; Duran, V. L.; Granberg, H.; Sandberg, M.; Larsson, P. A.; Wågberg, L., Macro- and mesoporous nanocellulose beads for use in energy storage devices. APPLIED MATERIALS TODAY 2016, 5, 246-254. 35. Ryutaro Wakabayashi, Y. S., Toshimichi Shibue, and Kazuyuki Kuroda, Practical Conversion of Chlorosilanes into Alkoxysilanes without Generating HCl. 36. Wakabayashi, R.; Sugiura, Y.; Shibue, T.; Kuroda, K., Practical conversion of chlorosilanes into alkoxysilanes without generating HCl. Angew Chem Int Ed Engl 2011, 50 (45), 10708-11. 37. Comprehensive Organic Chemistry Experiments for the Laboratory Classroom. The Royal Society of Chemistry 2017. 38. McMurry, J., Fundamentals of Organic Chemistry, International Edition. Seventh edition, International edition. ed.; United States: Brooks Cole - M.U.A: 2010. 39. Holmberg, K., Jönsson, B., Kronberg, B., Lindman, B., Surfactants and Polymers in aqueous solutions. 2nd ed.; 2003. 40. Battista, O. A.; Coppick, S.; Howsmon, J. A.; Morehead, F. F.; Sisson, W. A., Level-Off Degree of Polymerization. Industrial & Engineering Chemistry 1956, 48 (2), 333-335. 41. Socrates, G., Infrared and Raman Characteristic Group Frequencies. 3rd ed.; 2001. 42. Foster, E. J.; Moon, R. J.; Agarwal, U. P.; Bortner, M. J.; Bras, J.; Camarero-Espinosa, S.; Chan, K. J.; Clift, M. J. D.; Cranston, E. D.; Eichhorn, S. J.; Fox, D. M.; Hamad, W. Y.; Heux, L.; Jean, B.; Korey, M.; Nieh, W.; Ong, K. J.; Reid, M. S.; Renneckar, S.; Roberts, R.; Shatkin, J. A.; Simonsen, J.; Stinson-Bagby, K.; Wanasekara, N.; Youngblood, J., Current characterization methods for cellulose nanomaterials. Chemical Society Reviews 2018, 47 (8), 2609-2679. 43. Goswami, S.; Klaus, S.; Benziger, J., Wetting and Absorption of Water Drops on Nafion Films. Langmuir 2008, 24 (16), 8627-8633.
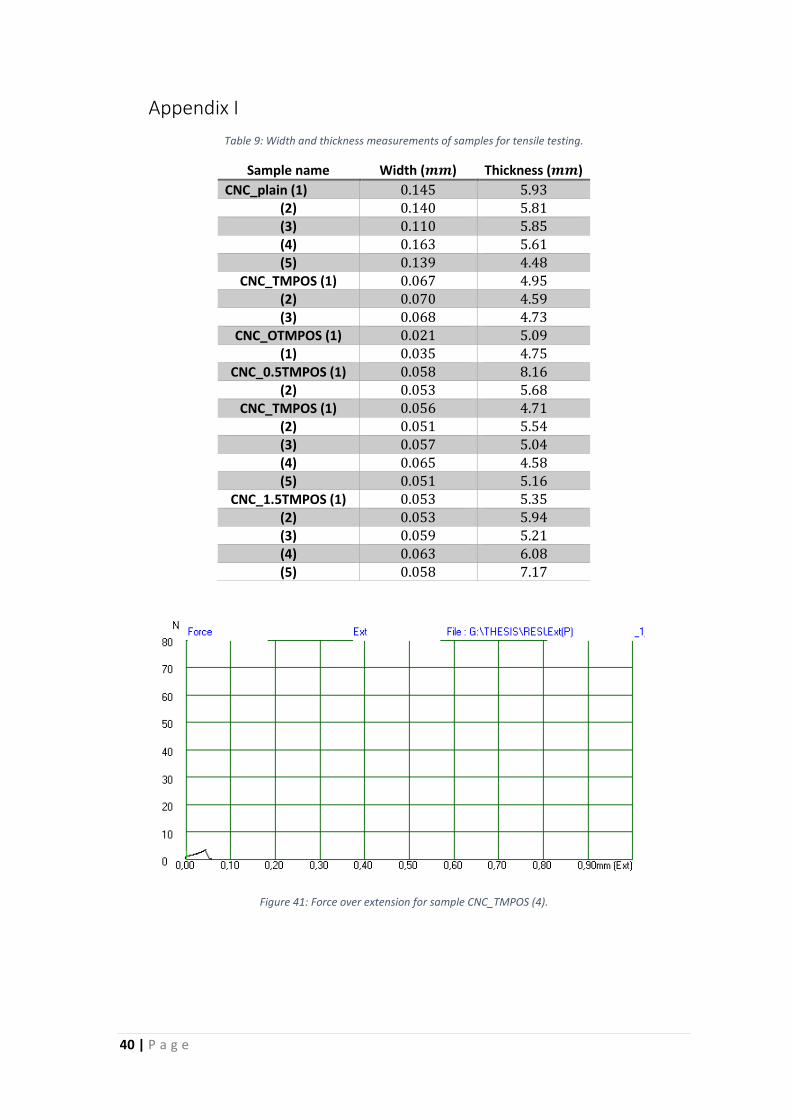
40 | P a g e
Appendix I
Table 9: Width and thickness measurements of samples for tensile testing.
Sample name Width (𝒎𝒎) Thickness (𝒎𝒎)
CNC_plain (1) 0.145 5.93 (2) 0.140 5.81 (3) 0.110 5.85 (4) 0.163 5.61 (5) 0.139 4.48
CNC_TMPOS (1) 0.067 4.95 (2) 0.070 4.59 (3) 0.068 4.73
CNC_OTMPOS (1) 0.021 5.09 (1) 0.035 4.75
CNC_0.5TMPOS (1) 0.058 8.16 (2) 0.053 5.68
CNC_TMPOS (1) 0.056 4.71 (2) 0.051 5.54 (3) 0.057 5.04 (4) 0.065 4.58 (5) 0.051 5.16
CNC_1.5TMPOS (1) 0.053 5.35 (2) 0.053 5.94 (3) 0.059 5.21 (4) 0.063 6.08 (5) 0.058 7.17
Figure 41: Force over extension for sample CNC_TMPOS (4).
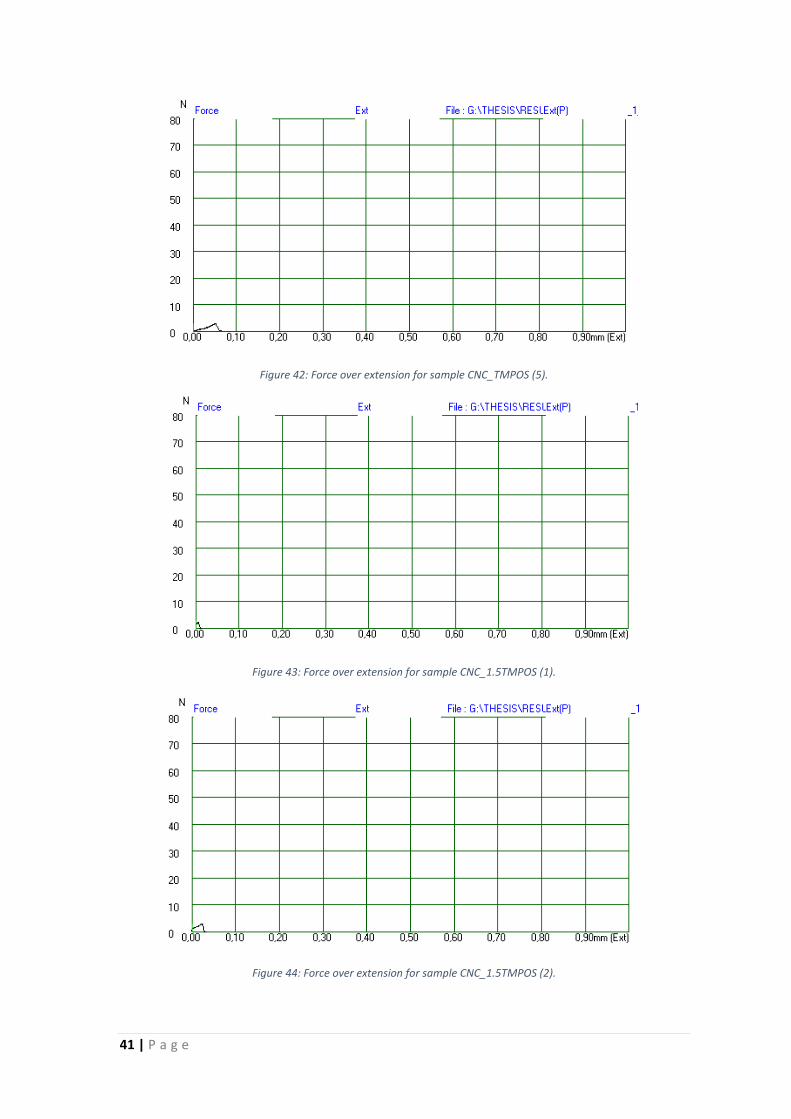
41 | P a g e
Figure 42: Force over extension for sample CNC_TMPOS (5).
Figure 43: Force over extension for sample CNC_1.5TMPOS (1).
Figure 44: Force over extension for sample CNC_1.5TMPOS (2).

42 | P a g e
Appendix II
Silicon NMR spectra of TMPOS.
Figure 45: Silicon NMR spectrum for TMPOS production.
Figure 46: Second attempt to obtain silicon NMR spectrum for the production of TMPOS.

43 | P a g e
Appendix III
Images from contact angle measurements.
.
Figure 50: Image of CNC_plain membrane during contact angle measurement.
Figure 50: Image of membrane CNC_TCPOS_ultra during contact angle measurements.
Figure 50: Image of CNC_1.5TMPOS during angle measurements, with overlays.
Figure 50: Image of CNC/CNF-CHO membrane during contact angle measurements.
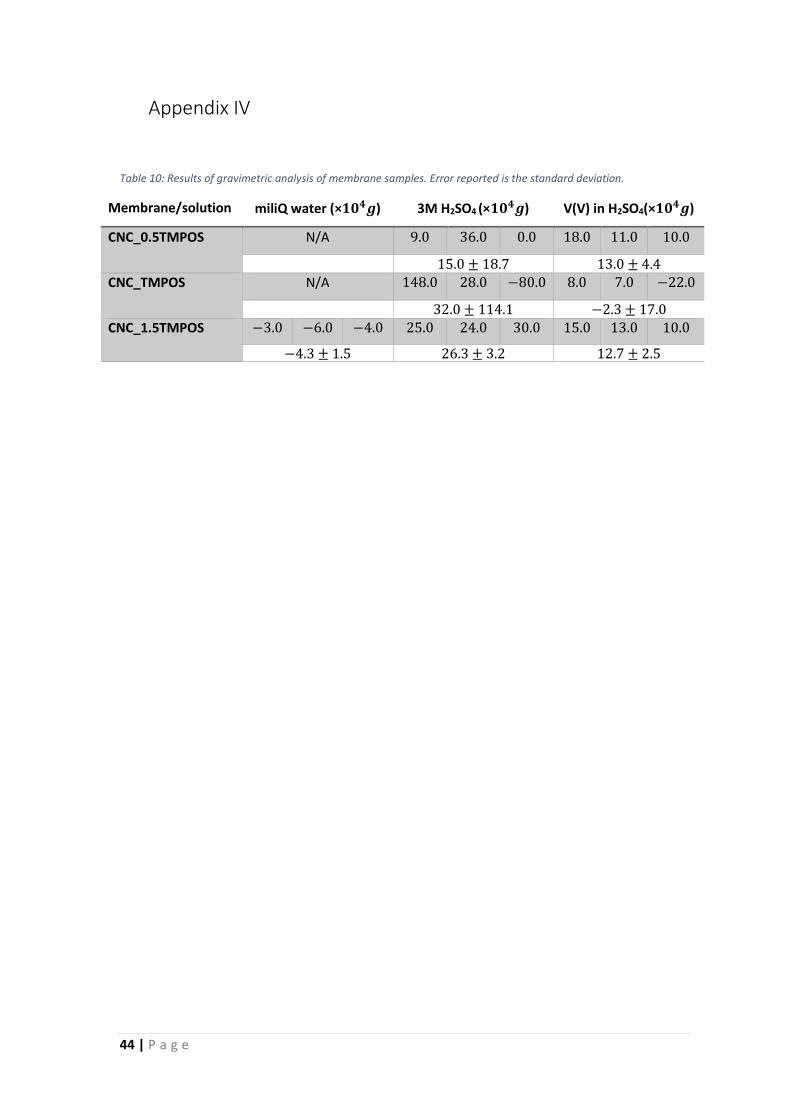
44 | P a g e
Appendix IV
Table 10: Results of gravimetric analysis of membrane samples. Error reported is the standard deviation.
Membrane/solution miliQ water (×𝟏𝟎𝟒𝒈) 3M H2SO4 (×𝟏𝟎𝟒𝒈) V(V) in H2SO4(×𝟏𝟎𝟒𝒈)
CNC_0.5TMPOS N/A 9.0 36.0 0.0 18.0 11.0 10.0
15.0 ± 18.7 13.0 ± 4.4 CNC_TMPOS N/A 148.0 28.0 −80.0 8.0 7.0 −22.0
32.0 ± 114.1 −2.3 ± 17.0 CNC_1.5TMPOS −3.0 −6.0 −4.0 25.0 24.0 30.0 15.0 13.0 10.0
−4.3 ± 1.5 26.3 ± 3.2 12.7 ± 2.5

45 | P a g e


