Development of Climate Change Development of Climate Change Scenarios of Rainfall and Scenarios of Rainfall and Temperature over the Indian Temperature over the Indian region region Potential Impacts: Potential Impacts: • Water Resources Water Resources • Agriculture Agriculture • Sea Level Rise Sea Level Rise and many more sectors… and many more sectors…
Transcript
Development of Climate Change Development of Climate Change Scenarios of Rainfall and Scenarios of Rainfall and Temperature over the Indian Temperature over the Indian regionregion
Potential Impacts:Potential Impacts:
• Water ResourcesWater Resources• AgricultureAgriculture• Sea Level RiseSea Level Rise
and many more sectors…and many more sectors…
Interlinking of Rivers in IndiaInterlinking of Rivers in India
Proposed River LinkagesProposed River Linkages
Climate Scenarios:Climate Scenarios:What are they ?What are they ?
A climate scenario is a plausible A climate scenario is a plausible representation of future climate that representation of future climate that has been constructed for explicit use has been constructed for explicit use in investigating the potential impacts in investigating the potential impacts of anthropogenic climate change.of anthropogenic climate change.
Uncertainties in Climate Uncertainties in Climate ScenariosScenarios
• Specifying alternative emissions futuresSpecifying alternative emissions futures• Uncertainties in converting emissions to Uncertainties in converting emissions to
concentrationsconcentrations• Uncertainties in converting concentrations to Uncertainties in converting concentrations to
radiative forcingradiative forcing• Uncertainties in modelling the climate response Uncertainties in modelling the climate response
to a given radiative forcingto a given radiative forcing• Uncertainties in converting model response into Uncertainties in converting model response into
inputs for impact studiesinputs for impact studies
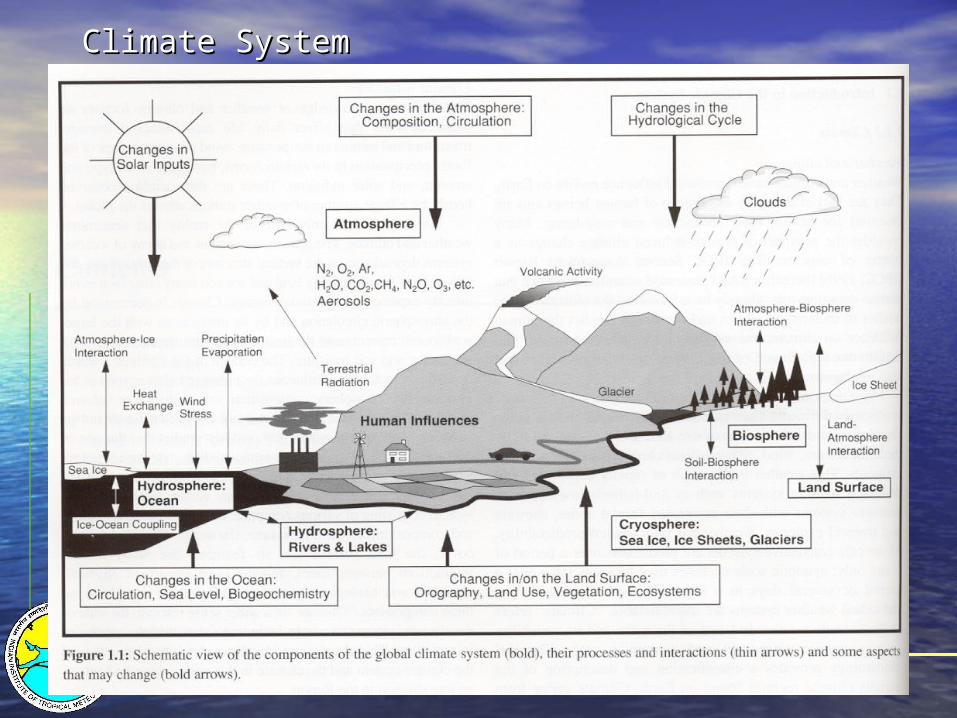
Climate SystemClimate System
Climate ModelsClimate Models
• Simplified mathematical representation of the Earth’s climate system
• Skill depends on the level of our understanding of the physical, geophysical, chemical and biological processes that govern the climate system
• Substantial improvements over the last two decades• Sub-models : atmosphere, ocean, land surface, cryosphere,
biosphere• Typical Resolution of global models (atmosphere) :
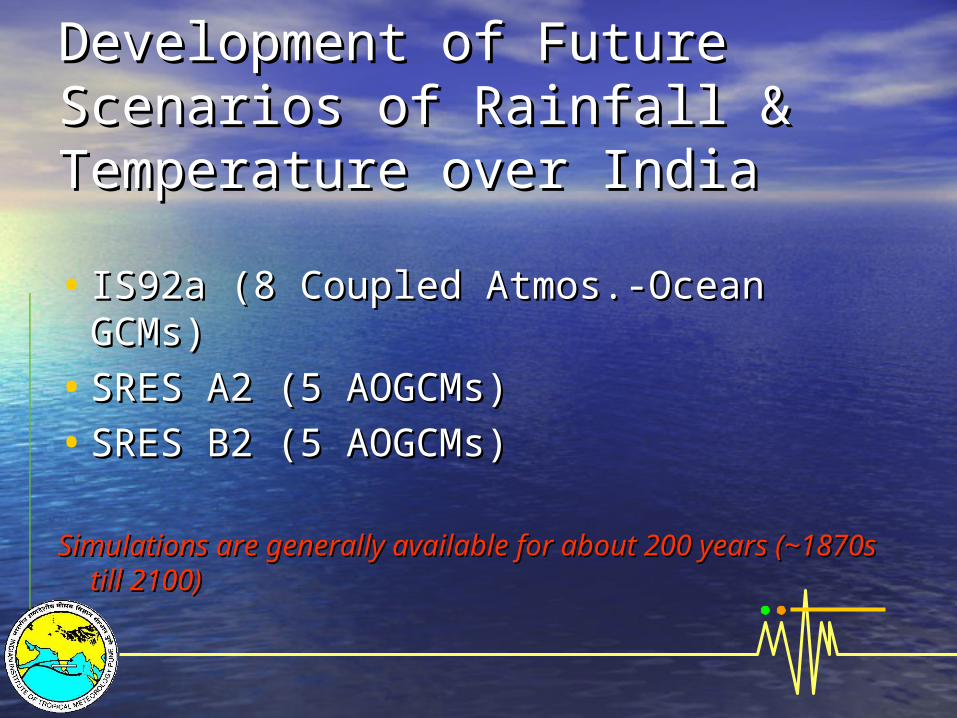
Simulations are generally available for about 200 Simulations are generally available for about 200 years (~1870s till 2100)years (~1870s till 2100)
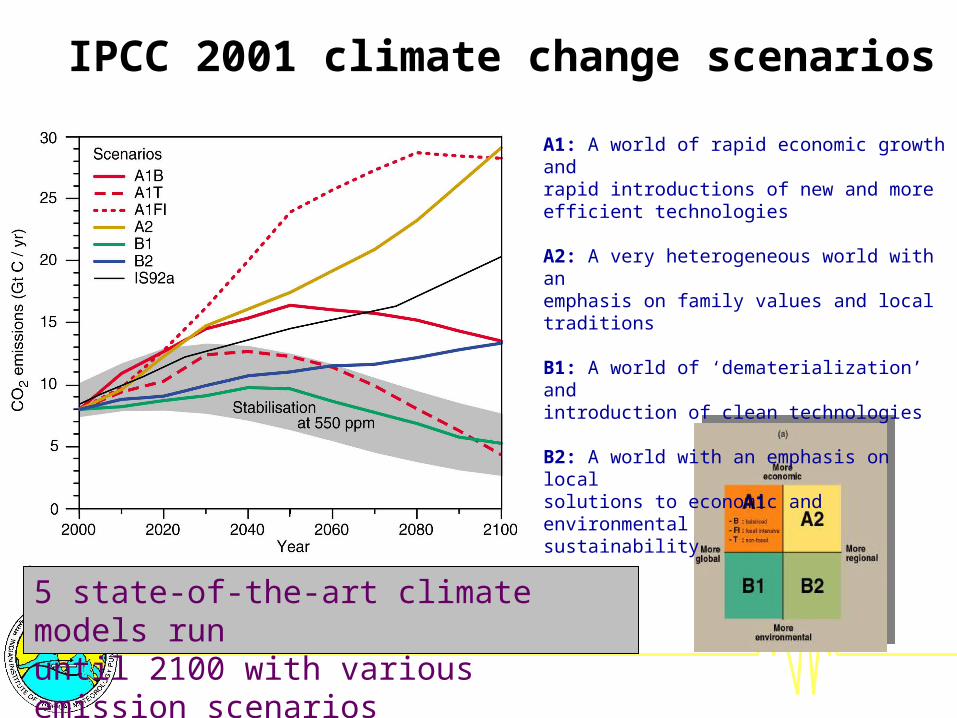
A1: A world of rapid economic growth and rapid introductions of new and more efficient technologies
A2: A very heterogeneous world with an emphasis on family values and local traditions
B1: A world of ‘dematerialization’ and introduction of clean technologies
B2: A world with an emphasis on local solutions to economic and environmental sustainability
IPCC 2001 climate change scenarios
5 state-of-the-art climate models rununtil 2100 with various emission scenarios
Predicted precipitation change 2080-2000
Source: IPCC 2001 Cubasch
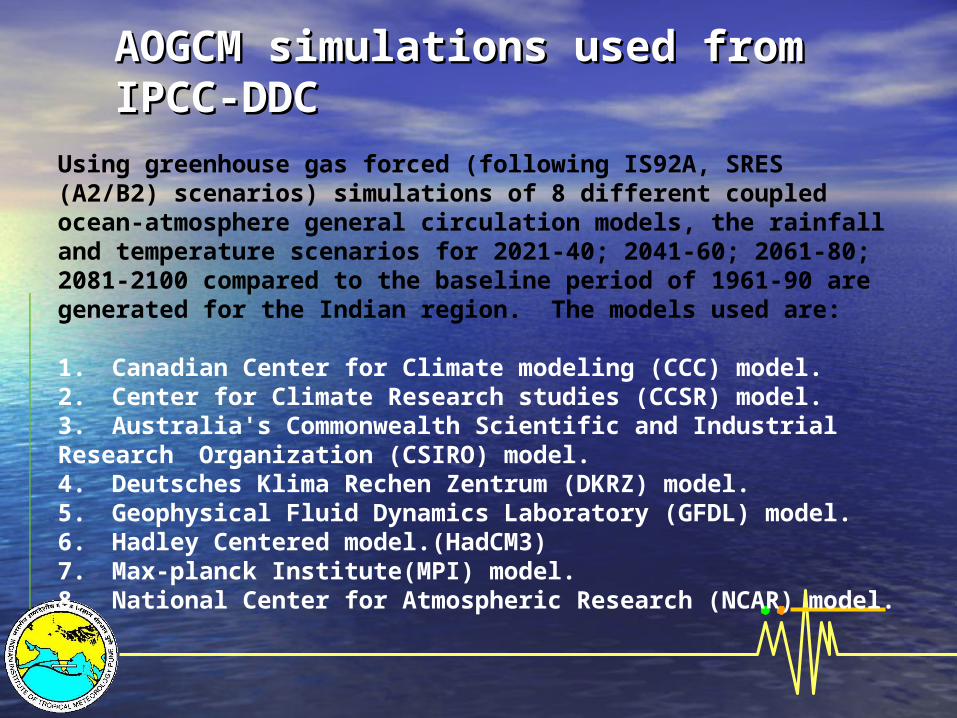
AOGCM simulations used from IPCC-DDCAOGCM simulations used from IPCC-DDC
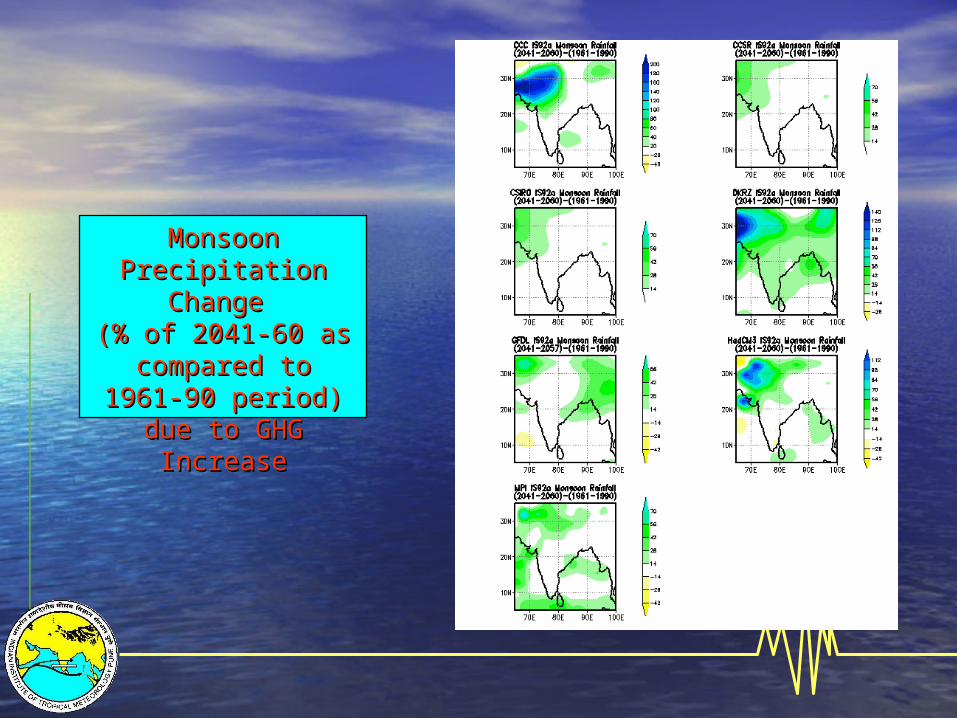
Using greenhouse gas forced (following IS92A, SRES (A2/B2) scenarios) simulations of 8 different coupled ocean-atmosphere general circulation models, the rainfall and temperature scenarios for 2021-40; 2041-60; 2061-80; 2081-2100 compared to the baseline period of 1961-90 are generated for the Indian region. The models used are:
1. Canadian Center for Climate modeling (CCC) model.2. Center for Climate Research studies (CCSR) model.3. Australia's Commonwealth Scientific and Industrial Research Organization (CSIRO) model.4. Deutsches Klima Rechen Zentrum (DKRZ) model. 5. Geophysical Fluid Dynamics Laboratory (GFDL) model.6. Hadley Centered model.(HadCM3)7. Max-planck Institute(MPI) model. 8. National Center for Atmospheric Research (NCAR) model.
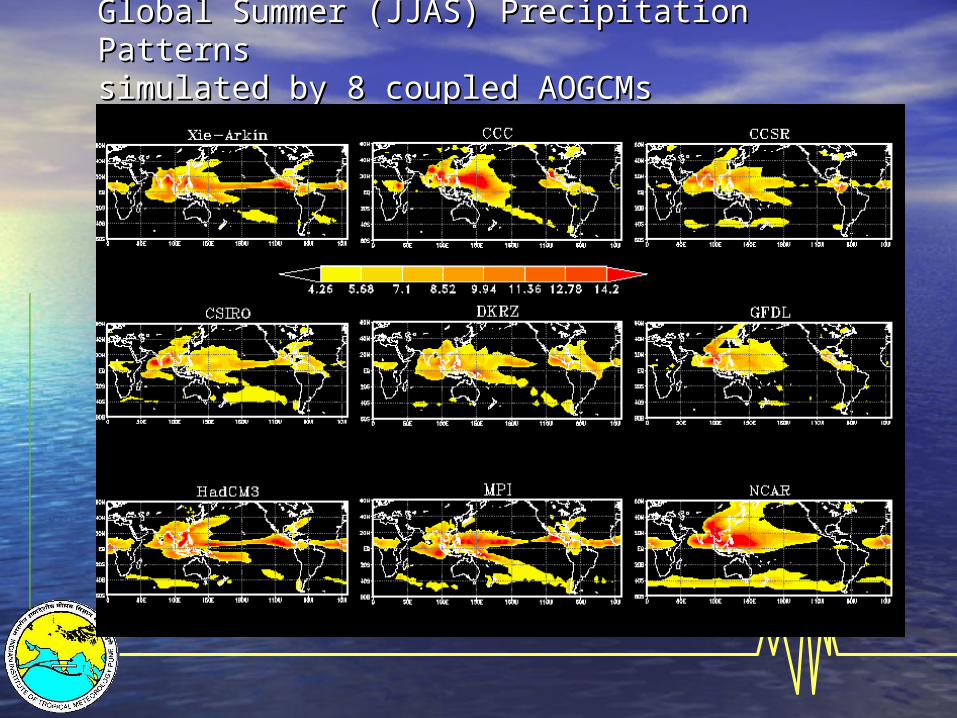
Global Summer (JJAS) Precipitation Patterns Global Summer (JJAS) Precipitation Patterns simulated by 8 coupled AOGCMssimulated by 8 coupled AOGCMs
Indian Summer Monsoon Patterns as simulated by 8 Indian Summer Monsoon Patterns as simulated by 8 coupled AOGCMscoupled AOGCMs
Annual Surface Air Temperature Patterns over India Annual Surface Air Temperature Patterns over India simulated by 8 coupled AOGCMssimulated by 8 coupled AOGCMs
Climate Change Scenarios of Rainfall over the Climate Change Scenarios of Rainfall over the Indian Region in 8 Coupled ModelsIndian Region in 8 Coupled Models
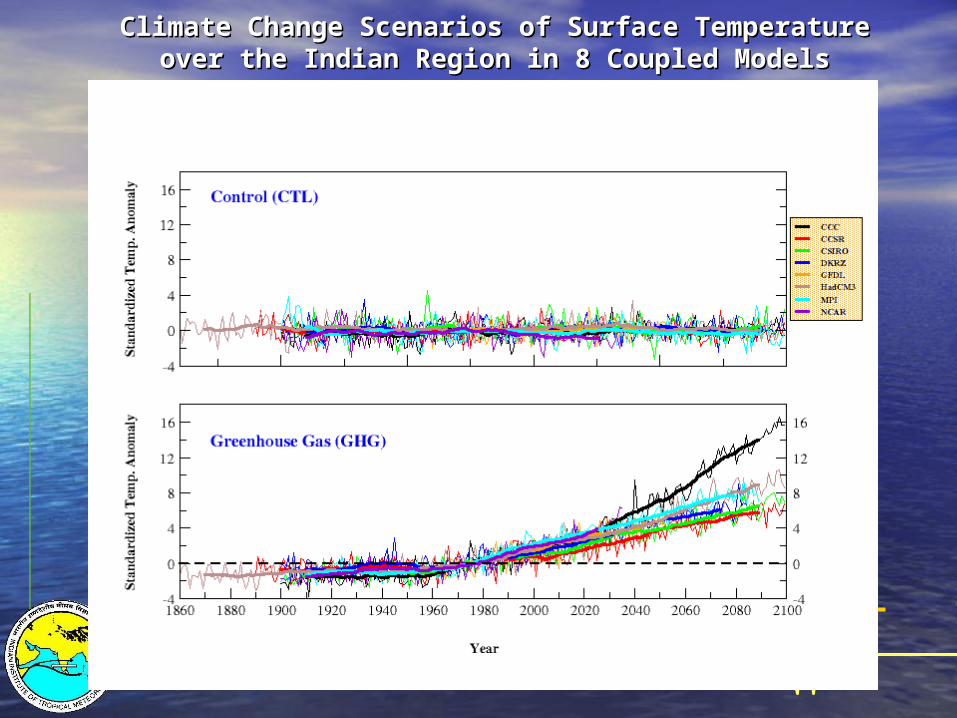
Climate Change Scenarios of Surface Temperature Climate Change Scenarios of Surface Temperature over the Indian Region in 8 Coupled Modelsover the Indian Region in 8 Coupled Models
Monsoon Monsoon Precipitation Precipitation
Change Change (% of 2041-60 as (% of 2041-60 as
compared to 1961-compared to 1961-90 period) due to 90 period) due to
GHG IncreaseGHG Increase
Monsoon Monsoon Precipitation Precipitation
Change Change (% of 2061-80 as (% of 2061-80 as
compared to compared to 1961-90 period) 1961-90 period)
due to GHG due to GHG IncreaseIncrease
Annual Surface Annual Surface Temperature Temperature Change (Deg. C Change (Deg. C in 2061-80 in 2061-80 compared to compared to 1961-90 1961-90 period) due to period) due to GHG IncreaseGHG Increase
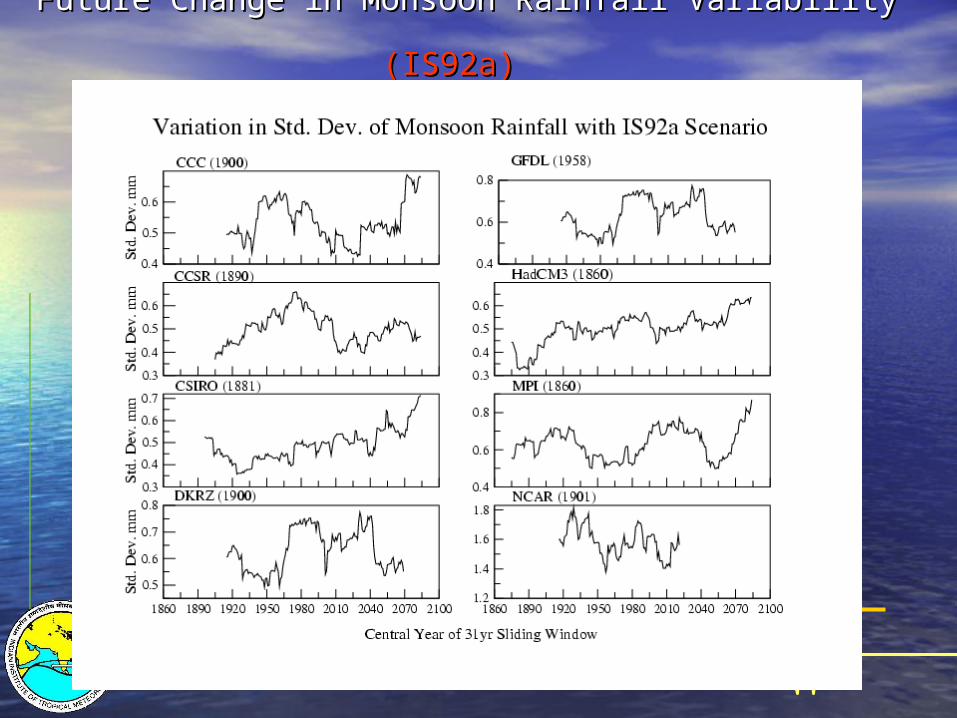
Future Change in Monsoon Rainfall Variability Future Change in Monsoon Rainfall Variability (IS92a)(IS92a)
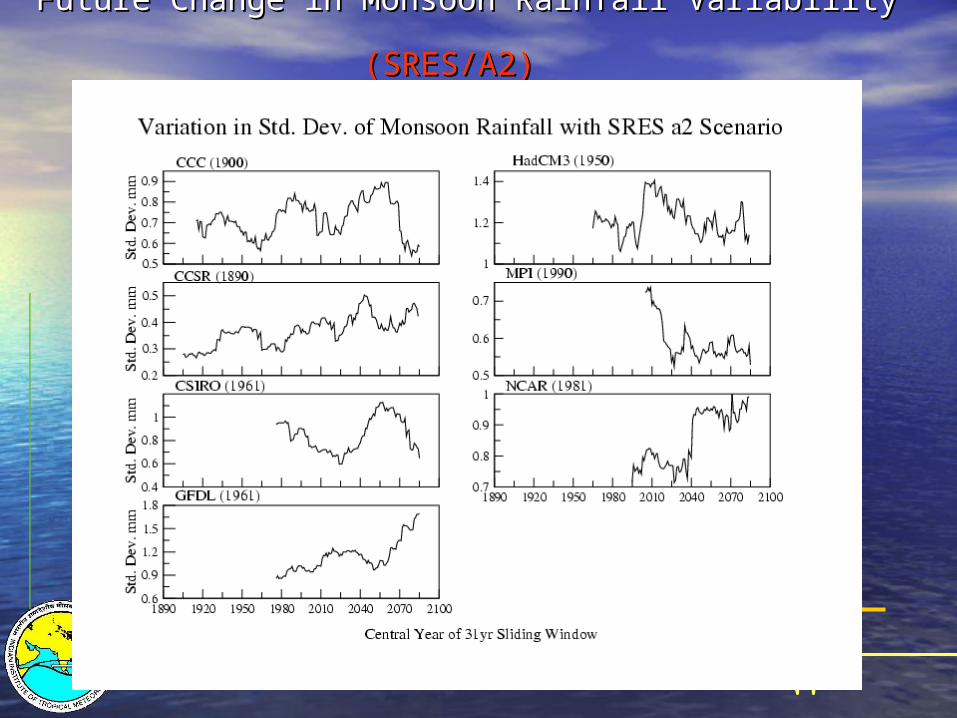
Future Change in Monsoon Rainfall Variability Future Change in Monsoon Rainfall Variability
(SRES/A2)(SRES/A2)
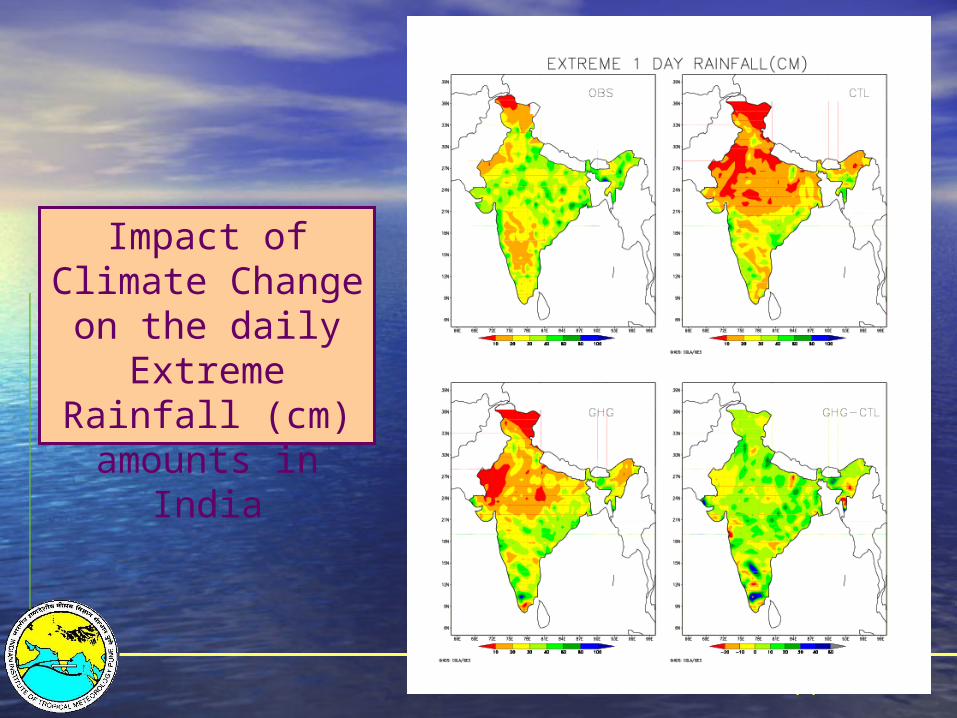
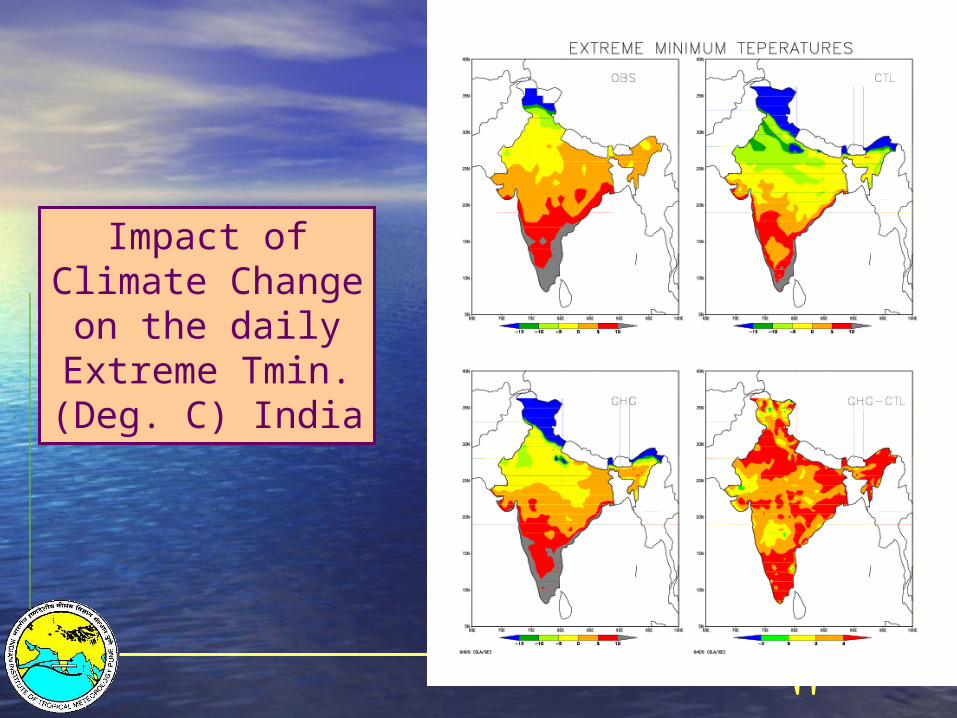
High-resolution Climate High-resolution Climate Change Scenarios using Change Scenarios using Regional Climate Model Regional Climate Model
(HadRM3)(HadRM3)
The Hadley Centre Regional Climate The Hadley Centre Regional Climate ModelsModels(HadRM2/HadRM3)(HadRM2/HadRM3)
• High-resolution limited area model driven at its lateral and High-resolution limited area model driven at its lateral and sea-surface boundaries by output from HadCMsea-surface boundaries by output from HadCM
• Formulation identical to HadAMFormulation identical to HadAM• Grid : 0.44° x 0.44°Grid : 0.44° x 0.44°• One-way nestingOne-way nesting• Joint Indo-UK Collaborative research programme on climate Joint Indo-UK Collaborative research programme on climate
change impacts in Indiachange impacts in India• Climate change simulations performed by the Hadley Climate change simulations performed by the Hadley
Centre using HadRM2 for the Indian region (the output is Centre using HadRM2 for the Indian region (the output is being currently analysed by IITM)being currently analysed by IITM)
• HadRM3 installed at IITM; Climate change simulations and HadRM3 installed at IITM; Climate change simulations and scenario development in progress at IITMscenario development in progress at IITM
Model OrographiesModel Orographiesin GCM and RCMin GCM and RCM
Observed and Simulated Indian Summer Observed and Simulated Indian Summer Monsoon Rainfall (GCM vs. RCM)Monsoon Rainfall (GCM vs. RCM)
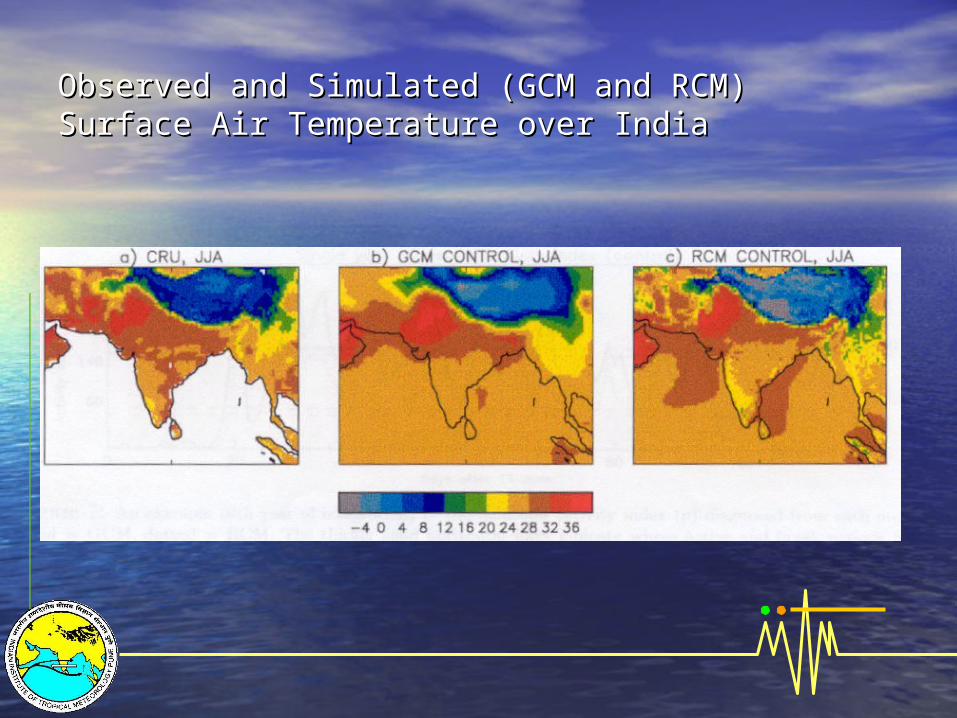
Observed and Simulated (GCM and RCM) Surface Observed and Simulated (GCM and RCM) Surface Air Temperature over IndiaAir Temperature over India
Indian Indian Summer Summer Monsoon Monsoon Simulations Simulations by HadRM2by HadRM2
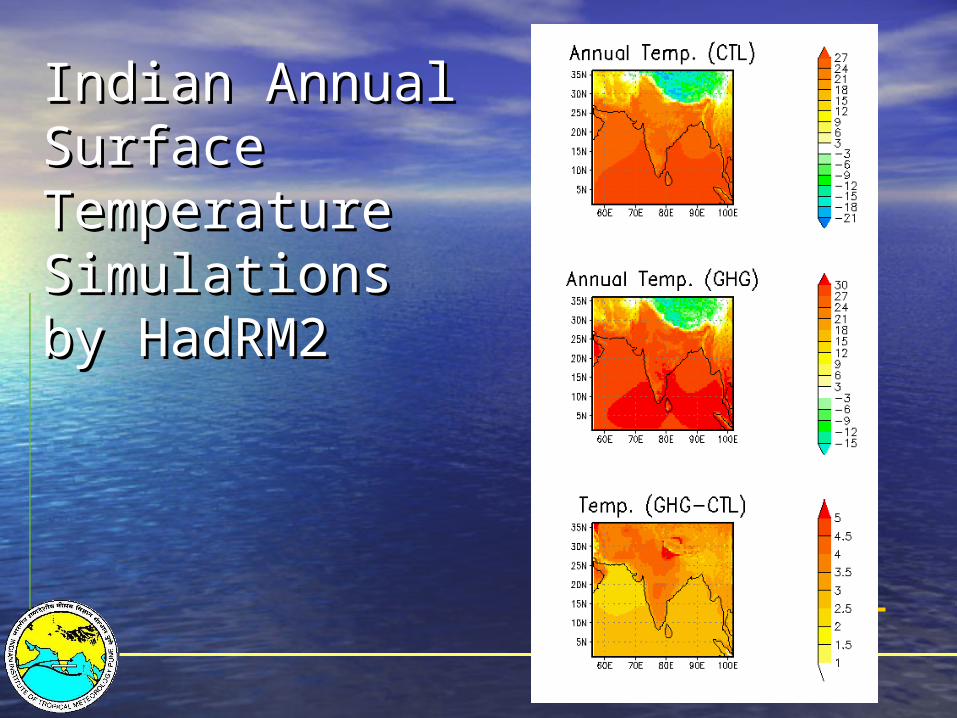
Indian Annual Indian Annual Surface Surface Temperature Temperature Simulations by Simulations by HadRM2HadRM2
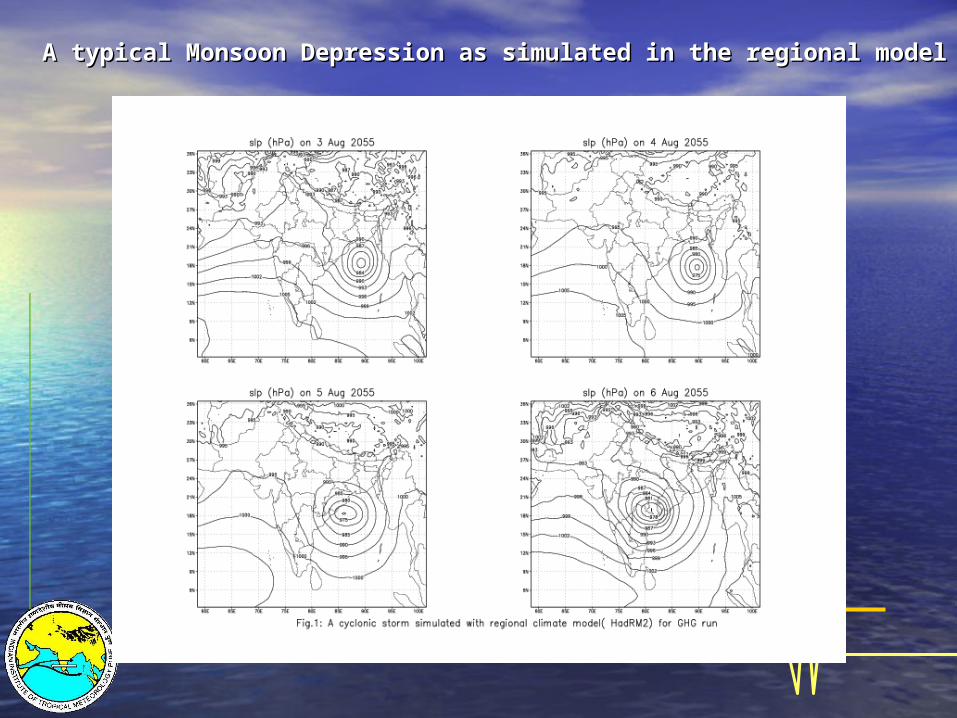
Simulation of Monsoon Simulation of Monsoon Depressions/Cyclonic Storms in Depressions/Cyclonic Storms in HadRM2 and Likely Future HadRM2 and Likely Future ChangesChanges
• Changes in Monsoon Changes in Monsoon Depression/Cyclonic Storm Tracks in Depression/Cyclonic Storm Tracks in GHG Scenarios.GHG Scenarios.
• Frequency of Depressions/Cyclones.Frequency of Depressions/Cyclones.• Intensity of Storms.Intensity of Storms.
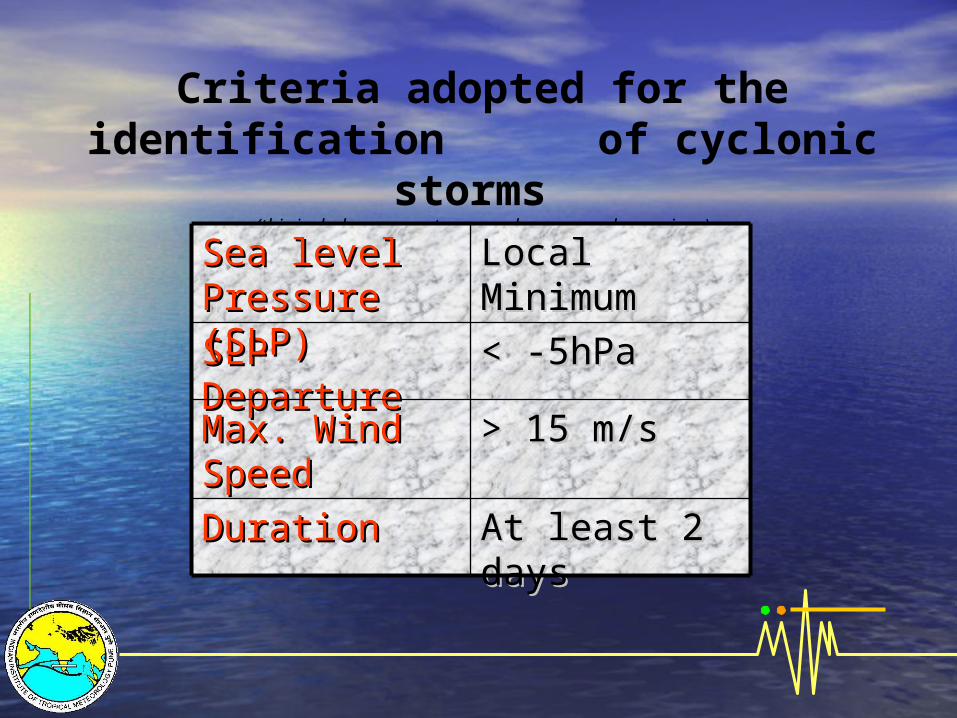
Criteria adopted for the identification of cyclonic storms
(this includes severe storms and monsoon depressions)
At least 2 At least 2 daysdays
DurationDuration
> 15 m/s> 15 m/sMax. Wind Max. Wind SpeedSpeed
< -5hPa< -5hPaSLP SLP DepartureDeparture
Local Local MinimumMinimum
Sea level Sea level Pressure Pressure (SLP)(SLP)
A typical Monsoon Depression as simulated in the regional modelA typical Monsoon Depression as simulated in the regional model
Monsoon Monsoon Depression Depression Tracks as Tracks as simulated in simulated in HadRM2 control HadRM2 control and GHG and GHG ExperimentsExperiments
Pre and Post-Pre and Post-Monsoon Monsoon Cyclonic Storms Cyclonic Storms and likely and likely Changes in GHG Changes in GHG RunsRuns
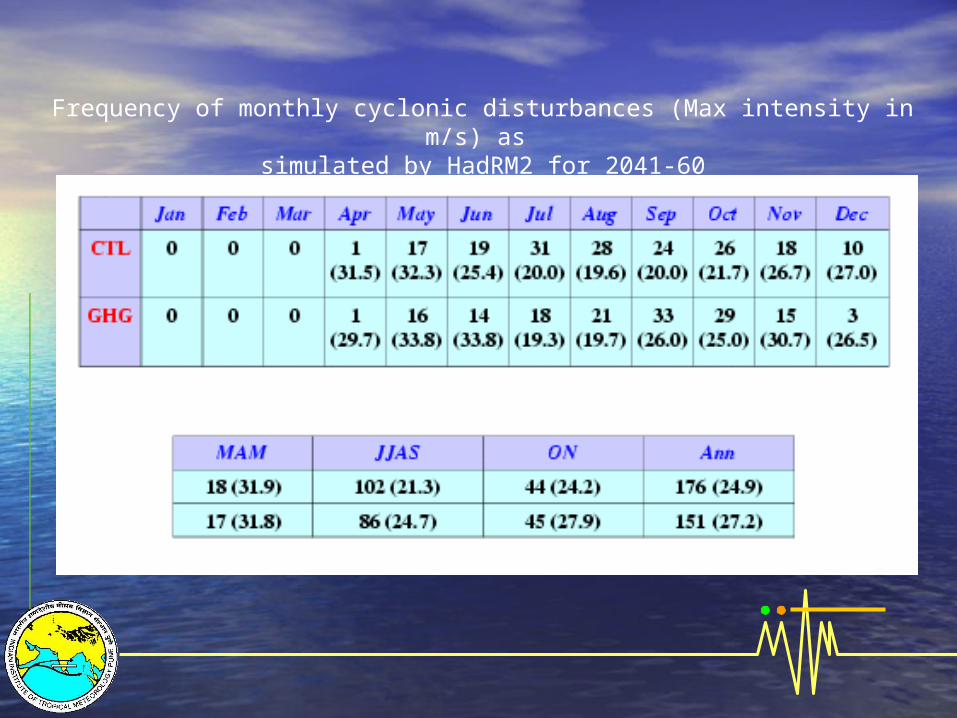
Frequency of monthly cyclonic disturbances (Max intensity in m/s) as simulated by HadRM2 for 2041-60
Simulation of No. Simulation of No. of Rainy Days in of Rainy Days in the Hadley the Hadley Center Regional Center Regional Model and likely Model and likely future changes future changes in 2041-60in 2041-60