32 PCI Journal | March–April 2018 Development of design guidelines for ledges of L-shaped beams Mohamed K. Nafadi, Gregory W. Lucier, Sami Rizkalla, Paul Zia, and Gary J. Klein ■ This paper presents the development of a design procedure for the eighth edition of the PCI Design Handbook to evaluate the punching shear strength of ledges of L-shaped beams. ■ Based on the failure surfaces observed throughout a comprehensive experimental program, an idealized failure surface was determined. ■ A procedure to evaluate the punching shear strength of the ledge was developed to provide an improved margin of safety for ledge capacity under a wide range of loading conditions. T his paper is part of a series of three that reports research on the behavior and punching shear strength of ledges of L-shaped beams. The research program included experimental tests of 21 short beams of 15.5 ft (4.72 m) span, 8 long beams of 45.5 ft (13.9 m) span, and 1 long beam of 36.5 ft (11.1 m) span. All short beams were re- inforced with mild steel only, while all long beams were pre- stressed, except for one 45.5 ft span beam. All beams were subjected to multiple tests at different locations along the ledge, resulting in 106 total tests in the program. The results of these tests were presented in the first two papers in this series. 1,2 In addition to the test program, the research also included the development of a three-dimensional nonlinear finite element model (FEM), validated by the experimental data and other data reported in the literature. 3–9 The FEM was used initially to examine the possible effects of various design parameters, thus providing a basis for design of the experimental program. The FEM was also used to generate additional data supplementing the experimental data. 10 Research findings revealed that several parameters signif- icant to ledge punching shear strength are not considered by the design procedure presented in the seventh edition of the PCI Design Handbook: Precast and Prestressed Con- crete 11 for the ledges of L-shaped beams, referred to as the PCI procedure in this paper. These parameters include the global flexural and shear stresses, prestressing, and load eccentricity. While high levels of global stress and increased load eccentricity cause reductions in ledge capacity, the use of prestressing enhances the load-carrying capacity of the
Transcript
32 PCI Journal | March–April 2018
Development of design guidelines for ledges of L-shaped beams
Mohamed K. Nafadi, Gregory W. Lucier, Sami Rizkalla, Paul Zia, and Gary J. Klein
■ This paper presents the development of a design procedure for the eighth edition of the PCI Design Handbook to evaluate the punching shear strength of ledges of L-shaped beams.
■ Based on the failure surfaces observed throughout a comprehensive experimental program, an idealized failure surface was determined.
■ A procedure to evaluate the punching shear strength of the ledge was developed to provide an improved margin of safety for ledge capacity under a wide range of loading conditions.
This paper is part of a series of three that reports research on the behavior and punching shear strength of ledges of L-shaped beams. The research program
included experimental tests of 21 short beams of 15.5 ft (4.72 m) span, 8 long beams of 45.5 ft (13.9 m) span, and 1 long beam of 36.5 ft (11.1 m) span. All short beams were re-inforced with mild steel only, while all long beams were pre-stressed, except for one 45.5 ft span beam. All beams were subjected to multiple tests at different locations along the ledge, resulting in 106 total tests in the program. The results of these tests were presented in the first two papers in this series.1,2 In addition to the test program, the research also included the development of a three-dimensional nonlinear finite element model (FEM), validated by the experimental data and other data reported in the literature.3–9 The FEM was used initially to examine the possible effects of various design parameters, thus providing a basis for design of the experimental program. The FEM was also used to generate additional data supplementing the experimental data.10
Research findings revealed that several parameters signif-icant to ledge punching shear strength are not considered by the design procedure presented in the seventh edition of the PCI Design Handbook: Precast and Prestressed Con-crete11 for the ledges of L-shaped beams, referred to as the PCI procedure in this paper. These parameters include the global flexural and shear stresses, prestressing, and load eccentricity. While high levels of global stress and increased load eccentricity cause reductions in ledge capacity, the use of prestressing enhances the load-carrying capacity of the
Elevation ≅ 26° to 45°
≅ 18° to 45°
Plan view
≅ 26° to 45°
≅ 18° to 45°
45°45°
Asymmetric failure
Symmetric failure
hl
de
bt
lp
lp
e´
33PCI Journal | March–April 2018
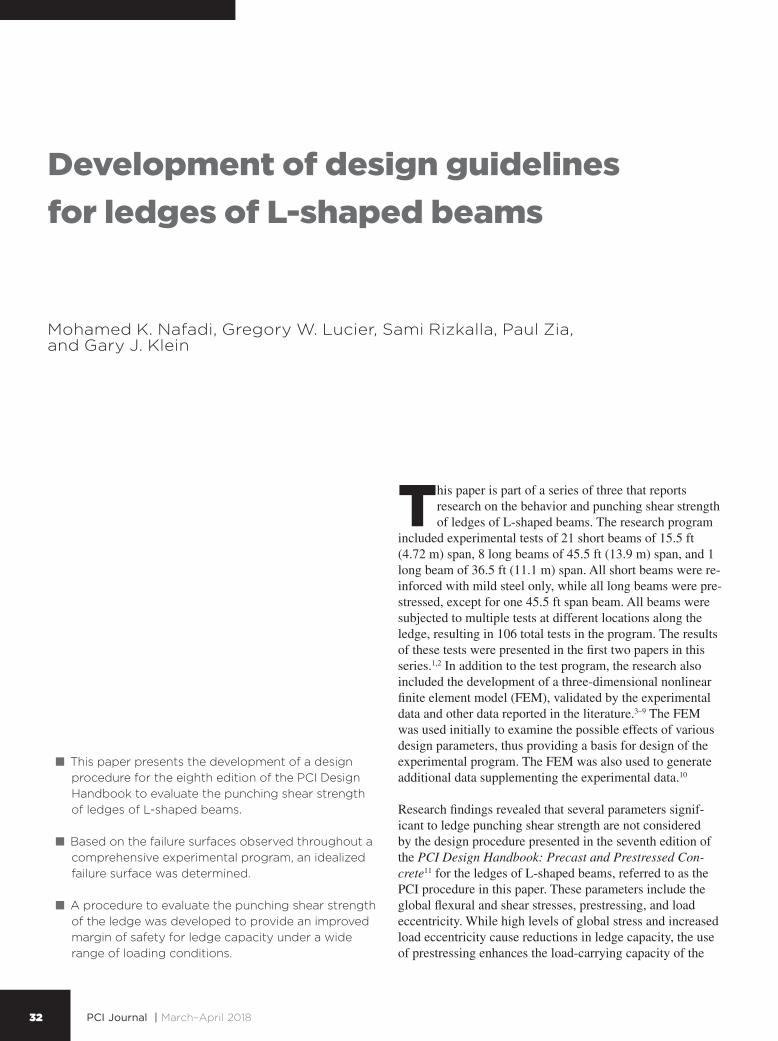
Figure 1. Isolated symmetric and asymmetric failures. Note: bt = width of the double-tee stem or the width of the bearing pad, whichever is less; de = distance from the center of an applied concentrated load to end of the ledge; e' = eccentricity of the fac-tored ledge vertical load to the inner web face; hl = height of beam ledge; lp = projection of the ledge.
ledge. The PCI procedure assumes 45-degree failure planes; however, observed failure planes were generally inclined at shallower angles, resulting in a relatively larger failure sur-face. Furthermore, the PCI procedure specifies a load spacing of b
t + h
l or greater to prevent the overlapping of failure cones
from adjacent loads (where bt is the width of the double-tee
stem or the width of the bearing pad, whichever is less, and hl
is the height of beam ledge). Nevertheless, test results indicate that failure cones overlap when adjacent loads are spaced at a distance much larger than this specified value.2
This paper proposes a design procedure that takes into consideration the effects of the previously mentioned param-eters along with the parameters traditionally considered for ledge resistance. Recommendations are presented for certain reinforcement details found to improve the behavior and to enhance the capacity of the ledge without changing ledge geometry. This proposed procedure has been incorporated in the eighth edition of the PCI Design Handbook.12
Observed failure surface
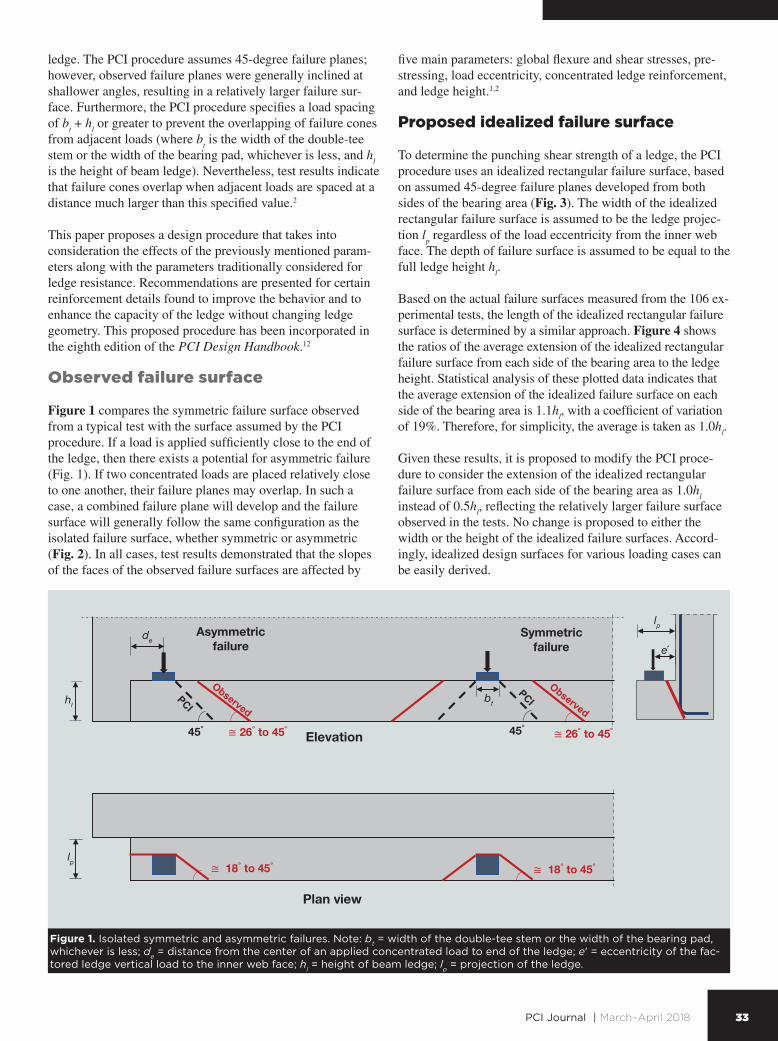
Figure 1 compares the symmetric failure surface observed from a typical test with the surface assumed by the PCI procedure. If a load is applied sufficiently close to the end of the ledge, then there exists a potential for asymmetric failure (Fig. 1). If two concentrated loads are placed relatively close to one another, their failure planes may overlap. In such a case, a combined failure plane will develop and the failure surface will generally follow the same configuration as the isolated failure surface, whether symmetric or asymmetric (Fig. 2). In all cases, test results demonstrated that the slopes of the faces of the observed failure surfaces are affected by
five main parameters: global flexure and shear stresses, pre-stressing, load eccentricity, concentrated ledge reinforcement, and ledge height.1,2
Proposed idealized failure surface
To determine the punching shear strength of a ledge, the PCI procedure uses an idealized rectangular failure surface, based on assumed 45-degree failure planes developed from both sides of the bearing area (Fig. 3). The width of the idealized rectangular failure surface is assumed to be the ledge projec-tion l
p regardless of the load eccentricity from the inner web
face. The depth of failure surface is assumed to be equal to the full ledge height h
l.
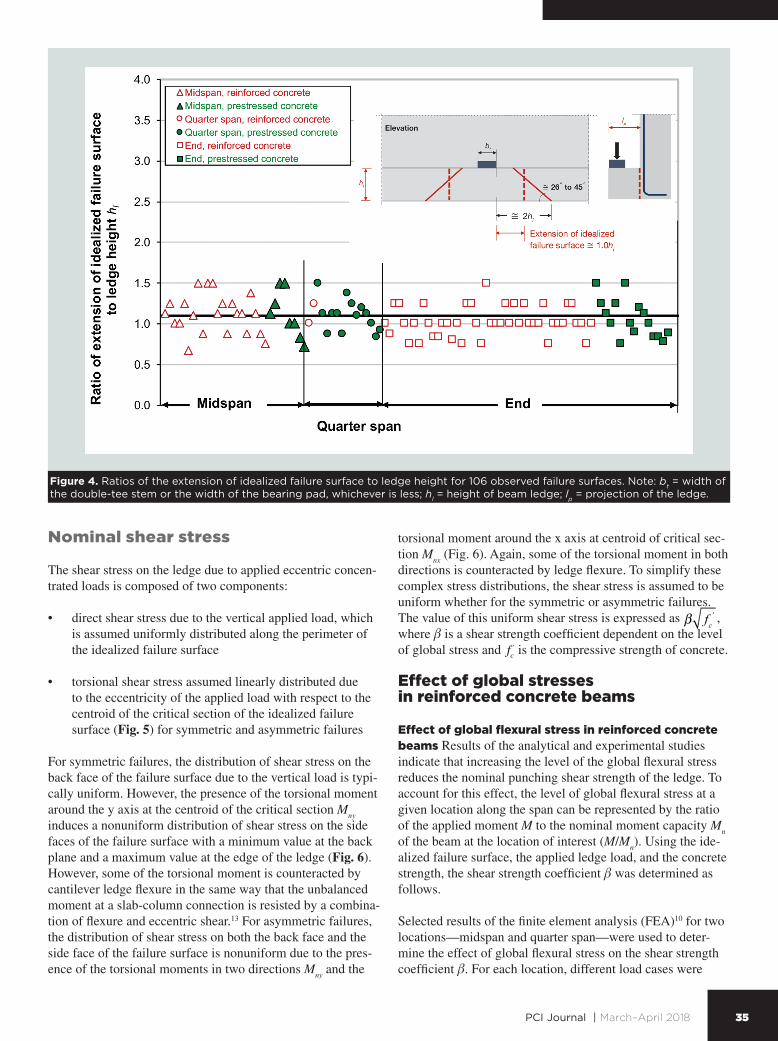
Based on the actual failure surfaces measured from the 106 ex-perimental tests, the length of the idealized rectangular failure surface is determined by a similar approach. Figure 4 shows the ratios of the average extension of the idealized rectangular failure surface from each side of the bearing area to the ledge height. Statistical analysis of these plotted data indicates that the average extension of the idealized failure surface on each side of the bearing area is 1.1h
l, with a coefficient of variation
of 19%. Therefore, for simplicity, the average is taken as 1.0hl.
Given these results, it is proposed to modify the PCI proce-dure to consider the extension of the idealized rectangular failure surface from each side of the bearing area as 1.0h
l
instead of 0.5hl, reflecting the relatively larger failure surface
observed in the tests. No change is proposed to either the width or the height of the idealized failure surfaces. Accord-ingly, idealized design surfaces for various loading cases can be easily derived.
Elevation≅ 26° to 45°
≅ 18° to 45°
Plan view
≅ 26° to 45°
≅ 18° to 45°
45° 45°
Asymmetric failure
Symmetric failure
hl
de s s
lp
bt
lp
e´
Elevation
45°
Plan view
Extension of idealized failure surface = 0.5hl
hl
lp
lp
hl
bt + hl
bt
34 PCI Journal | March–April 2018
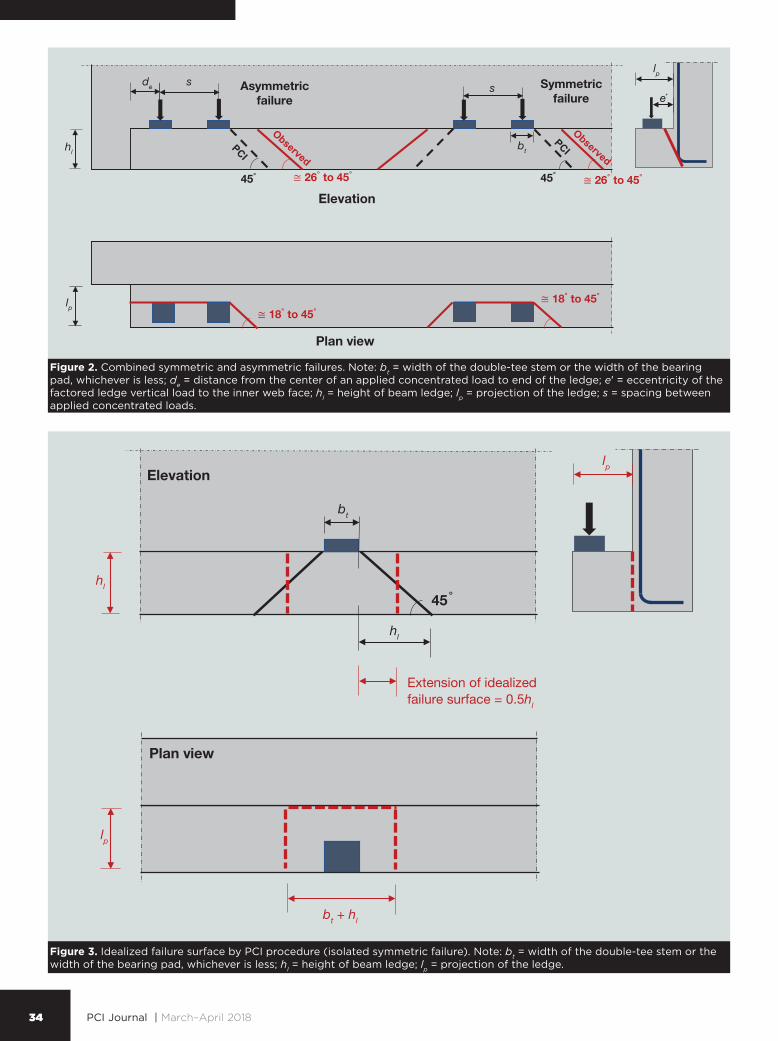
Figure 2. Combined symmetric and asymmetric failures. Note: bt = width of the double-tee stem or the width of the bearing pad, whichever is less; de = distance from the center of an applied concentrated load to end of the ledge; e' = eccentricity of the factored ledge vertical load to the inner web face; hl = height of beam ledge; lp = projection of the ledge; s = spacing between applied concentrated loads.
Figure 3. Idealized failure surface by PCI procedure (isolated symmetric failure). Note: bt = width of the double-tee stem or the width of the bearing pad, whichever is less; hl = height of beam ledge; lp = projection of the ledge.
35PCI Journal | March–April 2018
Nominal shear stress
The shear stress on the ledge due to applied eccentric concen-trated loads is composed of two components:
• direct shear stress due to the vertical applied load, which is assumed uniformly distributed along the perimeter of the idealized failure surface
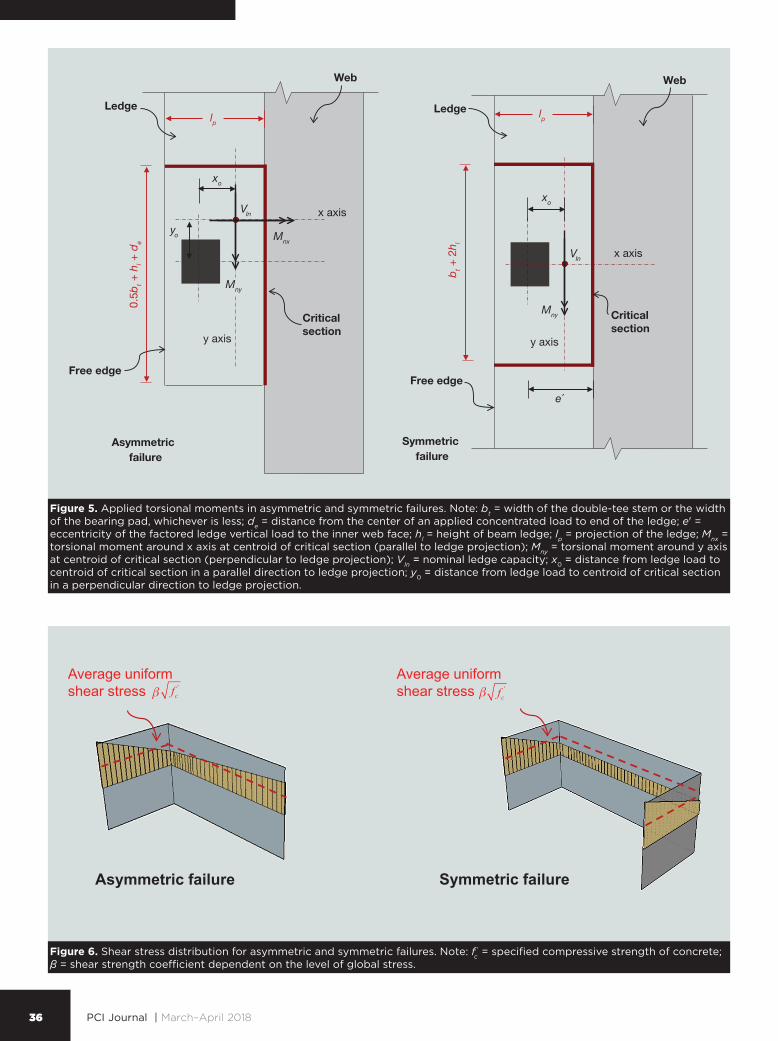
• torsional shear stress assumed linearly distributed due to the eccentricity of the applied load with respect to the centroid of the critical section of the idealized failure surface (Fig. 5) for symmetric and asymmetric failures
For symmetric failures, the distribution of shear stress on the back face of the failure surface due to the vertical load is typi-cally uniform. However, the presence of the torsional moment around the y axis at the centroid of the critical section M
ny
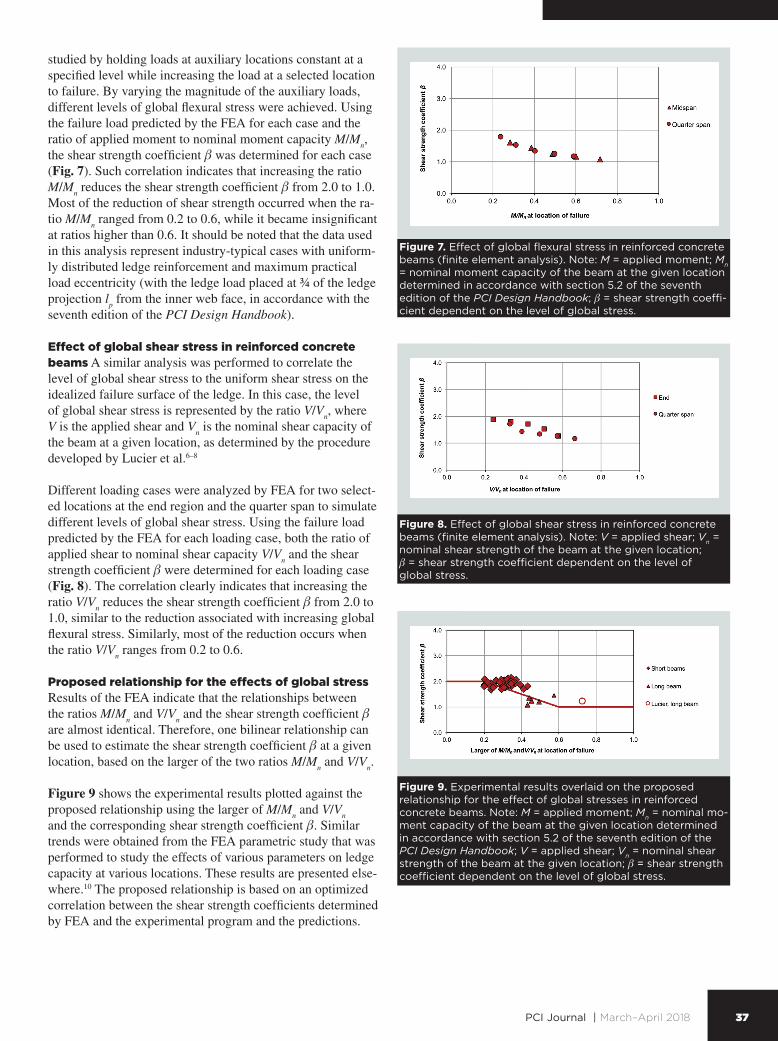
induces a nonuniform distribution of shear stress on the side faces of the failure surface with a minimum value at the back plane and a maximum value at the edge of the ledge (Fig. 6). However, some of the torsional moment is counteracted by cantilever ledge flexure in the same way that the unbalanced moment at a slab-column connection is resisted by a combina-tion of flexure and eccentric shear.13 For asymmetric failures, the distribution of shear stress on both the back face and the side face of the failure surface is nonuniform due to the pres-ence of the torsional moments in two directions M
ny and the
torsional moment around the x axis at centroid of critical sec-tion M
nx (Fig. 6). Again, some of the torsional moment in both
directions is counteracted by ledge flexure. To simplify these complex stress distributions, the shear stress is assumed to be uniform whether for the symmetric or asymmetric failures. The value of this uniform shear stress is expressed as β fc
' , where β is a shear strength coefficient dependent on the level of global stress and fc
' is the compressive strength of concrete.
Effect of global stresses in reinforced concrete beams
Effect of global flexural stress in reinforced concrete beams Results of the analytical and experimental studies indicate that increasing the level of the global flexural stress reduces the nominal punching shear strength of the ledge. To account for this effect, the level of global flexural stress at a given location along the span can be represented by the ratio of the applied moment M to the nominal moment capacity M
n
of the beam at the location of interest (M/Mn). Using the ide-
alized failure surface, the applied ledge load, and the concrete strength, the shear strength coefficient β was determined as follows.
Selected results of the finite element analysis (FEA)10 for two locations—midspan and quarter span—were used to deter-mine the effect of global flexural stress on the shear strength coefficient β. For each location, different load cases were
Figure 4. Ratios of the extension of idealized failure surface to ledge height for 106 observed failure surfaces. Note: bt = width of the double-tee stem or the width of the bearing pad, whichever is less; hl = height of beam ledge; lp = projection of the ledge.
Web
Critical section
Free edge
Ledge
Symmetric failure
x axis
y axis
Web
Critical section
Free edge
Ledge
Vln
Vln
Mnx
Mny
Mny
e´
yo
xo
xo
Asymmetric failure
y axis
x axis
lplp
0.5b
t + h
l + d
e
bt +
2h l
Average uniform shear stress
Symmetric failure
Average uniform shear stress
Asymmetric failure
'cf '
cfβ β
36 PCI Journal | March–April 2018
Figure 6. Shear stress distribution for asymmetric and symmetric failures. Note: fc' = specified compressive strength of concrete;
β = shear strength coefficient dependent on the level of global stress.
Figure 5. Applied torsional moments in asymmetric and symmetric failures. Note: bt = width of the double-tee stem or the width of the bearing pad, whichever is less; de = distance from the center of an applied concentrated load to end of the ledge; e' = eccentricity of the factored ledge vertical load to the inner web face; hl = height of beam ledge; lp = projection of the ledge; Mnx = torsional moment around x axis at centroid of critical section (parallel to ledge projection); Mny = torsional moment around y axis at centroid of critical section (perpendicular to ledge projection); Vln = nominal ledge capacity; x0 = distance from ledge load to centroid of critical section in a parallel direction to ledge projection; y0 = distance from ledge load to centroid of critical section in a perpendicular direction to ledge projection.
37PCI Journal | March–April 2018
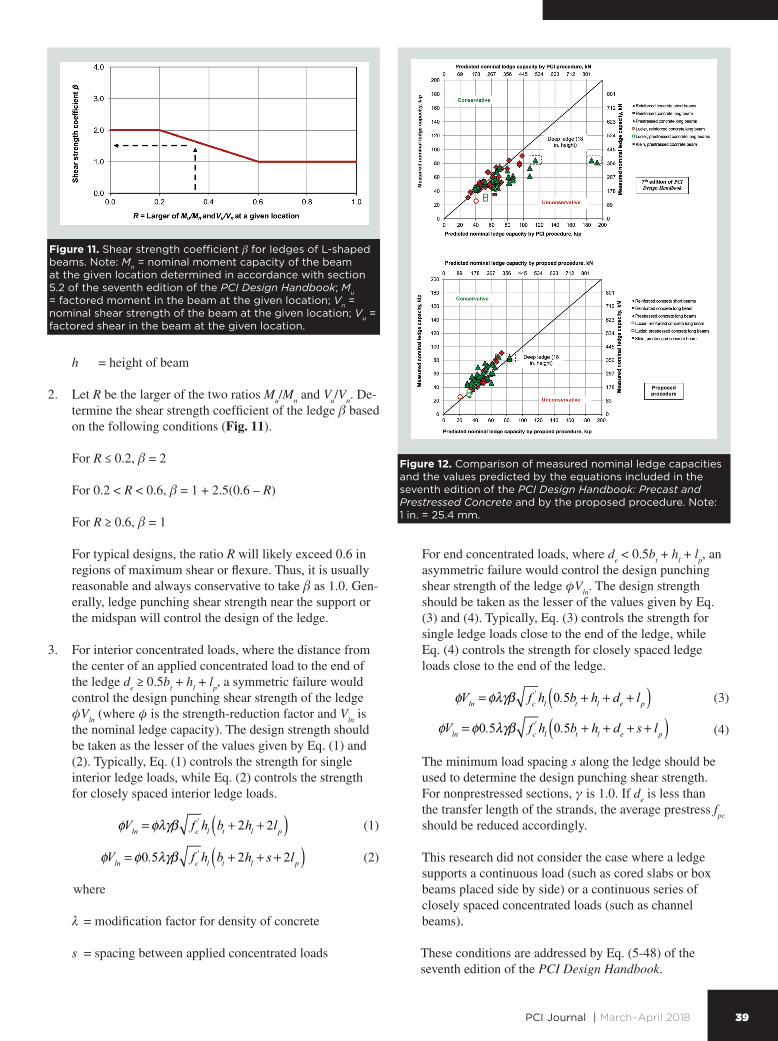
studied by holding loads at auxiliary locations constant at a specified level while increasing the load at a selected location to failure. By varying the magnitude of the auxiliary loads, different levels of global flexural stress were achieved. Using the failure load predicted by the FEA for each case and the ratio of applied moment to nominal moment capacity M/M
n,
the shear strength coefficient β was determined for each case (Fig. 7). Such correlation indicates that increasing the ratio M/M
n reduces the shear strength coefficient β from 2.0 to 1.0.
Most of the reduction of shear strength occurred when the ra-tio M/M
n ranged from 0.2 to 0.6, while it became insignificant
at ratios higher than 0.6. It should be noted that the data used in this analysis represent industry-typical cases with uniform-ly distributed ledge reinforcement and maximum practical load eccentricity (with the ledge load placed at ¾ of the ledge projection l
p from the inner web face, in accordance with the
seventh edition of the PCI Design Handbook).
Effect of global shear stress in reinforced concrete beams A similar analysis was performed to correlate the level of global shear stress to the uniform shear stress on the idealized failure surface of the ledge. In this case, the level of global shear stress is represented by the ratio V/V
n, where
V is the applied shear and Vn is the nominal shear capacity of
the beam at a given location, as determined by the procedure developed by Lucier et al.6–8
Different loading cases were analyzed by FEA for two select-ed locations at the end region and the quarter span to simulate different levels of global shear stress. Using the failure load predicted by the FEA for each loading case, both the ratio of applied shear to nominal shear capacity V/V
n and the shear
strength coefficient β were determined for each loading case (Fig. 8). The correlation clearly indicates that increasing the ratio V/V
n reduces the shear strength coefficient β from 2.0 to
1.0, similar to the reduction associated with increasing global flexural stress. Similarly, most of the reduction occurs when the ratio V/V
n ranges from 0.2 to 0.6.
Proposed relationship for the effects of global stress Results of the FEA indicate that the relationships between the ratios M/M
n and V/V
n and the shear strength coefficient β
are almost identical. Therefore, one bilinear relationship can be used to estimate the shear strength coefficient β at a given location, based on the larger of the two ratios M/M
n and V/V
n.
Figure 9 shows the experimental results plotted against the proposed relationship using the larger of M/M
n and V/V
n
and the corresponding shear strength coefficient β. Similar trends were obtained from the FEA parametric study that was performed to study the effects of various parameters on ledge capacity at various locations. These results are presented else-where.10 The proposed relationship is based on an optimized correlation between the shear strength coefficients determined by FEA and the experimental program and the predictions.
Figure 7. Effect of global flexural stress in reinforced concrete beams (finite element analysis). Note: M = applied moment; Mn = nominal moment capacity of the beam at the given location determined in accordance with section 5.2 of the seventh edition of the PCI Design Handbook; β = shear strength coeffi-cient dependent on the level of global stress.
Figure 8. Effect of global shear stress in reinforced concrete beams (finite element analysis). Note: V = applied shear; Vn = nominal shear strength of the beam at the given location; β = shear strength coefficient dependent on the level of global stress.
Figure 9. Experimental results overlaid on the proposed relationship for the effect of global stresses in reinforced concrete beams. Note: M = applied moment; Mn = nominal mo-ment capacity of the beam at the given location determined in accordance with section 5.2 of the seventh edition of the PCI Design Handbook; V = applied shear; Vn = nominal shear strength of the beam at the given location; β = shear strength coefficient dependent on the level of global stress.
38 PCI Journal | March–April 2018
Effect of prestressing
Research findings clearly indicate that the use of prestressing generally enhances the punching shear strength of a ledge.2 The influence of prestressing is dependent on the level of prestressing in the beam.
Using the same approach for reinforced concrete beams, the results of FEA10 for the ledge capacities of prestressed concrete beams were analyzed to determine the relationship between the larger of the ratios M/M
n and V/V
n and the corre-
sponding shear strength coefficient β (Fig. 10). The data used to establish the relationship were based on beams with the same prestressing level and the same concrete strength. The figure clearly indicates that prestressing increases the shear strength coefficient for different levels of global stress at all locations along the beam.
To account for the effect of prestressing, it is proposed to modify the shear strength coefficient β by a factor accounting for the level of prestressing γ. The coefficient γ was derived based on the increase of the principal tensile strength of concrete in the prestressed section, subjected to the com-bined effects of shear and torsion.14–16 For reinforced concrete beams, γ equals 1.0, and for prestressed concrete beams, the following equation can be used:
γ = 1+10f pcfc'
where
fpc
= average prestress after losses
fc' = specified compressive strength of concrete
For the data presented at the top of Fig. 10, γ was 1.47, based on the average prestress after losses f
pc of 690 psi (4.8 MPa)
and a concrete compressive strength fc' of 6000 psi (41 MPa).
The comparison between the modified shear strength coeffi-cients γβ and those predicted by FEA indicates the validity of the proposed approach to predict the punching shear strength of a ledge. The same conclusion is drawn when this proposed approach is compared with the available experimental results for beams having an average γ equal to 1.32, corresponding to an average f
pc of 690 psi (4.8 MPa) and measured fc
' ranging from 8670 to 10,190 psi (59.8 to 70.26 MPa) (Fig. 10). The proposed approach for considering the effect of prestress-ing can be used to conservatively predict the modified shear strength coefficient γβ.
Proposed procedure to evaluate the punching shear strength of ledges
Based on the analyses listed previously, a step-by-step proce-dure for evaluating ledge punching shear capacity is proposed:
1. For a given location of concentrated ledge load along the
span of an L-shaped beam, the ratios Mu/M
n and V
u/V
n are
determined, where Mu is the factored moment in the beam
at the given location and Vu is the factored shear in the
beam at the same location.
Vn = V
c + V
s
where
Vc = nominal shear strength provided by concrete,
determined in accordance with section 5.3 of the seventh edition of the PCI Design Handbook
Vs = nominal shear strength provided by shear reinforce-
ment, determined in accordance with the slender spandrel procedure developed by Lucier et al.6
= 2Asos
⎛⎝⎜
⎞⎠⎟f yd
Aso
/s = vertical shear reinforcement on the outer web face (that is, non-ledge web face)
fy = specified yield strength of shear reinforcement
d = distance from the extreme compression fiber to the centroid of longitudinal tension reinforcement (per ACI 318-1413), but not less than 0.8h for pre-stressed components
Figure 10. Finite element and experimental results overlaid on the proposed idealization for the effect of prestressing. Note: FEA = finite element analysis; M = applied moment capacity; Mn = nominal moment capacity of the beam at the given loca-tion determined in accordance with section 5.2 of the seventh edition of the PCI Design Handbook; V = applied shear; Vn = nominal shear strength of the beam at the given location; β = shear strength coefficient dependent on the level of global stress; γ = factor accounting for the level of prestressing.
39PCI Journal | March–April 2018
h = height of beam
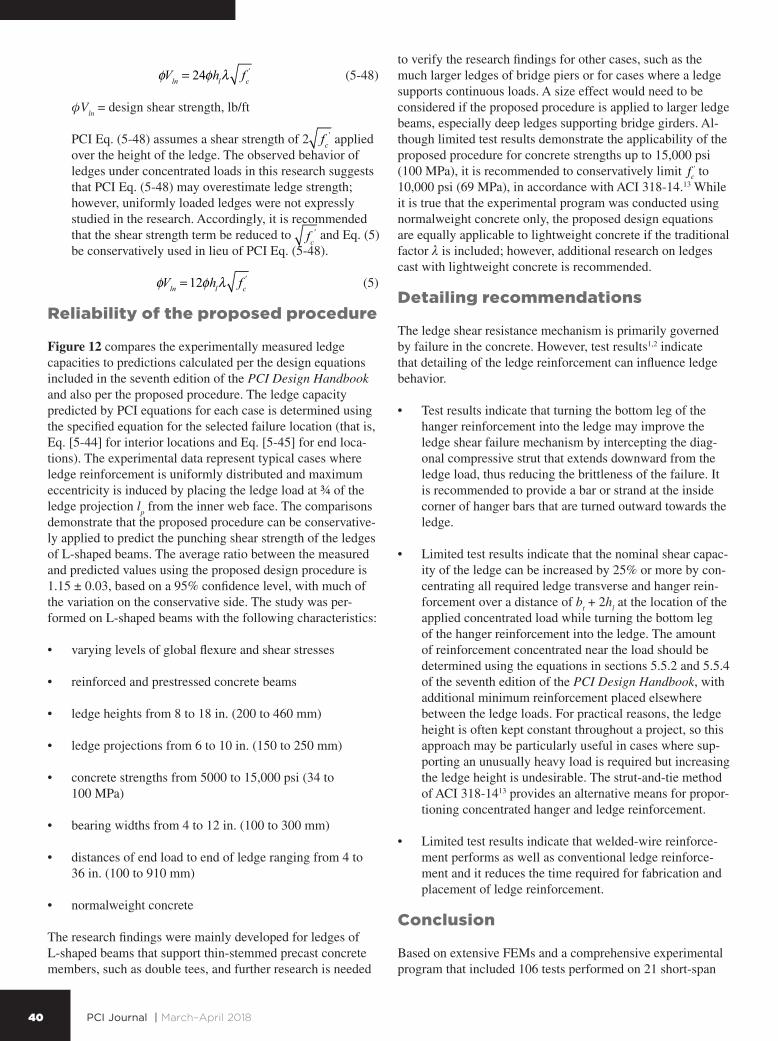
2. Let R be the larger of the two ratios Mu/M
n and V
u/V
n. De-
termine the shear strength coefficient of the ledge β based on the following conditions (Fig. 11).
For R ≤ 0.2, β = 2
For 0.2 < R < 0.6, β = 1 + 2.5(0.6 – R)
For R ≥ 0.6, β = 1
For typical designs, the ratio R will likely exceed 0.6 in regions of maximum shear or flexure. Thus, it is usually reasonable and always conservative to take β as 1.0. Gen-erally, ledge punching shear strength near the support or the midspan will control the design of the ledge.
3. For interior concentrated loads, where the distance from the center of an applied concentrated load to the end of the ledge d
e ≥ 0.5b
t + h
l + l
p, a symmetric failure would
control the design punching shear strength of the ledge φV
ln (where φ is the strength-reduction factor and V
ln is
the nominal ledge capacity). The design strength should be taken as the lesser of the values given by Eq. (1) and (2). Typically, Eq. (1) controls the strength for single interior ledge loads, while Eq. (2) controls the strength for closely spaced interior ledge loads.
φVln = φλγβ fc' hl bt + 2hl + 2lp( ) (1)
φVln = φ0.5λγβ fc' hl bt + 2hl + s+ 2lp( ) (2)
where
λ = modification factor for density of concrete
s = spacing between applied concentrated loads
For end concentrated loads, where de < 0.5b
t + h
l + l
p, an
asymmetric failure would control the design punching shear strength of the ledge φV
ln. The design strength
should be taken as the lesser of the values given by Eq. (3) and (4). Typically, Eq. (3) controls the strength for single ledge loads close to the end of the ledge, while Eq. (4) controls the strength for closely spaced ledge loads close to the end of the ledge.
The minimum load spacing s along the ledge should be used to determine the design punching shear strength. For nonprestressed sections, γ is 1.0. If d
e is less than
the transfer length of the strands, the average prestress fpc
should be reduced accordingly.
This research did not consider the case where a ledge supports a continuous load (such as cored slabs or box beams placed side by side) or a continuous series of closely spaced concentrated loads (such as channel beams).
These conditions are addressed by Eq. (5-48) of the seventh edition of the PCI Design Handbook.
Figure 11. Shear strength coefficient β for ledges of L-shaped beams. Note: Mn = nominal moment capacity of the beam at the given location determined in accordance with section 5.2 of the seventh edition of the PCI Design Handbook; Mu = factored moment in the beam at the given location; Vn = nominal shear strength of the beam at the given location; Vu = factored shear in the beam at the given location.
Figure 12. Comparison of measured nominal ledge capacities and the values predicted by the equations included in the seventh edition of the PCI Design Handbook: Precast and Prestressed Concrete and by the proposed procedure. Note: 1 in. = 25.4 mm.
40 PCI Journal | March–April 2018
φVln = 24φhlλ fc' (5-48)
φVln = design shear strength, lb/ft
PCI Eq. (5-48) assumes a shear strength of 2 fc' applied
over the height of the ledge. The observed behavior of ledges under concentrated loads in this research suggests that PCI Eq. (5-48) may overestimate ledge strength; however, uniformly loaded ledges were not expressly studied in the research. Accordingly, it is recommended that the shear strength term be reduced to fc
' and Eq. (5) be conservatively used in lieu of PCI Eq. (5-48).
φVln = 12φhlλ fc' (5)
Reliability of the proposed procedure
Figure 12 compares the experimentally measured ledge capacities to predictions calculated per the design equations included in the seventh edition of the PCI Design Handbook and also per the proposed procedure. The ledge capacity predicted by PCI equations for each case is determined using the specified equation for the selected failure location (that is, Eq. [5-44] for interior locations and Eq. [5-45] for end loca-tions). The experimental data represent typical cases where ledge reinforcement is uniformly distributed and maximum eccentricity is induced by placing the ledge load at ¾ of the ledge projection l
p from the inner web face. The comparisons
demonstrate that the proposed procedure can be conservative-ly applied to predict the punching shear strength of the ledges of L-shaped beams. The average ratio between the measured and predicted values using the proposed design procedure is 1.15 ± 0.03, based on a 95% confidence level, with much of the variation on the conservative side. The study was per-formed on L-shaped beams with the following characteristics:
• varying levels of global flexure and shear stresses
• reinforced and prestressed concrete beams
• ledge heights from 8 to 18 in. (200 to 460 mm)
• ledge projections from 6 to 10 in. (150 to 250 mm)
• concrete strengths from 5000 to 15,000 psi (34 to 100 MPa)
• bearing widths from 4 to 12 in. (100 to 300 mm)
• distances of end load to end of ledge ranging from 4 to 36 in. (100 to 910 mm)
• normalweight concrete
The research findings were mainly developed for ledges of L-shaped beams that support thin-stemmed precast concrete members, such as double tees, and further research is needed
to verify the research findings for other cases, such as the much larger ledges of bridge piers or for cases where a ledge supports continuous loads. A size effect would need to be considered if the proposed procedure is applied to larger ledge beams, especially deep ledges supporting bridge girders. Al-though limited test results demonstrate the applicability of the proposed procedure for concrete strengths up to 15,000 psi (100 MPa), it is recommended to conservatively limit fc
' to 10,000 psi (69 MPa), in accordance with ACI 318-14.13 While it is true that the experimental program was conducted using normalweight concrete only, the proposed design equations are equally applicable to lightweight concrete if the traditional factor λ is included; however, additional research on ledges cast with lightweight concrete is recommended.
Detailing recommendations
The ledge shear resistance mechanism is primarily governed by failure in the concrete. However, test results1,2 indicate that detailing of the ledge reinforcement can influence ledge behavior.
• Test results indicate that turning the bottom leg of the hanger reinforcement into the ledge may improve the ledge shear failure mechanism by intercepting the diag-onal compressive strut that extends downward from the ledge load, thus reducing the brittleness of the failure. It is recommended to provide a bar or strand at the inside corner of hanger bars that are turned outward towards the ledge.
• Limited test results indicate that the nominal shear capac-ity of the ledge can be increased by 25% or more by con-centrating all required ledge transverse and hanger rein-forcement over a distance of b
t + 2h
l at the location of the
applied concentrated load while turning the bottom leg of the hanger reinforcement into the ledge. The amount of reinforcement concentrated near the load should be determined using the equations in sections 5.5.2 and 5.5.4 of the seventh edition of the PCI Design Handbook, with additional minimum reinforcement placed elsewhere between the ledge loads. For practical reasons, the ledge height is often kept constant throughout a project, so this approach may be particularly useful in cases where sup-porting an unusually heavy load is required but increasing the ledge height is undesirable. The strut-and-tie method of ACI 318-1413 provides an alternative means for propor-tioning concentrated hanger and ledge reinforcement.
• Limited test results indicate that welded-wire reinforce-ment performs as well as conventional ledge reinforce-ment and it reduces the time required for fabrication and placement of ledge reinforcement.
Conclusion
Based on extensive FEMs and a comprehensive experimental program that included 106 tests performed on 21 short-span
41PCI Journal | March–April 2018
and 9 long-span L-shaped beams,1,2 the following conclusions are drawn for evaluating the punching shear strength of ledges of L-shaped beams.
• The procedure provided by the seventh edition of the PCI Design Handbook can significantly overestimate the punching shear strength of the ledge, especially for interior locations.
• The level of global stress is the most influential parameter affecting ledge capacity. High levels of global flexural or shear stress in the region of a concentrated ledge load sig-nificantly reduce the punching shear strength of the ledge.
• The use of prestressing enhances the punching shear strength of the ledge. The enhanced capacity is dependent on the level of prestressing in the beam.
• Increasing the eccentricity of the applied load from the inner web face reduces the punching shear strength of the ledge. Therefore, it is conservative to determine the punching shear strength of the ledge by assuming that the ledge load is applied at ¾ of the ledge projection l
p from
the inner web face, in accordance with PCI guidelines.
• For typical ledges, the crack angles of the observed fail-ure surfaces were generally shallower than the 45-degree
angles assumed by the PCI procedure.
• A simple and practical procedure is introduced for calculating the punching shear strength of the ledge by assuming a uniform nominal shear stress acting on an idealized failure surface.
• Special reinforcement details are recommended to im-prove and enhance the behavior and capacity of the ledge without changing its geometry.
Acknowledgments
This research was sponsored by the PCI Research and Development Council. The authors are grateful to the Ledge Advisory Committee for the support and guidance provided throughout all phases of this research. The authors would also like to thank Metromont Corp., Tindall Corp., and Gate Pre-cast Co. for their generosity in providing test specimens, and for their expertise in support of the experimental program.
References
1. Nafadi, M. K., O. M. Khalafalla, G. W. Lucier, S. H. Rizkalla, P. Z. Zia, and G. J. Klein. “Ledge Behavior and Strength of Short-Span L-Shaped Beams.” PCI Journal 63 (2): 67–86.
2. Nafadi, M. K., G. W. Lucier, S. H. Rizkalla, P. Z. Zia, and G. J. Klein. “Ledge Behavior and Strength of Long-Span L-Shaped Beams.” PCI Journal 63 (2): 50–66.
3. Klein, G. J. 1986. “Design of Spandrel Beams.” PCI Journal 31 (5): 76–124.
4. Klein, G. J. 1986. “Design of Spandrel Beams.” PCI spe-cially funded research and development program research project no. 5. Chicago, IL: PCI.
5. Hassan, T. K. 2007. “Finite Element Study of Shear Behavior of Spandrel Ledges and Comparison with PCI Shear Design Provisions.” Advances in Structural Engi-neering 10 (5): 475–485.
6. Lucier, G., C. Walter, S. Rizkalla, P. Zia, and G. Klein. 2011. “Development of a Rational Design Methodology for Precast Concrete Slender Spandrel Beams: Part 1, Experimental Results.” PCI Journal 56 (2): 88–112.
7. Lucier, G., C. Walter, S. Rizkalla, P. Zia, and G. Klein. 2011. “Development of a Rational Design Methodology for Precast Concrete Slender Spandrel Beams: Part 2, Analysis and Design Guidelines.” PCI Journal 56 (4): 106–133.
8. Lucier, G., C. Walter, S. Rizkalla, P. Zia, and G. Klein. 2010. “Development of a Rational Design Methodology for Precast Concrete Slender Spandrel Beams.” Tech-nical report IS-09-10. North Carolina State University, Raleigh, NC.
9. Logan, D. R. 2012. “Development of a Rational Design Methodology for Precast Slender Spandrel Beam.” Dis-cussion. PCI Journal 57 (2): 182–187.
10. Rizkalla, S., M. Nafadi, G. Lucier, P. Zia, and G. Klein. 2016. “Behavior and Design of Directly-Loaded L-Shaped Beam Ledges.” Technical report RD-16-03. North Carolina State University, Raleigh, NC.
11. PCI Industry Handbook Committee. 2010. PCI Design Handbook: Precast and Prestressed Concrete. 7th ed. Chicago, IL: PCI.
12. PCI Industry Handbook Committee. 2017. PCI Design Handbook: Precast and Prestressed Concrete. 8th ed. Chicago, IL: PCI.
13. ACI (American Concrete Institute). 2014. Building Code Requirements for Structural Concrete (ACI 318-14) and Commentary (ACI 318R-14). Farmington Hills, MI: ACI.
14. Hsu, T. T. 1968. “Torsion of Structural Concrete—Uni-formly Prestressed Rectangular Members without Web Reinforcement.” PCI Journal 13 (2): 34–44.
15. Zia, P., and T. T. C. Hsu. 2004. “Design for Torsion and Shear in Prestressed Concrete Flexural Members.” PCI Journal 49 (3): 34–42.
42 PCI Journal | March–April 2018
16. Zia, P., and W. D. McGee. 1974. “Torsion Design of Pre-stressed Concrete.” PCI Journal 19 (2): 46–65.
Notation
Aso
/s = vertical shear reinforcement on the outer web face (that is, non-ledge web face)
bt = width of the double-tee stem or the width of the bear-
ing pad, whichever is less
d = distance from the extreme compression fiber to the centroid of longitudinal tension reinforcement (per ACI 318-1413), but not less than 0.8h for prestressed components (d
p is used for prestressed components
when a distinction from d for nonprestressed rein-forcement is relevant)
de = distance from the center of an applied concentrated
load to the end of the ledge
e' = eccentricity of the factored ledge vertical load to the inner web face
fc' = specified compressive strength of concrete
fpc
= average prestress after losses at a given location
fy = specified yield strength of shear reinforcement
h = height of beam
hl = height of beam ledge
lp = projection of the ledge ([b
l − b] in section 5.5 of the
seventh edition of the PCI Design Handbook)
M = applied moment
Mn = nominal moment capacity of the beam at a given
location determined in accordance with section 5.2 of the seventh edition of the PCI Design Handbook
Mnx
= torsional moment around x axis at centroid of critical section (parallel to ledge projection)
Mny
= torsional moment around y axis at centroid of critical section (perpendicular to ledge projection)
Mu = factored moment in the beam at a given location
R = larger of the two ratios Mu/M
n and V
u/V
n
s = spacing between applied concentrated loads
V = applied shear
Vc = nominal shear strength provided by concrete, deter-
mined in accordance with section 5.3 of the seventh edition of the PCI Design Handbook
Vln = nominal ledge capacity (V
n in section 5.5 of the sev-
enth edition of the PCI Design Handbook)
Vn = nominal shear strength of the beam at a
given location
Vs = nominal shear strength provided by shear reinforce-
ment, determined in accordance with the slender spandrel procedure developed by Lucier et al.6
Vu = factored shear in the beam at a given location
x0 = distance from ledge load to centroid of critical section
in a parallel direction to ledge projection
y0 = distance from ledge load to centroid of critical section
in a perpendicular direction to ledge projection
β = shear strength coefficient dependent on the level of global stress
γ = factor accounting for the level of prestressing
λ = modification factor for density of concrete (section 5.3.3 in the seventh edition of the PCI Design Hand-book)
φ = strength-reduction factor
43PCI Journal | March–April 2018
About the authors
Mohamed K. Nafadi, PhD, is an assistant professor of structural engineering at Assiut University in Assiut, Egypt. He is a former graduate research assistant in the Department of Civil, Construction, and Environmental Engineering at North Carolina State University (NCSU) in Raleigh.
Gregory W. Lucier, PhD, is a research assistant professor in the Department of Civil, Construction, and Environmental Engineering and manager of the Constructed Facilities Laboratory at NCSU.
Sami Rizkalla, PhD, FPCI, FACI, FASCE, FIIFC, FEIC, FCSCE, is Distinguished Professor Emeritus in the Department of Civil, Construction, and Environmental Engineering at NCSU.
Paul Zia, PhD, PE, FPCI, is a Distinguished University Profes-sor Emeritus in the Department of Civil, Construction, and Environ-mental Engineering at NCSU.
Gary J. Klein, PE, is executive vice president and senior principal for Wiss, Janney, Elstner Associ-ates Inc. in Northbrook, Ill.
Abstract
The design procedure presented in the seventh edition of the PCI Design Handbook: Precast and Prestressed Concrete for ledges of L-shaped beams has been called into question by many engineers and researchers. Research findings from previous experimental studies
have indicated that the PCI ledge design equations can overestimate ledge punching shear strength. This paper presents the development of the design procedure for the eighth edition of the PCI Design Handbook to evaluate the punching shear strength of ledges of L-shaped beams. Based on the failure surfaces ob-served throughout a comprehensive experimental pro-gram, an idealized failure surface was determined. The results of extensive finite element analyses and a large experimental program were used to evaluate the effects of global stress on ledge capacity, and a procedure to evaluate the punching shear strength of the ledge was developed. The proposed procedure is presented in this paper and is intended to provide an improved margin of safety for ledge capacity under a wide range of loading conditions. Consideration was given to ensure simplicity and practicality of the proposed design procedure.
Keywords
Global stress, ledge, ledge capacity, L-shaped beam, punching shear, spandrel.
Review policy
This paper was reviewed in accordance with the Precast/Prestressed Concrete Institute’s peer-review process.
Reader comments
Please address any reader comments to PCI Journal editor-in-chief Emily Lorenz at [email protected] or Precast/Prestressed Concrete Institute, c/o PCI Journal, 200 W. Adams St., Suite 2100, Chicago, IL 60606.
APPENDIX
Design example
Problem
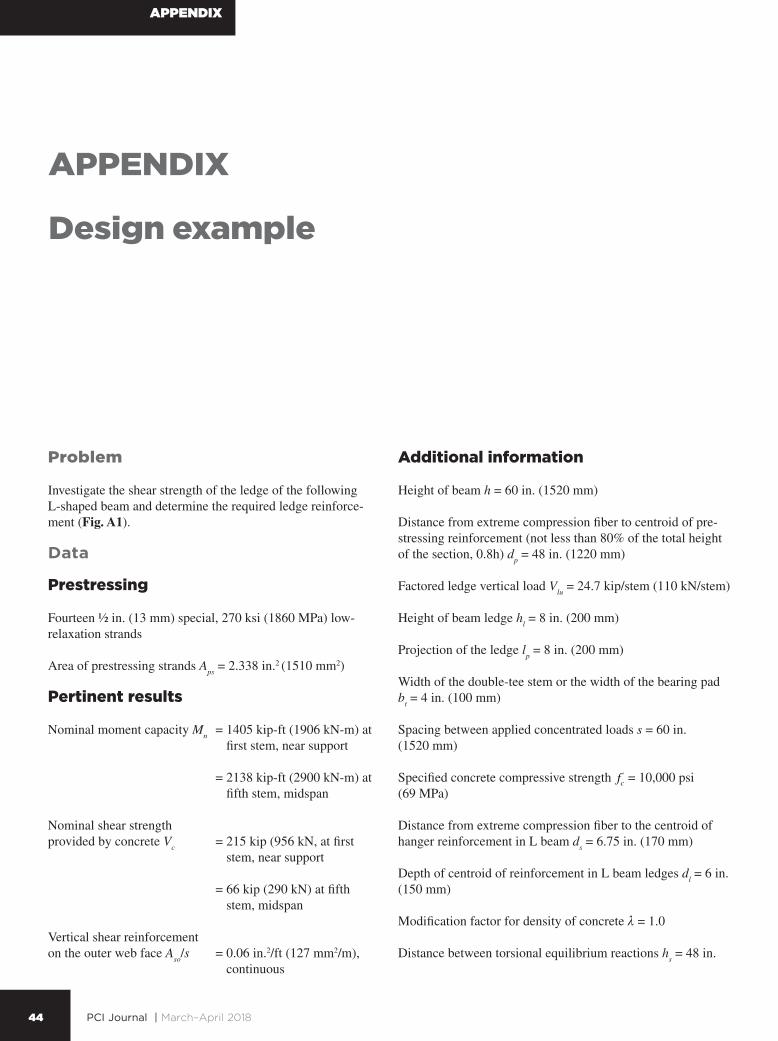
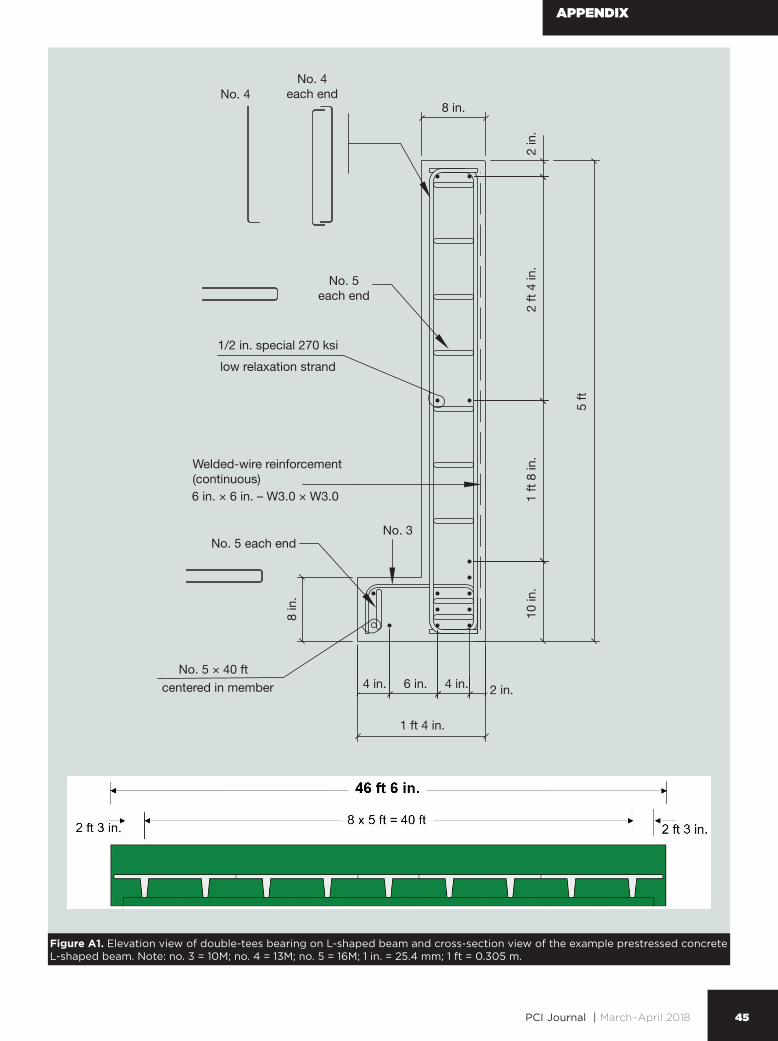
Investigate the shear strength of the ledge of the following L-shaped beam and determine the required ledge reinforce-ment (Fig. A1).
Data
Prestressing
Fourteen ½ in. (13 mm) special, 270 ksi (1860 MPa) low- relaxation strands
Area of prestressing strands Aps
= 2.338 in.2 (1510 mm2)
Pertinent results
Nominal moment capacity Mn = 1405 kip-ft (1906 kN-m) at
first stem, near support
= 2138 kip-ft (2900 kN-m) at fifth stem, midspan
Nominal shear strength provided by concrete V
c = 215 kip (956 kN, at first
stem, near support
= 66 kip (290 kN) at fifth stem, midspan
Vertical shear reinforcement on the outer web face A
so/s = 0.06 in.2/ft (127 mm2/m),
continuous
Additional information
Height of beam h = 60 in. (1520 mm)
Distance from extreme compression fiber to centroid of pre-stressing reinforcement (not less than 80% of the total height of the section, 0.8h) d
Distance from extreme compression fiber to the centroid of hanger reinforcement in L beam d
s = 6.75 in. (170 mm)
Depth of centroid of reinforcement in L beam ledges dl = 6 in.
(150 mm)
Modification factor for density of concrete λ = 1.0
Distance between torsional equilibrium reactions hs = 48 in.
44
APPENDIX
PCI Journal | March–April 2018
No. 4No. 4
each end
No. 5each end
No. 5 each endNo. 3
1/2 in. special 270 ksi
low relaxation strand
Welded-wire reinforcement (continuous)
8 in.
2 in
.2
ft 4
in.
1 ft
8 in
.10
in.
8 in
.
5 ft
4 in. 6 in. 4 in. 2 in.
1 ft 4 in.
No. 5 × 40 ft
6 in. × 6 in. – W3.0 × W3.0
centered in member
Figure A1. Elevation view of double-tees bearing on L-shaped beam and cross-section view of the example prestressed concrete L-shaped beam. Note: no. 3 = 10M; no. 4 = 13M; no. 5 = 16M; 1 in. = 25.4 mm; 1 ft = 0.305 m.
APPENDIX
45PCI Journal | March–April 2018
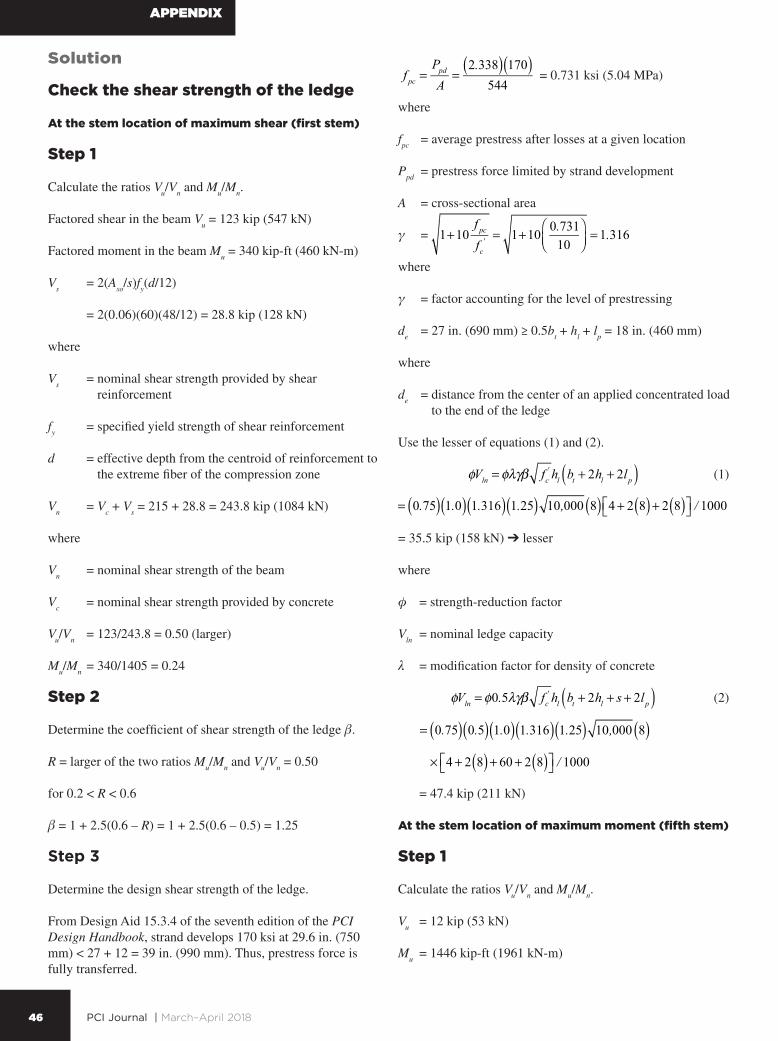
Solution
Check the shear strength of the ledge
At the stem location of maximum shear (first stem)
Step 1
Calculate the ratios Vu/V
n and M
u/M
n.
Factored shear in the beam Vu = 123 kip (547 kN)
Factored moment in the beam Mu = 340 kip-ft (460 kN-m)
Vs = 2(A
so/s)f
y(d/12)
= 2(0.06)(60)(48/12) = 28.8 kip (128 kN)
where
Vs = nominal shear strength provided by shear
reinforcement
fy = specified yield strength of shear reinforcement
d = effective depth from the centroid of reinforcement to the extreme fiber of the compression zone
Vn = V
c + V
s = 215 + 28.8 = 243.8 kip (1084 kN)
where
Vn = nominal shear strength of the beam
Vc = nominal shear strength provided by concrete
Vu/V
n = 123/243.8 = 0.50 (larger)
Mu/M
n = 340/1405 = 0.24
Step 2
Determine the coefficient of shear strength of the ledge β.
R = larger of the two ratios Mu/M
n and V
u/V
n = 0.50
for 0.2 < R < 0.6
β = 1 + 2.5(0.6 – R) = 1 + 2.5(0.6 – 0.5) = 1.25
Step 3
Determine the design shear strength of the ledge.
From Design Aid 15.3.4 of the seventh edition of the PCI Design Handbook, strand develops 170 ksi at 29.6 in. (750 mm) < 27 + 12 = 39 in. (990 mm). Thus, prestress force is fully transferred.
f pc =PpdA
=2.338( ) 170( )544
= 0.731 ksi (5.04 MPa)
where
fpc
= average prestress after losses at a given location
Ppd
= prestress force limited by strand development
A = cross-sectional area
γ = γ = 1+10f pcfc' = 1+10 0.731
10⎛⎝⎜
⎞⎠⎟= 1.316
where
γ = factor accounting for the level of prestressing
de = 27 in. (690 mm) ≥ 0.5b
t + h
l + l
p = 18 in. (460 mm)
where
de = distance from the center of an applied concentrated load
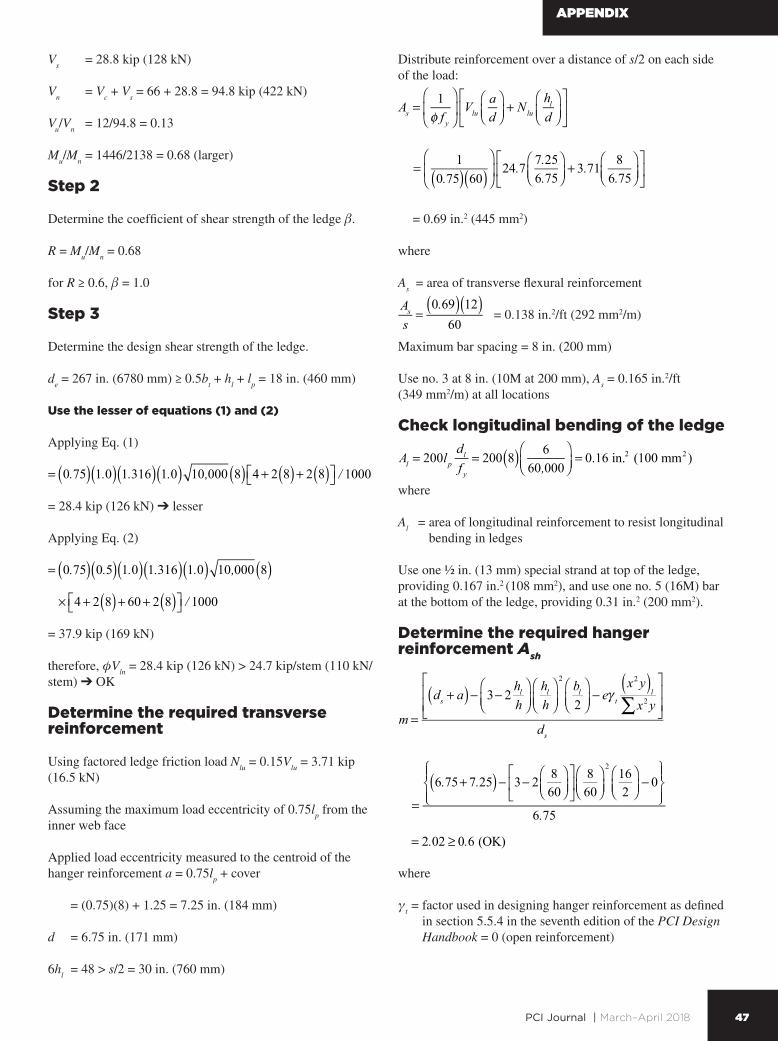
Assuming the maximum load eccentricity of 0.75lp from the
inner web face
Applied load eccentricity measured to the centroid of the hanger reinforcement a = 0.75l
p + cover
= (0.75)(8) + 1.25 = 7.25 in. (184 mm)
d = 6.75 in. (171 mm)
6hl = 48 > s/2 = 30 in. (760 mm)
Distribute reinforcement over a distance of s/2 on each side of the load:
As =1
φ f y
⎛
⎝⎜
⎞
⎠⎟ Vlu
ad
⎛⎝⎜
⎞⎠⎟+ Nlu
hld
⎛⎝⎜
⎞⎠⎟
⎡
⎣⎢
⎤
⎦⎥
= 10.75( ) 60( )
⎛
⎝⎜
⎞
⎠⎟ 24.7
7.256.75
⎛⎝⎜
⎞⎠⎟+ 3.71 8
6.75⎛⎝⎜
⎞⎠⎟
⎡
⎣⎢
⎤
⎦⎥
= 0.69 in.2 (445 mm2)
where
As = area of transverse flexural reinforcement
Ass=0.69( ) 12( )60
= 0.138 in.2/ft (292 mm2/m)
Maximum bar spacing = 8 in. (200 mm)
Use no. 3 at 8 in. (10M at 200 mm), As = 0.165 in.2/ft
(349 mm2/m) at all locations
Check longitudinal bending of the ledge
Al = 200lpdlf y
= 200 8( ) 660,000
⎛⎝⎜
⎞⎠⎟= 0.16 in.2 (100 mm2 )
where
Al = area of longitudinal reinforcement to resist longitudinal
bending in ledges
Use one ½ in. (13 mm) special strand at top of the ledge, providing 0.167 in.2 (108 mm2), and use one no. 5 (16M) bar at the bottom of the ledge, providing 0.31 in.2 (200 mm2).
Determine the required hanger reinforcement Ash
m =
ds + a( )− 3− 2hlh
⎛⎝⎜
⎞⎠⎟hlh
⎛⎝⎜
⎞⎠⎟
2bl2
⎛⎝⎜
⎞⎠⎟− eγ t
x2y( )l
x2y∑⎡
⎣⎢⎢
⎤
⎦⎥⎥
ds
=
6.75+ 7.25( )− 3− 2 860
⎛⎝⎜
⎞⎠⎟
⎡
⎣⎢
⎤
⎦⎥
860
⎛⎝⎜
⎞⎠⎟
2162
⎛⎝⎜
⎞⎠⎟− 0
⎧⎨⎪
⎩⎪
⎫⎬⎪
⎭⎪6.75
= 2.02 ≥ 0.6 (OK)
=
6.75+ 7.25( )− 3− 2 860
⎛⎝⎜
⎞⎠⎟
⎡
⎣⎢
⎤
⎦⎥
860
⎛⎝⎜
⎞⎠⎟
2162
⎛⎝⎜
⎞⎠⎟− 0
⎧⎨⎪
⎩⎪
⎫⎬⎪
⎭⎪6.75
= 2.02 ≥ 0.6 (OK)
where
γt = factor used in designing hanger reinforcement as defined
in section 5.5.4 in the seventh edition of the PCI Design Handbook = 0 (open reinforcement)
APPENDIX
47PCI Journal | March–April 2018
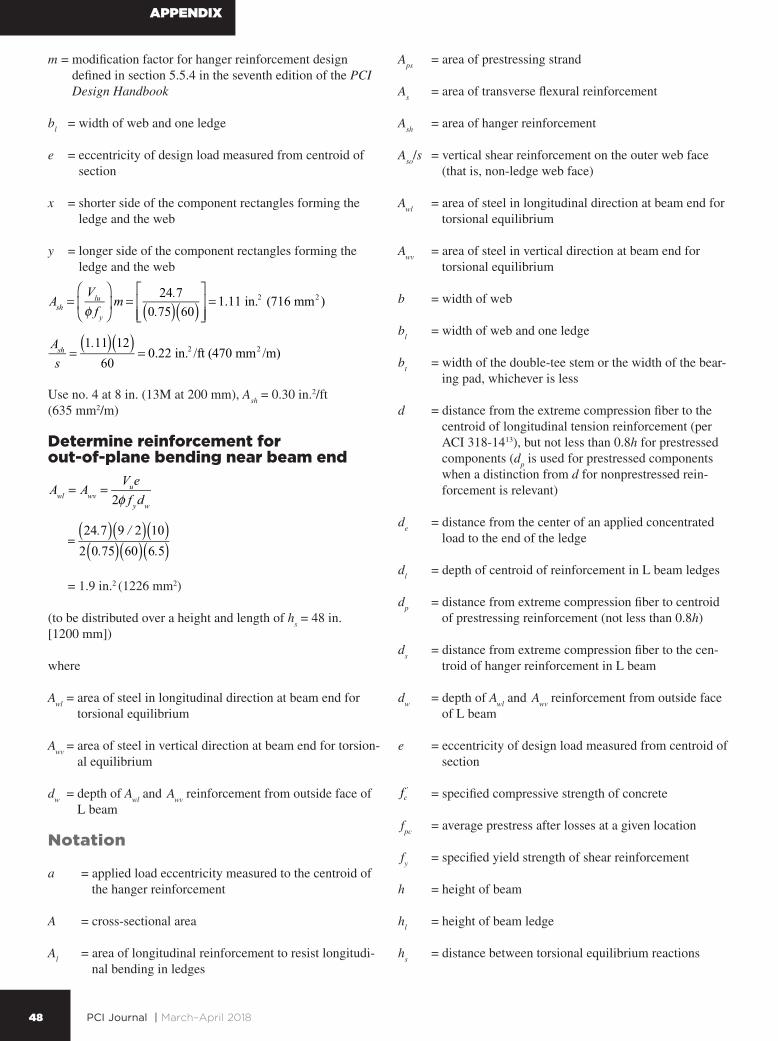
m = modification factor for hanger reinforcement design defined in section 5.5.4 in the seventh edition of the PCI Design Handbook
bl = width of web and one ledge
e = eccentricity of design load measured from centroid of section
x = shorter side of the component rectangles forming the ledge and the web
y = longer side of the component rectangles forming the ledge and the web
Ash =Vluφ f y
⎛
⎝⎜
⎞
⎠⎟ m = 24.7
0.75( ) 60( )⎡
⎣⎢⎢
⎤
⎦⎥⎥= 1.11 in.2 (716 mm2 )
Ashs
=1.11( ) 12( )60
= 0.22 in.2 /ft (470 mm2 /m)
Use no. 4 at 8 in. (13M at 200 mm), Ash
= 0.30 in.2/ft (635 mm2/m)
Determine reinforcement for out-of-plane bending near beam end
Awl = Awv =Vue2φ f ydw
=24.7( ) 9 / 2( ) 10( )2 0.75( ) 60( ) 6.5( )
= 1.9 in.2 (1226 mm2)
(to be distributed over a height and length of hs = 48 in.
[1200 mm])
where
Awl
= area of steel in longitudinal direction at beam end for torsional equilibrium
Awv
= area of steel in vertical direction at beam end for torsion-al equilibrium
dw = depth of A
wl and
A
wv reinforcement from outside face of
L beam
Notation
a = applied load eccentricity measured to the centroid of the hanger reinforcement
A = cross-sectional area
Al = area of longitudinal reinforcement to resist longitudi-
nal bending in ledges
Aps
= area of prestressing strand
As = area of transverse flexural reinforcement
Ash
= area of hanger reinforcement
Aso
/s = vertical shear reinforcement on the outer web face (that is, non-ledge web face)
Awl
= area of steel in longitudinal direction at beam end for torsional equilibrium
Awv
= area of steel in vertical direction at beam end for torsional equilibrium
b = width of web
bl = width of web and one ledge
bt = width of the double-tee stem or the width of the bear-
ing pad, whichever is less
d = distance from the extreme compression fiber to the centroid of longitudinal tension reinforcement (per ACI 318-1413), but not less than 0.8h for prestressed components (d
p is used for prestressed components
when a distinction from d for nonprestressed rein-forcement is relevant)
de = distance from the center of an applied concentrated
load to the end of the ledge
dl = depth of centroid of reinforcement in L beam ledges
dp = distance from extreme compression fiber to centroid
of prestressing reinforcement (not less than 0.8h)
ds = distance from extreme compression fiber to the cen-
troid of hanger reinforcement in L beam
dw = depth of A
wl and
A
wv reinforcement from outside face
of L beam
e = eccentricity of design load measured from centroid of section
fc' = specified compressive strength of concrete
fpc
= average prestress after losses at a given location
fy = specified yield strength of shear reinforcement
h = height of beam
hl = height of beam ledge
hs = distance between torsional equilibrium reactions
48
APPENDIX
PCI Journal | March–April 2018
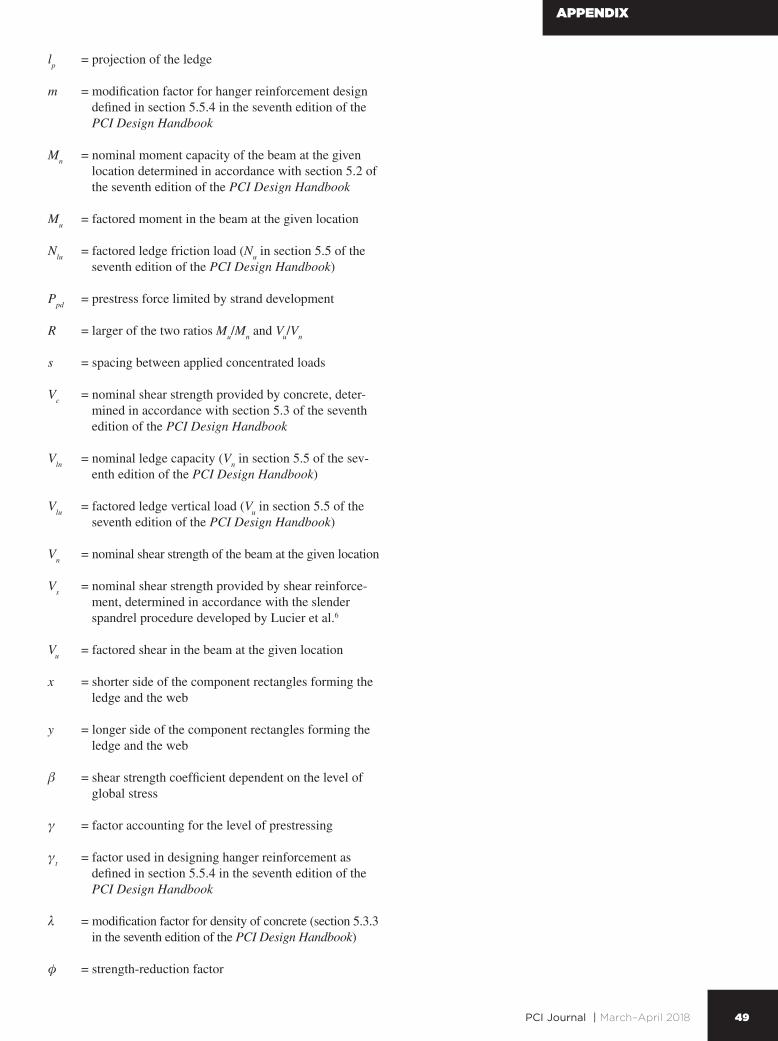
lp = projection of the ledge
m = modification factor for hanger reinforcement design defined in section 5.5.4 in the seventh edition of the PCI Design Handbook
Mn = nominal moment capacity of the beam at the given
location determined in accordance with section 5.2 of the seventh edition of the PCI Design Handbook
Mu = factored moment in the beam at the given location
Nlu = factored ledge friction load (N
u in section 5.5 of the
seventh edition of the PCI Design Handbook)
Ppd
= prestress force limited by strand development
R = larger of the two ratios Mu/M
n and V
u/V
n
s = spacing between applied concentrated loads
Vc = nominal shear strength provided by concrete, deter-
mined in accordance with section 5.3 of the seventh edition of the PCI Design Handbook
Vln = nominal ledge capacity (V
n in section 5.5 of the sev-
enth edition of the PCI Design Handbook)
Vlu = factored ledge vertical load (V
u in section 5.5 of the
seventh edition of the PCI Design Handbook)
Vn = nominal shear strength of the beam at the given location
Vs = nominal shear strength provided by shear reinforce-
ment, determined in accordance with the slender spandrel procedure developed by Lucier et al.6
Vu = factored shear in the beam at the given location
x = shorter side of the component rectangles forming the ledge and the web
y = longer side of the component rectangles forming the ledge and the web
β = shear strength coefficient dependent on the level of global stress
γ = factor accounting for the level of prestressing
γt = factor used in designing hanger reinforcement as
defined in section 5.5.4 in the seventh edition of the PCI Design Handbook
λ = modification factor for density of concrete (section 5.3.3 in the seventh edition of the PCI Design Handbook)