Page 1
Development of Enzymatic Fuel Cells
with Pyranose-2-Oxidase
A Thesis submitted by
Samet Şahin
For the Degree of Doctor of Philosophy
School of Chemical Engineering and Advanced Materials
Newcastle University
February 2017
Page 2
i
Abstract
Power harvesting from biological sources has been very popular recently because of the
advancements in implantable medical devices. Among all different biofuel cells, utilising
enzymes for glucose oxidation plays essential role in developing micro-power sources due to
their high bio-catalytic activity.
The aim of this study is to develop enzyme electrodes using pyranose-2-oxidase (P2O, wild
type and mutants) and investigate the potential use in enzymatic biofuel cell applications as
alternative to commercially available glucose oxidase (GOx) for glucose oxidation. Additional
work was also carried out with bilirubin oxidase (BOD) for oxygen reduction. The effect of
oxygen on enzyme performance, immobilization of the enzymes on carbon surface and biofuel
cell performance were mainly investigated. The electrochemical techniques employed in this
study were cyclic voltammetry, linear sweep voltammetry and chronoamperometry. Fuel cell
test were carried out in glass cells and custom-made stack cells by recording cell potential on
different resistances. Polarization curves were obtained by plotting voltage, current and power
values.
P2O and GOx were first tested in solution in the presence of electron mediator ferrocene
carboxylic acid (FcCOOH) to investigate the effect of oxygen on enzyme performances. P2O
and its mutants showed similar electrochemical behaviour compared to commercial GOx where
P2O-T169G mutant showed better performance, especially when oxygen is saturated in the
solution. The immobilization of the mutant P2O-T169G and GOx were then achieved using
crosslinking on pyrenyl carbon structures, where either FcCOOH was used in solution or
ferrocene (Fc) immobilised with nafion® polymer and carbon nanotubes on electrode surface.
BOD was also immobilised on electrode using same method without mediator. Results indicate
that enhanced current values was achieved compared to solution studies with good affinity
towards glucose for both of the enzymes.
Proof of concept biofuel cells were set up using P2O-T169G/GOx and BOD as anodes and
cathode, respectively. Initial tests showed that P2O-T169G based enzymatic fuel cell can reach
up to a power density of 9.56 µW cm-2 which is ~ 25 % more power output than it was obtained
for GOx in aerobic conditions. Finally, a biofuel cell anode using P2O-T169G was combined
with air breathing BOD cathode in a stack design enzymatic biofuel cell with an open circuit
potential of 0.558 V and maximum power density of 29.8±6.1 µW cm-2 at 0.318 V.
Page 3
ii
To My Family,
The reason for who I am today.
Thank you for your great support and continuous care.
I couldn’t have done it without you.
To Prof. Abdurrahman Tanyolaç,
My greatest inspiration and mentor for life with his exceptional personality.
I will never forget the things you have taught me
and how they have changed my life.
Page 4
iii
Acknowledgements
First of all, I would like to thank Allah (cc), for blessing me with this achievement and I am
eternally grateful for what I have in this life,
I would like to thank my supervisors, Dr. Eileen Yu, for her guidance throughout my studies
whom I am so grateful to work with and my second supervisor, Professor Jarka Glassey, for
being there whenever I needed,
I would like to thank my research group (based in Merz Court, C318 and Bedson, G10),
especially Dr. Henriette Christensen for her kind support,
I would like to thank all CEAM family; technicians, administrative staff and academic staff
especially those who had to deal with me. Also, all the student reps, fellow demonstrators and
module leaders I worked with in CEAM and SAgE faculty. It was a great pleasure working
with you, one which I will never forget.
I would like to thank Prof. Pimchai Chaiyen and her research group, for kindly providing P2O
enzyme samples for my studies and their endless support. I would also like to thank Dr. Kamila
Zelechowska and her research group, especially Miss. Izabela Kondratowicz, for kindly testing
my samples for SEM analysis and the collaboration for the graphene studies.
I would like to thank Republic of Turkey, Ministry of National Education, for sponsoring my
PhD and making it all possible.
I am eternally grateful to my family, for being there, cheering me up and taking great care of
me. None of my achievements would have been possible without your love and support.
Finally, I would like to thank everyone who has inspired me to do a PhD abroad. These were
the best days of my life (so far).
Page 6
v
Table of Contents
Abstract ........................................................................................................................................ i
Acknowledgements .................................................................................................................. iii
List of Figures ............................................................................................................................ ix
List of Tables ........................................................................................................................ xxiii
Nomenclature.......................................................................................................................... xxv
Abbreviations ....................................................................................................................... xxvii
Chapter 1. Introduction and Literature Review .......................................................................... 1
Introduction .................................................................................................................. 1
1.1.1. Overview of Enzymatic Biofuel Cells .................................................................. 1
1.1.2. Aims and Objectives ............................................................................................. 3
Literature Review ........................................................................................................ 4
1.2.1. Enzymes Used in Enzymatic Biofuel Cells .......................................................... 6
1.2.2. Enzymatic Electrode Assemblies for Biofuel Cells ........................................... 13
1.2.3. Enzymatic Biofuel Cell Configurations and Performance ................................. 32
Review of Methods for Electrochemical Analysis .................................................... 40
1.3.1. The Cell Set-up ................................................................................................... 41
1.3.2. Electrochemical Characterization ....................................................................... 41
1.3.3. Fuel Cell Polarization ......................................................................................... 44
Chapter 2. Electrochemical Glucose Oxidation by Pyranose-2-Oxidase Mutants for Enzymatic
Biofuel Cell Applications ......................................................................................................... 47
2.1. Introduction ................................................................................................................ 47
2.2. Experimental .............................................................................................................. 49
2.2.1. Materials ............................................................................................................. 49
2.2.2. Electrochemical Measurements .......................................................................... 50
2.3. Results and Discussion .............................................................................................. 50
Page 7
vi
2.3.1. Electrochemical characterization of Pyranose-2-oxidase and its mutants in
solution 50
2.3.2. Electrochemical characterization of Glucose Oxidase in solution and comparison
with P2O enzymes ........................................................................................................... 64
2.4. Conclusions ............................................................................................................... 70
Chapter 3. Immobilization of Mutant P2O and GOx on Pyrenyl Carbon Structures for Glucose
Oxidation .................................................................................................................................. 73
3.1. Introduction ................................................................................................................... 73
3.2. Experimental ................................................................................................................. 77
3.2.1. Materials................................................................................................................. 77
3.2.2. Preparation of Ferrocene-Nafion Redox Polymer with Multi-Walled Carbon
Nanotubes (Fc-Nafion-MWCNTs) .................................................................................. 78
3.2.3. Fabrication of Enzyme Electrodes ......................................................................... 78
3.3. Electrochemical Measurements ................................................................................. 80
3.4. Results and Discussion.................................................................................................. 81
3.4.1. Enzyme electrodes in solution with FcCOOH ....................................................... 81
3.4.2. Enzyme electrodes modified with ferrocene-nafion-multi-walled carbon nanotubes
(Fc-Nafion-MWCNTs) .................................................................................................... 89
3.5. Conclusions ................................................................................................................. 103
Chapter 4. A Glucose-Air Enzymatic Biofuel Cell with Pyranose-2-Oxidase ..................... 105
4.1. Introduction ............................................................................................................. 105
4.2. Experimental ........................................................................................................... 107
4.2.1. Materials........................................................................................................... 107
4.2.2. Preparation of Enzymatic Biofuel Cell Anode ................................................ 107
4.2.3. Preparation of Enzymatic Biofuel Cell Cathode .............................................. 107
4.2.4. Electrochemical and Fuel Cell Measurements ................................................. 108
4.3. Results and Discussion ............................................................................................ 109
4.3.1. Performance of EBFCs with P2O-T169G, GOx and BOD ............................. 109
Page 8
vii
4.3.2. Stability of EBFC with P2O-T169G and Air-breathing Cathode .................... 121
4.4. Conclusions .............................................................................................................. 124
Chapter 5. Conclusion and Recommendations for Future Work ........................................... 127
5.1. Conclusion ............................................................................................................... 127
5.2. Recommendations for Future Work ........................................................................ 128
5.2.1. Optimization of Enzyme Electrodes and EBFC ............................................... 128
5.2.2. Enzymes ........................................................................................................... 128
5.2.3. Materials for Electrode Fabrication .................................................................. 129
5.2.4. Biofuel Cell Design .......................................................................................... 131
Appendix ................................................................................................................................ 133
Appendix A ........................................................................................................................ 133
Appendix B ......................................................................................................................... 141
Appendix C ......................................................................................................................... 146
Appendix D ........................................................................................................................ 148
References .............................................................................................................................. 149
Page 10
ix
List of Figures
Figure 1. 1. Schematic diagram of a membrane-less glucose/oxygen enzymatic biofuel cell. . 1
Figure 1. 2. Illustrating the scale of credibility gap for biofuel cells and biosensors in terms of
approximate power output ranges (Bullen et al., 2006). ............................................................ 3
Figure 1. 3. EBFC publications between 2010 and 2012 (Source: Web of Knowledge). ......... 5
Figure 1. 4. The reaction catalyzed by GOx. ............................................................................. 6
Figure 1. 5. Structure of the GOx enzyme and FAD units (Goodsell, 2006). ........................... 7
Figure 1. 6. Structure of the P2O subunit from Trametes multicolor (Martin Hallberg et al.,
2004). .......................................................................................................................................... 8
Figure 1. 7. Cross-section view two subunits (marked as A and C) showing the active site and
the channels providing water-accessible structure (Martin Hallberg et al., 2004). .................... 9
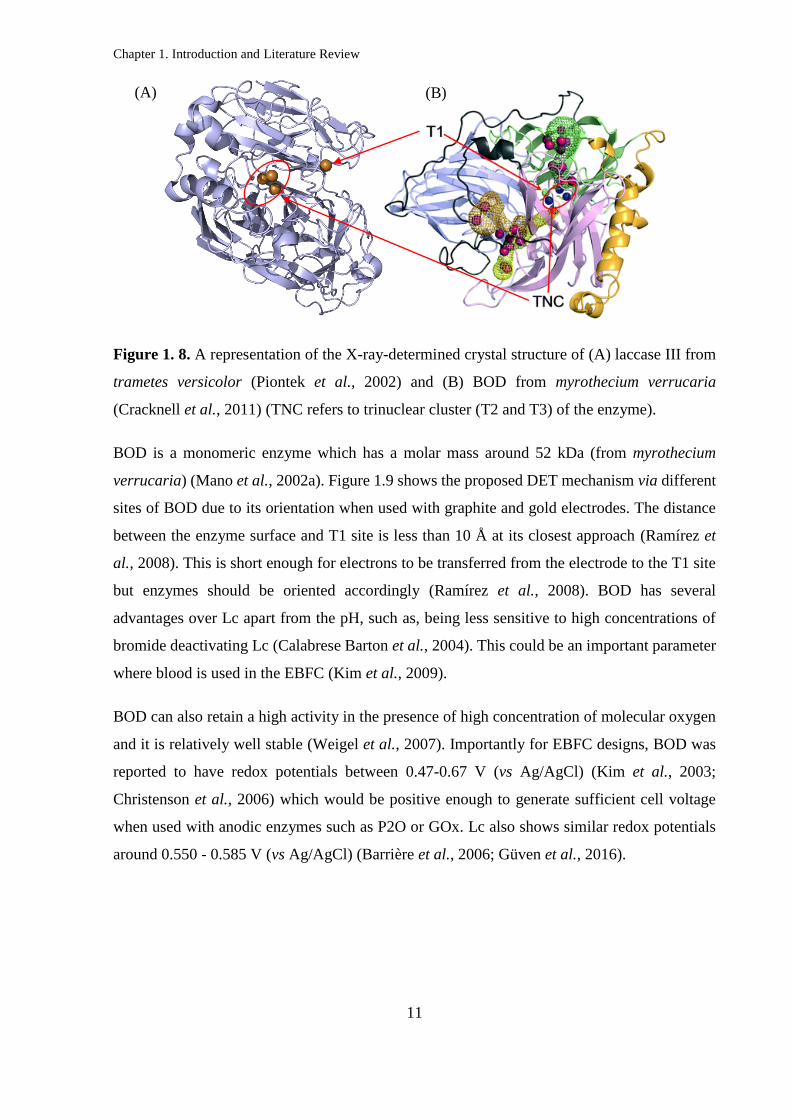
Figure 1. 8. A representation of the X-ray-determined crystal structure of (A) laccase III from
trametes versicolor (Piontek et al., 2002) and (B) BOD from myrothecium verrucaria
(Cracknell et al., 2011) (TNC refers to trinuclear cluster (T2 and T3) of the enzyme). .......... 11
Figure 1. 9. Mechanisms of DET from electrodes to BOD connected (A) via the T1 site and
(B) via the T2/T3 cluster (Ramírez et al., 2008). ..................................................................... 12
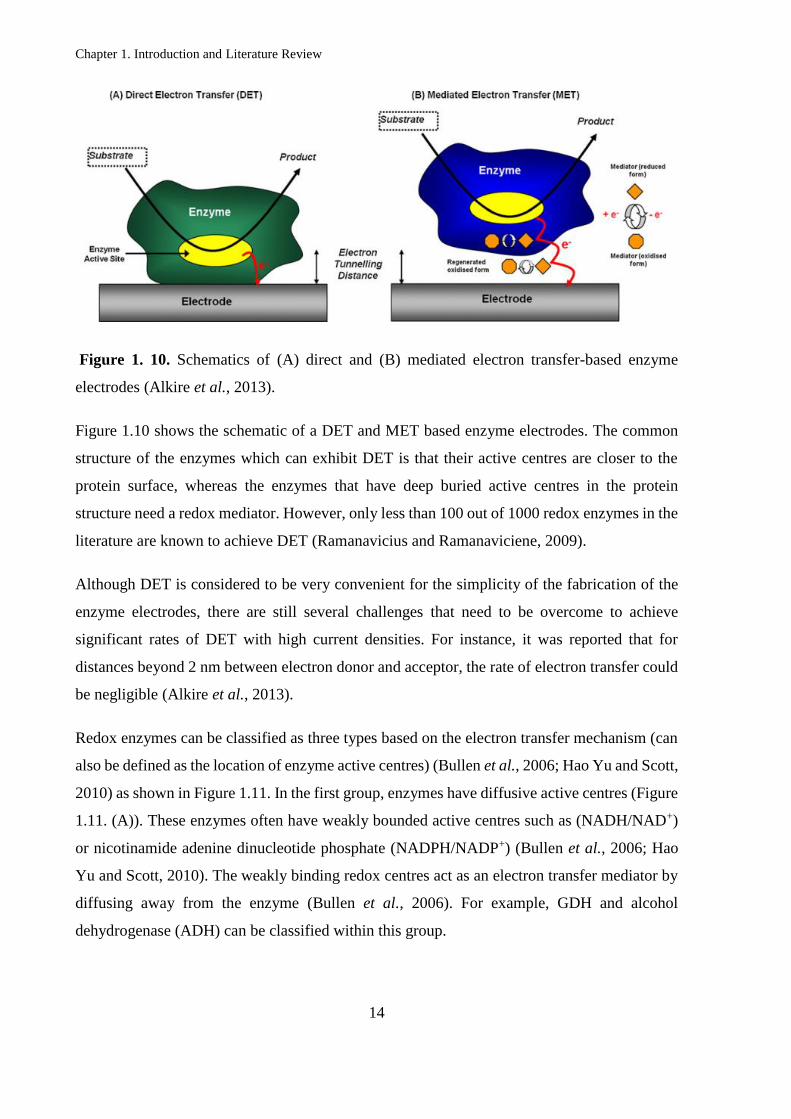
Figure 1. 10. Schematics of (A) direct and (B) mediated electron transfer-based enzyme
electrodes (Alkire et al., 2013). ................................................................................................ 14
Figure 1. 11. The different locations of enzyme active centres, (A) Enzyme active centre is
NAD(H) or NADP(H), (B) the active centre is diffusive and (C) the active centre is located
deep buried inside the enzyme (Bullen et al., 2006). ............................................................... 15
Figure 1. 12. Immobilization technology in biofuel cells (Yang et al., 2012). ....................... 17
Figure 1. 13. Schematic diagram of LBL fabrication of an enzyme electrode for
electrochemical detection of fatty acids (ACOD: Acyl-CoA Oxidase, ACS: Acyl-CoA
Synthetase, C SPE: Carbon screen printed electrode, MWCNT: Multi-walled carbon
nanotubes) (Kang et al., 2014). ................................................................................................ 18
Page 11
x
Figure 1. 14. Schematic of immobilised enzyme using nanostructured silica sol-gel entrapment
method (Lim et al., 2007). ....................................................................................................... 18
Figure 1. 15. Covalent enzyme immobilization with (A) epoxy-modified silica (B)
aminopropyl-modified silica (Jung et al., 2010). ..................................................................... 19
Figure 1. 16. EDC-NHS crosslinking reaction scheme (Scientific, 2016). ............................. 20
Figure 1. 17. Schematic for crosslinking enzymes on pyrene activated carbon nanotubes using
EDC-NHS couple (Krishnan and Armstrong, 2012). .............................................................. 20
Figure 1. 18. (A) The structure of anodic Os polymer with a 13-atom flexible spacer between
the polymer backbone and the Os complex (B) Schematics of electron conduction in Os redox
hydrogels (Mano et al., 2002b; Heller, 2006). ......................................................................... 23
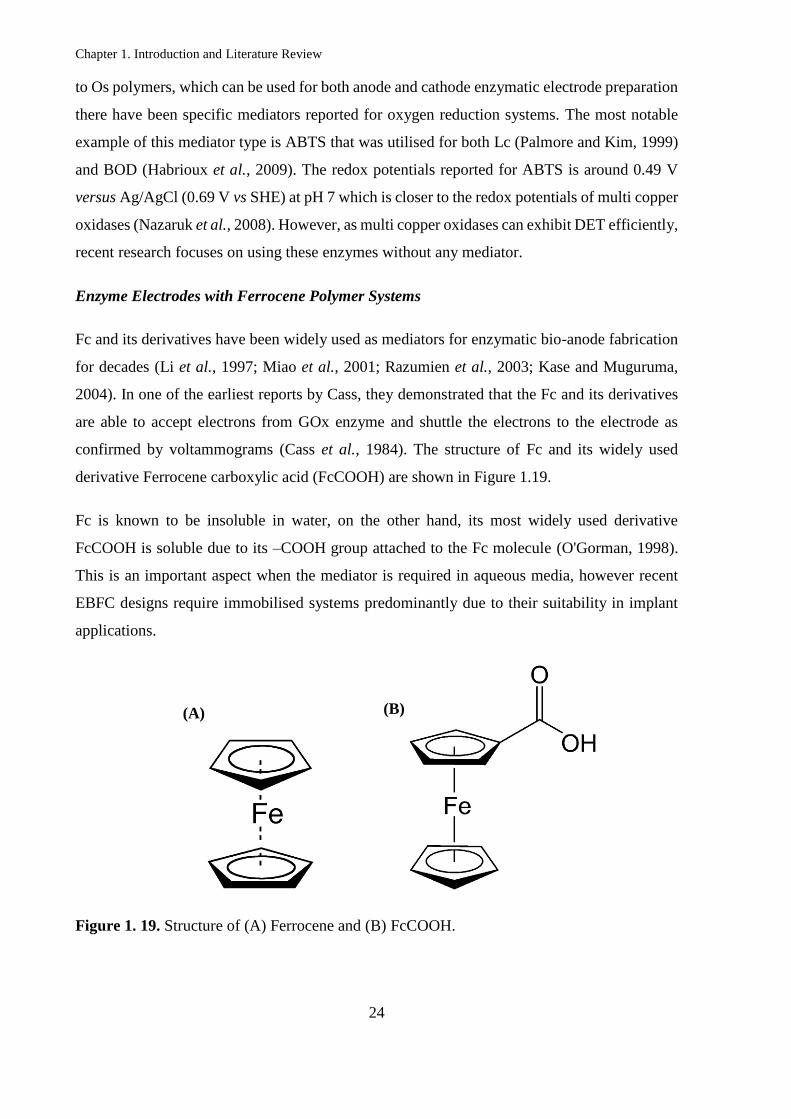
Figure 1. 19. Structure of (A) Ferrocene and (B) FcCOOH. .................................................. 24
Figure 1. 20. Schematic of enzymatic anode based on SWCNTs incorporated with Fc redox
polymer (Tran et al., 2011). ..................................................................................................... 26
Figure 1. 21. Structure of nafion®. .......................................................................................... 27
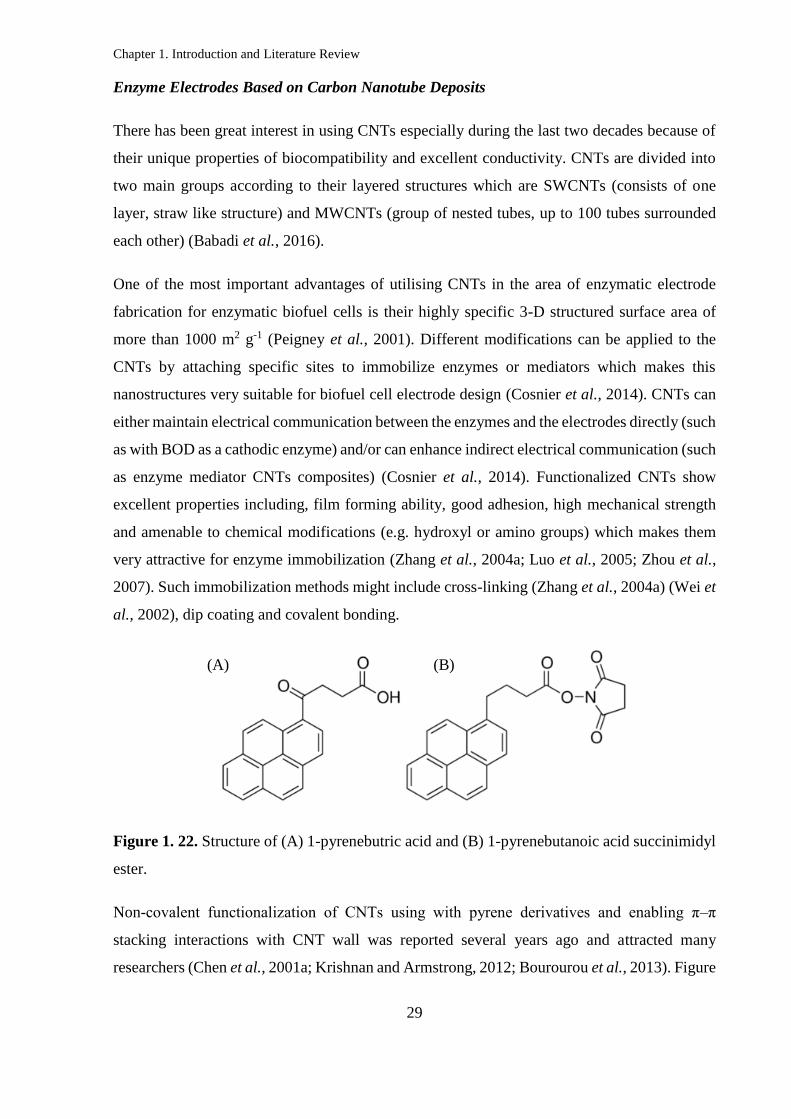
Figure 1. 22. Structure of (A) 1-pyrenebutric acid and (B) 1-pyrenebutanoic acid succinimidyl
ester. ......................................................................................................................................... 29
Figure 1. 23. Schematic of PQQ-GHD and Lc immobilised on pyrenyl carbon nanostructures
(Szczupak et al., 2012). ............................................................................................................ 30
Figure 1. 24. Enzymatic biofuel cells demonstrated in non-mamal living animals: (A) snail, (B)
lobster and (C) clam (Halámková et al., 2012; Szczupak et al., 2012; MacVittie et al., 2013).
.................................................................................................................................................. 33
Figure 1. 25. Enzymatic biofuel cells implanted in (A) rabbit ear and (B) rat (Miyake et al.,
2011; Zebda et al., 2013). ........................................................................................................ 37
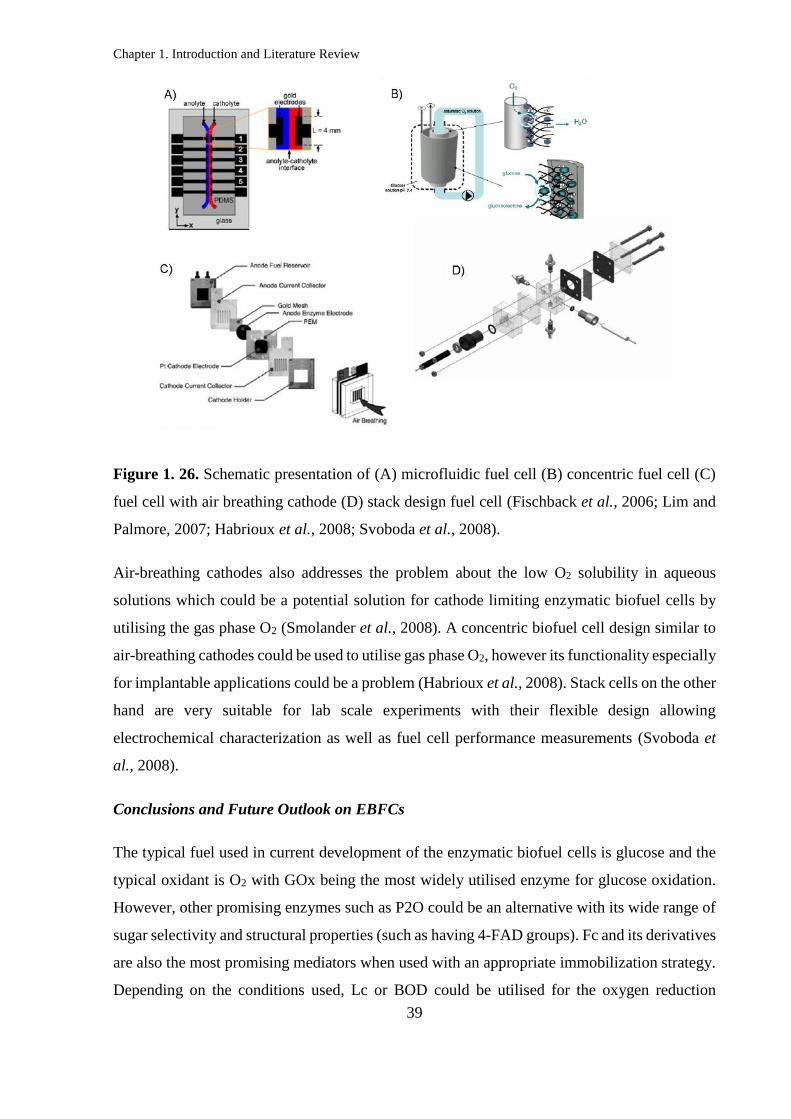
Figure 1. 26. Schematic presentation of (A) microfluidic fuel cell (B) concentric fuel cell (C)
fuel cell with air breathing cathode (D) stack design fuel cell (Fischback et al., 2006; Lim and
Palmore, 2007; Habrioux et al., 2008; Svoboda et al., 2008). ................................................. 39
Page 12
xi
Figure 1. 27. Simple presentation of an experimental set-up for three-electrode electrochemical
cell. ........................................................................................................................................... 41
Figure 1. 28. (A) CV waveform and (B) typical CV (Princeton) ............................................ 42
Figure 1. 29. Plot of peak height for cadmium reduction at various scan rates (Princeton, 2016).
.................................................................................................................................................. 43
Figure 1. 30. (A) Polarization curve and the losses (Gold, 2012) (B) power curve with
polarization curve for an EBFC (González-Guerrero et al., 2013). ......................................... 44
Figure 2. 1. (A) CV (scan rate: 10 mV s-1) and (B) LSV (scan rate: 1 mV s-1) scans of nitrogen
saturated solutions with 0 mM and 2 mM concentrations of glucose added to the solution
containing 0.5 mM FcCOOH and 1 mg mL-1 P2O-WT in PBS at pH 7. (GCE surface area:
0.071 cm2). ................................................................................................................................ 52
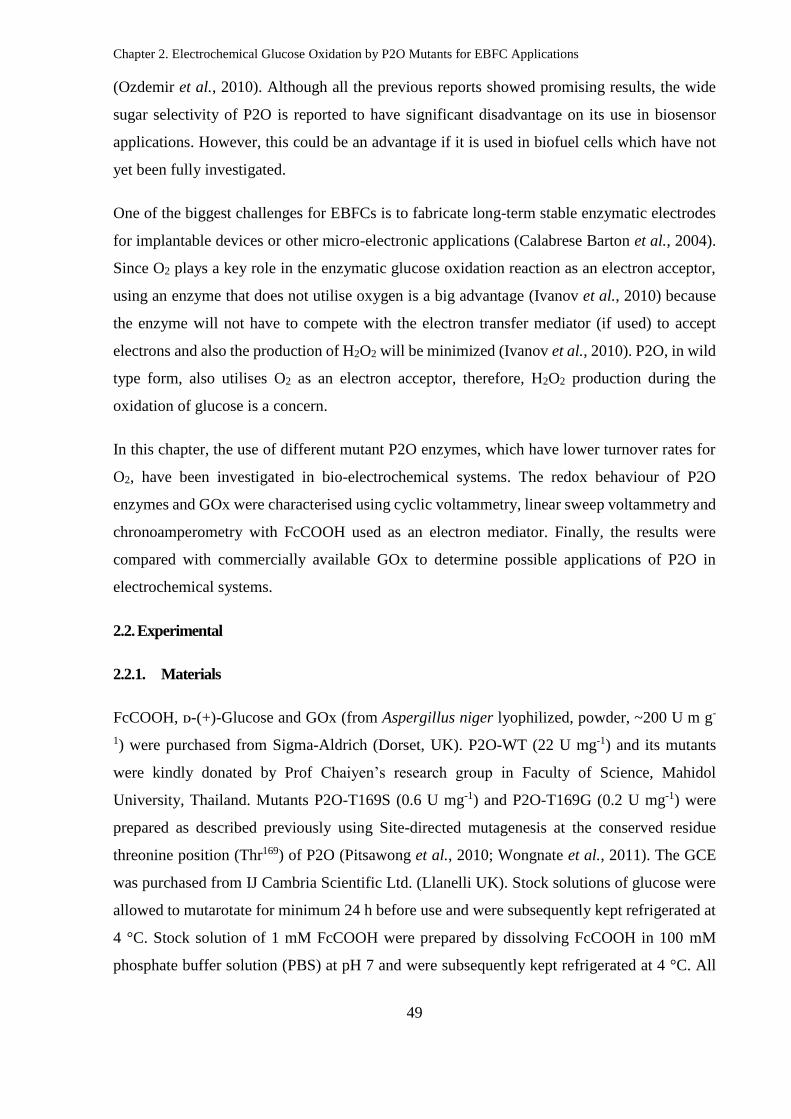
Figure 2. 2. LSV (scan rate: 1 mV s-1) scans of nitrogen saturated solutions with different
concentrations of glucose added to the solution containing 0.5 mM FcCOOH and 1 mg mL-1
P2O-WT in PBS at pH 7. (GCE surface area: 0.071 cm2). ...................................................... 53
Figure 2. 3. Plot of peak heights at various scan rates for 0 mM and 2 mM concentrations of
glucose added to the solution containing 0.5 mM FcCOOH and 1 mg mL-1 P2O-WT in PBS, at
pH 7. Data obtained from Figure A.1 and Figure A.2 in Appendix A. .................................... 54
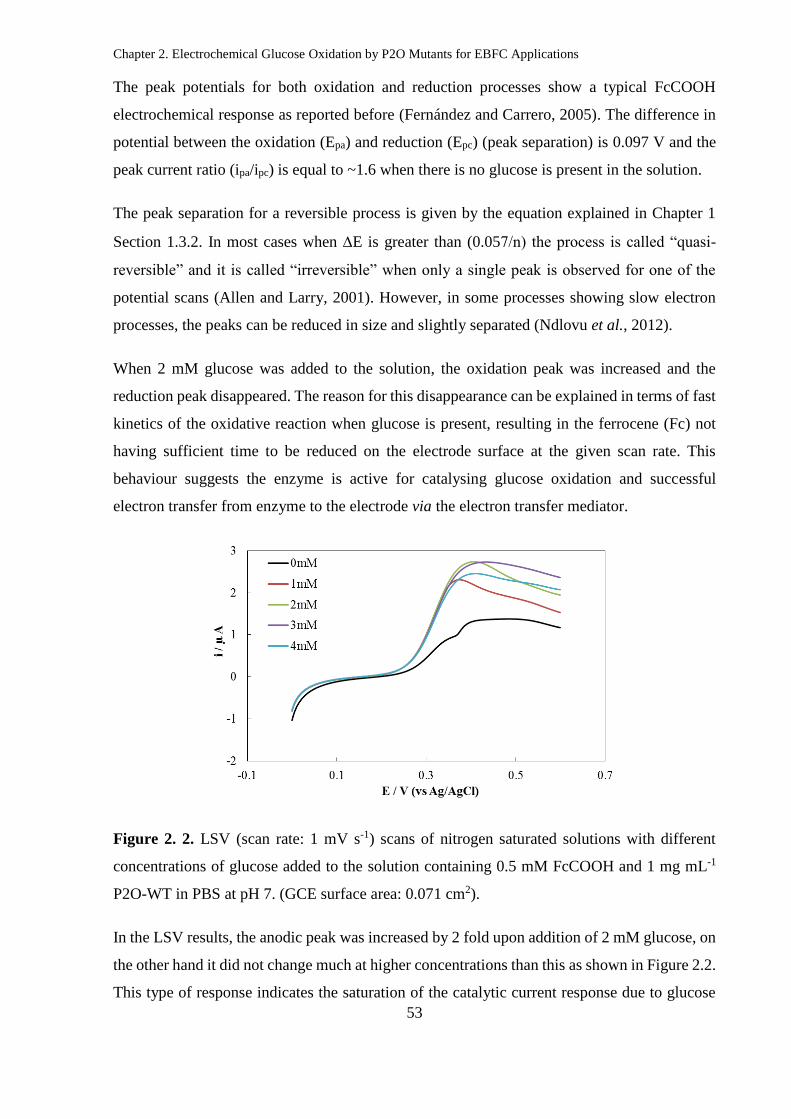
Figure 2. 4. (A) CV (scan rate: 10 mV s-1) and (B) LSV (scan rate: 1 mV s-1) scans of nitrogen
saturated solutions with 0 mM (black) and 2 mM (red) concentrations of glucose added to the
solution containing 0.5 mM FcCOOH and 1 mg mL-1 P2O-T169S in PBS, at pH 7. (GCE,
surface area: 0.071 cm2). .......................................................................................................... 55
Figure 2. 5. LSV (scan rate: 1 mV s-1) scans of nitrogen saturated solutions with different
concentrations of glucose added to the solution containing 0.5 mM FcCOOH and 1 mg mL-1
P2O-T169S in PBS, at pH 7. (GCE, surface area: 0.071 cm2). ................................................ 56
Figure 2. 6. Plot of peak heights at various scan rates for 0 mM and 2 mM concentrations of
glucose added to the solution containing 0.5 mM FcCOOH and 1 mg mL-1 P2O-T169S in PBS,
at pH 7. Data obtained from Figure A.3 and Figure A.4 in Appendix A ................................. 57
Page 13
xii
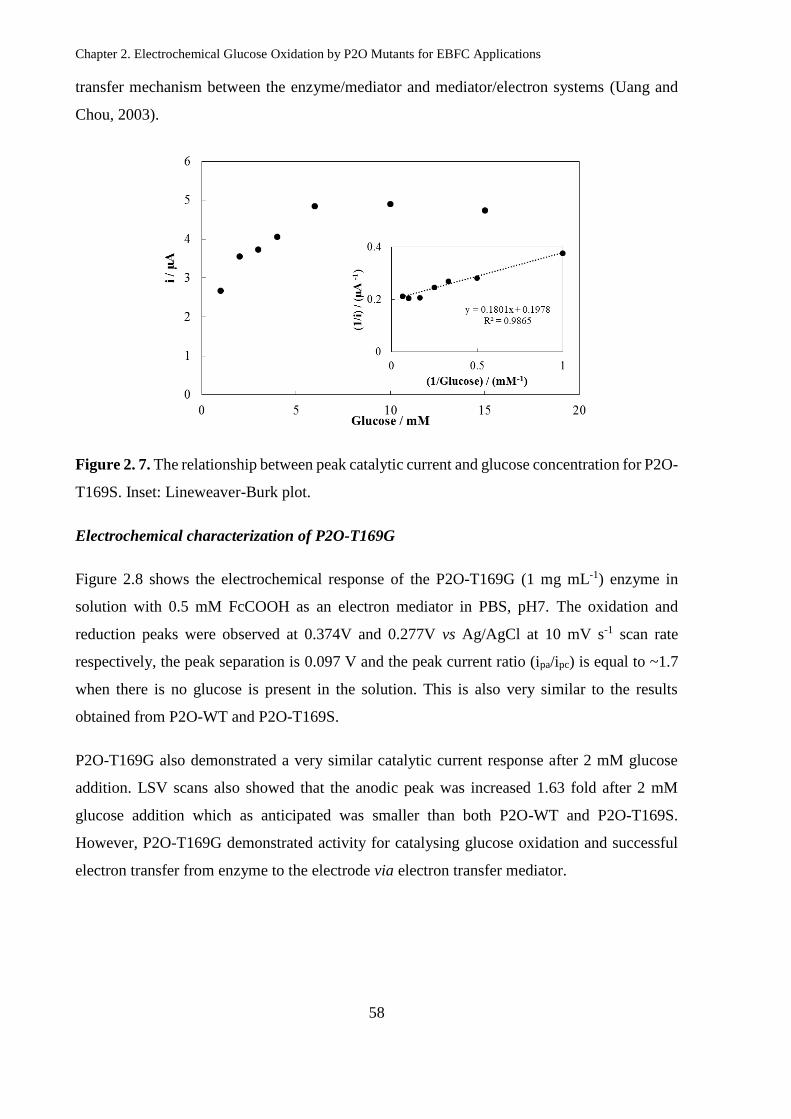
Figure 2. 7. The relationship between peak catalytic current and glucose concentration for P2O-
T169S. Inset: Lineweaver-Burk plot. ....................................................................................... 58
Figure 2. 8. (A) CV (scan rate: 10 mV s-1) and (B) LSV (scan rate: 1 mV s-1) scans of nitrogen
saturated solutions with 0 mM (black) and 2 mM (red) concentrations of glucose added to the
solution containing 0.5 mM FcCOOH and 1 mg mL-1 P2O-T169G in PBS at pH 7. (GCE
surface area: 0.071 cm2). .......................................................................................................... 59
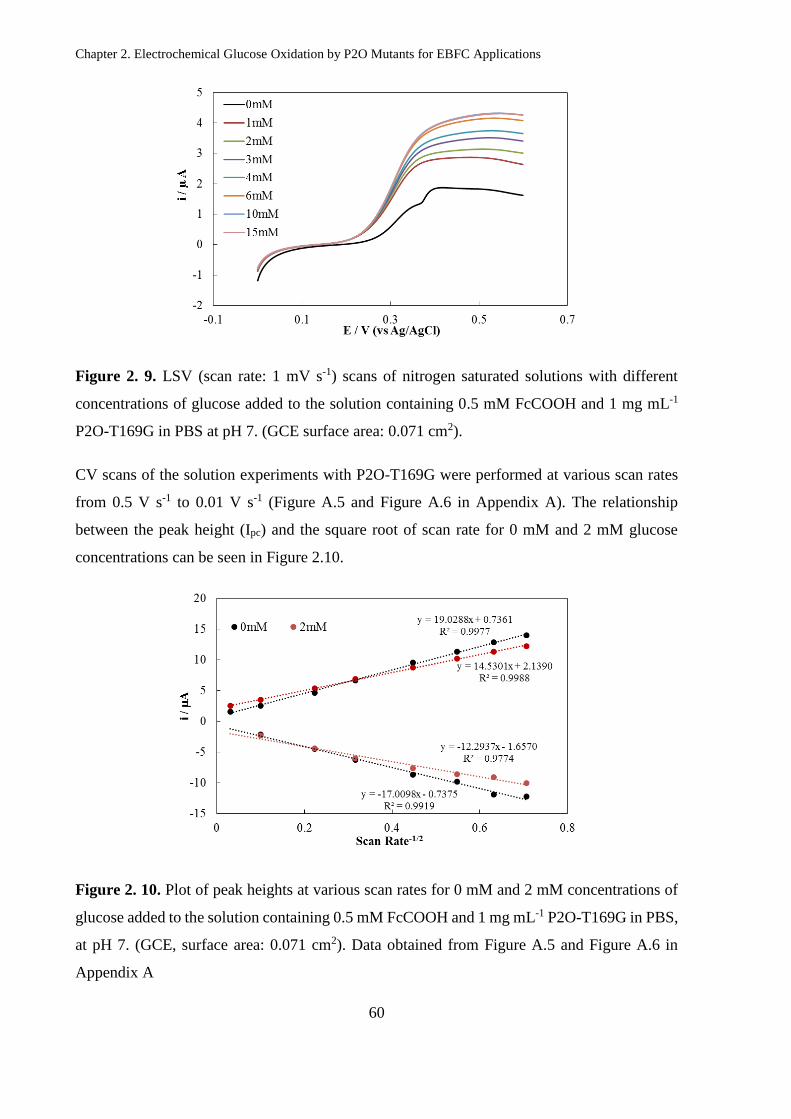
Figure 2. 9. LSV (scan rate: 1 mV s-1) scans of nitrogen saturated solutions with different
concentrations of glucose added to the solution containing 0.5 mM FcCOOH and 1 mg mL-1
P2O-T169G in PBS at pH 7. (GCE surface area: 0.071 cm2). ................................................. 60
Figure 2. 10. Plot of peak heights at various scan rates for 0 mM and 2 mM concentrations of
glucose added to the solution containing 0.5 mM FcCOOH and 1 mg mL-1 P2O-T169G in PBS,
at pH 7. (GCE, surface area: 0.071 cm2). Data obtained from Figure A.5 and Figure A.6 in
Appendix A .............................................................................................................................. 60
Figure 2. 11. The relationship between peak catalytic current and glucose concentration for
P2O-T169G. Inset: Lineweaver-Burk plot............................................................................... 61
Figure 2. 12. LSV (scan rate: 1 mV s-1) scans of nitrogen saturated solutions with 2 mM
concentrations of glucose added to the solution containing 0.5 mM FcCOOH and 1 mg mL-1
concentrations of P2O-WT, P2O-T169S and P2O-T169G at pH 7. (GCE surface area: 0.071
cm2 and 0 mM concentration data is subtracted from 2 mM concentration data). .................. 62
Figure 2. 13. LSV (scan rate: 1 mV s-1) scans of (A) P2O-T169S and (B) P2O-T169G (both
concentrations are 1 mg mL-1 in PBS) in nitrogen and air saturated solutions with 2 mM
concentrations of glucose added to the solution containing 0.5 mM FcCOOH in PBS at pH 7.
(GCE surface area: 0.071 cm2). ............................................................................................... 63
Figure 2. 14. (A) CV (scan rate: 10 mV s-1) and (B) LSV (scan rate: 1 mV s-1) scans of nitrogen
saturated solutions with 0 mM (black) and 2 mM (red) concentrations of glucose added to the
solution containing 0.5 mM FcCOOH and 1 mg mL-1 GOx in PBS at pH 7. (GCE surface area:
0.071 cm2). ............................................................................................................................... 65
Figure 2. 15. Plot of peak heights at various scan rates for 0 mM and 2 mM concentrations of
glucose added to the solution containing 0.5 mM FcCOOH and 1 mg mL-1 GOx in PBS at pH
Page 14
xiii
7. (GCE surface area: 0.071 cm2). Data obtained from Figure A.10 and Figure A.11 in Appendix
A. .............................................................................................................................................. 66
Figure 2. 16. The relationship between peak catalytic current and glucose concentration for
GOx. Inset: Lineweaver-Burk plot. .......................................................................................... 67
Figure 2. 17. CAs (1 h length) of air saturated solutions for GOx and P2O-T169G (both 1 mg
mL-1) at 0.350 V for 0 mM and 4 mM concentrations of glucose added to the solution containing
0.5 mM FcCOOH, at pH 7. (GCE, surface area: 0.071 cm2). .................................................. 68
Figure 2. 18. CAs (3 h length) of air saturated solutions for GOx and P2O-T169G (both 1 mg
mL-1) at 0.350 V for 4 mM concentration of glucose added to the solution containing 0.5 mM
FcCOOH, at pH 7. (GCE, surface area: 0.071 cm2). ................................................................ 69
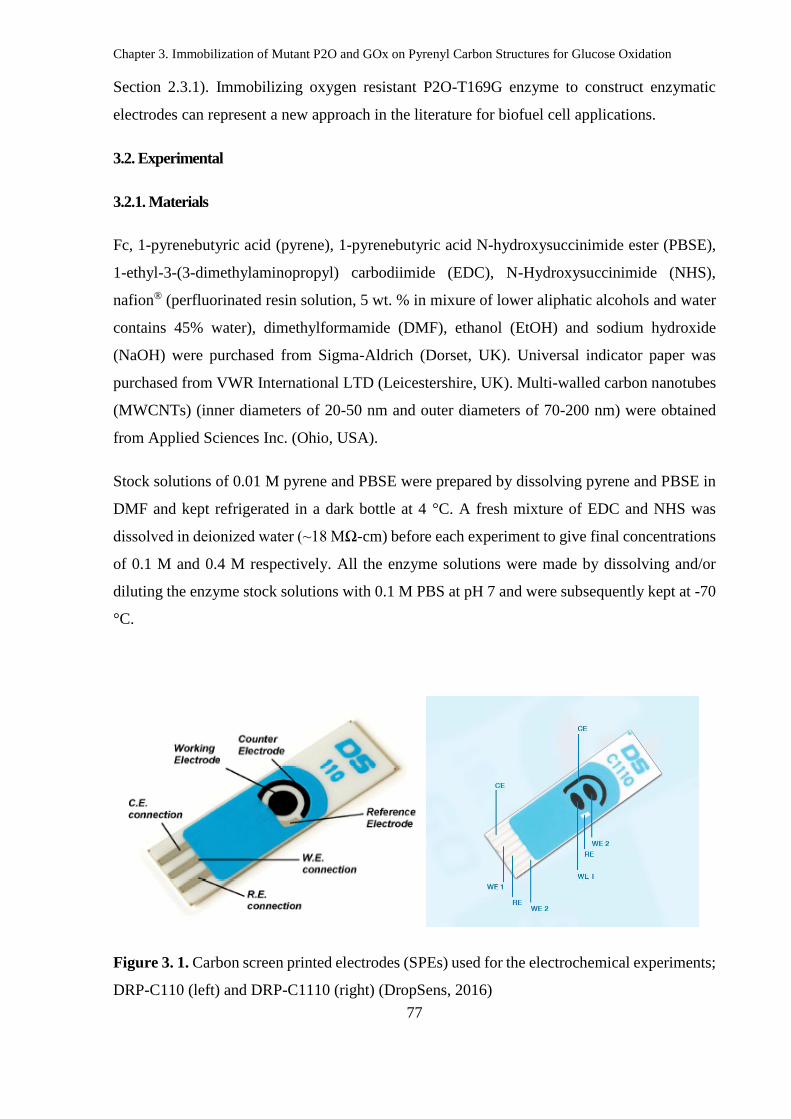
Figure 3. 1. Carbon screen printed electrodes (SPEs) used for the electrochemical experiments;
DRP-C110 (left) and DRP-C1110 (right) (DropSens, 2016) ................................................... 77
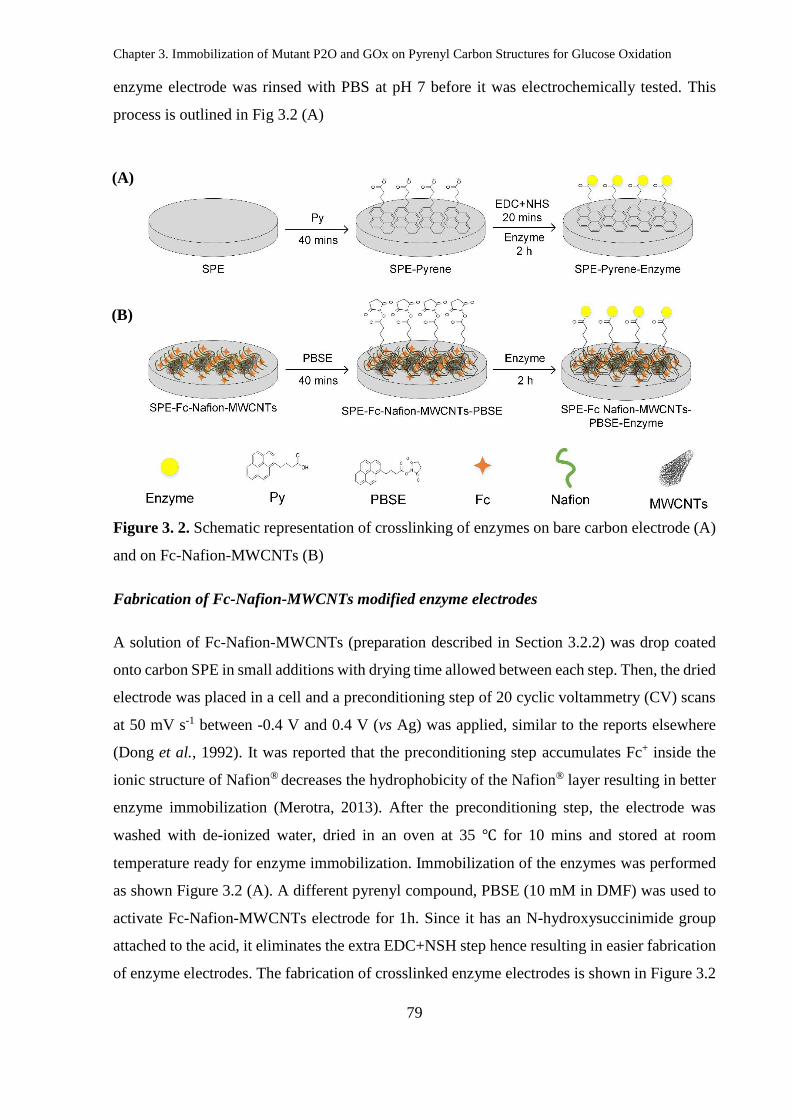
Figure 3. 2. Schematic representation of crosslinking of enzymes on bare carbon electrode (A)
and on Fc-Nafion-MWCNTs (B) ............................................................................................. 79
Figure 3. 3. Experimental set-up for electrochemical experiments. ........................................ 80
Figure 3. 4. CV (scan rate: 5 mV s-1) scans of (A) P2O-T169G and (B) GOx immobilised on
carbon SPE. Tested in nitrogen saturated solutions with 0 mM and 4 mM concentrations of
glucose added to the solution containing 0.5 mM FcCOOH in 0.1 M PBS at pH 7. Ag is the
silver/silver ion reference electrode used on the SPE (SPE surface area: 0.126 cm2). ............ 82
Figure 3. 5. (A) CA experiment at 0.2 V (vs Ag) of various glucose concentrations for P2O-
T169G enzyme immobilised on carbon SPE, (B) Current values for various glucose
concentrations derived from (A) and (C) the calibration curve for the linear region. Tested in
saturated solutions of 0.5 mM FcCOOH in PBS at pH 7. Ag is the silver/silver ion reference
electrode used on the SPE (SPE surface area: 0.126 cm2). Error bars are sample standard
deviations of measurements on n = 2 samples. ........................................................................ 84
Figure 3. 6. (A) CA experiment at 0.2 V (vs Ag) of various glucose concentrations for GOx
enzyme immobilised on carbon SPE, (B) Current values for various glucose concentrations
Page 15
xiv
derived from (A) and (C) the calibration curve for the linear region. Tested in saturated
solutions of 0.5 mM FcCOOH in PBS at pH 7. Ag is the silver/silver ion reference electrode
used on the SPE (SPE surface area: 0.126 cm2). Error bars are sample standard deviations of
measurements on n = 2 samples. .............................................................................................. 85
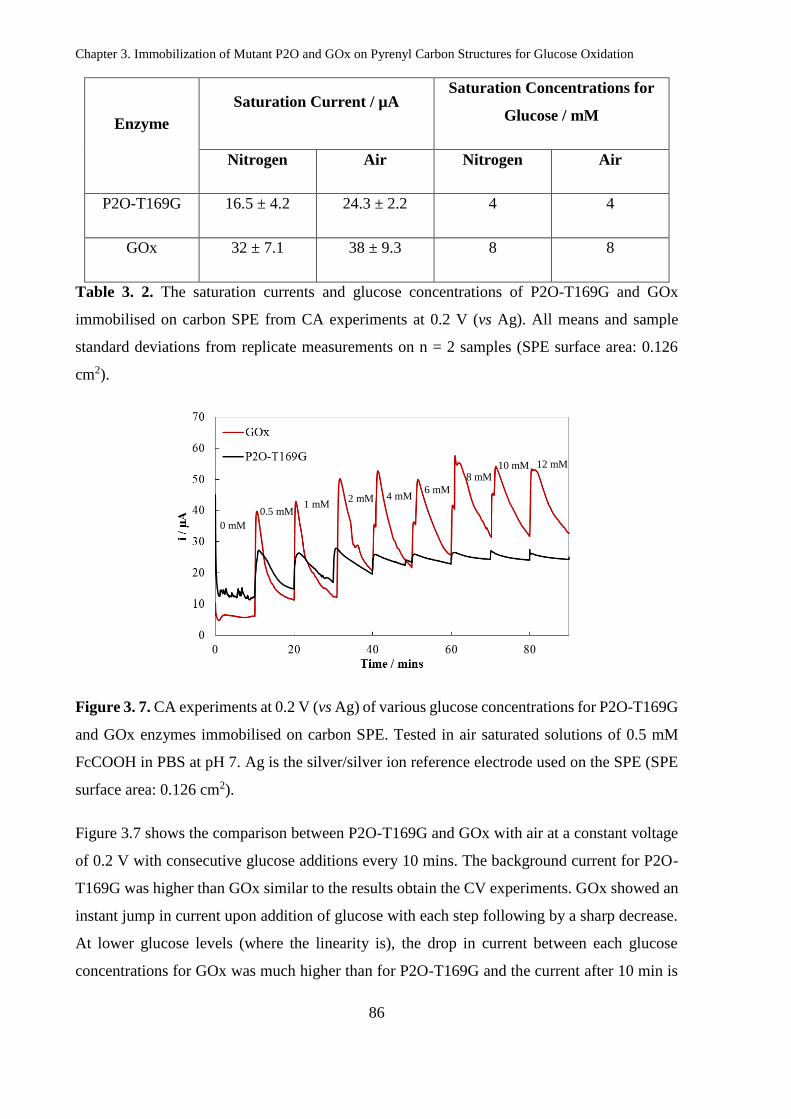
Figure 3. 7. CA experiments at 0.2 V (vs Ag) of various glucose concentrations for P2O-T169G
and GOx enzymes immobilised on carbon SPE. Tested in air saturated solutions of 0.5 mM
FcCOOH in PBS at pH 7. Ag is the silver/silver ion reference electrode used on the SPE (SPE
surface area: 0.126 cm2). .......................................................................................................... 86
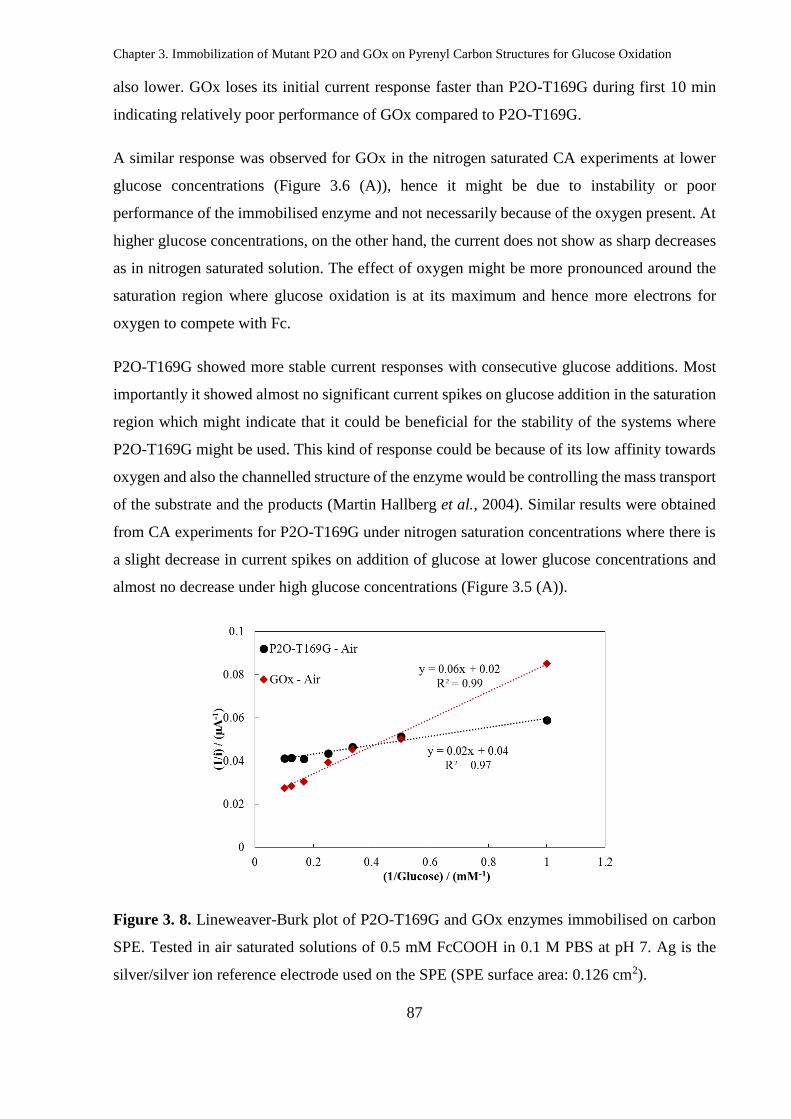
Figure 3. 8. Lineweaver-Burk plot of P2O-T169G and GOx enzymes immobilised on carbon
SPE. Tested in air saturated solutions of 0.5 mM FcCOOH in 0.1 M PBS at pH 7. Ag is the
silver/silver ion reference electrode used on the SPE (SPE surface area: 0.126 cm2). ............ 87
Figure 3. 9. CV (scan rate: 50 mV s-1) scans for the pre-conditioning of the carbon SPEs
modified with Fc-Nafion. Tested in 0.1 M PBS at pH 7. Fc-Nafion loading is 0.06 mg cm-2. Ag
is the silver/silver ion reference electrode used on the SPE (SPE surface area: 0.126 cm2). (All
20 scans are shown in Figure B.9) ........................................................................................... 89
Figure 3. 10. Comparison between Fc-Nafion and Fc-Nafion-MWCNTs coated electrodes after
pre-conditioning step. CVs performed at a scan rate of 10 mV s-1, tested in 0.1 M PBS at pH 7.
Fc-Nafion and Fc-Nafion-MWCNTs loadings are 0.06 mg cm-2. Ag is the silver/silver ion
reference electrode used on the SPE (SPE surface area: 0.126 cm2). ...................................... 90
Figure 3. 11. (A) CVs (scan rate: 10 mV s-1) showing the effect of the different amounts of Fc-
Nafion-MWCNTs coated on SPEs after pre-conditioning step and (B) anodic peak current
values of the different electrodes prepared. Tested in 0.1 M PBS at pH 7. Ag is the silver/silver
ion reference electrode used on the SPE (SPE surface area: 0.126 cm2). Error bars are sample
standard deviations of measurements on n = 3 samples. ......................................................... 91
Figure 3. 12. SEM images of the (A) bare electrode, Fc-Nafion (B) before and (C) after pre-
conditioning step and Fc-Nafion-MWCNTs (D) before and (E) after pre-conditioning step . 92
Figure 3. 13. SEM images of (A) unconditioned, (B) pre-conditioned Fc-Nafion-MWCNTs
coated electrodes, (C) only MWCNTs and (D) pre-conditioned Fc-Nafion-MWCNTs with
higher magnification. ............................................................................................................... 94
Page 16
xv
Figure 3. 14. CV (scan rate: 5 mV s-1) scans of (A) P2O-T169G and (B) GOx immobilised on
Fc-Nafion-MWCNTs pre-conditioned carbon SPE. Tested in nitrogen saturated solution for
various glucose concentrations containing 0.5 mM FcCOOH in PBS at pH 7. Ag is the
silver/silver ion reference electrode used on the SPE (SPE surface area: 0.126 cm2). ............ 95
Figure 3. 15. (A) CA experiment at 0.15 V (vs Ag) of various glucose concentrations for P2O-
T169G enzyme immobilised on Fc-Nafion-MWCNTs pre-conditioned carbon SPE, (B) Current
values for various glucose concentrations derived from (A), (C) CA experiment at 0.15 V (vs
Ag) of various glucose concentrations for GOx enzyme immobilised on carbon SPE and (D)
Current values for various glucose concentrations derived from (C). Tested in 0.1 M PBS at pH
7. Ag is the silver/silver ion reference electrode used on the SPE (SPE surface area: 0.059 cm2).
Error bars are sample standard deviations of measurements on n = 2 samples. ...................... 96
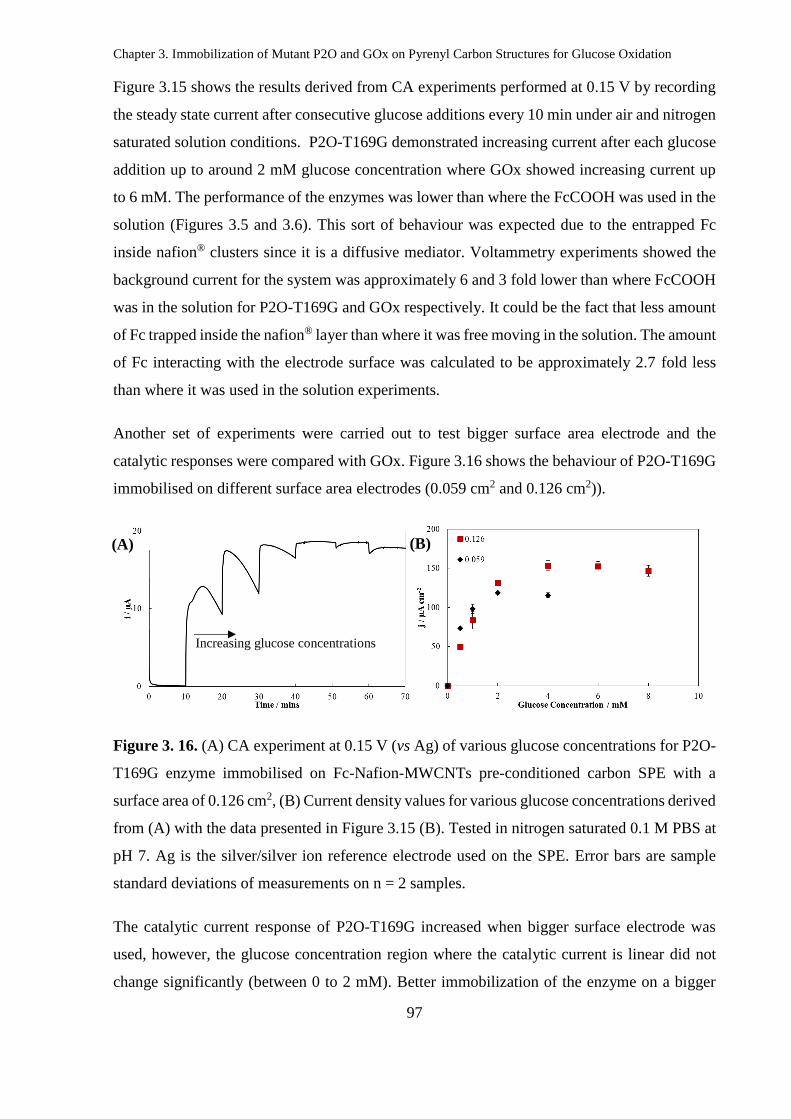
Figure 3. 16. (A) CA experiment at 0.15 V (vs Ag) of various glucose concentrations for P2O-
T169G enzyme immobilised on Fc-Nafion-MWCNTs pre-conditioned carbon SPE with a
surface area of 0.126 cm2, (B) Current density values for various glucose concentrations derived
from (A) with the data presented in Figure 3.15 (B). Tested in nitrogen saturated 0.1 M PBS at
pH 7. Ag is the silver/silver ion reference electrode used on the SPE. Error bars are sample
standard deviations of measurements on n = 2 samples. .......................................................... 97
Figure 3. 17. Comparison of current densities of P2O-T169G with GOx, both immobilised on
Fc-Nafion-MWCNTs pre-conditioned carbon SPE (surface area: 0.126 cm2). Data obtained
from CA experiments at 0.15 V (vs Ag) of various glucose concentrations. Tested in air
saturated 0.1 M PBS at pH 7. Ag is the silver/silver ion reference electrode used on the SPE.
Error bars are sample standard deviations of measurements on n = 2 samples. (Raw data: Figure
3.15 (C) and Figure 3.16 (A) for GOx and P2O-T169G respectively). ................................... 98
Figure 3. 18. Calibration curve for P2O-T169G and GOx enzymes immobilised on Fc-Nafion-
MWCNTs pre-conditioned carbon SPE. Tested in air saturated 0.1 M PBS at pH 7. Data
extracted from Fig 3.17. (SPE surface area: 0.126 cm2) .......................................................... 99
Figure 3. 19. Lineweaver-Burk plot for P2O-T169G and GOx immobilised on Fc-Nafion-
MWCNTs pre-conditioned carbon SPE. Tested in air saturated 0.1 M PBS at pH 7. Data
extracted from Fig 3.15 (B) and (D). (SPE surface area: 0.059 cm2) ..................................... 100
Page 17
xvi
Figure 3. 20. CA experiments at 0.15 V (vs Ag) of various glucose concentrations for P2O-
T169G and GOx enzymes immobilised on Fc-Nafion-MWCNTs pre-conditioned carbon SPE.
Tested in air saturated 0.1 M PBS at pH 7. Ag is the silver/silver ion reference electrode used
on the SPE (SPE surface area: 0.126 cm2). ............................................................................ 100
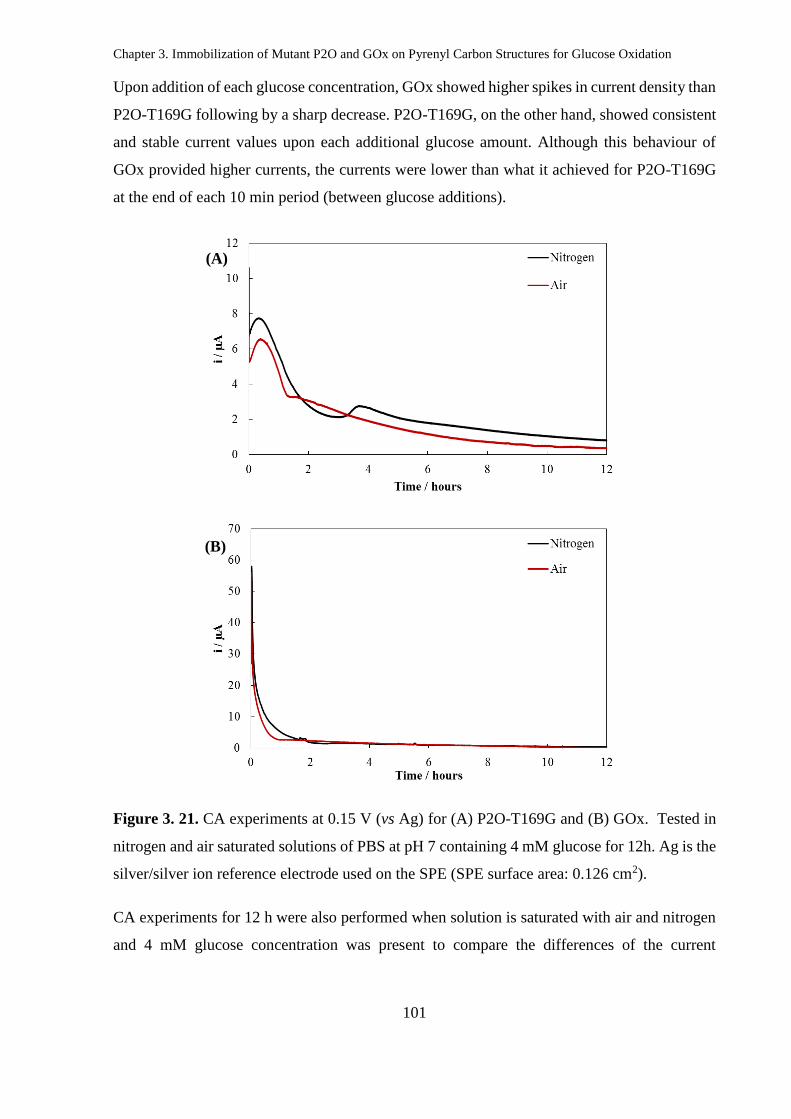
Figure 3. 21. CA experiments at 0.15 V (vs Ag) for (A) P2O-T169G and (B) GOx. Tested in
nitrogen and air saturated solutions of PBS at pH 7 containing 4 mM glucose for 12h. Ag is the
silver/silver ion reference electrode used on the SPE (SPE surface area: 0.126 cm2). .......... 101
Figure 3. 22. CA experiments at 0.15 V (vs Ag) for P2O-T169G and GOx. Tested in air
saturated solutions of PBS at pH 7 containing 4 mM glucose for 12 h. Ag is the silver/silver ion
reference electrode used on the SPE (SPE surface area: 0.126 cm2). .................................... 102
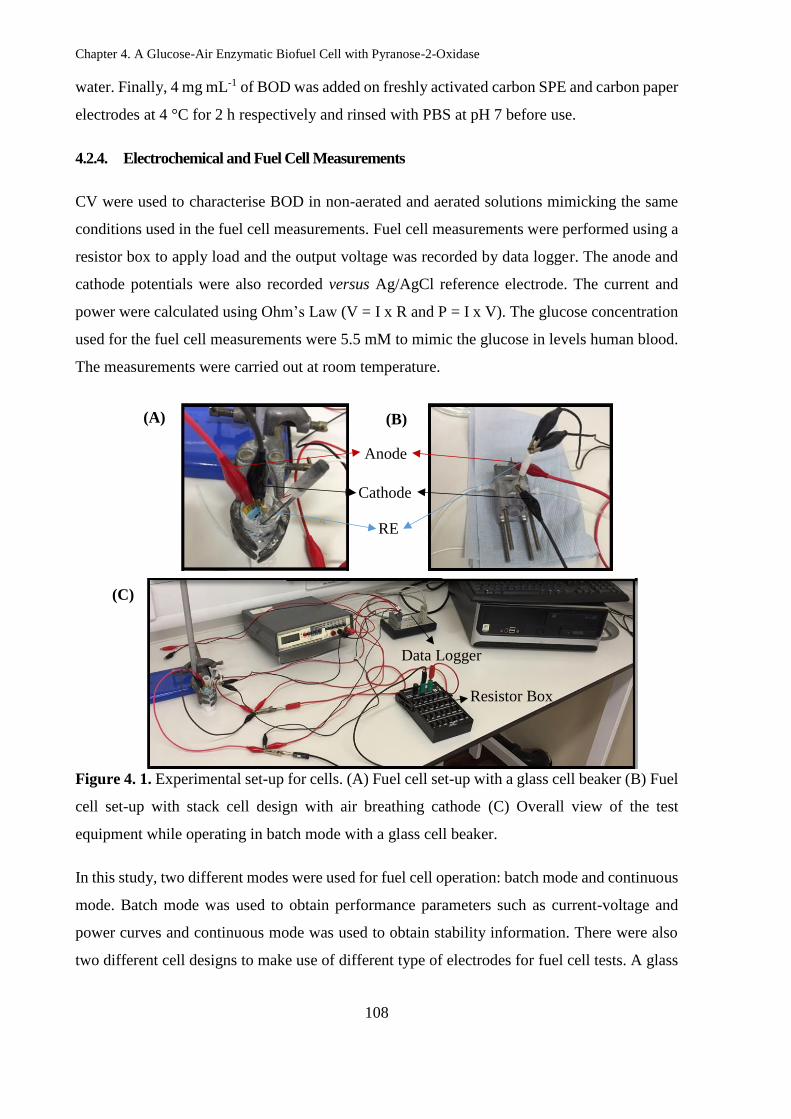
Figure 4. 1. Experimental set-up for cells. (A) Fuel cell set-up with a glass cell beaker (B) Fuel
cell set-up with stack cell design with air breathing cathode (C) Overall view of the test
equipment while operating in batch mode with a glass cell beaker. ...................................... 108
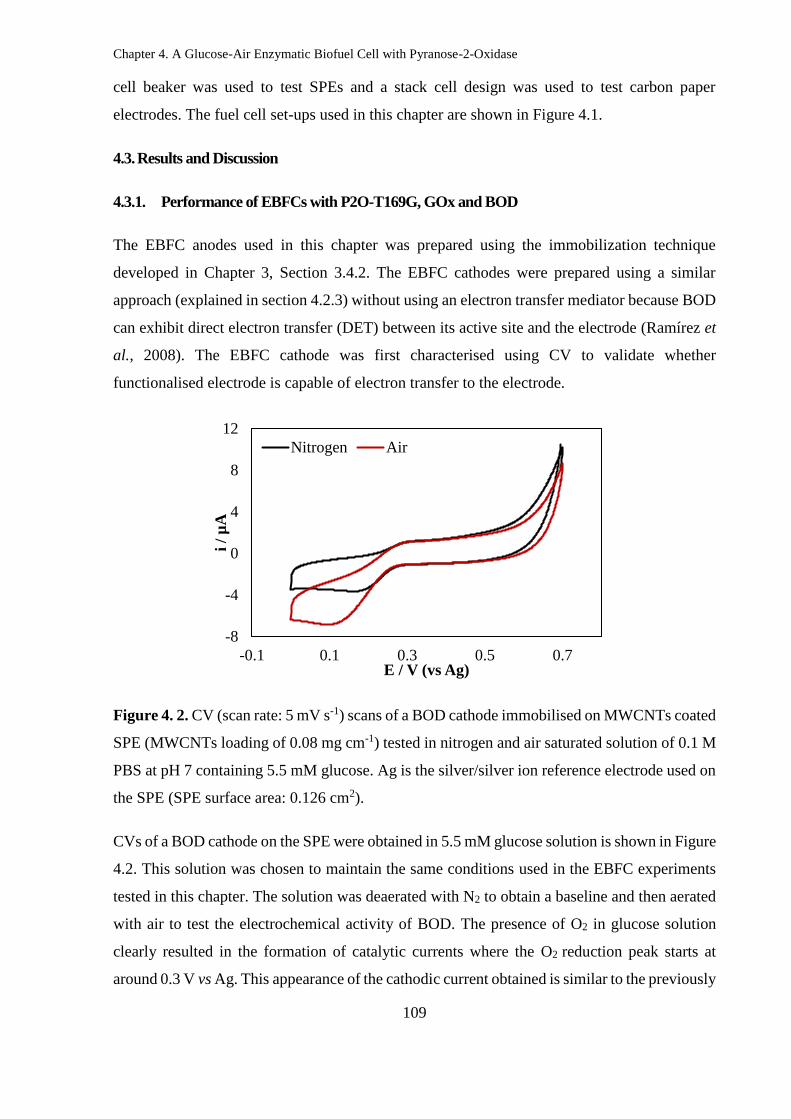
Figure 4. 2. CV (scan rate: 5 mV s-1) scans of a BOD cathode immobilised on MWCNTs coated
SPE (MWCNTs loading of 0.08 mg cm-1) tested in nitrogen and air saturated solution of 0.1 M
PBS at pH 7 containing 5.5 mM glucose. Ag is the silver/silver ion reference electrode used on
the SPE (SPE surface area: 0.126 cm2). ................................................................................. 109
Figure 4. 3. (A) Cell voltage-current and (B) fuel cell polarization curves operating in non-
aerated and aerated glucose concentrations. All enzymes used to construct EBFCs were at 4 mg
mL-1 concentration and were immobilised on SPE (surface area: 0.126 cm2). EBFCs were tested
at batch mode using a glass cell in non-aerated and aerated glucose concentrations of 5.5 mM
in 0.1 M PBS at pH 7. ............................................................................................................ 111
Figure 4. 4. Non-aerated and aerated anode (left) and cathode (right) potentials versus current
curves obtained from EBFC tests. All enzymes used to construct EBFCs were at 4 mg mL-1
concentration and were immobilised on SPE (surface area: 0.126 cm2). EBFCs were tested at
batch mode using a glass cell in non-aerated and aerated solutions of 0.1 M PBS at pH 7
containing 5.5 mM glucose. ................................................................................................... 113
Page 18
xvii
Figure 4. 5. (A) Cell voltage-current and (B) fuel cell polarization curves for P2O-T169G and
GOx as EBFC anodes combined with BOD cathode. All enzymes used to construct EBFCs
were at 4 mg mL-1 concentration and were immobilised on SPE (surface area: 0.126 cm2).
EBFCs were tested at batch mode using a glass cell in aerated solutions of 0.1 M PBS at pH 7
containing 5.5 mM glucose. Error bars are sample standard deviations of measurements on n =
2 samples of each EBFC. ........................................................................................................ 116
Figure 4. 6. Voltage-current curves of anode (dashed line)-cathode (straight line) potentials for
P2O-T169G and GOx as EBFC anodes combined with BOD cathode. All enzymes used to
construct EBFC were at 4 mg mL-1 concentration and were immobilised on SPE (surface area:
0.126 cm2). EBFCs were tested at batch mode using a glass cell in aerated solutions of 0.1 M
PBS at pH 7 containing 5.5 mM glucose. Error bars are sample standard deviations of
measurements on n = 2 samples of each EBFC. .................................................................... 117
Figure 4. 7. Cell voltage-current and fuel cell polarization curves showing the performance of
P2O-T169G anode and BOD cathode. Enzymes concentrations of 10 mg mL-1 and 4 mg mL-1
were used for anode and cathode respectively and were both immobilised on carbon paper
electrodes (surface area: 1.77 cm2). EBFCs were tested at batch mode using stack cell design
in aerated solutions of 0.1 M PBS at pH 7 containing 5.5 mM glucose. Error bars are sample
standard deviations of measurements on n = 2 samples of each EBFC. ................................ 119
Figure 4. 8. Voltage-current curves of anode and cathode potentials for P2O-T169G and BOD
resoectively. Enzymes concentrations of 10 mg mL-1 and 4 mg mL-1 were used for anode and
cathode respectively and were both immobilised on carbon paper electrodes (surface area: 1.77
cm2). EBFCs were tested at batch mode using stack cell design in aerated solutions of 0.1 M
PBS at pH 7 containing 5.5 mM glucose. Error bars are sample standard deviations of
measurements on n = 2 samples of each EBFC. .................................................................... 120
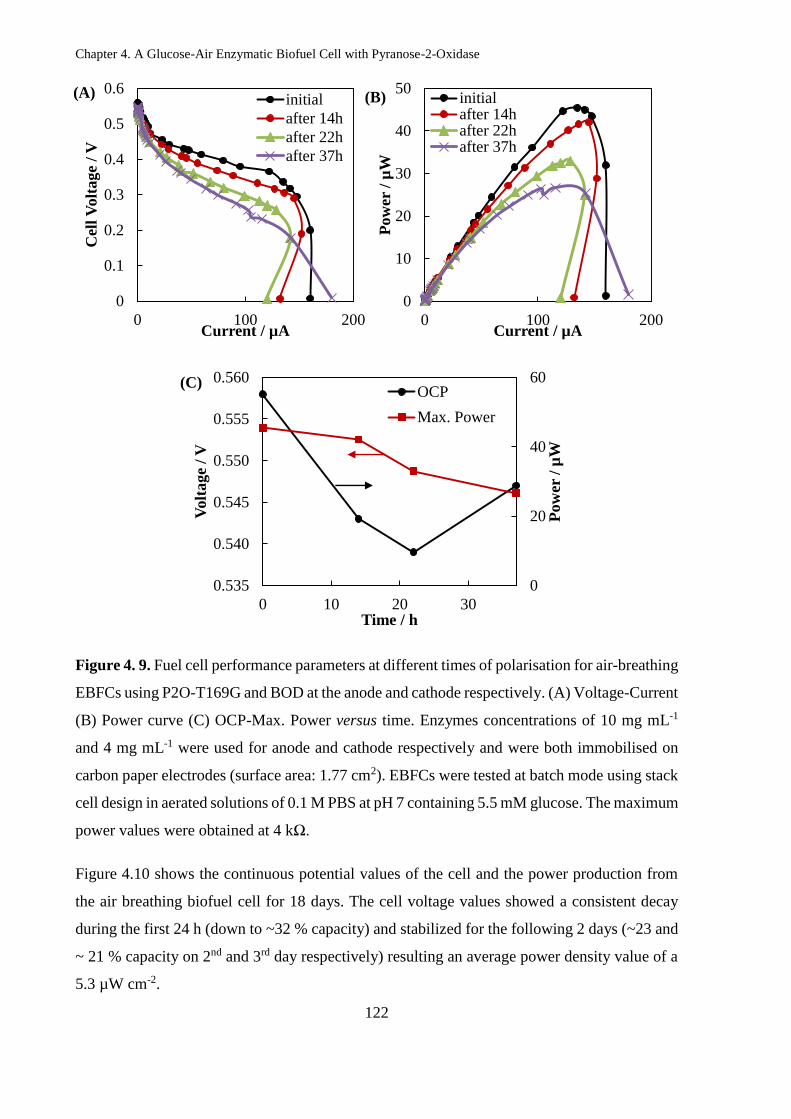
Figure 4. 9. Fuel cell performance parameters at different times of polarisation for air-breathing
EBFCs using P2O-T169G and BOD at the anode and cathode respectively. (A) Voltage-Current
(B) Power curve (C) OCP-Max. Power versus time. Enzymes concentrations of 10 mg mL-1
and 4 mg mL-1 were used for anode and cathode respectively and were both immobilised on
carbon paper electrodes (surface area: 1.77 cm2). EBFCs were tested at batch mode using stack
cell design in aerated solutions of 0.1 M PBS at pH 7 containing 5.5 mM glucose.The maximum
power values were obtained at 4 kΩ. ..................................................................................... 122
Page 19
xviii
Figure 4. 10. (A) Cell voltage, anode and cathode potentials and (B) Percentage power density
change of the EBFC over time during continuous operation of 18 days. P2O-T169G (10 mg
mL-1) and BOD (4 mg mL-1) were used at the anode and cathode respectively and were both
immobilised on carbon paper electrodes (surface area: 1.77 cm2). EBFCs were tested at
continuous mode using stack cell design with a flow rate of 0.3 mL min-1 in aerated solutions
of 0.1 M PBS at pH 7 containing 5.5 mM glucose. ............................................................... 123
Figure 5. 1. Structure of PDH from Agaricus meleagris (Tan et al., 2013) ......................... 129
Figure 5. 2. Schematic for oxygen reduction by laccase using graphene-multi-walled carbon
nanotubes assembly (Lalaoui et al., 2015) ............................................................................. 130
Figure 5. 3. CVs of BOD immobilised on (A) rGO (inset: SEM image, 4 µm magnification)
and (B) rGO+MWCNTs (inset: SEM image, 4 µm magnification) modified electrodes, tested
in air and/or nitrogen saturated PBS at pH 7, 5 mV s-1 scan rate ........................................... 131
Figure 5. 4. (A) Scheme of Y-shaped glucose/O2 microfluidic biofuel cell (B) PDMS-glass
device. .................................................................................................................................... 132
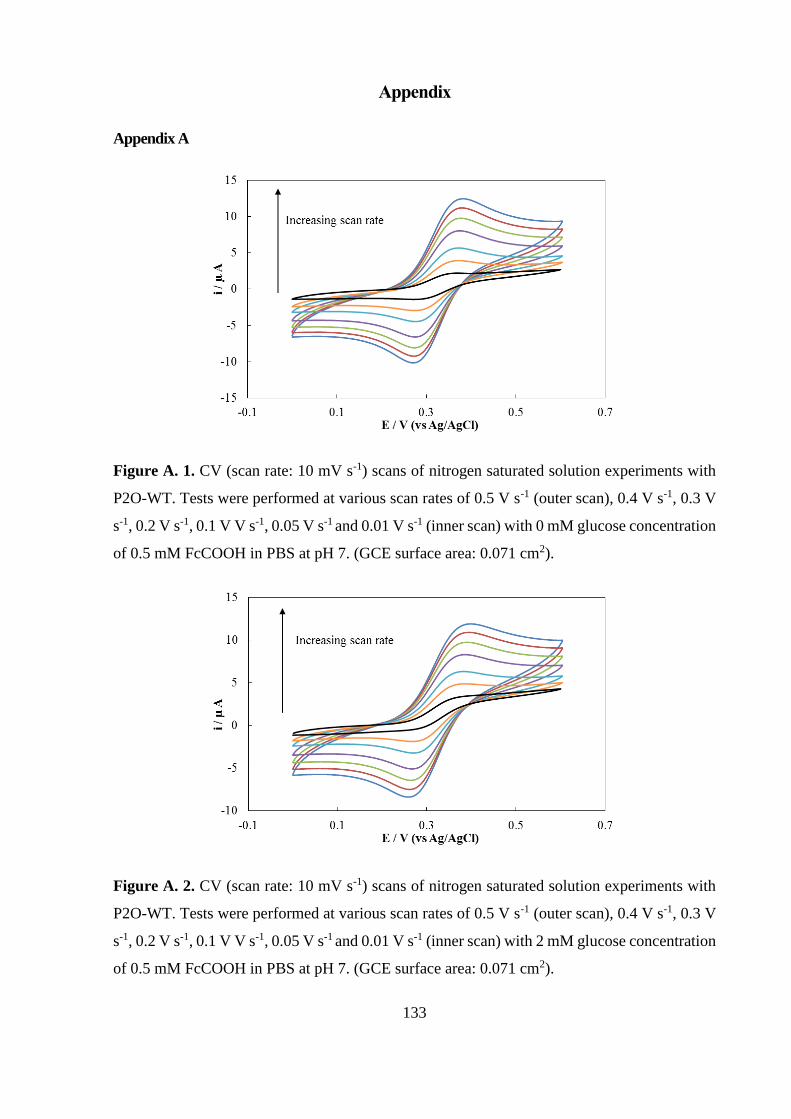
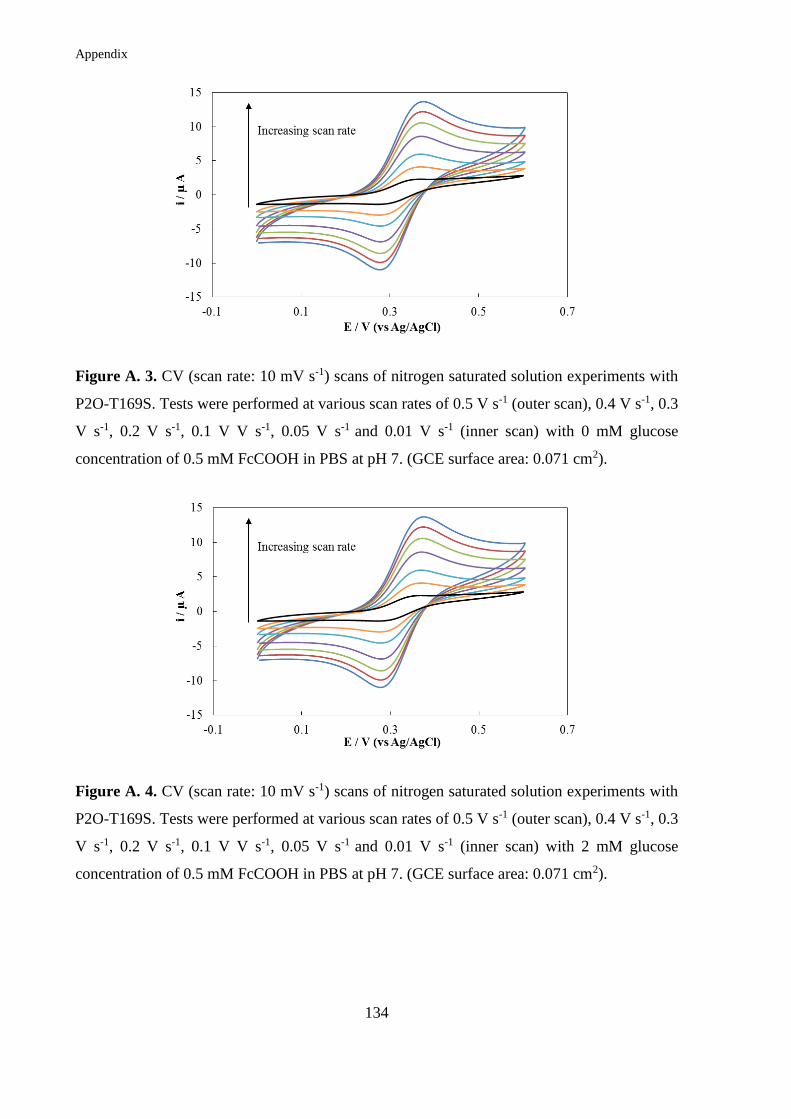
Figure A. 1. CV (scan rate: 10 mV s-1) scans of nitrogen saturated solution experiments with
P2O-WT. Tests were performed at various scan rates of 0.5 V s-1 (outer scan), 0.4 V s-1, 0.3 V
s-1, 0.2 V s-1, 0.1 V V s-1, 0.05 V s-1 and 0.01 V s-1 (inner scan) with 0 mM glucose concentration
of 0.5 mM FcCOOH in PBS at pH 7. (GCE surface area: 0.071 cm2). ................................. 133
Figure A. 2. CV (scan rate: 10 mV s-1) scans of nitrogen saturated solution experiments with
P2O-WT. Tests were performed at various scan rates of 0.5 V s-1 (outer scan), 0.4 V s-1, 0.3 V
s-1, 0.2 V s-1, 0.1 V V s-1, 0.05 V s-1 and 0.01 V s-1 (inner scan) with 2 mM glucose concentration
of 0.5 mM FcCOOH in PBS at pH 7. (GCE surface area: 0.071 cm2). ................................. 133
Figure A. 3. CV (scan rate: 10 mV s-1) scans of nitrogen saturated solution experiments with
P2O-T169S. Tests were performed at various scan rates of 0.5 V s-1 (outer scan), 0.4 V s-1, 0.3
V s-1, 0.2 V s-1, 0.1 V V s-1, 0.05 V s-1 and 0.01 V s-1 (inner scan) with 0 mM glucose
concentration of 0.5 mM FcCOOH in PBS at pH 7. (GCE surface area: 0.071 cm2). .......... 134
Page 20
xix
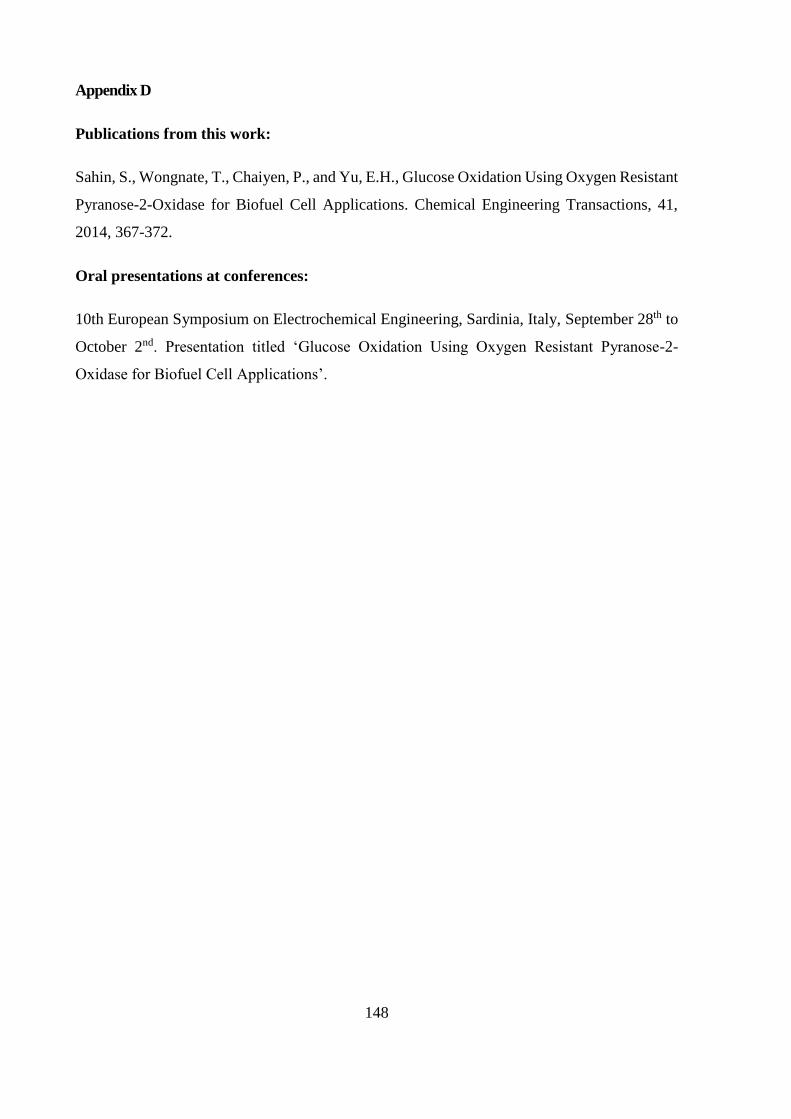
Figure A. 4. CV (scan rate: 10 mV s-1) scans of nitrogen saturated solution experiments with
P2O-T169S. Tests were performed at various scan rates of 0.5 V s-1 (outer scan), 0.4 V s-1, 0.3
V s-1, 0.2 V s-1, 0.1 V V s-1, 0.05 V s-1 and 0.01 V s-1 (inner scan) with 2 mM glucose
concentration of 0.5 mM FcCOOH in PBS at pH 7. (GCE surface area: 0.071 cm2). ........... 134
Figure A. 5. CV (scan rate: 10 mV s-1) scans of nitrogen saturated solution experiments with
P2O-T169G. Tests were performed at various scan rates of 0.5 V s-1 (outer scan), 0.4 V s-1, 0.3
V s-1, 0.2 V s-1, 0.1 V V s-1, 0.05 V s-1 and 0.01 V s-1 (inner scan) with 0 mM glucose
concentration of 0.5 mM FcCOOH in PBS at pH 7. (GCE surface area: 0.071 cm2). ........... 135
Figure A. 6. CV (scan rate: 10 mV s-1) scans of nitrogen saturated solution experiments with
P2O-T169G. Tests were performed at various scan rates of 0.5 V s-1 (outer scan), 0.4 V s-1, 0.3
V s-1, 0.2 V s-1, 0.1 V V s-1, 0.05 V s-1 and 0.01 V s-1 (inner scan) with 2 mM glucose
concentration of 0.5 mM FcCOOH in PBS at pH 7. (GCE surface area: 0.071 cm2). ........... 135
Figure A. 7. Raw data for the LSV (scan rate: 1 mV s-1) scans of nitrogen saturated solutions
with 2 mM concentrations of glucose added to the solution containing 0.5 mM FcCOOH and 1
mg mL-1 concentrations of P2O-WT, P2O-T169S and P2O-T169G at pH 7. (GCE surface area:
0.071 cm2) ............................................................................................................................... 136
Figure A. 8. LSV (scan rate: 1 mV s-1) scans of P2O-WT (1 mg mL-1 in PBS) in nitrogen and
air saturated solutions with 1 mM concentrations of glucose added to the solution containing
0.5 mM FcCOOH in PBS at pH 7. (GCE surface area: 0.071 cm2). ...................................... 136
Figure A. 9. LSV (scan rate: 1 mV s-1) scans of nitrogen saturated solutions with various
glucose concentrations added to the solution containing 0.5 mM FcCOOH and 1 mg mL-1 GOx
in PBS at pH 7. (GCE surface area: 0.071 cm2). .................................................................... 137
Figure A. 10. CV (scan rate: 10 mV s-1) scans of nitrogen saturated solution experiments with
GOx. Tests were performed at various scan rates of 0.5 V s-1 (outer scan), 0.4 V s-1, 0.3 V s-1,
0.2 V s-1, 0.1 V V s-1, 0.05 V s-1 and 0.01 V s-1 (inner scan) with 0 mM glucose concentration
of 0.5 mM FcCOOH in PBS at pH 7. (GCE surface area: 0.071 cm2). .................................. 137
Figure A. 11. CV (scan rate: 10 mV s-1) scans of nitrogen saturated solution experiments with
GOx. Tests were performed at various scan rates of 0.5 V s-1 (outer scan), 0.4 V s-1, 0.3 V s-1,
Page 21
xx
0.2 V s-1, 0.1 V V s-1, 0.05 V s-1 and 0.01 V s-1 (inner scan) with 2 mM glucose concentration
of 0.5 mM FcCOOH in PBS at pH 7. (GCE surface area: 0.071 cm2). ................................. 138
Figure A. 12. CAs (1 h length) of air saturated solutions for P2O-T169G (1 mg mL-1) at 0.350
V for 0 mM and 4 mM concentrations of glucose added to the solution containing 0.5 mM
FcCOOH, at pH 7. (GCE, surface area: 0.071 cm2). ............................................................. 138
Figure A. 13. CAs (1 h length) of air saturated solutions for GOx (1 mg mL-1) at 0.350 V for 0
mM and 4 mM concentrations of glucose added to the solution containing 0.5 mM FcCOOH,
at pH 7. (GCE, surface area: 0.071 cm2). ............................................................................... 139
Figure A. 14. CAs (3 h length) of air saturated solutions for P2O-T169G (1 mg mL-1) at 0.350
V for 4 mM concentration of glucose added to the solution containing 0.5 mM FcCOOH, at pH
7. (GCE, surface area: 0.071 cm2). ........................................................................................ 139
Figure A. 15. CAs (3 h length) of air saturated solutions for GOx (1 mg mL-1) at 0.350 V for 4
mM concentration of glucose added to the solution containing 0.5 mM FcCOOH, at pH 7.
(GCE, surface area: 0.071 cm2). ............................................................................................ 140
Figure B. 1. CV (scan rate: 5 mV s-1) scans of carbon SPE to show reproducibility of the
electrode. Tested in 0.1 M PBS at pH 7. Ag is the silver/silver ion reference electrode used on
the SPE (SPE surface area: 0.126 cm2). Error bars are sample standard deviations of
measurements on n = 4 samples. ............................................................................................ 141
Figure B. 2. CV (scan rate: 5 mV s-1) scans of carbon SPEs to show its activity towards glucose.
Tested in 0.1 M PBS at pH 7 containing 0 mM and 5.5 mM glucose. Ag is the silver/silver ion
reference electrode used on the SPE (SPE surface area: 0.126 cm2). Graphs shown are mean
values based on n = 2 samples. .............................................................................................. 141
Figure B. 3. CV (scan rate: 5 mV s-1) scans of carbon SPEs modified with Fc-Nafion-MWCNTs
and then treated with PBSE to show its activity towards glucose. Tested in 0.1 M PBS at pH 7
containing 0 mM and 5.5 mM glucose. Ag is the silver/silver ion reference electrode used on
the SPE (SPE surface area: 0.126 cm2). Graphs shown are mean values based on n = 2 samples.
................................................................................................................................................ 142
Page 22
xxi
Figure B. 4. CV (scan rate: 5 mV s-1) scans of GOx adsorbed on carbon SPEs to show its
activity towards glucose. Tested in 0.1 M PBS at pH 7 containing 0 mM and 2 mM glucose.
Ag is the silver/silver ion reference electrode used on the SPE (SPE surface area: 0.126 cm2).
................................................................................................................................................ 142
Figure B. 5. LSV (scan rate: 1 mV s-1) scans of P2O-T169G immobilised on carbon SPE.
Tested in nitrogen saturated solutions with various glucose concentrations added to the solution
containing 0.5 mM FcCOOH in 0.1 M PBS at pH 7. Ag is the silver/silver ion reference
electrode used on the SPE (SPE surface area: 0.126 cm2). .................................................... 143
Figure B. 6. CV (scan rate: 5 mV s-1) scans of GOx immobilised on carbon SPE. Tested in
nitrogen saturated solutions with various glucose concentrations added to the solution
containing 0.5 mM FcCOOH in 0.1 M PBS at pH 7. Ag is the silver/silver ion reference
electrode used on the SPE (SPE surface area: 0.126 cm2). .................................................... 143
Figure B. 7. LSV (scan rate: 1 mV s-1) scans of GOx immobilised on carbon SPE. Tested in
nitrogen saturated solutions with various glucose concentrations added to the solution
containing 0.5 mM FcCOOH in 0.1 M PBS at pH 7. Ag is the silver/silver ion reference
electrode used on the SPE (SPE surface area: 0.126 cm2). .................................................... 144
Figure B. 8. CV (scan rate: 5 mV s-1) scans of P2O-T169G immobilised on carbon SPE. Tested
in nitrogen saturated solutions with various glucose concentrations added to the solution
containing 0.5 mM FcCOOH in 0.1 M PBS at pH 7. Ag is the silver/silver ion reference
electrode used on the SPE (SPE surface area: 0.126 cm2). .................................................... 144
Figure B. 9. CV (scan rate: 50 mV s-1) scans for the pre-conditioning of the carbon SPEs
modified with Fc-Nafion. Tested in 0.1 M PBS at pH 7. Fc-Nafion loading is 0.06 mg cm-2. Ag
is the silver/silver ion reference electrode used on the SPE (SPE surface area: 0.126 cm2). . 145
Figure C. 1. CV (scan rate: 5 mV s-1) scans of MWCNTs modified carbon SPE (MWCNTs
loading of 0.08 mg cm-1) to show its inactivity towards oxygen present. Tested in nitrogen and
air saturated solutions containing 0.1 M PBS at pH 7. Ag is the silver/silver ion reference
electrode used on the SPE (SPE surface area: 0.126 cm2). .................................................... 146
Page 23
xxii
Figure C. 2. Log-log plot of non-aerated and aerated anode-cathode potentials versus current
curves obtained from enzymatic biofuel cell tests ................................................................. 146
Figure C. 3. Stability of the air-breathing biofuel cell under batch operation ...................... 147
Page 24
xxiii
List of Tables
Table 1. 1. Enzymes used in EBFCs using glucose as fuel (Half-Cell Reaction: glucose →
glucono-1,5-lactone + 2H+ + 2e− ). ........................................................................................... 10
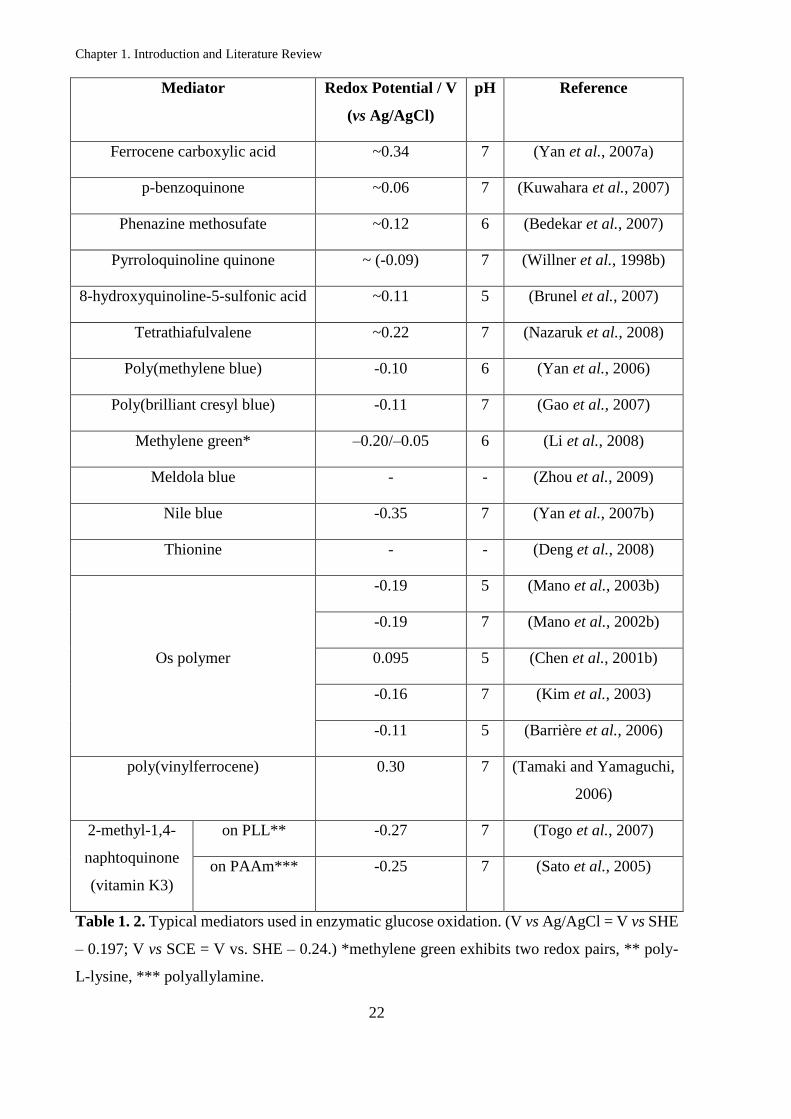
Table 1. 2. Typical mediators used in enzymatic glucose oxidation. (V vs Ag/AgCl = V vs SHE
– 0.197; V vs SCE = V vs. SHE – 0.24.) *methylene green exhibits two redox pairs, ** poly-
L-lysine, *** polyallylamine. ................................................................................................... 22
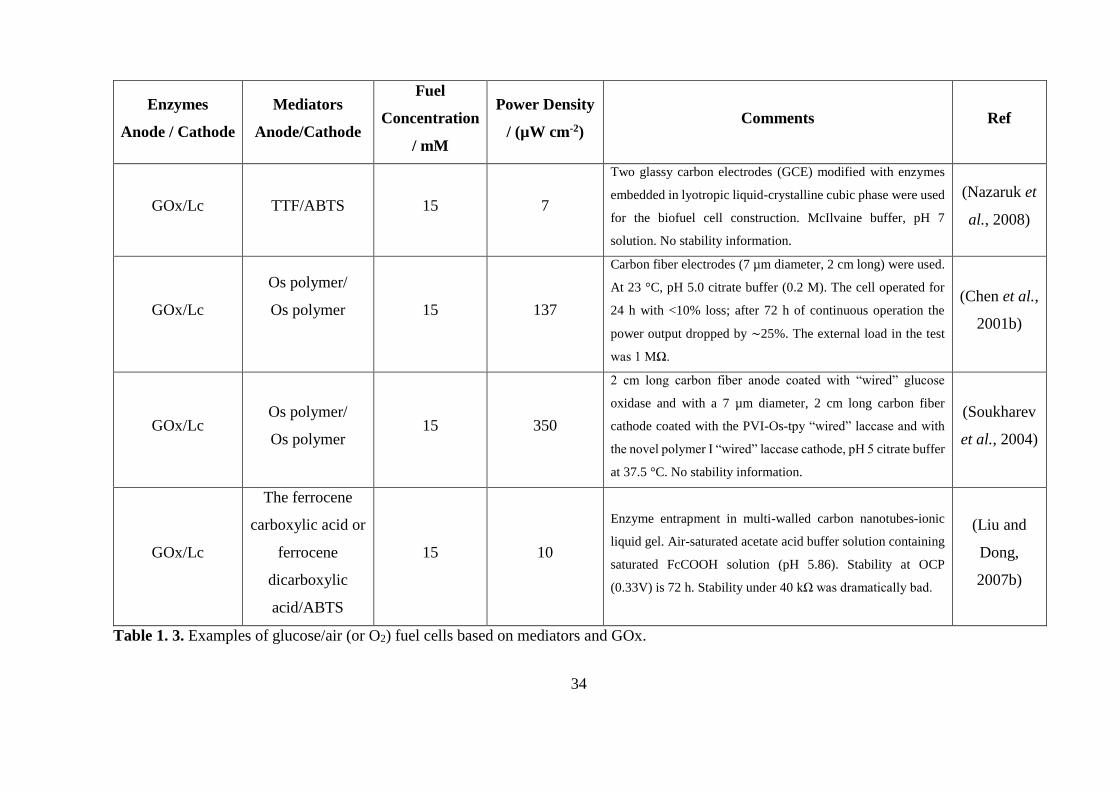
Table 1. 3. Examples of glucose/air (or O2) fuel cells based on mediators and GOx. ............. 34
Table 2. 1. The properties of the pyronase-2-oxidase enzymes used in solution experiments
(Wongnate et al., 2011))(Kujawa et al., 2006; Pitsawong et al., 2010). .................................. 51
Table 2. 2. The electrochemical behaviour of the P2O enzymes used in solution CV
experiments. Tested in nitrogen saturated solutions containing 0.5 mM FcCOOH and 1 mg mL-
1 concentrations of P2O-WT, P2O-T169S and P2O-T169G at pH 7. (GCE surface area: 0.071
cm2, Epa: anodic peak potential, Epc: cathodic peak potential). ................................................ 63
Table 2. 3. Calculated diffusion coefficients for P2O enzymes using Randles-Sevcik equation
at different glucose concentrations. .......................................................................................... 64
Table 2. 4. Summary of Km values for the enzymes used ....................................................... 67
Table 3. 1. Summary of the electrochemical characteristics of P2O-T169G and GOx enzymes
immobilised on carbon SPE. Tested in nitrogen saturated solutions with 0 mM and 4 mM
concentrations of glucose added to the solution containing 0.5 mM FcCOOH in 0.1 M PBS at
pH 7. (SPE surface area: 0.126 cm2). ....................................................................................... 83
Table 3. 2. The saturation currents and glucose concentrations of P2O-T169G and GOx
immobilised on carbon SPE from CA experiments at 0.2 V (vs Ag). All means and sample
standard deviations from replicate measurements on n = 2 samples (SPE surface area: 0.126
cm2). .......................................................................................................................................... 86
Page 25
xxiv
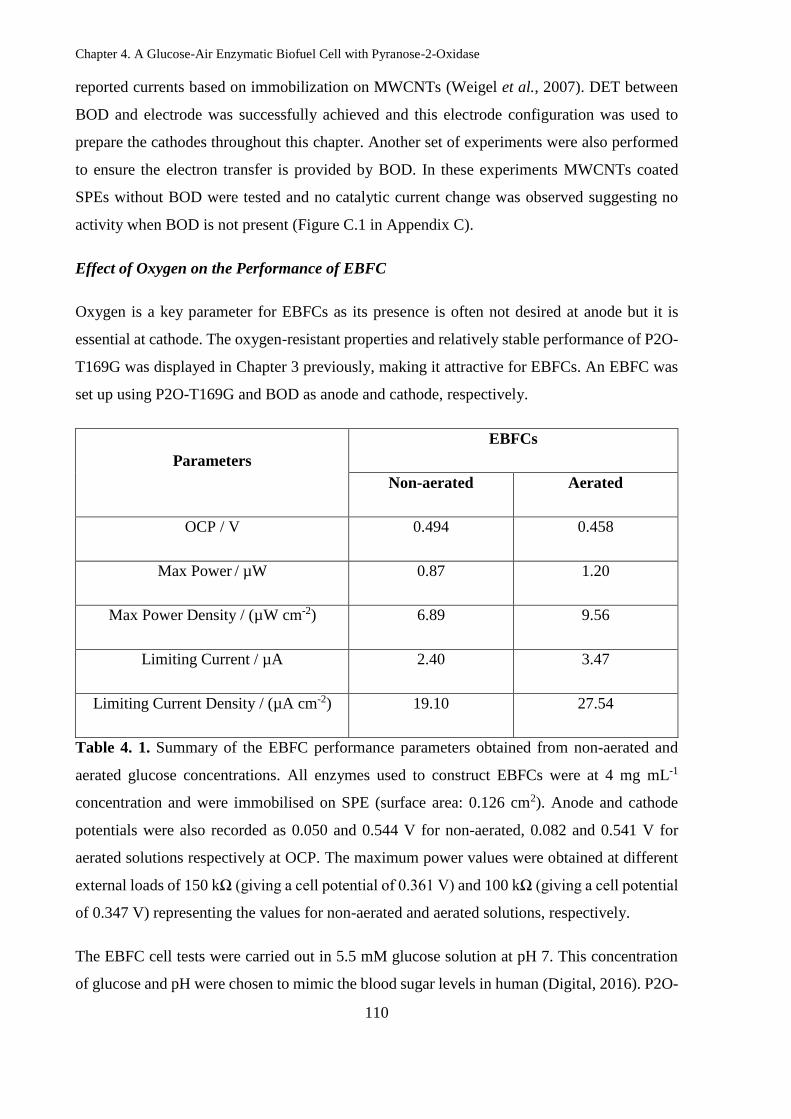
Table 4. 1. Summary of the EBFC performance parameters obtained from non-aerated and
aerated glucose concentrations. All enzymes used to construct EBFCs were at 4 mg mL-1
concentration and were immobilised on SPE (surface area: 0.126 cm2). Anode and cathode
potentials were also recorded as 0.050 and 0.544 V for non-aerated, 0.082 and 0.541 V for
aerated solutions respectively at OCP. The maximum power values were obtained at different
external loads of 150 kΩ (giving a cell potential of 0.361 V) and 100 kΩ (giving a cell potential
of 0.347 V) representing the values for non-aerated and aerated solutions, respectively. ..... 110
Table 4. 2. Summary of the enzymatic biofuel cell performance results comparing P2O-T169G
and GOx obtained from aerated system test. All enzymes used to construct EBFCs were at 4
mg mL-1 concentration and were immobilised on SPE (surface area: 0.126 cm2). Anode and
cathode potentials were 0.093±0.015 and 0.534±0.031 V for P2O-T169G (BOD at the cathode)
and 0.072±0.015 and 0.517±0.004 V for GOx (BOD at the cathode) at OCP respectively. The
maximum power values were obtained at 100 kΩ for P2O-T169G and 125 kΩ for GOx. All
means and sample standard deviations from replicate measurements on n = 2 samples of each
EBFC. ..................................................................................................................................... 115
Table 4. 3. Summary of the enzymatic biofuel cell performance results obtained from P2O-
T169G anode and air breathing BOD cathode. Anode and cathode potentials were -0.019±0.035
and 0.524±0.014 V for P2O-T169G and BOD at OCP. The maximum power values were
obtained at 2.5 kΩ. All means and sample standard deviations from replicate measurements on
n = 2 samples of each EBFC. ................................................................................................. 118
Page 26
xxv
Nomenclature
A Area
Ag Silver
AgCl Silver chloride
C Concentration
D Diffusion coefficient
E Potential
F Faraday constant
H2O2 Hydrogen peroxide
i Current
j Current density
Km Michaelis-Menten constant
n Number of electrons
Os Osmium
O2 Oxygen
R Ideal gas constant
SO3 Sulfonate
T Temperature
Page 28
xxvii
Abbreviations
ABTS 2, 2’-azino-bis (3-ethylbenzthiazoline-6-sulfonic acid)
ACOD Acyl-CoA oxidase
ACS Acyl-CoA synthetase
ADH Alcohol dehydrogenase
BOD Bilirubin oxidase
CA Chronoamperometry
CE Counter electrode
CV Cyclic voltammetry
CDH Cellobiose dehydrogenase
CNT Carbon nanotube
COx Cytochrome oxidase
DET Direct electron transfer
EBFC Enzymatic biofuel cell
EDC 1-ethyl-3-(3-dimethylaminopropyl) carbodiimide hydrochloride
FAD Flavin adenine dinucleotide
Fc Ferrocene
FcCOOH Ferrocene carboxylic acid
GDH Glucose dehydrogenase
GOx Glucose oxidase
HQS 8-hydroxyquinoline-5-sulfonic acid
HRP Horseradish peroxidase
LBL Layer by layer
Lc Laccase
Page 29
xxviii
LSV Linear sweep voltammetry
MET Mediated electron transfer
MFC Microbial biofuel cell
MP-11 Microperoxidase-11
MWCNT Multi-walled carbon nanotube
NAD Nicotinamide adenine dinucleotide
NHS N-hydroxysulfosuccinimide
OCP Open circuit potential
PBS Potassium phosphate buffer
PBSE 1-pyrenebutanoic acid succinimidyl ester
PEGDGE Poly(ethylene glycol) diglycidyl ether
PDH Pyranose dehydrogenase
PTFE Polytetrafluoroethylene
PQQ Pyrroloquinoline quinone
P2O Pyranose-2-oxidase
RE Reference electrode
rGO Reduced graphene oxide
SEM Scanning electron spectroscopy
SHE Standard hydrogen electrode
SPE Screen-printed electrode
SWCNT Single-walled carbon nanotube
WE Working electrode
Page 30
1
Chapter 1. Introduction and Literature Review
Introduction
1.1.1. Overview of Enzymatic Biofuel Cells
The relationship between electricity and biology was first discovered by Galvani in 1780
(Galvani, 1791). It was reported that the muscles of dead frogs’ legs twitched when struck by
an electrical spark (Galvani, 1791). This can be considered one of the first studies in the field
of bioelectricity. The chemical fuel cell concept, on the other hand, has been known for almost
two centuries since Grove first used hydrogen fuel cells in series to produce water and electrical
current by reversing the action of the electrolysis (Grove, 1839). However, the connection
between biology and electricity was not demonstrated in a fuel cell until the early 20th century
and later expanded with the development of the microbial fuel cells (MFCs) (Cohen, 1931) and
enzymatic biofuel cells (EBFCs) (Davis and Yarbrough, 1962) (Yahiro et al., 1964).
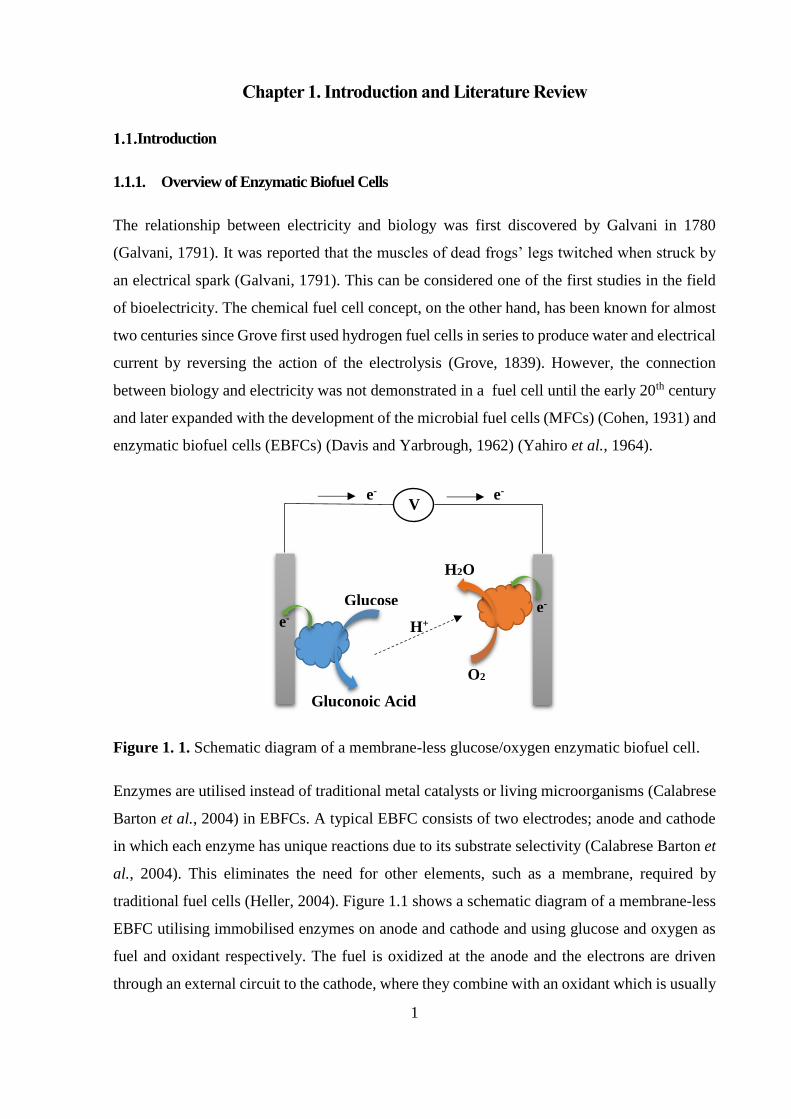
Figure 1. 1. Schematic diagram of a membrane-less glucose/oxygen enzymatic biofuel cell.
Enzymes are utilised instead of traditional metal catalysts or living microorganisms (Calabrese
Barton et al., 2004) in EBFCs. A typical EBFC consists of two electrodes; anode and cathode
in which each enzyme has unique reactions due to its substrate selectivity (Calabrese Barton et
al., 2004). This eliminates the need for other elements, such as a membrane, required by
traditional fuel cells (Heller, 2004). Figure 1.1 shows a schematic diagram of a membrane-less
EBFC utilising immobilised enzymes on anode and cathode and using glucose and oxygen as
fuel and oxidant respectively. The fuel is oxidized at the anode and the electrons are driven
through an external circuit to the cathode, where they combine with an oxidant which is usually
Glucose
Gluconoic Acid
O2
H2O
H+ e- e-
e- e-
V
Page 31
Chapter 1. Introduction and Literature Review
2
oxygen (Ivanov et al., 2010). The chosen electrode material should be conductive and inert
within the potential range of the cell, the most commonly used ones being carbon and its
allotropes or gold (Zhang et al., 2004b; Wang et al., 2009a).
EBFCs can be classified into two types based on their functions (Hao Yu and Scott, 2010). If
the enzyme takes part in the production of the fuel substrate for the fuel cell via bio-reaction
process, it is called product type (Hao Yu and Scott, 2010). Hydrogen production from glucose
for traditional hydrogen-oxygen fuel cell can be an example of this type of EBFCs (Woodward
et al., 1996; Mertens and Liese, 2004). If the enzyme takes part directly in the bio-reaction for
energy production, it is called direct type (Hao Yu and Scott, 2010). These types of EBFCs are
the most popular fuel cells in recent research studies in which the performance of the fuel cell
mainly depends on the enzyme (Hao Yu and Scott, 2010).
Enzymes are known as excellent catalysts and highly efficient electro-catalysts for biological
reactions (Hao Yu and Scott, 2010). The properties of enzymes such as activity under
physiological temperature and pH, high turnover numbers and utilisation of more complex fuels
can be considered as unique when compared to the conventional low temperature oxidation-
reduction catalysts (Calabrese Barton et al., 2004; Ivanov et al., 2010). EBFCs are not also
dependent on any nutrient or biomass acclimation and can be controlled more easily (Calabrese
Barton et al., 2004). These properties allow this technology to find applications in the area of
implanted devices as a source of electricity e.g. in human or animal tissues or larger cells
implanted in blood vessels (Calabrese Barton et al., 2004). The highly selective nature of the
enzymes is perhaps their most significant attribute since it allows the development of
membrane-less enzymatic biofuel cells (Calabrese Barton et al., 2004). This simplifies the
design and allows for miniaturization of implanted devices (Calabrese Barton et al., 2004).
Enzymes, as catalysts in fuel cells, can perform better than conventional catalysts in many
aspects such as reaction rates, specificity, miniaturization and low over-potentials (Leech et al.,
2012). However, there are still important problems that need to be solved such as: long term
stability of the enzyme electrodes, efficient electron transfer between enzyme and electrode
surfaces and improved enzyme bio-catalytic activity with enhanced power output (Hao Yu and
Scott, 2010).
Page 32
Chapter 1. Introduction and Literature Review
3
Figure 1.2 demonstrates the potential of the biofuel cells to reach required power output ranges.
The credibility gap needs to be overcome for EBFCs to become commercially viable (Bullen
et al., 2006). Some major advancements have been achieved during the last three decades in
the field focusing on the potential problems and their solutions (Bullen et al., 2006).
Figure 1. 2. Illustrating the scale of credibility gap for biofuel cells and biosensors in terms of
approximate power output ranges (Bullen et al., 2006).
These advancements can be listed as increased open circuit potential (OCP) from 0.175 V to
almost 1 V and current densities from the nA scale to mA cm-2 (Rasmussen et al., 2016).
However, further improvements are necessary especially in fuel cell performance and stability
for implantation of micro electronic systems to be viable.
1.1.2. Aims and Objectives
Aim
The aim of this project is to develop an enzymatic biofuel cell that can produce power from
glucose using the pyronase-2-oxidase enzyme (P2O). The investigation will focus on the
electrochemical behaviour of P2O in solution and immobilization on to the electrode as well as
comparison with commercially available glucose oxidase (GOx).
Objectives
It can be possible to fabricate an enzymatic anode and cathode using promising enzymes such
as P2O and bilirubin oxidase (BOD) for biofuel cell applications. An enzymatic biofuel cell
Page 33
Chapter 1. Introduction and Literature Review
4
operating under human physiological conditions can be developed with high power output and
good stability. Such a biological fuel cell could be used as an implantable power device or to
power micro electronic devices. The investigation of these promising enzymes in terms of
oxygen utilisation, performance and stability, the immobilization technique used and choice of
materials for electrode fabrication will be given attention to construct a successful enzymatic
biofuel cell.
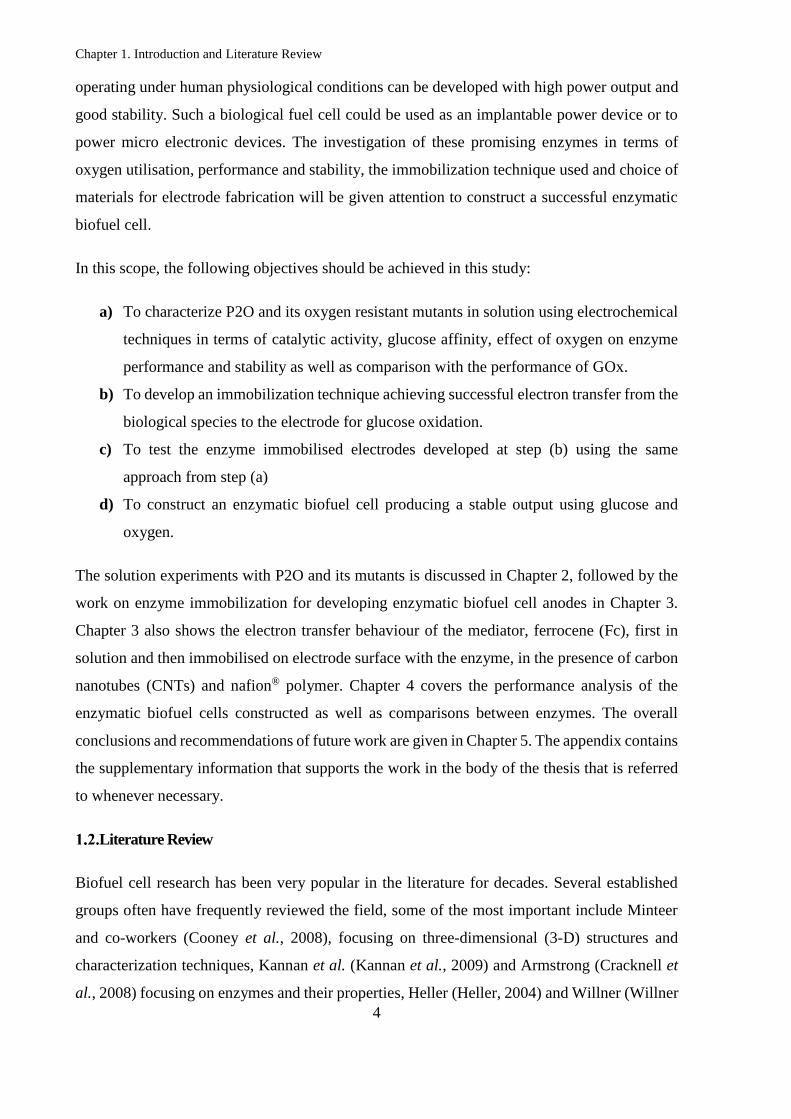
In this scope, the following objectives should be achieved in this study:
a) To characterize P2O and its oxygen resistant mutants in solution using electrochemical
techniques in terms of catalytic activity, glucose affinity, effect of oxygen on enzyme
performance and stability as well as comparison with the performance of GOx.
b) To develop an immobilization technique achieving successful electron transfer from the
biological species to the electrode for glucose oxidation.
c) To test the enzyme immobilised electrodes developed at step (b) using the same
approach from step (a)
d) To construct an enzymatic biofuel cell producing a stable output using glucose and
oxygen.
The solution experiments with P2O and its mutants is discussed in Chapter 2, followed by the
work on enzyme immobilization for developing enzymatic biofuel cell anodes in Chapter 3.
Chapter 3 also shows the electron transfer behaviour of the mediator, ferrocene (Fc), first in
solution and then immobilised on electrode surface with the enzyme, in the presence of carbon
nanotubes (CNTs) and nafion® polymer. Chapter 4 covers the performance analysis of the
enzymatic biofuel cells constructed as well as comparisons between enzymes. The overall
conclusions and recommendations of future work are given in Chapter 5. The appendix contains
the supplementary information that supports the work in the body of the thesis that is referred
to whenever necessary.
Literature Review
Biofuel cell research has been very popular in the literature for decades. Several established
groups often have frequently reviewed the field, some of the most important include Minteer
and co-workers (Cooney et al., 2008), focusing on three-dimensional (3-D) structures and
characterization techniques, Kannan et al. (Kannan et al., 2009) and Armstrong (Cracknell et
al., 2008) focusing on enzymes and their properties, Heller (Heller, 2004) and Willner (Willner
Page 34
Chapter 1. Introduction and Literature Review
5
et al., 2009), focusing on their novel studies in the enzymatic biofuel cell (EBFC) field as well
as some wide reviews by Barton et al. (Calabrese Barton et al., 2004) and Bullen et al. (Bullen
et al., 2006).
There have been an increasing number of papers published per year on EBFCs over the past 6
years obtained from the search results using web of knowledge database with the keyword
“enzymatic biofuel cell”.
Figure 1. 3. EBFC publications between 2010 and 2012 (Source: Web of Knowledge).
Figure 1.3 shows this trend where an increasing interest in the field of EBFC research over the
past 6 years until 2015 where it plateaued and then started to increase in 2016. 1186 papers
were found with 146 of them marked as review papers, 991 of them were articles and rest of
them were other documents types such as meetings, abstracts etc. It is important to note that
approximately 50 % of the papers were published during last three years. On the other hand,
when refined with the key word, “Glucose Oxidase” there are 330 papers out of 1186 (28 %)
and only 11 papers (0.9 %) when refined with the key word “Pyranose Oxidase”. There are 134
(11 %) and 204 (17 %) papers for the key word “Bilirubin Oxidase” and “Laccase” respectively.
Only 58 out of 1186 papers (5 %) could be found by refining “implantable” key word. These
analysis show that a fuel cell design utilising pyranose oxidase with bilirubin oxidase was used
only 3 times during the last 6 years none of which utilised both of them in one fuel configuration
but just in related studies (such as using pyranose dehydrogenase).
Page 35
Chapter 1. Introduction and Literature Review
6
In this chapter of the thesis, the following aspects were reviewed in the context of this study:
Enzymes used in enzymatic biofuel cells, enzymatic electrode assemblies for biofuel cells,
enzymatic biofuel cell configurations and performance and finally the electrochemical
techniques for the investigation of the enzyme electrodes.
1.2.1. Enzymes Used in Enzymatic Biofuel Cells
Enzymes for Anodic Reaction
Among all the enzymes used in enzymatic biofuel cells, GOx (EC 1.1.3.4) is the most widely
used enzyme for glucose oxidation (Ivanov et al., 2010). GOx is a dimeric flavoprotein
catalysing the oxidation of β-d-glucose by oxygen (O2) to d-gluconolactone which is further
oxidized to gluconic acid and hydrogen peroxide (H2O2) (Figure 1.4) (Hecht et al., 1993a).
Figure 1. 4. The reaction catalyzed by GOx.
GOx has two identical subunits with a mean total molecular mass of 150 - 180 kDa, an average
diameter of 8 nm and isoelectric point of about 4.2 (Wilson and Turner, 1992). Figure 1.5 shows
the structure of the GOx enzyme indicating two flavin adenine dinucleotide (FAD) units as
cofactors located in each apoenzyme (Yahiro et al., 1964). This co-factor, FAD, is responsible
for the catalytic function of GOx, in the glucose oxidation reaction (Ivanov et al., 2010) where
it is reduced to FADH2 at -0.05 V vs standard hydrogen electrode (SHE) (~ -0.25 V vs
silver/silver chloride (Ag/AgCl)) (Degani and Heller, 1988).
GOx has a rigid structure and the FAD centres are located deeper than 8 Å from the surface of
the molecule that makes the direct electron transfer to the electrode difficult. (Hecht et al.,
1993b). Thus, mediators are necessary to shuttle the electrons between the enzyme and the
electrodes. The natural electron acceptor for GOx is O2 where H2O2 is produced as a result of
the reaction (Ivanov et al., 2010). This, however, is one of the most important drawbacks of
Page 36
Chapter 1. Introduction and Literature Review
7
using GOx in enzymatic biofuel cells as the generation of the H2O2 should be avoided due to
its highly oxidative nature.
Figure 1. 5. Structure of the GOx enzyme and FAD units (Goodsell, 2006).
In systems where an electron transfer mediator is needed, the natural electron acceptor O2 would
compete with the mediator resulting decreased anodic current density (Ivanov et al., 2010). The
optimum pH of GOx for glucose oxidation reaction is 5.5 when O2 is utilised as electron
acceptor. Below pH 2 and above pH 8, the catalytic activity of the enzyme is rapidly lost
(Wilson and Turner, 1992).
GOx is a very popular choice of enzyme in the field of glucose biosensors and enzymatic biofuel
cells due to its inexpensive, stable and practical use. However, many other enzymes have been
recently utilised in biofuel cell applications. For example, glucose dehydrogenase (EC 1.1.1.47,
GDH), has a big advantage since its natural electron acceptor is not oxygen; however it needs
a soluble co-factor called nicotinamide adenine dinucleotide (NAD) (Ivanov et al., 2010).
Glucose dehydrogenase (Pyrroloquinoline quinone (PQQ)-dependent) GDH (EC 1.1.5.2)
(Tsujimura et al., 2002; Wu et al., 2009; Güven et al., 2016) is also another enzyme from
dehydrogenase family that has been used in enzymatic biofuel cells for glucose oxidation.
Cellobiose dehydrogenase (EC 1.1.99.18, CDH), is another promising enzyme whose natural
substrate is cellobiose but it can also oxidize different monosaccharides including glucose
(Tasca et al., 2008).
In the recent years, there has been some interest in using P2O enzyme (pyranose:oxygen 2-
oxidoreduc-tase, EC 1.1.3.10) instead of GOx especially in the field of biosensors and there are
only few studies in the field of enzymatic biofuel cells (mostly preliminary). P2O is a wood
Page 37
Chapter 1. Introduction and Literature Review
8
degrading enzyme which can oxidase glucose as well as variety of other sugar substrates by
utilising alternative electron acceptors (Leitner et al., 2001). It can oxidize sugars such as 2-
deoxy-ᴅ-glucose, 2-keto-ᴅ-glucose and methyl β-ᴅ-glucosides using the Ping Pong Bi Bi
mechanism similarly to other oxidoreductases at position C-2 and also at position C-3, (Martin
Hallberg et al., 2004; Wongnate et al., 2011). Figure 1.6 shows the structure of one subunit of
the P2O enzyme.
Figure 1. 6. Structure of the P2O subunit from Trametes multicolor (Martin Hallberg et al.,
2004).
P2O catalyses the same reaction as GOx using the FAD units however with a wider range of
substrate selectivity and ability to be used without showing any anomeric selectivity (Spadiut
et al., 2010). Although GOx has been very popular in the field of enzymatic biofuel cells, one
of its important drawbacks is having a restricted turnover rate for glucose. In aqueous solutions,
only 64% of the glucose is present as the β-form and GOx oxidizes glucose only at the C-1
position which is a limiting factor as it is only one anomeric form of the substrate (Zafar et al.,
2010).
P2O has a homotetrameric structure with a molecular mass of 270 kDa (overall surface area of
81,616 Å2) and an isoelectric point in the range 4.4–4.8 (Kujawa et al., 2006). Each of the four
subunits carries one FAD molecule covalently bound to a histadine group, (Kujawa et al., 2006)
and one active site (Martin Hallberg et al., 2004). The approximate dimensions of each subunit
Page 38
Chapter 1. Introduction and Literature Review
9
molecule are 50 Å x 55 Å x 90 Å which is a peanut shape body consisting of arm and head
sections.
The homotetrameric assembly dimensions are approximately 80 Å x 90 Å x 90 Å. The cross-
section of the two subunits is shown in Figure 1.7. The active site of the P2O enzyme is located
approximately 11 Å to 14 Å below the protein surface (which is slightly more buried than GOx).
To be able to access to any of the four active sites, substrate must enter a void (roughly 15,000
Å3 in volume) through the channels and then diffuse to the active site from the void.
Figure 1. 7. Cross-section view two subunits (marked as A and C) showing the active site and
the channels providing water-accessible structure (Martin Hallberg et al., 2004).
The enzymes used in glucose oxidation for biofuel cell applications are summarized alongside
their co-factors, half-reactions and natural electron acceptors in Table 1.1. The presented
enzymes are the most commonly reported anodic enzymes for enzymatic biofuel cells with the
addition of the promising enzyme P2O.
Each of the anodic enzymes has their own specific limitations regarding their structure, ability
to oxidize sugars in different positions, ability to perform in different conditions such as pH or
in the presence of an electron acceptor. Selecting an enzyme for an enzymatic biofuel cell is
still an important challenge since their initial designs, improvements in technology and
nanotechnology, have led to the development of a variety of mutant enzymes with enhanced
properties which could provide commercially viable alternatives to those currently on the
market.
Page 39
Chapter 1. Introduction and Literature Review
10
Fuel
(Substrate) Enzyme Co-Factor
Natural
Electron
Acceptor
Glucose
Glucose Oxidase (EC 1.1.3.4, GOx) FAD O2
Glucose Dehydrogenase (EC 1.1.1.47, GDH) NAD NAD
PQQ-dependent GDH (EC 1.1.5.2) PQQ quinone
Cellobiose Dehydrogenase (EC 1.1.99.18, CDH), FAD,
heme
Not known
(Baminger
et al., 2001)
Pyranose-2-Oxidase (EC 1.1.3.10, P2O) FAD O2
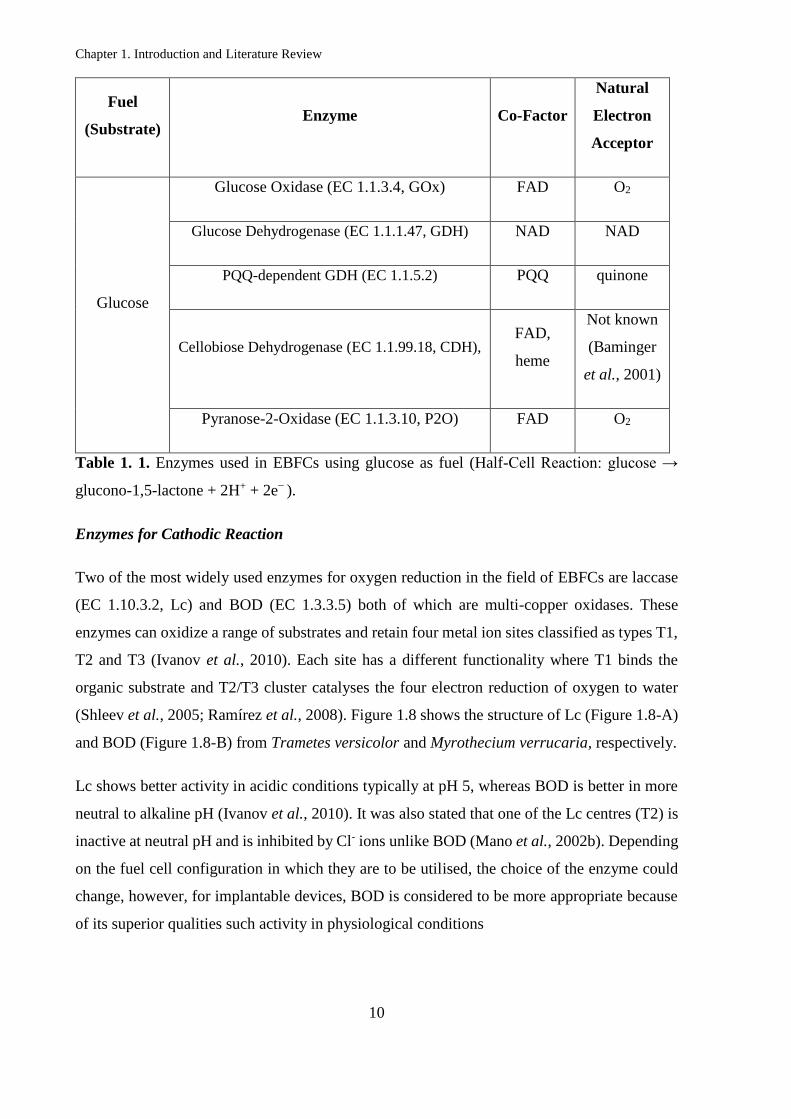
Table 1. 1. Enzymes used in EBFCs using glucose as fuel (Half-Cell Reaction: glucose →
glucono-1,5-lactone + 2H+ + 2e− ).
Enzymes for Cathodic Reaction
Two of the most widely used enzymes for oxygen reduction in the field of EBFCs are laccase
(EC 1.10.3.2, Lc) and BOD (EC 1.3.3.5) both of which are multi-copper oxidases. These
enzymes can oxidize a range of substrates and retain four metal ion sites classified as types T1,
T2 and T3 (Ivanov et al., 2010). Each site has a different functionality where T1 binds the
organic substrate and T2/T3 cluster catalyses the four electron reduction of oxygen to water
(Shleev et al., 2005; Ramírez et al., 2008). Figure 1.8 shows the structure of Lc (Figure 1.8-A)
and BOD (Figure 1.8-B) from Trametes versicolor and Myrothecium verrucaria, respectively.
Lc shows better activity in acidic conditions typically at pH 5, whereas BOD is better in more
neutral to alkaline pH (Ivanov et al., 2010). It was also stated that one of the Lc centres (T2) is
inactive at neutral pH and is inhibited by Cl- ions unlike BOD (Mano et al., 2002b). Depending
on the fuel cell configuration in which they are to be utilised, the choice of the enzyme could
change, however, for implantable devices, BOD is considered to be more appropriate because
of its superior qualities such activity in physiological conditions
Page 40
Chapter 1. Introduction and Literature Review
11
Figure 1. 8. A representation of the X-ray-determined crystal structure of (A) laccase III from
trametes versicolor (Piontek et al., 2002) and (B) BOD from myrothecium verrucaria
(Cracknell et al., 2011) (TNC refers to trinuclear cluster (T2 and T3) of the enzyme).
BOD is a monomeric enzyme which has a molar mass around 52 kDa (from myrothecium
verrucaria) (Mano et al., 2002a). Figure 1.9 shows the proposed DET mechanism via different
sites of BOD due to its orientation when used with graphite and gold electrodes. The distance
between the enzyme surface and T1 site is less than 10 Å at its closest approach (Ramírez et
al., 2008). This is short enough for electrons to be transferred from the electrode to the T1 site
but enzymes should be oriented accordingly (Ramírez et al., 2008). BOD has several
advantages over Lc apart from the pH, such as, being less sensitive to high concentrations of
bromide deactivating Lc (Calabrese Barton et al., 2004). This could be an important parameter
where blood is used in the EBFC (Kim et al., 2009).
BOD can also retain a high activity in the presence of high concentration of molecular oxygen
and it is relatively well stable (Weigel et al., 2007). Importantly for EBFC designs, BOD was
reported to have redox potentials between 0.47-0.67 V (vs Ag/AgCl) (Kim et al., 2003;
Christenson et al., 2006) which would be positive enough to generate sufficient cell voltage
when used with anodic enzymes such as P2O or GOx. Lc also shows similar redox potentials
around 0.550 - 0.585 V (vs Ag/AgCl) (Barrière et al., 2006; Güven et al., 2016).
(A) (B)
Page 41
Chapter 1. Introduction and Literature Review
12
Figure 1. 9. Mechanisms of DET from electrodes to BOD connected (A) via the T1 site and
(B) via the T2/T3 cluster (Ramírez et al., 2008).
There are on the other hand different enzymes that can be used for the oxygen reduction
reactions such as cytochrome oxidase (EC 1.9.3.1, COx) (Katz et al., 1999b), and cytochrome
c both of which have heme as a catalytic centre. When H2O2 is utilised at the cathode,
microperoxidase-11 (MP-11) (Willner et al., 1998b) and horseradish peroxidase (EC 1.11.1.7,
HRP) (Pizzariello et al., 2002) can also be used.
Outlook on Enzyme Choice for Biofuel Cells
Enzyme selection for both anodic and cathodic reactions is a real challenge to improve EBFCs.
The improvement of the biocatalyst is equally as important as choosing one. GOx, despite being
very advantageous in theory, has many drawbacks in practice especially in limiting the
performance of the fuel cell long term with its natural electron acceptor O2 as well as substrate
selectivity.
Therefore, there has always a search for alternative enzymes or modified forms of GOx to
enhance its properties using methods like purification (Gao et al., 2009) or deglycosylation
(Courjean et al., 2009). Engineering the enzyme, on the other hand, is another recent approach
which can theoretically be fine-tuned for targeted applications. Rational design (Willner et al.,
1998b) and directed evolution (Zhu et al., 2006) are the two main approaches used in protein
engineering to serve this purpose. GOx was previously used in protein engineering studies (Zhu
et al., 2006).
Page 42
Chapter 1. Introduction and Literature Review
13
Recently, however, different mutants of P2O enzyme have been developed using semi-rational
protein design (Pitsawong et al., 2010). These mutants are reported not to utilise as much
oxygen as their wild type form (Pitsawong et al., 2010), but still retain the advantages of the
wild type enzyme. This makes these mutant enzymes a promising candidate for glucose
oxidation in enzymatic fuel cells especially for long term applications.
The four-electron electrochemical reduction of O2 at pH 7 has been the basis of the enzymatic
biofuel cells. The blue copper oxidases with copper centres are closer to the surface of the
enzymes such as BOD, can provide direct electron transfer (DET) from the electrode, and are
very promising for their use in enzymatic fuel cell applications. Utilising a stable glucose
oxidizing enzyme that does not require oxygen as an electron acceptor (no electron competition
with cathode) and has a wide sugar substrate selectivity, combined with a suitable cathodic
enzyme (for oxygen reduction) presents a good design for future EBFCs. As a result, a P2O
and BOD combination in a membrane-less EBFC (as anodic and cathodic enzymes
respectively) might perform well under human physiological conditions.
1.2.2. Enzymatic Electrode Assemblies for Biofuel Cells
Electron Transfer
Enzymes catalysing oxidation-reduction reactions (redox reactions) are often called redox
enzymes. These enzymes consist of two components: apoenzyme (the protein component) and
cofactor(s) (nonproteinaceous) (Leech et al., 2012). The cofactor is responsible for the electron
transfer between the enzyme and its substrate (Leech et al., 2012). Electron transfer in the
enzymatic biofuel cells can take place in two different directions. Firstly, the transfer of the
generated electrons from the enzymes (oxidative reactions) to the electrodes (at the anode) and
secondly the electrons transferred from the electrodes to the enzyme (reductive reaction). These
electrons can be transferred via different mechanisms which either includes a mediator or direct
enzyme-electrode communication (Bullen et al., 2006).
One of the most important issues in the development of enzymatic electrodes for biofuel cell
applications is the successful and efficient electron transfer between the enzyme and electrode.
This type of electron transfer can occur either directly between enzyme and electrode (one way
or another), and is called DET, or in the presence of a mediator shuttling the electrons between
enzyme and electrode, which is called mediated electron transfer (MET) (Bullen et al., 2006;
Cooney et al., 2008; Ivanov et al., 2010).
Page 43
Chapter 1. Introduction and Literature Review
14
Figure 1. 10. Schematics of (A) direct and (B) mediated electron transfer-based enzyme
electrodes (Alkire et al., 2013).
Figure 1.10 shows the schematic of a DET and MET based enzyme electrodes. The common
structure of the enzymes which can exhibit DET is that their active centres are closer to the
protein surface, whereas the enzymes that have deep buried active centres in the protein
structure need a redox mediator. However, only less than 100 out of 1000 redox enzymes in the
literature are known to achieve DET (Ramanavicius and Ramanaviciene, 2009).
Although DET is considered to be very convenient for the simplicity of the fabrication of the
enzyme electrodes, there are still several challenges that need to be overcome to achieve
significant rates of DET with high current densities. For instance, it was reported that for
distances beyond 2 nm between electron donor and acceptor, the rate of electron transfer could
be negligible (Alkire et al., 2013).
Redox enzymes can be classified as three types based on the electron transfer mechanism (can
also be defined as the location of enzyme active centres) (Bullen et al., 2006; Hao Yu and Scott,
2010) as shown in Figure 1.11. In the first group, enzymes have diffusive active centres (Figure
1.11. (A)). These enzymes often have weakly bounded active centres such as (NADH/NAD+)
or nicotinamide adenine dinucleotide phosphate (NADPH/NADP+) (Bullen et al., 2006; Hao
Yu and Scott, 2010). The weakly binding redox centres act as an electron transfer mediator by
diffusing away from the enzyme (Bullen et al., 2006). For example, GDH and alcohol
dehydrogenase (ADH) can be classified within this group.
Page 44
Chapter 1. Introduction and Literature Review
15
Figure 1. 11. The different locations of enzyme active centres, (A) Enzyme active centre is
NAD(H) or NADP(H), (B) the active centre is diffusive and (C) the active centre is located
deep buried inside the enzyme (Bullen et al., 2006).
The second group are the enzymes that have active centres at or close to the protein surface
(Figure 1.11. (B)). Many of the multi copper enzymes such as Lc and BOD as well as
peroxidases such as HPR and cytochrome c belong in this group. The first two groups are able
to maintain DET between the enzyme active centres and the electrode surface. Among the most
widely used enzymes, it is still a matter of debate on which mechanism GOx can maintain for
glucose oxidation. There are several reports presenting DET for GOx (Liu and Dong, 2007a;
Wang et al., 2009a; Zhao et al., 2009) while others claim due to its structure only MET is
possible (Mano et al., 2003b). For the studies claiming to achieve DET with GOx, carbon
nanomaterials are generally incorporated in the immobilization methods as they are reported to
communicate with the enzyme active site (Liu and Dong, 2007a; Wang et al., 2009a; Zhao et
al., 2009).
The evidence of the DET is generally proved by the appearance of an FAD/FADH2 redox peak,
however, most of the studies failed to show the oxidation currents in the presence of glucose
(Kim et al., 2009; du Toit et al., 2016). There also could be possible protein denaturation
induced by CNTs according to reported reviews showing that the presence of free or exposed
FAD close to the electrode surface should be considered (Kannan et al., 2009).
Page 45
Chapter 1. Introduction and Literature Review
16
The orientation of the enzymes is very important to achieve DET (Hao Yu and Scott, 2010), it
should be noted that both the orientation and the diffusional access for the substrate should be
considered when fabricating this type of enzyme electrodes. Finally, even in cases where the
electrode can approach close enough to the enzyme active site to achieve DET, this still might
not be guaranteed that the bio-electro-catalytic current will be generated as the electrode can
block the access to the active site of the enzyme (Leech et al., 2012).
The last group is the enzymes which has an active centre buried deep in the protein structure
(Figure 1.11. (C)). In this case, the electrochemical connection between enzyme and electrode
can only be established in the presence of an electron-transfer mediator (aka redox mediator).
Glucose oxidase by far the most studied enzyme, is the best example for this group with a deep
buried FAD group. However as mentioned above, it should be noted that there are studies
showing DET can be possible with GOx.
Enzyme Immobilization Technology
Biological species are very sensitive to restrictive environmental conditions and their
fluctuations because of their nature (Yang et al., 2012). In practice, the lifetime of an isolated
biological species such as enzymes is limited. However, immobilization of enzymes supplies
an efficient and sustainable solution to overcome this problem offering high stability and
extended lifetime and activity (Yang et al., 2012).
Such immobilization matrixes can offer a biological environment which can preserve the
enzymes from harmful environmental conditions such as shear forces, pH, temperature
fluctuations, organic solvents and toxins (Shuler et al., 1986; Yang et al., 2012). Other benefits
such as increased cell-line stability and easy regulation of culture environment are very
important aspects for the design of enzymatic biofuel cells (Dörnenburg and Knorr, 1995).
Figure 1.12 summarises the immobilization technology, classified by three categories: the
immobilization methods (i.e. adsorption, covalent binding and entrapment etc.), the
immobilization structure (i.e. zero/one/two/three dimensional nanostructures etc.) and the
immobilization material (i.e. carbon, sol-gel etc.).
Page 46
Chapter 1. Introduction and Literature Review
17
Figure 1. 12. Immobilization technology in biofuel cells (Yang et al., 2012).
Immobilization Methods
Several different immobilization methods have been studied over the years which can achieve
high enzyme densities on electrode surfaces providing enhanced performance and improved
electron transfer kinetics (Shuler et al., 1986; Cosnier, 2000; Nguyen et al., 2004; Cooney et
al., 2008; Costa et al., 2011). The most widely used methods can be summarized as adsorption,
entrapment and covalent binding.
Adsorption - The most straight forward and easy immobilization method is the adsorption of
the enzymes on electrode surface. As well as being simple, it is a mild and reversible process,
which can be applied to different structures such as sponges (Ahmadi et al., 2006), fibres
(Facchini and DiCosmo, 1990), sheets (Danilov and Ekelund, 2001) and foams (Yin et al.,
2006). The efficiency of adoption depends on the physicochemical condition such as pH or
ionic strength as well as the pore size or structure of the support (Yang et al., 2012). However,
the leaching of the adsorbed enzymes to the solution is the main challenge for this type of
immobilization. Recently layer-by-layer (LBL) assemblies based on electrostatic interaction
are a point of interest especially in the area of constructing enzyme electrodes.
Strong polycations such as poly(dimethyldiallyammonium chloride) (PDDA) were shown to
be well adsorbed on carbon or gold electrodes (Alexeyeva and Tammeveski, 2008; Zhang et
al., 2008). Figure 1.13 shows a schematic diagram of LBL fabrication of an enzyme electrode
for electrochemical detection of fatty acids.
Page 47
Chapter 1. Introduction and Literature Review
18
Figure 1. 13. Schematic diagram of LBL fabrication of an enzyme electrode for
electrochemical detection of fatty acids (ACOD: Acyl-CoA Oxidase, ACS: Acyl-CoA
Synthetase, C SPE: Carbon screen printed electrode, MWCNT: Multi-walled carbon
nanotubes) (Kang et al., 2014).
Entrapment - Entrapment of enzymes is often used in the field of enzymatic electrode design
especially using polymeric materials, as it is an easy process with good mechanical strength
and stability (Yang et al., 2012). It was reported that such systems can solve the leaching
problem up to a point but cannot eliminate it for good (Cooney et al., 2008).
Figure 1. 14. Schematic of immobilised enzyme using nanostructured silica sol-gel entrapment
method (Lim et al., 2007).
One example of this type of immobilization method is shown in Figure 1.14 where the enzyme
was encapsulated in sol-gel silica matrices and carbon nanotubes were incorporated within the
Page 48
Chapter 1. Introduction and Literature Review
19
matrix to provide enhanced electronic conduction (Lim et al., 2007). It was reported that
uniform carbon nanotube inside sol-gel film was achieved using polyethylene glycol and the
enzyme maintained its activity on the developed enzymatic electrode.
Covalent Binding - Covalent binding is similar to adsorption as a way of forming monolayer
coverage of enzyme on the electrode surface, through chemical bonds are formed between the
enzyme and the electrode (Cooney et al., 2008). In this approach, stability and leaching of the
enzymes can be improved, yet enzymes show lower activity than the native form due to the
chemical bonds formed (Cooney et al., 2008; Yang et al., 2012).
Figure 1. 15. Covalent enzyme immobilization with (A) epoxy-modified silica (B)
aminopropyl-modified silica (Jung et al., 2010).
The functional groups involved in covalent binding are amino, carboxyl, alcohol, thiol, and
phenolic functions (Iqbal et al., 2013). These groups can be involved in different reactions
include diazotization followed by coupling, amide bond formation, and Schiff's base formation
(Girelli and Mattei, 2005). An example of covalent enzyme immobilization using epoxy-
modified silica or aminopropyl-modified silica resulting different reactions with enzyme is
shown in Figure 1.15 (Jung et al., 2010).
Cross-linking, often classified in covalent binding method, can achieve successful
immobilization of enzymes on electrode surfaces. This can be achieved using either covalent
bonding or ionic bonding. The most widely used cross-linking agents include carboxyl-reactive
chemical groups that used for crosslinking carboxylic acids to primary amines. 1-ethyl-3-(3-
dimethylaminopropyl) carbodiimide hydrochloride (EDC) is an example for this type
crosslinker where it often used with N-hydroxysulfosuccinimide (NHS) to improve efficiency
or create dry-stable (amine-reactive) intermediates.
Page 49
Chapter 1. Introduction and Literature Review
20
Figure 1. 16. EDC-NHS crosslinking reaction scheme (Scientific, 2016).
Figure 1.16 shows the reaction scheme for the EDC-NSH crosslinking reaction with amine.
NHS is important to use in this type of crosslinking reaction as it forms NHS ester (dry stable)
which is more stable than o-acylisourea formed by EDC, therefore more efficient conjugation
can be achieved. There are several studies using EDC-NHS crosslinking methadology
especially incorporating carbon nanotubes with pyrenyl activated sites as it provides carboxly
acid groups for enzyme linkage (Krishnan and Armstrong, 2012). Figure 1.17 is example of
EDC-NHS crosslingking or an anodic and cathodic enzyme on Pyrolytic graphite ‘edge’
electrodes.
Figure 1. 17. Schematic for crosslinking enzymes on pyrene activated carbon nanotubes using
EDC-NHS couple (Krishnan and Armstrong, 2012).
Page 50
Chapter 1. Introduction and Literature Review
21
Enzyme Electrodes Based on Diffusional and Immobilised Mediator
Mediator based electrodes have been widely studied in literature due to the low number of
enzymes which can achieve DET and their limitations (Ivanov et al., 2010). The mediator used
for electron transfer in the field of EBFCs can be divided into two categories: free diffusive and
immobilised mediators (Ivanov et al., 2010).
Table 1.2 presents a list of mediators for commonly used enzymes for glucose oxidation and
their redox potentials. Mediators are mostly specific to the enzyme and their redox potentials
depend on conditions such as pH or whether they are soluble or immobilised. EBFCs using
diffusional mediators are limited in use because of their impracticality for most of the foreseen
applications such as implantable healthcare devices.
Although some of the mediators have been reported as non-toxic to humans such as Ferrocene
(Fc) (Stepnicka, 2008), there are also few others which are toxic such as osmium (Os) (Hao Yu
and Scott, 2010). Therefore, diffusional mediators, such as ferrocene mono carboxylic acid
(FcCOOH) are generally employed alongside novel immobilization methods in the literature.
For example, CNTs-Chitosan (Liu et al., 2005) or ionic liquids (IL) (Liu and Dong, 2007b)
suspension systems were used with FcCOOH as mediator with GOx entrapped in the polymer
matrix. FcCOOH was also used in different studies such as CNTs mixtures of GOx using
different immobilization techniques (Yan et al., 2007a; Tan et al., 2009).
Different mediators such as benzoquinone and N,N,N’,N’-tetramethyl-p-phenylenediamine
(TMPD) have been used in similar approaches with GOx covalently attached to the electrode
using different coupling techniques (Zhang et al., 2006; Kuwahara et al., 2007). Diffusional
mediators were also used in microfluidic designs as both enzyme and mediator solution
mixtures can be used as a separate phase without mixing into other phases due to very slow
flow rates (Bedekar et al., 2007).
Several reports have been published for different methods of immobilizing enzymes with
mediators in literature (Gao et al., 2007; Togo et al., 2007; Deng et al., 2008; Nazaruk et al.,
2008; Zhou et al., 2009). Most of the research focused on using 3-D matrices like polymers,
lipids and CNTs or combination of these to incorporate mediator and enzyme in a practical way
such as entrapment (Ivanov et al., 2010).
Page 51
Chapter 1. Introduction and Literature Review
22
Mediator Redox Potential / V
(vs Ag/AgCl)
pH Reference
Ferrocene carboxylic acid ~0.34 7 (Yan et al., 2007a)
p-benzoquinone ~0.06 7 (Kuwahara et al., 2007)
Phenazine methosufate ~0.12 6 (Bedekar et al., 2007)
Pyrroloquinoline quinone ~ (-0.09) 7 (Willner et al., 1998b)
8-hydroxyquinoline-5-sulfonic acid ~0.11 5 (Brunel et al., 2007)
Tetrathiafulvalene ~0.22 7 (Nazaruk et al., 2008)
Poly(methylene blue) -0.10 6 (Yan et al., 2006)
Poly(brilliant cresyl blue) -0.11 7 (Gao et al., 2007)
Methylene green* –0.20/–0.05 6 (Li et al., 2008)
Meldola blue - - (Zhou et al., 2009)
Nile blue -0.35 7 (Yan et al., 2007b)
Thionine - - (Deng et al., 2008)
Os polymer
-0.19 5 (Mano et al., 2003b)
-0.19 7 (Mano et al., 2002b)
0.095 5 (Chen et al., 2001b)
-0.16 7 (Kim et al., 2003)
-0.11 5 (Barrière et al., 2006)
poly(vinylferrocene) 0.30 7 (Tamaki and Yamaguchi,
2006)
2-methyl-1,4-
naphtoquinone
(vitamin K3)
on PLL** -0.27 7 (Togo et al., 2007)
on PAAm*** -0.25 7 (Sato et al., 2005)
Table 1. 2. Typical mediators used in enzymatic glucose oxidation. (V vs Ag/AgCl = V vs SHE
– 0.197; V vs SCE = V vs. SHE – 0.24.) *methylene green exhibits two redox pairs, ** poly-
L-lysine, *** polyallylamine.
Page 52
Chapter 1. Introduction and Literature Review
23
Polypyrole electropolymerization for enzyme entrapment for both anodic and cathodic enzyme
electrodes, as well as using poly(ethylene glycol) diglycidyl ether (PEGDGE) for subsequent
cross-linking of the proteins, has been used to immobilize different mediators such as 8-
hydroxyquinoline-5-sulfonic acid (HQS) and 2, 2’-azino-bis (3-ethylbenzthiazoline-6-sulfonic
acid) (ABTS) (Brunel et al., 2007; Merle et al., 2009). However, in many cases the electrode
stability has been a real concern due to mediator leaching in this type of entrapment approach.
One of the most widely studied immobilised mediator has been Os polymer based redox
hydrogels to overcome this problem. Figure 1.18 shows the structure of the Os polymer and the
electron conduction takes places in the redox hydrogel. The main advantage of using Os
polymers is the wide redox potential ranges for different redox reactions, fast electron transfer
rate and good chemical stability (Hao Yu and Scott, 2010). Since one of the first reports of an
Os polymer system by the Heller group in 1991 (Gregg and Heller, 1991) based on electrostatic
interactions (hydrogel being polycationic and enzymes being polyanionic), various polymer
backbones have been developed and used in the field of biosensors and biofuel cells (Barton et
al., 2001; Kang et al., 2006).
Figure 1. 18. (A) The structure of anodic Os polymer with a 13-atom flexible spacer between
the polymer backbone and the Os complex (B) Schematics of electron conduction in Os redox
hydrogels (Mano et al., 2002b; Heller, 2006).
However, biocompatibility is the main problem for long term applications where Os polymer
is used. Since Os compounds are toxic, possible leaching problems raise much concern in using
this redox hydrogels especially in implantable systems (Hao Yu and Scott, 2010). In addition
Page 53
Chapter 1. Introduction and Literature Review
24
to Os polymers, which can be used for both anode and cathode enzymatic electrode preparation
there have been specific mediators reported for oxygen reduction systems. The most notable
example of this mediator type is ABTS that was utilised for both Lc (Palmore and Kim, 1999)
and BOD (Habrioux et al., 2009). The redox potentials reported for ABTS is around 0.49 V
versus Ag/AgCl (0.69 V vs SHE) at pH 7 which is closer to the redox potentials of multi copper
oxidases (Nazaruk et al., 2008). However, as multi copper oxidases can exhibit DET efficiently,
recent research focuses on using these enzymes without any mediator.
Enzyme Electrodes with Ferrocene Polymer Systems
Fc and its derivatives have been widely used as mediators for enzymatic bio-anode fabrication
for decades (Li et al., 1997; Miao et al., 2001; Razumien et al., 2003; Kase and Muguruma,
2004). In one of the earliest reports by Cass, they demonstrated that the Fc and its derivatives
are able to accept electrons from GOx enzyme and shuttle the electrons to the electrode as
confirmed by voltammograms (Cass et al., 1984). The structure of Fc and its widely used
derivative Ferrocene carboxylic acid (FcCOOH) are shown in Figure 1.19.
Fc is known to be insoluble in water, on the other hand, its most widely used derivative
FcCOOH is soluble due to its –COOH group attached to the Fc molecule (O'Gorman, 1998).
This is an important aspect when the mediator is required in aqueous media, however recent
EBFC designs require immobilised systems predominantly due to their suitability in implant
applications.
Figure 1. 19. Structure of (A) Ferrocene and (B) FcCOOH.
(A) (B)
Page 54
Chapter 1. Introduction and Literature Review
25
Fc based mediators are rapid oxidants (Cass et al., 1984), stable in oxidized or reduced forms
(Harper and Anderson, 2010), easy to derivatize (Harper and Anderson, 2010), even reported
as harmless for human body up to certain levels (Stepnicka, 2008) and its redox potential is
independent of pH (Katz et al., 1999a). However, the rate of the reaction between GOx and Fc
is lower than the reaction between GOx and O2. The presence of O2 would result in decreased
catalytic current as it will accept the electrons faster than Fc to form H2O2 excessively, therefore
it either would decrease the catalytic current related to the reaction with Fc or the system will
be affected by the oxidative nature of H2O2 (Cass et al., 1984).
Different methods have been applied to immobilize the Fc and/or its derivatives to obtain a
stable fast electron transfer enzymatic electrodes. Early methods generally include the
entrapment of Fc into polymer such as polyacrylamide gels (Lange and Chambers, 1985) or
ferrocene/siloxane polymer (Gorton et al., 1990). Entrapment within the polymer aimed at
preventing the enzyme and mediator diffusing away from the electrode resulting in stable
electrodes. Although these methods appear to work successfully, the long term leaching of both
enzyme and mediator is inevitable (Brooks et al., 1988).
The encapsulating method has been used many times using conducting polymers such as
polypyrole (Fiorito and Torresi, 2001; Vidal et al., 2002), polyphenols (Nakabayashi et al.,
1998), cellulose acetate membranes (Tkáč et al., 2002). Although promising results have been
obtained the fabricated electrodes suffer from several problems such as low conductivity of the
films formed and some interferences due to electro polymerization processes.
Cross-linking of glutaraldehyde on top of a sandwich conformation involving chitosan, Fc and
GOx has been developed and it was stated that the bio electrode maintained 65% of its activity
after 30 days of storage in buffer solution (Miao et al., 2001). However, glutaraldehyde is
known as a strong sterilant, toxin and strong irritant which makes its use suspicious in
enzymatic electrodes especially in terms of biocompatibility.
Sol-gel materials (Yang et al., 2003) and hydrogels (Bu et al., 1998) were also other materials
studied to utilise Fc and its derivatives. Physical entrapment of sol-gel materials with the
enzyme and Fc has issues with leaching of materials used in electrode fabrication. On the other
hand even when covalently bonded, the chemical binding of enzyme to electrode tend to
decrease enzyme stability due to affecting its 3-D structure or limiting the ability of the internal
movements of the enzyme to catalyze the reactions (Cooney et al., 2008). Poly(ethylenimine)
Page 55
Chapter 1. Introduction and Literature Review
26
(PEI), is one of the most promising polymer material used in conjunction with carbon
nanomaterials cross-linked to Fc for enzymatic bioanode fabrication. Several number of good
quality reports have been published incorporating PEI with single-walled CNTs (SWCNTs)
(Tran et al., 2011) or multi-walled CNTs (MWCNTs) (Arribas et al., 2007; Rubianes and Rivas,
2007; Laschi et al., 2008; Yan et al., 2008). Figure 1.20 shows the incorporation of SWCNTs
with PEI polymer to construct enzymatic electrodes by immobilizing GOx with Fc used as
mediator.
However most of these reports relate to the design an amperometric glucose detection. On the
other hand, in the field of enzymatic biofuel cells, PEI was also used by incorporating SWNTs
with redox polymer−enzyme hydrogels in which Fc was attached to linear poly(ethylenimine)
(Meredith et al., 2011). Although many different approaches have been investigated to utilise
Fc with different anodic enzymes in fabricating enzyme electrodes for biofuel cell anodes,
enzyme leaching from the polymer films still is a concern especially in continuous monitoring
systems or biofuel cells requiring long term operation.
Figure 1. 20. Schematic of enzymatic anode based on SWCNTs incorporated with Fc redox
polymer (Tran et al., 2011).
Nafion®, a perfluorosulfonic acid cation-exchange polymer, on the other hand, could be a
possible solution to this problem if used as a protective and encapsulating material in the
fabrication of enzyme electrodes (Harkness et al., 1993). Nafion® consists of hydrophobic
perfluorocarbon backbone with side chains terminated by the hydrophilic sulfonate (SO3-)
groups with counter ions (Vishnyakov and Neimark, 2001). Figure 1.21 shows the structure of
nafion® where in a typical membrane x varies between 5 and 14, y varies between 200 and 1000
and z = 1. The hydrated nafion® membrane can hold between 1 and 30 water molecules per
SO3- group (Blake et al., 2005).
Page 56
Chapter 1. Introduction and Literature Review
27
Figure 1. 21. Structure of nafion®.
Ion conductivity takes place in the hydrophilic domain of the nafion® where water can be
adsorbed into both hydrophobic and hydrophilic domains (Blake et al., 2005). Nafion® has
excellent ion conduction properties (Moore et al., 2004), biocompatible interface &
compatibility with mammalian tissue (which are essential for implantable medical applications)
(Turner et al., 1990), hydrophilic and hydrophobic properties, as well as being chemically inert
with a long-term chemical stability due to its polytetrafluoroethylene (PTFE) backbone (Blake
et al., 2005).
Positively charged redox-active species have been previously entrapped into nafion®
membranes showed promising results (Rubinstein and Bard, 1980) and used for different
purposes such as reference electrodes (Rubinstein, 1984). In another example, N-
methylphenazonium (NMP) was adsorbed onto the nafion® layer for glucose bio sensing
applications containing GDH enzyme where successful electron transfer through NMP was
achieved (Malinauskas et al., 2004).
Mediators can be reduced and oxidized to shuttle the electrons between the enzyme active sites
and the electrode. During this operation the mediator can be re-oxidized at the electrode (to its
cationic form). If this process were occurring inside the nafion® film, the mediator would be
ion-exchanged out of the film. However, since nafion® has a high selectivity coefficient for
cations with a hydrophobic character, this can provide a potential solution to the problem of
mediator leaching (Martin and Freiser, 1981).
Nafion® contains large segments of hydrophobic uncharged chain material in the polymer
which has strong interactions with hydrophobic ions resulting in strong retention of
hydrophobic cations by nafion® (Espenscheid et al., 1986). This can provide a strong base for
Page 57
Chapter 1. Introduction and Literature Review
28
stable mediator incorporation into nafion® films and can be achieved with Fc (Espenscheid et
al., 1986). Nafion® coating was also reported to protect electrode surface (Robertson and
Yeager, 1996). Although having difficulties in respect to controlling film thickness and
uniformity between different electrodes, the protective function of nafion® was shown to be
reproducible (Harrison et al., 1988).
Incorporating Fc with nafion® as polymeric films has been reported as a straightforward method
for amperometric glucose detection (White et al., 1982; Chen et al., 1992; Dong et al., 1992;
Harkness et al., 1993; Brown and Luong, 1995; Vaillancourt et al., 1999). Fc containing
nafion® polymer films can be applied to enzymatic electrode fabrication in many ways which
can be summarized into 3 simple types:
Drop casting of enzymes after coating the electrodes with Fc-Nafion film (Dong et al.,
1992)
Drop casting of enzymes before coating the electrodes with Fc-Nafion films to trap the
enzyme (Ghica and Brett, 2005; Mani et al., 2013)
Physical entrapment of enzyme inside the Fc-Nafion polymer films (Harkness et al.,
1993; Vaillancourt et al., 1999) or electro-polymerizing a conducting polymer/Fc
derivative on nafion® -enzyme electrode (Brown and Luong, 1995)
Nafion® tends to deactivate enzymes with increasing pH and diluting nafion® suspensions to
solve this problem was reported to form unstable and non-uniform films (Moore et al., 2004).
Therefore, dilutions must be achieved without compromising the film quality on the electrode
surface. High ethanol content (90%) nafion® suspensions were reported to maintain stable
membranes on electrode surfaces (Karyakin et al., 1996). Using the high ethanol content in
suspensions showed better performance in terms of stability compared to excessive water
diluted nafion® suspensions (Harkness et al., 1993; Karyakin et al., 1996).
Nafion® incorporated with Fc might be a solution for fabricating long term stable and
electrochemically active enzyme electrodes for glucose oxidation in enzymatic biofuel cells as
nafion® is also readily permeable to glucose (Harkness et al., 1993). However, there is still
room for improvement as these films can be enhanced using better materials and methods.
Page 58
Chapter 1. Introduction and Literature Review
29
Enzyme Electrodes Based on Carbon Nanotube Deposits
There has been great interest in using CNTs especially during the last two decades because of
their unique properties of biocompatibility and excellent conductivity. CNTs are divided into
two main groups according to their layered structures which are SWCNTs (consists of one
layer, straw like structure) and MWCNTs (group of nested tubes, up to 100 tubes surrounded
each other) (Babadi et al., 2016).
One of the most important advantages of utilising CNTs in the area of enzymatic electrode
fabrication for enzymatic biofuel cells is their highly specific 3-D structured surface area of
more than 1000 m2 g-1 (Peigney et al., 2001). Different modifications can be applied to the
CNTs by attaching specific sites to immobilize enzymes or mediators which makes this
nanostructures very suitable for biofuel cell electrode design (Cosnier et al., 2014). CNTs can
either maintain electrical communication between the enzymes and the electrodes directly (such
as with BOD as a cathodic enzyme) and/or can enhance indirect electrical communication (such
as enzyme mediator CNTs composites) (Cosnier et al., 2014). Functionalized CNTs show
excellent properties including, film forming ability, good adhesion, high mechanical strength
and amenable to chemical modifications (e.g. hydroxyl or amino groups) which makes them
very attractive for enzyme immobilization (Zhang et al., 2004a; Luo et al., 2005; Zhou et al.,
2007). Such immobilization methods might include cross-linking (Zhang et al., 2004a) (Wei et
al., 2002), dip coating and covalent bonding.
Figure 1. 22. Structure of (A) 1-pyrenebutric acid and (B) 1-pyrenebutanoic acid succinimidyl
ester.
Non-covalent functionalization of CNTs using with pyrene derivatives and enabling π–π
stacking interactions with CNT wall was reported several years ago and attracted many
researchers (Chen et al., 2001a; Krishnan and Armstrong, 2012; Bourourou et al., 2013). Figure
(A) (B)
Page 59
Chapter 1. Introduction and Literature Review
30
1.22 illustrates the structure of two different pyrenyl compounds: (A) 1-pyrenebutric acid and
(B) 1-pyrenebutanoic acid succinimidyl ester.
Although earlier reports used 1-pyrenebutric acid for the crosslinking of enzymes using the
EDC-NHS couple (Krishnan and Armstrong, 2012), recently another pyrenyl compound, 1-
pyrenebutanoic acid succinimidyl ester (PBSE) has become popular in the field of constructing
electrodes (Halámková et al., 2012; Szczupak et al., 2012; MacVittie et al., 2013; Güven et al.,
2016). Having the ester group (as in PBSE) attached to the pyrene structure makes this
compound attractive as it involves less complicated modification of the electrodes. When
functionalized with PBSE, CTNs side-walls form π-π stacking of the polyaromatic pyrenyl
moiety. This structure provides covalent binding with amino groups of the enzymes. Figure
1.23 shows a simple representation of the process where PQQ-GDH and Lc enzymes are both
immobilised on CNT buckypaper electrode (Szczupak et al., 2012).
Figure 1. 23. Schematic of PQQ-GHD and Lc immobilised on pyrenyl carbon nanostructures
(Szczupak et al., 2012).
PBSE results in a random orientation of the enzyme molecules relative to the electrode surface
because of the large number of amino acid groups randomly positioned in the protein structure
(Katz, 1994). However incorporation of the CNTs might be a problem especially in the case of
cathodic enzyme electrodes where DET is depending on the orientation of the enzyme.
Graphene, is a 2-D nanomaterial of carbon, with very high surface areas of 2630 m2 g-1 and
shows promising properties such as high mechanical conductivity and easy of functionalization
for the field of enzymatic biofuel cell electrode fabrication (Babadi et al., 2016). It was
introduced as a favourable alternative electrode material in different applications to enhance
the properties of the electrode.
Page 60
Chapter 1. Introduction and Literature Review
31
More recently, mixtures of graphene with CNTs have been studied to combine the excellent
properties of both materials for enzymatic bio-cathode design (Lalaoui et al., 2015). More
studies incorporating graphene with CNTs were reported to be on the increase due to promising
preliminary results.
Outlook on Enzyme Electrode Assemblies
One of the most important aspects for designing enzymatic biofuel cell anodes and cathodes is
selecting the most suitable assembly to immobilize enzymes onto electrode surface. Over
decades, there have been many studies to achieve highly stable, biocompatible and high current
density electrode configurations.
Electrode transfer is the first step to develop the right approach for the chosen enzyme. Hence,
the biochemistry of the enzymatic electrode transfer should be understood well. In theory, DET
presents an easy and efficient choice, however the downside of such electrical communication
should be considered. As explained in section 1.2.2 about only limited numbers of enzymes can
achieve DET and even within this small proportion there are concerns and even debatable
results regarding the enzyme orientation and ability to transfer electrons.
The widely used and promising enzymes such as GOx and P2O on the anodic side and BOD
on the cathode side can be employed in the presence or absence of mediators. Although there
are no reports claiming DET for P2O enzymes, there are a remarkable number of studies
claiming DET for GOx. Most of these incorporate CNTs as they claim that this nano-scale
material can reach the active site of the enzyme to maintain communication between the
enzyme and the electrode. Nonetheless, there is no clear information whether such systems
harm the enzymatic structure especially in the long term. It is, on the other hand, well-
established for that BOD like other multi copper oxidases, can facilitate the transport of
electrons from electrode itself because of the fact that its active site is very close to the protein
surface.
In contrast, the structure of the GOx shows that the active site of the enzyme is deep buried
under the protein shell and in fact even if it was possible to wire nanomaterials inside the
enzyme, this might not actually work at the desired performance or stability. Due to the possible
damage that might be caused during the wiring processes such modifications should be
considered when designing enzyme electrodes as was previously reported (Kannan et al., 2009).
Page 61
Chapter 1. Introduction and Literature Review
32
On the other hand, some mediators such as Fc have been widely studied in the literature
showing successful mediation of the electrons for enzymatic glucose oxidation. In particular,
incorporating Fc with biocompatible and stable polymers such as nafion® could be a good
approach for fabricating enzymatic electrodes. CNTs could also be added to form a composite
which might provide better electrical conductivity. In conclusion, an easy step modification
process combined with biocompatible and long term stable design is extremely desired for
fabrication of enzymatic electrodes for enzymatic biofuel cells.
1.2.3. Enzymatic Biofuel Cell Configurations and Performance
One of the earliest reports on enzymatic biofuel cells was by Willner and Katz based on NADH
and H2O2 for anode and cathode reactions respectively (Willner et al., 1998a). This type of fuel
cell had an OCP of 0.32 V with a maximum power of 8 μW using an external load of 3 kΩ
(Willner et al., 1998a). Then, a glucose/O2 EBFC was reported by the same group leading the
way to the improvements with these types of EBFCs for many applications to power
microelectronics in implantable micro devices. The maximum power was 4 μW at an external
load of 0.9 kΩ with 1 mM glucose concentration (Katz et al., 1999b).
Enzymatic Biofuel Cells Based on Glucose and Air/O2
Many different configurations have been published based on different enzymes for anodic and
cathodic reactions where glucose and oxygen are utilised at the anode and cathode respectively.
Most of these studies focused on developing fuel cells for implantation under physiological
conditions to use the glucose present naturally in human blood. As discussed in Section 1.2.1,
GOx is the most widely utilised enzyme for enzymatic biofuel cell anodes.
EBFCs based on GOx and Os derivatized polymer mediators have been very popular and
attracted many researchers since the first biofuel cell design for glucose oxidation. One of the
examples for this type of enzymatic biofuel cells is presented by Soukharev et al. wiring both
GOx and Lc enzymes for anode and cathode respectively using Os-based redox polymers
(Soukharev et al., 2004). This configuration provided power outputs of 350 μW cm-2 in 15 mM
glucose containing citrate buffer (pH 5) at 37.5 °C. In another study, researchers developed a
GOx-BOD based glucose/O2 EBFC with a power output of 244 μW cm-2 in 15 mM glucose
containing 0.15 M chloride at (pH 7.4) at ~37 °C (Mano and Heller, 2003). Both of these studies
do not present any stability information which is a concern when using these Os-based
Page 62
Chapter 1. Introduction and Literature Review
33
polymers. For implantable medical devices, nontoxic mediators, unlike Os, are essential (Hao
Yu and Scott, 2010).
Other mediators such as tetrathiafulvalene (TTF) (Komaba et al., 2008; Nazaruk et al., 2008)
and HQS (Habrioux et al., 2008) have been used for enzymatic biofuel cell anodes with GOx,
and ABTS is commonly used (Liu and Dong, 2007b; Habrioux et al., 2008; Komaba et al.,
2008) for Lc and BOD containing cathodes. However, mediators like Fc and its derivatives
have attracted more researchers due to their promising properties (Liu and Dong, 2007b) (Lim
et al., 2007; Liu and Dong, 2007b). Most of the recent studies report using the DET properties
of Lc and BOD enzymes in combination with CNTs or gold nano particles (Krishnan and
Armstrong, 2012; du Toit et al., 2016). Table 1.3 shows examples of fuel cells that all use a
mediator based on GOx anodes and redox mediators and cathodes with Lc and BOD.
Recently there has been growing interest in implantable fuel cells. In this context, researchers
demonstrated power production from the hemolymph of snails (Halámková et al., 2012),
“cyborg” lobsters (MacVittie et al., 2013), and serially connected clams (Szczupak et al., 2012).
A biofuel cell was even inserted in an insect (Rasmussen et al., 2012). Figure 1.24 shows
examples of these demonstrations.
Figure 1. 24. Enzymatic biofuel cells demonstrated in non-mamal living animals: (A) snail, (B)
lobster and (C) clam (Halámková et al., 2012; Szczupak et al., 2012; MacVittie et al., 2013).
(A) (B)
(C)
Page 63
34
Enzymes
Anode / Cathode
Mediators
Anode/Cathode
Fuel
Concentration
/ mM
Power Density
/ (µW cm-2) Comments Ref
GOx/Lc TTF/ABTS 15 7
Two glassy carbon electrodes (GCE) modified with enzymes
embedded in lyotropic liquid-crystalline cubic phase were used
for the biofuel cell construction. McIlvaine buffer, pH 7
solution. No stability information.
(Nazaruk et
al., 2008)
GOx/Lc
Os polymer/
Os polymer
15 137
Carbon fiber electrodes (7 µm diameter, 2 cm long) were used.
At 23 °C, pH 5.0 citrate buffer (0.2 M). The cell operated for
24 h with <10% loss; after 72 h of continuous operation the
power output dropped by ∼25%. The external load in the test
was 1 MΩ.
(Chen et al.,
2001b)
GOx/Lc Os polymer/
Os polymer 15 350
2 cm long carbon fiber anode coated with “wired” glucose
oxidase and with a 7 µm diameter, 2 cm long carbon fiber
cathode coated with the PVI-Os-tpy “wired” laccase and with
the novel polymer I “wired” laccase cathode, pH 5 citrate buffer
at 37.5 °C. No stability information.
(Soukharev
et al., 2004)
GOx/Lc
The ferrocene
carboxylic acid or
ferrocene
dicarboxylic
acid/ABTS
15 10
Enzyme entrapment in multi-walled carbon nanotubes-ionic
liquid gel. Air-saturated acetate acid buffer solution containing
saturated FcCOOH solution (pH 5.86). Stability at OCP
(0.33V) is 72 h. Stability under 40 kΩ was dramatically bad.
(Liu and
Dong,
2007b)
Table 1. 3. Examples of glucose/air (or O2) fuel cells based on mediators and GOx.
Page 64
Chapter 1. Introduction and Literature Review
35
Enzymes
Anode /
Cathode
Mediators
Anode/Cathode
Fuel
Concentration
/ mM
Power
Density /
(µW cm-2)
Comments Ref
GOx/Lc Fc/DET 10 15.8
Carbon nanotubes-hydroxyapatite nano composite-based
anode and cathode. 0.10 M pH 6.0 phosphate buffer,
temperature 20 ± 2 °C was used. No stability information.
(Zhao et al.,
2009)
GOx/Lc Fc/DET 10 29.4
Lc immobilised via polymerization of dopamine with
CNTs. GOx with Nafion-Fc-MWCNTs on glassy carbon.
Operating in Britton–Robinson buffer solution (pH 5.0).
After 5 h operation at 20kΩ, performance decreased to 94
% of initial value. No info for long term stability.
(Tan et al.,
2010)
GOx/BOD Os polymer/
Os polymer 15 50
A biofuel cell under physiological conditions air
saturated, pH 7.4, 0.14 M NaCl, 37.5 °C. No stability
information.
(Kim et al.,
2003)
GOx/BOD
Os polymer/
Os polymer
20 244
A miniature biofuel cell operating under physiological
conditions phosphate buffer, pH 7.4, 0.15 M chloride at
~37 °C. No stability information.
(Mano and
Heller,
2003)
GOx/BOD TTF/ABTS 100 150
Enzymes and meciators were entrapped in polyion
complex matrix on CNTs modified glassy carbon
electrode. Tested in O2 saturated 40 mM PBS buffer at 37
°C.
(Komaba et
al., 2008)
Table 1.3 continued.
Page 65
Chapter 1. Introduction and Literature Review
36
Enzymes
Anode /
Cathode
Mediators
Anode/Cathode
Fuel
Concentration
/ mM
Power
Density / (µW
cm-2)
Comments Ref
GOx/BOD Ferrocenemethanol
/ABTS 100 120
Sol-gel-CNTs enzyme composite electrodes, air saturated
solution, operated at room temperature. No stability
information.
(Lim et al.,
2007)
GOx/BOD
Ferrocenemethanol
/ABTS 100 24.3
The anode of the biofuel cell consists of a gold electrode with
co-immobilised graphene – glucose oxidase using silica sol–gel
matrix. Air saturated glucose solution in PBS. The system was
stored in pH 7.4 PBS solution at 4 °C and tested every day with
a 15 kΩ external load. After the first 24 h, it had lost 6.2% of
its original power output. Power output become 50% of its
original power output after 7 days
(Liu et al.,
2010)
GOx/BOD HQS/ABTS 10 42
Concentric BFC based on carbon tubular electrodes set up. The
enzymes and the mediators were entrapped at the electrode
surfaces by a film of polypyrrole film followed by a
glutaraldehyde treatment. Phosphate buffered solution (pH 7.4)
at 37 °C. No stability information.
(Habrioux
et al., 2008)
GOx/BOD Fc/ABTS 5 26 Fc containing redox polymer. Tested O2 sat PBS at 37 °C. No
stability information
(Bunte et
al., 2014)
GOx/BOD Fc/DET 10 13 The MWCNT, Fc, enzymes and chitosan were sequentially
coated on a glassy carbon electrode. No stability information.
(Park et al.,
2011)
Table 1.3 continued.
Page 66
Chapter 1. Introduction and Literature Review
37
In terms of the implantable applications in mammals, the first demonstration of an implanted
biofuel cell (fully biological) for generating electricity was in a rat (Cinquin et al., 2010). The
fuel cell was able to generate electrical power using the glucose in the rat with an OCP value
of 0.275 V and maximum power output of 6.5 μW (Cinquin et al., 2010). Similar to this study,
rabbit ear (partially implanted, anode compartment only) (Miyake et al., 2011) and brain of a
living rat (Andoralov et al., 2013) were used to power up an enzymatic biofuel cells resulting
0.42 μW and 2 μW cm−2 power and power density values respectively.
Incorporating CNTs technology and DET properties, researchers managed to raise the power
to 38.7 μW by implanting an enzymatic biofuel cell in a rat and lit up an LED or a digital
thermometer using special circuits with capacitors (Zebda et al., 2013). Examples illustrating
mammalian implanted fuel cells are shown in Figure 1.25. A glucose/oxygen biofuel cell using
FAD-dependent glucose dehydrogenase enzyme at the anode side operating in human serum
was also reported and produced maximum power densities of 39.5 ± 1.3 and 57.5 ± 5.4 μW
cm−2 for EBFCs at 21 °C and 37 °C, respectively (Milton et al., 2015).
Figure 1. 25. Enzymatic biofuel cells implanted in (A) rabbit ear and (B) rat (Miyake et al.,
2011; Zebda et al., 2013).
More recently, a model study using human serum has been reported where anodic and cathodic
electrodes were made of carbon nanotube-buckypaper modified with PQQ-dependent glucose
dehydrogenase and laccase, respectively. Power densities of 16.12 μW cm−2 were achieved in
human serum for lower than physiological glucose concentrations (Güven et al., 2016).
(A)
(B)
Page 67
Chapter 1. Introduction and Literature Review
38
Increasing the glucose concentration to 24.89 mM and biofuel cell temperature to 37 °C caused
an increase in power output leading up to 49.16 μW cm−2 (Güven et al., 2016).
The progress in the area of enzymatic biofuel cells is slower than previous years because of
operational limitations especially for human implants such as pacemakers. Although there are
preliminary reports concerning powering up pacemakers (MacVittie et al., 2013) using
enzymatic biofuel cells, it is still not stable enough for the long-term applications. However, in
the short term, there are other potential applications might be important, for example, in plants.
In this content, there are reports demonstrating enzymatic biofuel cells extracting power from
glucose or fructose in plants such as from grape (Mano et al., 2003a), fruit juice (Liu and Dong,
2007a) or more recently an orange (MacVittie et al., 2015).
EBFC Designs
Most of the present EBFC designs are at the level of proof-of-concept and generally designed
for immersing the electrodes in related fuel stock solution (Ivanov et al., 2010). In the case of
implantable designs, it is still at the stage of utilising electrodes inside the plant, non-mammals
or mammals using appropriate electrode design such as wires or small surfaces (Miyake et al.,
2011; Halámková et al., 2012).
There are, on the other hand, several reports demonstrating different possible designs for
enzymatic biofuel cells including microfluidic cells (Bedekar et al., 2007; Togo et al., 2007),
concentric cells (Habrioux et al., 2008), fuel cells with air breathing cathodes (Sakai et al.,
2009) and modular stack cells (Kamitaka et al., 2007). Figure 1.26 shows examples of different
fuel cell designs reported previously.
The design of the enzymatic biofuel cells is an important issue as miniaturization is a very
important aspect especially for implantable power devices (Ivanov et al., 2010). Each design
addresses particular problems and offers a solution, however, there are no absolute solutions
covering all of the problems of limited power output and low long term stability simultaneously.
Microfluidic biofuel cell design appears to be a solution for the miniaturization problem,
however most of the presented reports based on the diffusional enzyme and mediator
demonstrated that they dissolved in the electrolyte solution flowing through a microchannel
(Zebda et al., 2009; González-Guerrero et al., 2013).
Page 68
Chapter 1. Introduction and Literature Review
39
Figure 1. 26. Schematic presentation of (A) microfluidic fuel cell (B) concentric fuel cell (C)
fuel cell with air breathing cathode (D) stack design fuel cell (Fischback et al., 2006; Lim and
Palmore, 2007; Habrioux et al., 2008; Svoboda et al., 2008).
Air-breathing cathodes also addresses the problem about the low O2 solubility in aqueous
solutions which could be a potential solution for cathode limiting enzymatic biofuel cells by
utilising the gas phase O2 (Smolander et al., 2008). A concentric biofuel cell design similar to
air-breathing cathodes could be used to utilise gas phase O2, however its functionality especially
for implantable applications could be a problem (Habrioux et al., 2008). Stack cells on the other
hand are very suitable for lab scale experiments with their flexible design allowing
electrochemical characterization as well as fuel cell performance measurements (Svoboda et
al., 2008).
Conclusions and Future Outlook on EBFCs
The typical fuel used in current development of the enzymatic biofuel cells is glucose and the
typical oxidant is O2 with GOx being the most widely utilised enzyme for glucose oxidation.
However, other promising enzymes such as P2O could be an alternative with its wide range of
sugar selectivity and structural properties (such as having 4-FAD groups). Fc and its derivatives
are also the most promising mediators when used with an appropriate immobilization strategy.
Depending on the conditions used, Lc or BOD could be utilised for the oxygen reduction
Page 69
Chapter 1. Introduction and Literature Review
40
reaction. BOD has the advantage as it can be used under physiological conditions such as
neutral pH and its DET properties have been extensively reported.
The essential problem for future enzymatic biofuel cells is long-term stability. Unfortunately,
studies addressing this issue in the literature are in the minority. Flow systems using
microfluidic cells could be used to solve this problem as batch designs will not achieve the
desired stability values. Genetically modified enzymes could be another solution to improve
the enzyme stability especially in aerobic conditions. Incorporation of membranes such Nafion®
could also help to improve the stability of the enzymatic electrodes in the biofuel cell. In the
case of implantable devices, long term stable fuel cells are required to compete with the current
technology. Conventional batteries for pacemakers can work up to 10 years where the best
examples of the EBFCs can only go up to months (MacVittie et al., 2015).
There are also thermodynamic limitations such as the potential difference between the anode
and cathode which is dependent on the redox potentials of the enzymes used. This limitation is
followed by kinetic, ohmic and mass transport limitations when extracting power from the
biofuel cell. Therefore, to maintain the voltages required by even the smallest electrical device,
devices such as charge pumps and capacitors could be used. These systems provide sufficient
temporary current without changing the design or construction of the biofuel cell. In this way,
the voltage requirements would be met (Hanashi et al., 2011).
There are different problems and possible solutions for future EBFC designs. However, these
solutions require a multi-disciplinary approach including protein engineering to improve the
properties of biocatalysts, new and better immobilization strategies for more stable electrodes,
incorporation of nanotechnology such as carbon nanomaterials and novel designs such as
microfluidics combined with air breathing designs. Only then, the energy production from
enzymes can make a real impact and benefit medical science and healthcare management.
Review of Methods for Electrochemical Analysis
Electrochemistry can be defined as the field in which the chemical response of systems to
electrical stimulations is associated with charge separation (Bard et al., 1980; Brett et al., 1993).
There is a huge array of different phenomena covered by the field of electrochemistry involving
electroanalytical sensors and fuel cells (Bard et al., 1980).
Page 70
Chapter 1. Introduction and Literature Review
41
There are different purposes that electrochemistry can be employed which might involve
investigations of the electrochemical properties of developed power sources such as fuel cells.
Such investigations can be made by employing electrochemical methods (Bard et al., 1980).
Oxidation/reduction (redox) reactions are often used to provide information about the
concentration, kinetics, reaction mechanism, chemical status and behaviour of a species in
solution.
1.3.1. The Cell Set-up
Most of electrochemical techniques requires three electrodes; the working electrode (WE, e.g.
carbon, graphite, gold etc.), the reference electrode (RE, e.g. SHE, Ag/AgCl, etc.) and the
counter (or auxiliary) electrode (CE, e.g. carbon, platinum, etc.) (Brett et al., 1993). These three
electrodes are placed in a cell connected to a potentiostat (an instrument that controls the
potential of the WE and measures the corresponding current) shown in Figure 1.27. The
potentiostat can control the potential difference and measure the current flow between
electrodes. The RE is essential to control the effects from the electrolyte and CE-electrolyte
interface (Larminie et al., 2003). The current flow takes places between CE and WE whilst the
potential difference is measured between RE and WE.
Figure 1. 27. Simple presentation of an experimental set-up for three-electrode electrochemical
cell.
1.3.2. Electrochemical Characterization
Various parameters can be altered when applying different methods for the investigation of the
electrochemical systems. Such methods involve voltammetry (cyclic voltammetry and linear
sweep voltammetry) and amperometry (chronoamperometry) as well others (such as pulsed
techniques or polarography) (O'Gorman, 1998).
V A
Potentiostat
CE RE WE
Page 71
Chapter 1. Introduction and Literature Review
42
Voltammetry
Cyclic voltammetry (CV) and Linear Sweep Voltammetry (LSV) are two of the most
commonly used electroanalytical techniques in electrochemical systems (Brett et al., 1993).
There are many applications where CV and LSV can be used to gather information about the
reversible/irreversible behavior of redox couples as well as reaction mechanism and diffusion
coefficients (Bard et al., 1980).
Figure 1. 28. (A) CV waveform and (B) typical CV (Princeton)
The CV experiment can be performed using a potentiostat which can apply a potential ramp
between two chosen potentials and reverse it back to the initial potential. The current is
measured during this potential sweep and then can be plotted versus applied potential. In LSV,
on the other hand, the potential is swept in one direction only, rather than cycling it back. Both
can be run as single or multi cycles, however most of the time multi scans are used to allow the
system to reach steady state. A CV waveform and the typical CV voltammogram are shown in
Figure 1.28.
Data Interpretation
There are quite a few parameters that can be extracted from a single CV scan. These include
the cathodic peak height (Ipc), the anodic peak height (Ipa), the cathodic peak potential (Epc) and
the anodic peak potential (Epa). These parameters can provide information about the nature of
the redox reaction takes place (Nicholson, 1965; Brett et al., 1993).
(A) (B)
Page 72
Chapter 1. Introduction and Literature Review
43
Figure 1. 29. Plot of peak height for cadmium reduction at various scan rates (Princeton, 2016).
In general the peak separation is expressed by the equation: where; n is the number of electrons
transferred (Nicholson, 1965). The optimum potential difference between Epa and Epc for one
electron transfer was reported to be 57 mV (Nicholson, 1965).
∆𝐸𝑝 = 𝐸𝑝𝑎 − 𝐸𝑝𝑐 =57 𝑚𝑉
𝑛
(Eq. 1. 1)
The scan rate of the CV can be varied to determine the diffusion coefficient of the redox species.
For a reversible system the peak height will increase linearly with the square root of scan rate.
The slope of the resulting line will be proportional to the diffusion coefficient as seen in Figure
1.29.
This relationship is explained by the Randles-Sevcik equation (Brett et al., 1993):
𝑖𝑝 = 0.4463𝑛𝐺 = 𝐹𝐴𝐶 (𝑛𝐹𝜐𝐷
𝑅𝑇)
12
(Eq. 1. 2)
where ip is the peak current height (A), n is the number of electrons transferred, F is the Faraday
constant (C mol−1), A is the electrode area (cm2), C is the concentration of the electron
transferring species (mol cm-3), v is the scan rate (V s-1), D is the diffusion coefficient of the
electron transferring species (cm2 s-1), R is the gas constant (VC K−1 mol−1) and T is temperature
(K).
Page 73
Chapter 1. Introduction and Literature Review
44
Chronoamperometry
Chronoamperometry (CA) is another commonly used electroanalytical technique especially
used in biosensor and biofuel cell studies to obtain calibration curves and stability studies. In a
typical CA experiment the current response at a certain potential is recorded and can be plotted
as a function of time.
CA experiments can be used to obtain calibration curves by adding the sensing substrate into
the solution and recording the steady state current response over time. For example, in the case
of developing a glucose sensor using glucose based EBFC, the glucose versus steady state
graphs can be obtained. Such graphs then can be used to extract more information such as the
sensitivity, glucose affinity etc.
1.3.3. Fuel Cell Polarization
A polarization curve can be defined as the plot of current (or current density) versus cell
potential (E) as shown in Figure 1.30.
Figure 1. 30. (A) Polarization curve and the losses (Gold, 2012) (B) power curve with
polarization curve for an EBFC (González-Guerrero et al., 2013).
This type of curves can be obtained by applying various resistances to the fuel cell and recording
the voltage-current values generated by the cell (Güven et al., 2016). Figure 1.30 also indicates
that the fuel cell voltage achieved is lower than the theoretical thermodynamic values and the
voltage decreases when the current going through the cell is increased. Polarization curves (with
power curves) can provide very useful information in order to understand and improve the fuel
cell performance such as power and current densities as well as some limitations regarding to
Page 74
Chapter 1. Introduction and Literature Review
45
the system. These limitations are defined as activation-related losses, Ohmic losses and mass
transport related losses (Rayment and Sherwin, 2003; Stolten, 2010)
Briefly the reasons for the losses in different regions can be summarized as follows (Rayment
and Sherwin, 2003; Stolten, 2010):
Activation-related losses: Because of the activation energy of the electrochemical
reaction at the electrodes.
Ohmic losses: Could be caused by many reasons including the ionic resistance in the
electrolyte, electronic resistance in the electrodes or connectors and components etc.
Mass-transfer related losses: Because of the mass transport of the reactant and product
on the electrode.
All of these factors should be taken into account while designing a fuel cell especially
complicated system such as EBFCs because of the involvement of bio-electro-active species.
Page 75
Chapter 1. Introduction and Literature Review
46
Page 76
47
Chapter 2. Electrochemical Glucose Oxidation by Pyranose-2-Oxidase Mutants
for Enzymatic Biofuel Cell Applications
In this chapter, the performance of the pyranose-2-oxidase (P2O) enzyme and its mutants were
electrochemically tested for glucose oxidation and the results were compared with the more
widely used enzyme glucose oxidase (GOx). Electrochemical characterization of the enzymes
was performed in solution with the diffusive mediator ferrocene carboxylic acid (FcCOOH)
using cyclic voltammetry (CV), linear sweep voltammetry (LSV) and chronoamperometry
(CA). Electrochemical tests showed the activity of P2O enzymes for glucose oxidation and
successful electron transfer from enzymes to the electrode via electron transfer mediator. P2O
and its mutants showed simil ar electrochemical behaviour compared to commercial GOx
where P2O-T169G mutant demonstrated better performance especially when oxygen is
saturated in the solution. Stability studies also showed that P2O-T169G mutant was not
significantly affected by the presence of oxygen, whereas GOx was seriously affected. Results
indicate that P2O-T169G is a promising enzyme with good stability and can be used in
enzymatic biofuel cell (EBFC) applications as an alternative to GOx.
2.1. Introduction
P2O (pyranose:oxygen 2-oxidoreductase, EC 1.1.3.10) is a wood degrading enzyme that has
excellent reactivity with alternative electron acceptors for a range of sugar substrates. It was
purified and characterized from several different fungal sources, with trametes multicolor being
the best studied (Leitner et al., 2001; Martin Hallberg et al., 2004).
The first crystal structure of P2O from Trametes multicolor was reported by Hallberg et al.
(2004) using single anomalous dispersion. P2O can oxidase sugars at position C-2 by the Ping
Pong Bi Bi mechanism similar to other oxidoreductases (Wongnate et al. (2011)), as well as
other substrates at position C-3, such as 2-deoxy-ᴅ-glucose, 2-keto-ᴅ-glucose andmethyl β-ᴅ-
glucosides (Martin Hallberg et al., 2004; Wongnate et al., 2011). This enzyme, therefore, has
recently become very popular in the field of enzymatic sensors and biofuel cells because of its
wide range of substrate selectivity and lack of any anomeric selectivity (Spadiut et al., 2010).
The reaction mechanism of P2O consists of oxidative and reductive half reactions. During the
reductive half reaction, the sugar is oxidized to the corresponding sugar derivative and the flavin
adenine dinucleotide (FAD) is reduced to FADH2 shown in (Eq. 2.1). The oxidative half
Page 77
Chapter 2. Electrochemical Glucose Oxidation by P2O Mutants for EBFC Applications
48
reaction consists of the reduction of oxygen (O2) to hydrogen peroxide (H2O2) and the re-
oxidation of FADH2 to FAD shown in (Eq. 2.2) (Kujawa et al., 2006).
FAD + ᴅ-glucose FADH2 + 2-keto-ᴅ-glucose (Eq. 2. 1)
FADH2 + O2 FAD + H2O2 (Eq. 2. 2)
GOx, on the other hand, is the most widely used for glucose oxidation in biofuel cells because
of its well- known structure and good selectivity for glucose (Wilson and Turner, 1992). GOx
catalyses the oxidation of ᴅ-glucose into ᴅ-glucono-1, 5-lactone which then hydrolyses to
gluconic acid. GOx uses FAD as the co-factor responsible for the catalytic reaction (Ivanov et
al., 2010). However, it has significant drawbacks include GOx having restricted turnover rate
for glucose. GOx oxidizes glucose only at the C-1 position, which is a limiting factor in terms
of coulombic efficiency (Zafar et al., 2010). It also has a high turnover rate for O2, that risks
excessive H2O2 production (Zafar et al., 2010). Enzyme turnover rate for O2 becomes essential
in EBFC applications where fuel and oxidant are in the same solution.
The use of P2O in the development of biosensors has been reported in literature, wherein the
co-immobilization of P2O with peroxidase on a carbon paste electrode was one of the earliest
reports (Lidén et al., 1998). A few studies have been reported recently using P2O in biosensor
applications such as wiring different flexible osmium functionalized polymers with P2O on
graphite electrodes (Timur et al., 2006) (Tasca et al., 2007; Zafar et al., 2010). This approach
was reported to provide more efficient electron transfer from the reduced reaction centres of
the enzyme (Timur et al., 2006). A similar strategy was also used in another study supporting
the idea of enhanced electron transfer rate of P2O when wired with osmium polymers (Tasca
et al., 2007).
Although these reports show promising results with osmium polymers, there is a concern about
their use as implantable devices. Osmium compounds are toxic and not biocompatible,
therefore leaching is a serious concern posing a high risk for long term applications (Hao Yu
and Scott, 2010). Another study demonstrates the use of carbon nanotubes (CNTs) with carbon
paste electrodes to fabricate P2O based biosensors (Odaci et al., 2008). Determination of the
glucose levels in wine samples were shown to be consistent with the standard methods (Odaci
et al., 2008). Gold nanoparticles (AuNPs) - polyaniline(PANI)/AgCl/gelatin nanocomposite on
glassy carbon electrode (GCE) was another immobilization method used for P2O where the
enzyme was shown to maintain its bioactivity and stability for glucose sensing applications
Page 78
Chapter 2. Electrochemical Glucose Oxidation by P2O Mutants for EBFC Applications
49
(Ozdemir et al., 2010). Although all the previous reports showed promising results, the wide
sugar selectivity of P2O is reported to have significant disadvantage on its use in biosensor
applications. However, this could be an advantage if it is used in biofuel cells which have not
yet been fully investigated.
One of the biggest challenges for EBFCs is to fabricate long-term stable enzymatic electrodes
for implantable devices or other micro-electronic applications (Calabrese Barton et al., 2004).
Since O2 plays a key role in the enzymatic glucose oxidation reaction as an electron acceptor,
using an enzyme that does not utilise oxygen is a big advantage (Ivanov et al., 2010) because
the enzyme will not have to compete with the electron transfer mediator (if used) to accept
electrons and also the production of H2O2 will be minimized (Ivanov et al., 2010). P2O, in wild
type form, also utilises O2 as an electron acceptor, therefore, H2O2 production during the
oxidation of glucose is a concern.
In this chapter, the use of different mutant P2O enzymes, which have lower turnover rates for
O2, have been investigated in bio-electrochemical systems. The redox behaviour of P2O
enzymes and GOx were characterised using cyclic voltammetry, linear sweep voltammetry and
chronoamperometry with FcCOOH used as an electron mediator. Finally, the results were
compared with commercially available GOx to determine possible applications of P2O in
electrochemical systems.
2.2. Experimental
2.2.1. Materials
FcCOOH, ᴅ-(+)-Glucose and GOx (from Aspergillus niger lyophilized, powder, ~200 U m g-
1) were purchased from Sigma-Aldrich (Dorset, UK). P2O-WT (22 U mg-1) and its mutants
were kindly donated by Prof Chaiyen’s research group in Faculty of Science, Mahidol
University, Thailand. Mutants P2O-T169S (0.6 U mg-1) and P2O-T169G (0.2 U mg-1) were
prepared as described previously using Site-directed mutagenesis at the conserved residue
threonine position (Thr169) of P2O (Pitsawong et al., 2010; Wongnate et al., 2011). The GCE
was purchased from IJ Cambria Scientific Ltd. (Llanelli UK). Stock solutions of glucose were
allowed to mutarotate for minimum 24 h before use and were subsequently kept refrigerated at
4 °C. Stock solution of 1 mM FcCOOH were prepared by dissolving FcCOOH in 100 mM
phosphate buffer solution (PBS) at pH 7 and were subsequently kept refrigerated at 4 °C. All
Page 79
Chapter 2. Electrochemical Glucose Oxidation by P2O Mutants for EBFC Applications
50
the enzyme solutions were made by dissolving and/or diluting the enzyme stock solutions with
100 mM PBS at pH 7 and were subsequently kept at -70 °C.
2.2.2. Electrochemical Measurements
The solutions for the electrochemical tests were prepared by mixing enzyme solutions with
FcCOOH to give a final concentration of 1 mg mL-1 enzyme and 0.5 mM FcCOOH
concentration in a total volume of 2 mL. The electrochemical tests were performed in a three-
electrode electrochemical cell system, in which the working electrode (WE) was GC, a platinum
coil was used as the counter electrode (CE) and the reference electrode (RE) was Ag/AgCl
(~4M saturated KCl gel filled). The GC WE had a diameter of 3 mm and a surface area of 0.071
cm2.
GCE was polished before each experiment with 1 μm diamond and 0.05 μm alumina powder,
rinsed thoroughly with de-ionized (DI) water between each polishing step, sonicated no more
than 3 min in DI water and dried under nitrogen. Prior to the electrochemical tests, the solutions
were saturated with either air or nitrogen between each consecutive glucose additions under
constant stirring.
The potentials described are all versus Ag/AgCl reference electrode unless otherwise specified.
CV, LSV and CA were used to characterize the electrochemical experiments. CV experiments
were performed at different scan rates from 500 mV s-1 to 10 mV s-1, LSV experiments were
performed at 1 mV s-1 and CA experiments carried out applying a constant voltage of 0.35 V
for 1 h and 3 h. All the electrochemical measurements were carried out by an Autolab
potentiostat-galvanostat (PGSTAT101) purchased from Methrom Autolab (Utrecht,
Netherlands).
2.3. Results and Discussion
2.3.1. Electrochemical characterization of Pyranose-2-oxidase and its mutants in solution
The properties of the different P2O enzymes used in this chapter are listed in Table 2.1. It has
been reported previously that the conserved residue Thr169 is situated strategically in the P2O
active site, positioned immediately above the flavin (Martin Hallberg et al., 2004). Therefore,
the mutants prepared by changing the position of Thr169 show different behaviour to the wild
type form regarding glucose oxidation and oxygen affinity (Pitsawong et al., 2010).
Page 80
Chapter 2. Electrochemical Glucose Oxidation by P2O Mutants for EBFC Applications
51
The rate constant (kcat) of P2O-T169S was reported to be higher than P2O-WT and P2O-T169G
for the enzymatic oxidation of glucose. A two-step glucose oxidation mechanism was
previously proposed for P2O-WT, including the flavin reduction and C4a-hydroperoxyflavin
decay in contrast the mutants’ reaction mechanism was proposed to be limited only by the flavin
reduction (Pitsawong et al., 2010). As a result, the kcat of P2O-T169S demonstrated higher
values than it was for P2O-WT. However, the reductive catalytic efficiency (kcat/(Km-Glucose))
for P2O-T169S was similar to that of P2O-WT but very low for P2O-T169G (11 fold lower
value) showing that the reductive half reaction is less affected in P2O-T169S compared to
T169G. When the oxidative catalytic efficiency (kcat/(Km-O2)) values are compared, P2O-
T169S and P2O-T169G have 8 and 549 fold lower values respectively than P2O-WT. This
indicates that the modification at the Thr169 position highly affects the oxidative half reaction
of the enzymes.
Parameters
Enzymes
P2O-WT P2O-T169S P2O-T169G
Rate constants for glucose oxidation -
kcat / s-1
9.7 ± 0.15 13.7 ± 0.2 0.7 ± 0.01
Catalytic efficiency for glucose oxidation
- kcat/(Km-Glucose) / (mM-1 s-1)
8.6 8.1 0.8
Catalytic efficiency for oxygen reduction
- kcat/(Km-O2) / (mM-1 s-1)
110.0 13.8 0.2
Reduction Potential / mV -105 -106 -1
Table 2. 1. The properties of the pyronase-2-oxidase enzymes used in solution experiments
(Wongnate et al., 2011))(Kujawa et al., 2006; Pitsawong et al., 2010).
The reduction potentials of P2O-WT and P2O-T169S are in the same range indicating that the
oxidative power of the mutant P2O-T169S is preserved. For T169G, on the other hand, the
reduction potential is significantly higher than the other enzymes (-1 mV versus -105 mV or
lower) showing an inverse effect for reduction rate constants (more than 10 fold decrease in
reduction rate constant). This suggests that the binding mode of D-Glucose in P2O-T169G is
Page 81
Chapter 2. Electrochemical Glucose Oxidation by P2O Mutants for EBFC Applications
52
different from what in P2O-WT and P2O-196S, thus resulting in lower efficiency of the hydride
transfer from sugar to flavin (Pitsawong et al., 2010). However, P2O-T169G stands out because
of its very low kcat/(Km-O2) values imply poor oxygen affinity which is desirable for EBFCs.
Electrochemical characterization of P2O-WT
Figure 2.1 shows the electrochemical response of P2O-WT (1 mg mL-1) enzyme in solution
with 0.5 mM FcCOOH as an electron mediator in PBS, pH 7. The oxidation and reduction
peaks were observed at 0.370 V and 0.273 V respectively vs Ag/AgCl at 10 mV s-1 scan rate.
Figure 2. 1. (A) CV (scan rate: 10 mV s-1) and (B) LSV (scan rate: 1 mV s-1) scans of nitrogen
saturated solutions with 0 mM and 2 mM concentrations of glucose added to the solution
containing 0.5 mM FcCOOH and 1 mg mL-1 P2O-WT in PBS at pH 7. (GCE surface area:
0.071 cm2).
(A)
(B)
Page 82
Chapter 2. Electrochemical Glucose Oxidation by P2O Mutants for EBFC Applications
53
The peak potentials for both oxidation and reduction processes show a typical FcCOOH
electrochemical response as reported before (Fernández and Carrero, 2005). The difference in
potential between the oxidation (Epa) and reduction (Epc) (peak separation) is 0.097 V and the
peak current ratio (ipa/ipc) is equal to ~1.6 when there is no glucose is present in the solution.
The peak separation for a reversible process is given by the equation explained in Chapter 1
Section 1.3.2. In most cases when E is greater than (0.057/n) the process is called “quasi-
reversible” and it is called “irreversible” when only a single peak is observed for one of the
potential scans (Allen and Larry, 2001). However, in some processes showing slow electron
processes, the peaks can be reduced in size and slightly separated (Ndlovu et al., 2012).
When 2 mM glucose was added to the solution, the oxidation peak was increased and the
reduction peak disappeared. The reason for this disappearance can be explained in terms of fast
kinetics of the oxidative reaction when glucose is present, resulting in the ferrocene (Fc) not
having sufficient time to be reduced on the electrode surface at the given scan rate. This
behaviour suggests the enzyme is active for catalysing glucose oxidation and successful
electron transfer from enzyme to the electrode via the electron transfer mediator.
Figure 2. 2. LSV (scan rate: 1 mV s-1) scans of nitrogen saturated solutions with different
concentrations of glucose added to the solution containing 0.5 mM FcCOOH and 1 mg mL-1
P2O-WT in PBS at pH 7. (GCE surface area: 0.071 cm2).
In the LSV results, the anodic peak was increased by 2 fold upon addition of 2 mM glucose, on
the other hand it did not change much at higher concentrations than this as shown in Figure 2.2.
This type of response indicates the saturation of the catalytic current response due to glucose
Page 83
Chapter 2. Electrochemical Glucose Oxidation by P2O Mutants for EBFC Applications
54
oxidation at the concentration of 2 mM. This saturation current might depend on the enzyme
concentration as well as the glucose oxidation mechanism.
CV scans of the solution experiments with P2O-WT were performed at various scan rates from
0.5 V s-1 to 0.01 V s-1 (original data from Figure A.1 and Figure A.2 in Appendix A). Figure
2.3 shows the peak height (Ipc) is linearly proportional to the square root of scan rate for both 0
mM and 2 mM glucose concentrations. For a reversible diffusive system, the peak height should
increase linearly with the square root of scan rate. Although the peak separation and peak
current ratio data from the CV do not suggest a perfect reversible system, all the scan rates
demonstrate a good degree of linearity. The effect of the glucose can be observed better at
slower scan rates suggesting a slow reaction rate for the system.
It can be seen from Figure 2.3 that the slope of the resulting forward scan is proportional to the
diffusion coefficient by the Randles-Sevcik equation (E.q 1.2 in Chapter 1 Section 1.3.2.
Diffusion coefficient for FcCOOH was calculated as 1.78 and 0.85 x 10⁻⁶ cm2 s-1 for 0 mM and
2 mM glucose concentrations respectively (presented in Table 2.2). This decrease might
indicate slower diffusion for FcCOOH when glucose is present in the solution because
increased concentration of the total species in the solution can be affecting the diffusion of
FcCOOH. As the current is increased due to the oxidation of glucose especially at lower scan
rates, more FcCOOH will be diffusing to electrode at given scan rate and the diffusion of the
species will be adversely affected.
Figure 2. 3. Plot of peak heights at various scan rates for 0 mM and 2 mM concentrations of
glucose added to the solution containing 0.5 mM FcCOOH and 1 mg mL-1 P2O-WT in PBS, at
pH 7. Data obtained from Figure A.1 and Figure A.2 in Appendix A.
Page 84
Chapter 2. Electrochemical Glucose Oxidation by P2O Mutants for EBFC Applications
55
Electrochemical characterization of P2O-T169S
Figure 2.4 shows the electrochemical response of P2O-T169S (1 mg mL-1) enzyme in solution
with 0.5 mM FcCOOH as an electron mediator in PBS, pH 7.
Figure 2. 4. (A) CV (scan rate: 10 mV s-1) and (B) LSV (scan rate: 1 mV s-1) scans of nitrogen
saturated solutions with 0 mM (black) and 2 mM (red) concentrations of glucose added to the
solution containing 0.5 mM FcCOOH and 1 mg mL-1 P2O-T169S in PBS, at pH 7. (GCE,
surface area: 0.071 cm2).
The oxidation and reduction peaks were observed at 0.366 V and 0.273 V respectively vs
Ag/AgCl at 10 mV s-1 scan rate, the peak separation was 0.093 V and the peak current ratio
(ipa/ipc) was equal to ~1.7 when there was no glucose is present in the solution. This was very
similar to the results obtained from P2O-WT suggesting similar electron transfer processes.
(A)
(B)
Page 85
Chapter 2. Electrochemical Glucose Oxidation by P2O Mutants for EBFC Applications
56
The reduction peak disappeared upon addition of 2 mM glucose and the oxidation peak was
increased. LSV scan showed that the anodic peak was increased by almost 3 fold after 2 mM
glucose addition. It can be concluded for the P2O-T169S enzyme that the activity for catalysing
glucose oxidation and successful electron transfer from enzyme to the electrode via electron
transfer mediator was achieved.
The P2O-T169S enzyme also showed increased activity up to 6 mM glucose concentrations as
displayed in Figure 2.5. This value is higher than that observed for P2O-WT. As it was
explained before based on the values presented in Table 1.1, this kind of behaviour between
these two enzymes was expected as P2O-T169S has higher rate constants for the glucose
oxidation reaction.
Figure 2. 5. LSV (scan rate: 1 mV s-1) scans of nitrogen saturated solutions with different
concentrations of glucose added to the solution containing 0.5 mM FcCOOH and 1 mg mL-1
P2O-T169S in PBS, at pH 7. (GCE, surface area: 0.071 cm2).
CV scans of the solution experiments with P2O-T169S were performed at various scan rates
from 0.5 V s-1 to 0.01 V s-1 (Figure A.3 and Figure A.4 in Appendix A). Figure 2.6 shows the
relationship between the peak height (Ipc) and the square root of scan rate for 0 mM and 2 mM
glucose concentrations which is similar to that of the P2O-WT enzyme.
All the scan rates demonstrate a good degree of linearity for both anodic and cathodic current
peak heights. This result supports the voltammograms discussed previously. Diffusion
coefficients for FcCOOH were calculated as 2.28 and 1.00 x 10⁻⁶ cm2s-1 for 0 mM and 2 mM
glucose concentrations respectively.
Page 86
Chapter 2. Electrochemical Glucose Oxidation by P2O Mutants for EBFC Applications
57
Figure 2. 6. Plot of peak heights at various scan rates for 0 mM and 2 mM concentrations of
glucose added to the solution containing 0.5 mM FcCOOH and 1 mg mL-1 P2O-T169S in PBS,
at pH 7. Data obtained from Figure A.3 and Figure A.4 in Appendix A
The relationship between the catalytic current and the concentration of glucose can yield
information about the enzyme substrate kinetics especially when the enzyme is responsive to
increasing additions of glucose. (Thevenot et al., 1999). The apparent Michaelis-Menten
constant Km represents the analyte concentration yielding a response equal to half of its
maximum value for infinite substrate concentration (Thevenot et al., 1999). The Km value can
be calculated using Lineweaver-Burk equation:
(1
𝑖) = (
𝐾𝑚
𝑖𝑚𝑎𝑥) (
1
𝐶) + (
1
𝑖𝑚𝑎𝑥)
(Eq. 2. 3)
where; i and imax and C represent the steady state current, maximum current and glucose
concentration, respectively. Figure 2.7 shows the plot of 1/ i versus 1/C that gives a straight line
with a slope equal to Km/imax and intercept to 1/imax.
Substituting values for intercept and slope in the equation gave the value of 0.91 mM for Km.
This value is close to the value of 1.7 mM presented before calculated using steady state kinetic
assays (Pitsawong et al., 2010). The reason of the shift from the linearity of the Lineweaver-
Burk plots could also be due to mass transport or kinetic limitations caused by the electron
Page 87
Chapter 2. Electrochemical Glucose Oxidation by P2O Mutants for EBFC Applications
58
transfer mechanism between the enzyme/mediator and mediator/electron systems (Uang and
Chou, 2003).
Figure 2. 7. The relationship between peak catalytic current and glucose concentration for P2O-
T169S. Inset: Lineweaver-Burk plot.
Electrochemical characterization of P2O-T169G
Figure 2.8 shows the electrochemical response of the P2O-T169G (1 mg mL-1) enzyme in
solution with 0.5 mM FcCOOH as an electron mediator in PBS, pH7. The oxidation and
reduction peaks were observed at 0.374V and 0.277V vs Ag/AgCl at 10 mV s-1 scan rate
respectively, the peak separation is 0.097 V and the peak current ratio (ipa/ipc) is equal to ~1.7
when there is no glucose is present in the solution. This is also very similar to the results
obtained from P2O-WT and P2O-T169S.
P2O-T169G also demonstrated a very similar catalytic current response after 2 mM glucose
addition. LSV scans also showed that the anodic peak was increased 1.63 fold after 2 mM
glucose addition which as anticipated was smaller than both P2O-WT and P2O-T169S.
However, P2O-T169G demonstrated activity for catalysing glucose oxidation and successful
electron transfer from enzyme to the electrode via electron transfer mediator.
Page 88
Chapter 2. Electrochemical Glucose Oxidation by P2O Mutants for EBFC Applications
59
Figure 2. 8. (A) CV (scan rate: 10 mV s-1) and (B) LSV (scan rate: 1 mV s-1) scans of nitrogen
saturated solutions with 0 mM (black) and 2 mM (red) concentrations of glucose added to the
solution containing 0.5 mM FcCOOH and 1 mg mL-1 P2O-T169G in PBS at pH 7. (GCE
surface area: 0.071 cm2).
Figure 2.9 shows that the P2O-T169G enzyme also showed increasing activity for up to 6 mM
glucose concentrations. It is interesting to note that the catalytic current response of P2O-
T169G is very similar to P2O-T169S although it has lower reaction rate constant. However, as
discussed before, the glucose binding mechanism of P2O-T169G was reported to be different
than that for the wild type and P2O-T169S. It should also be noted that, although the saturation
concentrations are similar, the catalytic current response did not reach the same high values as
P2O-T169S.
(A)
(B)
Page 89
Chapter 2. Electrochemical Glucose Oxidation by P2O Mutants for EBFC Applications
60
Figure 2. 9. LSV (scan rate: 1 mV s-1) scans of nitrogen saturated solutions with different
concentrations of glucose added to the solution containing 0.5 mM FcCOOH and 1 mg mL-1
P2O-T169G in PBS at pH 7. (GCE surface area: 0.071 cm2).
CV scans of the solution experiments with P2O-T169G were performed at various scan rates
from 0.5 V s-1 to 0.01 V s-1 (Figure A.5 and Figure A.6 in Appendix A). The relationship
between the peak height (Ipc) and the square root of scan rate for 0 mM and 2 mM glucose
concentrations can be seen in Figure 2.10.
Figure 2. 10. Plot of peak heights at various scan rates for 0 mM and 2 mM concentrations of
glucose added to the solution containing 0.5 mM FcCOOH and 1 mg mL-1 P2O-T169G in PBS,
at pH 7. (GCE, surface area: 0.071 cm2). Data obtained from Figure A.5 and Figure A.6 in
Appendix A
Page 90
Chapter 2. Electrochemical Glucose Oxidation by P2O Mutants for EBFC Applications
61
The behaviour observed for P2O-T169G was similar to that observed for P2O-WT and P2O-
T169S. Experimental data indicates a good degree of linearity with oxidation and reduction
current peak heights. The diffusion coefficients for FcCOOH calculated using (Eq. 1.2) were
3.98 and 2.32 x 10⁻⁶ cm2 s-1 respectively for 0 mM and 2 mM glucose concentrations.
Figure 2. 11. The relationship between peak catalytic current and glucose concentration for
P2O-T169G. Inset: Lineweaver-Burk plot.
Figure 2.11 shows the plot of 1/ i versus 1/C that gives a straight line with a slope equal to
Km/imax and intercept to 1/imax. According to the intercept and the slope of the equation, Km was
estimated to be 1.04 mM. It is very similar to the previously reported value of 0.9 mM was
calculated using steady state kinetic assays although the electrochemical method has a R2 value
of 0.98506 (Pitsawong et al., 2010).
Comparison between P2O enzymes
Figure 2.12 shows the electrochemical response of the P2O-WT, P2O-T169S and P2O-T169G
enzymes each in solutions of 0.5 mM FcCOOH as an electron mediator in PBS at pH 7 in the
presence of 2 mM glucose concentration. The data is presented in terms of relative increase
from 0 mM glucose concentration to demonstrate the increase from background current (Raw
data is presented in Figure A.7 in Appendix A). The data shows that P2O-T169S has the highest
relative difference response towards glucose.
Both mutants P2O-T169G and P2O-T169S demonstrated a similar response in terms of where
the catalytic current responses start around 0.2 V; the start potential (of oxidation) was slightly
Page 91
Chapter 2. Electrochemical Glucose Oxidation by P2O Mutants for EBFC Applications
62
higher for the P2O-WT at 0.25 V. This could be due to role of Thr169 position and its effect in
the binding mechanism for the glucose oxidation by P2O (Pitsawong et al., 2010). The P2O-
WT showed the same peak current with P2O-T169G, but it also showed a decreased current in
the mass transport region. On the other hand, P2O-T169G was not as affected as by mass
transport as P2O-WT or P2O-T169S. This kind of behaviour could be related to the hemo-
tetrameric structure of the enzyme.
Figure 2. 12. LSV (scan rate: 1 mV s-1) scans of nitrogen saturated solutions with 2 mM
concentrations of glucose added to the solution containing 0.5 mM FcCOOH and 1 mg mL-1
concentrations of P2O-WT, P2O-T169S and P2O-T169G at pH 7. (GCE surface area: 0.071
cm2 and 0 mM concentration data is subtracted from 2 mM concentration data).
The electrochemical behaviour during CV experiments of the three different P2O enzymes have
been summarised in Table 2.2. The enzymes showed similar Epa and Epc values. The peak
current ratios were ca 1.7 for all enzymes. However, the values are all higher than the theoretical
value of 0.059 V, this may be an indication of the quasi-reversible process.
LSV results showed that the increase of catalytic current, upon addition of glucose, from 0 mM
to 2 mM was different for each enzyme. With P2O-T169S showing the highest increase (3 fold)
from 0 mM glucose concertation to 2 mM followed by P2O-WT (2 fold) and P2O-T169G (1.6
fold). These results quasi match the results presented in Figure 2.12.
Page 92
Chapter 2. Electrochemical Glucose Oxidation by P2O Mutants for EBFC Applications
63
Enzyme Epa /V Epc / V E / V Ipa/Ipc
P2O – WT 0.370 0.273 0.097 1.6
P2O – T169S 0.366 0.273 0.093 1.7
P2O – T169G 0.374 0.273 0.097 1.7
Table 2. 2. The electrochemical behaviour of the P2O enzymes used in solution CV
experiments. Tested in nitrogen saturated solutions containing 0.5 mM FcCOOH and 1 mg mL-
1 concentrations of P2O-WT, P2O-T169S and P2O-T169G at pH 7. (GCE surface area: 0.071
cm2, Epa: anodic peak potential, Epc: cathodic peak potential).
Figure 2.13 shows the effect of oxygen on the performance of the P2O mutants in solution. It
can be seen that when oxygen is present in the solution it affects the P2O-T169S enzyme
remarkably (~34 % decrease in the current), but not so much for the P2O-T169G (~10%). This
matches the kcat/(Km-O2) values presented in Table 2.1 (8.1 and 0.8 mM-1 s-1 for P2O-T169S
and P2O-T169G respectively). After reaching the peak potential the current did not decrease
for P2O-T169G, however, it changed by 15-20 % for P2O-T169S in both nitrogen and air
saturated conditions. This is an important outcome regarding the enzyme behaviour in the mass-
transport region.
Figure 2. 13. LSV (scan rate: 1 mV s-1) scans of (A) P2O-T169S and (B) P2O-T169G (both
concentrations are 1 mg mL-1 in PBS) in nitrogen and air saturated solutions with 2 mM
concentrations of glucose added to the solution containing 0.5 mM FcCOOH in PBS at pH 7.
(GCE surface area: 0.071 cm2).
(B) (A)
Page 93
Chapter 2. Electrochemical Glucose Oxidation by P2O Mutants for EBFC Applications
64
This behaviour of P2O-T169G might not be as affected by mass transport limitations as T169S.
This could be an important attribute for P2O-T169G in biofuel cell applications as an alternative
enzyme (P2O-WT shows no difference at 2 mM glucose probably because it is the saturation
glucose concentration). However, the 1 mM glucose result shows remarkable difference when
air is applied as displayed in Figure A.8 in Appendix A).
Enzyme
Diffusion coefficient of FcCOOH / cm2 s-1 x 10⁻⁶
0 mM 2 mM
P2O – WT 1.78 0.85
P2O –T169S 2.28 1.00
P2O – T169G 3.98 2.32
Table 2. 3. Calculated diffusion coefficients for P2O enzymes using Randles-Sevcik equation
at different glucose concentrations.
Table 2.3 presents diffusion coefficients calculated using Randles-Sevcik equation for
FcCOOH when used with P2O enzymes at different glucose concentrations. These values are
within the range of previously reported values of 5.73 x 10⁻⁶ cm2 s-1 for FcCOOH when used
with GOx; a widely employed enzyme in EBFCs from CV experiments (Bartlett and Pratt,
1995).
The diffusion coefficients of the enzymes were decreased upon addition of glucose in all cases
following the trend of P2O-WT< P2O-T169S< P2O-T169G. The diffusion coefficient was
expected to be lower in the presence of glucose as more species in the solution would affect the
FcCOOH being a diffusive mediator. P2O-T169G has the highest value implying better
diffusivity, adds weight to results showing it to be least affected enzyme in the mass transport
limited region of operation.
2.3.2. Electrochemical characterization of Glucose Oxidase in solution and comparison with
P2O enzymes
Figure 2.14 shows the electrochemical response of the GOx enzyme in solution with 0.5 mM
FcCOOH as an electron mediator in PBS, pH 7. The anodic and cathodic peaks were observed
at 0.366 V and 0.270 V respectively vs Ag/AgCl at 10 mV s-1 scan rate, the peak separation
Page 94
Chapter 2. Electrochemical Glucose Oxidation by P2O Mutants for EBFC Applications
65
was 0.096 V and the current peak ratio (ipa/ipc) was ~1.6 when no glucose was present in the
solution.
This is very similar to results obtained with the P2O enzymes indicating P2O enzymes show
similar behaviour in electrochemical systems to GOx. The response of GOx upon addition of 2
mM glucose was also similar to P2O enzymes with the reduction peak disappearing and the
oxidation peak was increasing. Also, LSV scans showed that the oxidation peak was increased
3.3 fold after 2 mM glucose addition which is around the value obtained for P2O-T169S.
Figure 2. 14. (A) CV (scan rate: 10 mV s-1) and (B) LSV (scan rate: 1 mV s-1) scans of nitrogen
saturated solutions with 0 mM (black) and 2 mM (red) concentrations of glucose added to the
solution containing 0.5 mM FcCOOH and 1 mg mL-1 GOx in PBS at pH 7. (GCE surface area:
0.071 cm2).
(A)
(B)
Page 95
Chapter 2. Electrochemical Glucose Oxidation by P2O Mutants for EBFC Applications
66
GOx also showed increasing activity for up to 15 mM glucose concentrations (Figure A.9 in
Appendix A) which is higher than any of the P2O enzymes. This can be explained by
differences in enzyme activities for every mg of enzyme in solution. Although the enzyme
concentrations were same (1 mg mL-1), GOx has higher activity for every mg of enzyme. The
catalytic current response toward glucose starts around 0.2 V which is similar to P2O-T169S
and P2O-T169G whereas the GOx oxidation peak current reached 3.2 A in LSV at 2 mM
glucose. This is ~1.2 fold higher than P2O-T169S in LSV at 2 mM glucose.
CV scans of the solution experiments with GOx were carried out at various scan rates from 0.5
V s-1 to 0.01 V s-1 (Figure A.10 and Figure A.11 in Appendix A). Figure 2.15 indicates the
relationship between the peak height (Ipc) and the square root of scan rate for 0 mM and 2 mM
glucose concentrations. Similarly, results show a good degree of linearity for P2O enzymes
against oxidation and reduction current peak heights.
Figure 2. 15. Plot of peak heights at various scan rates for 0 mM and 2 mM concentrations of
glucose added to the solution containing 0.5 mM FcCOOH and 1 mg mL-1 GOx in PBS at pH
7. (GCE surface area: 0.071 cm2). Data obtained from Figure A.10 and Figure A.11 in Appendix
A.
Diffusion coefficients for FcCOOH with GOx were calculated to be 2.5 and 1.6 x 10⁻⁶ cm2 s-1
for 0 mM and 2 mM glucose concentrations respectively. As previously mentioned these are
also in the same region as previously published values for FcCOOH when used with GOx (5.73
x 10-6 cm2 s-1) (Bartlett and Pratt, 1995).
Page 96
Chapter 2. Electrochemical Glucose Oxidation by P2O Mutants for EBFC Applications
67
Figure 2.16 shows the plot of 1/ iss versus 1/C that gives a straight line with a slope equal to
Km/imax and intercept to 1/imax. From the intercept and slope of the graph, Km was estimated to
be 2.95 mM. The Km value of GOx has been published in literature through data mainly
acquired using immobilised electrodes and therefore hard to compare with solution
experiments.
Figure 2. 16. The relationship between peak catalytic current and glucose concentration for
GOx. Inset: Lineweaver-Burk plot.
Enzyme Km from this study / mM Km reported in literature / mM
P2O –T169S 0.91 1.7 (Pitsawong et al., 2010)
P2O – T169G 1.04 0.9 (Pitsawong et al., 2010)
GOx
2.95 1.5 -27 (Rogers and Brandt, 1971;
Qiu et al., 2009; Fatoni et al.,
2013; Du Toit and Di Lorenzo,
2014)
Table 2. 4. Summary of Km values for the enzymes used
Km values for P2O-T169S and P2O-T169G can be used to measure the affinity between the
enzymes and glucose where high Km values are indicative of weak affinity (Sekretaryova,
2014). For the solution experiments comparing the Km values can help us to understand the
affinities of the enzymes used towards glucose. Table 2.4 summarises the Km values calculated
Page 97
Chapter 2. Electrochemical Glucose Oxidation by P2O Mutants for EBFC Applications
68
in this study and reported in literature for P2O mutant enzymes and GOx. The Km value for
P2O-T169S was similar to that of P2O-T169G (0.91 mM versus 1.04 mM). The Km values of
1.7 mM and 0.9 mM reported previously from steady-state kinetic experiments (Pitsawong et
al., 2010) for the P2O-T169S and P2O-T169G, are similar to those obtained electrochemically,
but with P2O-T169S showing slightly better affinity in the electrochemical system.
The reported values of Km for GOx show wide range of values from 1.5 mM to 27 mM (Rogers
and Brandt, 1971; Qiu et al., 2009; Fatoni et al., 2013; Du Toit and Di Lorenzo, 2014). The
value of 2.95 mM for GOx is ~3 fold higher than the values calculated for P2O-T169S and
P2O-T169G in this study showing P2O mutants have greater affinity towards glucose when
compared to GOx which is an essential discovery when considering the use of P2O enzymes
for biofuel cell applications.
Effect of oxygen for glucose oxidation with P2O-T169G
To compare the effect of oxygen, chronoamperometry was carried out between the widely used
enzyme GOx and the oxygen resistant mutant P2O-T169G. Experimental conditions were the
same as for the voltammogram experiments and the duration of the experiments were 1 h
(Figure 2.17) and 3 h long (Figure 2.18).
Figure 2. 17. CAs (1 h length) of air saturated solutions for GOx and P2O-T169G (both 1 mg
mL-1) at 0.350 V for 0 mM and 4 mM concentrations of glucose added to the solution containing
0.5 mM FcCOOH, at pH 7. (GCE, surface area: 0.071 cm2).
Glucose addition and
stirring for 600 s
for 10 inutes
Page 98
Chapter 2. Electrochemical Glucose Oxidation by P2O Mutants for EBFC Applications
69
Figure 2. 18. CAs (3 h length) of air saturated solutions for GOx and P2O-T169G (both 1 mg
mL-1) at 0.350 V for 4 mM concentration of glucose added to the solution containing 0.5 mM
FcCOOH, at pH 7. (GCE, surface area: 0.071 cm2).
In the short (1 h) CA experiments, where no glucose is present in solution, the current lost ~67
% and ~70 % of its initial value and stabilised within few min for GOx and P2O-T169G
respectively while the presence of oxygen did not significantly alter the current. After the
addition of 4 mM glucose, the current showed a sharp drop from its initial value and then
reached a plateau. By looking at the difference in current density between the plateau region
and at the end of 1 hr, GOx shows a ~53 % drop under air-saturated conditions while there is
no remarkable change for P2O-T169G.
Although the current value for P2O-T169G was initially lower than that for GOx in line with
voltammogram experiments, the current value for P2O-T169G remained higher than GOx after
1 h. It was deduced that the net current difference at the end of 1 hr between GOx and P2O-
T169G was 0.8 µA with P2O-T169G having 1.45 fold higher current. This demonstrates that
the effect of oxygen on the performance of P2O-T169G is low, whereas it causes a significant
performance loss for GOx. (The raw data for both enzymes were presented in Figure A.12 and
Figure A.13 in Appendix A). Figure 2.18 shows the behavior of enzymes with 4 mM glucose
concentration over 3 h. As with the 1 h CA experiments, the differences in current values were
calculated from the plateau to the end of the 3 h. The change in current density under air
saturated conditions for GOx was ~61%, whereas it was ~28 % for P2O-T169G. Also, the net
current difference at the end of 3 hrs between GOx and P2O-T169G was ~21 %.
Page 99
Chapter 2. Electrochemical Glucose Oxidation by P2O Mutants for EBFC Applications
70
P2O-T169G was not affected from the presence of oxygen as much as GOx as confirmed by 1
h and 3 h stability experiments. Although ~28 % of its initial current density was lost during
the 3-hrs, this loss was observed both in air and nitrogen saturated conditions suggesting that
oxygen is not the reason for the decreased current (Figure A.14 in Appendix A). This could
because a consequence of it being in solution as it is known that enzymes are very instable
when used in solution (Wu et al., 2015). In contrast, it was observed that GOx lost more of its
current under air saturated conditions (Figure A.15 in Appendix A). The results from 1-hr and
3-hrs experiments show that P2O-T169G could be a good alternative to GOx because of its
good stability and oxygen resistance.
2.4. Conclusions
In this chapter, the performance and the feasibility of P2O enzymes have been investigated for
EBFCs using solution experiments (enzyme free in solution and not immobilised on electrode).
The electrochemical tests showed P2O activity for catalysing glucose oxidation and successful
electron transfer from enzyme to the electrode via an electron transfer mediator FcCOOH.
P2O enzymes showed similar electrochemical behaviour between each other and commercial
GOx with P2O-T169S exhibiting the highest catalytic current response. P2O-T169S and P2O-
T169G also had higher glucose saturation concentrations than the wild type enzyme. Also the
affinities of P2O-T169S and P2O-T169G towards glucose was found to be better than GOx
which is an important consideration for EBFCs. Voltammograms showed that the current
response of P2O-T169G in the region of mass transport limitations was better than other
enzymes.
The oxygen resistance and its effect on stability of the enzymes has been tested with P2O-
T169G showing a very good resistance against oxygen. The decrease in current for P2O-T169G
was found to be only ~10% whereas it was ~34% for P2O-T169S when oxygen was present in
the solution (shown from LSV data). Further stability experiments have been carried out to
compare the promising performance of P2O-T169G with GOx. The results showed that oxygen
had negligible effect on P2O-T169G activity with oxygen (10%), whereas GOx lost ~53% and
~61% of its current in short and long stability experiments respectively. This is very important
finding for P2O-169G which recommends this enzyme as an alternative for GOx.
These results are similar to the results reported based on steady-state kinetic experiments,
therefore electrochemical validation of the values in literature was achieved. In conclusion, this
Page 100
Chapter 2. Electrochemical Glucose Oxidation by P2O Mutants for EBFC Applications
71
study suggests that P2O-T169G could be an alternative to GOx by virtue of its good oxygen
resistance and stability in EBFC applications. Using enzymes in solution, however, is not
practical. If used in immobilised systems, performance and long-term stability of EBFCs could
be even greater enhanced. Further studies on enzyme electrode with immobilised enzymes for
glucose oxidation and EBFCs are discussed in Chapter 3 and Chapter 4.
Page 101
Chapter 2. Electrochemical Glucose Oxidation by P2O Mutants for EBFC Applications
72
Page 102
73
Chapter 3. Immobilization of Mutant P2O and GOx on Pyrenyl Carbon
Structures for Glucose Oxidation
In this chapter, immobilization onto an electrode of the oxygen resistant mutant P2O-T169G
was carried out and compared with glucose oxidase (GOx) using electrochemical
characterization techniques. In the first part, enzymes were immobilised on carbon surface by
crosslinking on pyrenyl carbon structures and ferrocene carboxylic acid (FcCOOH) was used
as an electron mediator in solution. This was followed by immobilization of both enzyme and
mediator using a novel immobilization technique, in which, a mixture of ferrocene (Fc), nafion®
and multi-walled carbon nanotube (MWCNT) was coated on electrode surface, followed by an
electrochemical treatment where enzymes were crosslinked on pyrenyl carbon nanostructures.
The Fc-Nafion-MWCNTs electrode was optimized using voltammetry and the morphology of
the electrode was investigated by scanning electron spectroscopy (SEM). The performance of
the oxygen resistant P2O-T169G was compared with GOx in terms of electrochemical activity,
glucose affinity and effect of oxygen on enzyme performance and stability. Enzymatic
electrodes demonstrated enhanced current values compared to solution studies when
immobilised on electrode surface. The Michaelis-Menten constant, Km values of 0.68 mM and
0.17 mM for P2O-T169G and GOx, respectively, suggest good affinity towards glucose for
both of the enzymes. Finally, P2O-T169G showed promising performance especially in terms
of stability.
3.1. Introduction
One of the most important aspects for enzymatic electrode fabrications is stability because
enzymes are very sensitive to environmental conditions because of their intrinsic nature (Yang
et al., 2012). Immobilization matrixes might solve this problem by protecting the biological
species from environmental effects and result in more efficient and stable performance (Yang
et al., 2012). Immobilization can also achieve high density of enzymes on electrode surfaces
providing enhancement in performance and improved electron transfer kinetics (Shuler et al.,
1986; Cooney et al., 2008).
There are different ways of constructing enzyme electrodes for enzymes and mediators
including physical and chemical methods in which the electrode material is a crucial aspect.
Some of the most widely used processes are basic physical adsorption, covalent attachment,
crosslinking, wiring and entrapments in polymeric gels (Cooney et al., 2008; Hao Yu and Scott,
Page 103
Chapter 3. Immobilization of Mutant P2O and GOx on Pyrenyl Carbon Structures for Glucose Oxidation
74
2010; Ivanov et al., 2010). All techniques have their specific advantages and disadvantages
based on the applications employed.
The use of Fc and its derivatives as redox mediators between enzymes and electrodes have been
very popular (Li et al., 1997; Miao et al., 2001; Razumien et al., 2003; Kase and Muguruma,
2004). This is because ferrocene/ferrocinium (Fc/Fc+) can replace O2 in the reaction as
explained in Chapter 2.1, eq. 2.2. because it’s a good electron acceptor (Cass et al., 1984; Ghica
and Brett, 2005). The diffusive feature of Fc makes it very attractive as a mediator because it
can shorten the electron transfer distance (Bartlett and Pratt, 1995). One of the first reports
about electron transfer based on mediators demonstrated that Fc and its different derivatives
are efficient electron acceptors for enzymes such as glucose oxidase (Cass et al., 1984).
Some of the most important properties of Fc and its derivatives can be summarized as easy
derivatization, fast electron transfer kinetics and stable structure either in oxidized or reduced
state (Harper and Anderson, 2010). Fc was also suggested as a possible dietary iron supplement
(‘haematinic’) at appropriate doses in humans (Stepnicka, 2008) which is important as
biomedical applications requires biocompatibility. Fc molecule is known to be insoluble in
water, however, some of its derivatives such as FcCOOH are water soluble due to having the
carboxylic acid group (O'Gorman, 1998). FcCOOH could be a good alternative to Fc in the
applications of redox reactions in aqueous media. There is, however, a need for immobilizing
Fc onto electrodes for enzyme-mediator immobilised systems in biomedical applications.
Polymeric materials are widely used in fabricating enzyme electrodes for biosensor and biofuel
cell applications (Sarma et al., 2009; Wang et al., 2009b). It is possible to use different
polymeric materials for many different purposes such as mediation of electrons, ion-selective
membranes or in the form of polymer matrixes for entrapment of proteins (Yang et al., 2012).
The most widely used polymers can be listed as nafion®, chitosan, poly-pyrrole polyaniline,
polyphenol, poly-thiophene, poly-1,3-phenylenediamine, polyvinyl pyridine, polyvinyl
alcohol, polycarbonate, and nylon (Haccoun et al., 2006; Linford and Schlindwein, 2006;
Zheng et al., 2006). Early studies about Fc mediated enzyme electrodes had low stability as
they were suffering from enzyme leaching or denaturation (Brooks et al., 1988).
Different configurations utilising Fc with polymeric materials have been studied to overcome
the problems of Fc mediated enzyme electrodes. The encapsulating method uses conducting
polymers such as polypyrole (Fiorito and Torresi, 2001; Vidal et al., 2002), polyphenols
Page 104
Chapter 3. Immobilization of Mutant P2O and GOx on Pyrenyl Carbon Structures for Glucose Oxidation
75
(Nakabayashi et al., 1998) or cellulose acetate membranes (Tkáč et al., 2002). Chitosan, for
instance, was used with Fc in a “sandwich” configuration followed by the immobilization of
GOx using glutaraldehyde (Miao et al., 2001). Fc was also entrapped in polyacrylamide-based
redox hydrogels (Bu et al., 1998) or in sol-gel materials (Li et al., 1997; Bu et al., 1998; Yang
et al., 2003) to obtain efficient enzymatic electrodes. Among all different methods, crosslinking
of Fc to polymers such poly-ethylenimine (PEI) (Merchant et al., 2007), utilising single-walled
(Nazaruk et al., 2010) or multi-walled carbon nanotubes (Qiu et al., 2009) and also mixture of
PEI with MWCNTs (Arribas et al., 2007; Rubianes and Rivas, 2007; Laschi et al., 2008; Yan
et al., 2008) and SWCNTs (Tran et al., 2011) have also been reported for amperometric glucose
detection. Enzyme leaching from the polymer films, on the other hand, still is a concern
especially for continuous monitoring systems or biofuel cells requiring long operational times.
Among all other polymers used in the field, nafion®, a perfluorosulfonic acid cation-exchange
polymer, can be used as a protective and encapsulating material in the fabrication of enzyme
electrodes (Harkness et al., 1993). Nafion® consists of a hydrophilic and hydrophobic phase
(Vishnyakov and Neimark, 2001). Water can be adsorbed into these two domains with ion
conductivity taking place in the hydrophilic phase (Blake et al., 2005). Nafion® has many
advantages for its use in enzymatic electrode fabrication summarised as: excellent ion
conduction properties (Moore et al., 2004), biocompatible interface and compatibility with
mammalian tissue (essential for implantable medical applications) (Turner et al., 1990),
hydrophilic and hydrophobic properties, being chemically inert, and exhibiting long-term
chemical stability due to its polytetrafluoroethylene (PTFE) backbone (Blake et al., 2005).
Incorporating Fc with nafion® in polymeric films is a straightforward method for amperometric
glucose detection (Chen et al., 1992; Dong et al., 1992; Harkness et al., 1993; Brown and
Luong, 1995; Vaillancourt et al., 1999). Fc containing nafion® polymer films can be applied to
enzymatic electrode fabrication in many ways. The attachment of the enzymes to the surface of
a nafion® modified electrode (Dong et al., 1992), electro-polymerizing a conducting polymer
or Fc derivative on nafion®-enzyme electrode (Brown and Luong, 1995) or casting enzyme
solution before the nafion® layer to trap the enzyme (Ghica and Brett, 2005; Mani et al., 2013)
and entrapping the enzyme within the nafion® polymer (Harkness et al., 1993; Vaillancourt et
al., 1999) have been previously reported to utilise Fc and nafion® with enzymes for fabrication
of enzyme electrodes. When used in enzymatic systems nafion® content plays essential role in
deactivation of the enzymes because of its acidic nature (Karyakin et al., 1996; Moore et al.,
Page 105
Chapter 3. Immobilization of Mutant P2O and GOx on Pyrenyl Carbon Structures for Glucose Oxidation
76
2004). Solutions of nafion® with high ethanol content was reported to have well dissolved
nafion® and more stable films were observed compared to conventional methods including
excessive dilution of nafion® (Merotra, 2013). However, more stable films can be obtained by
incorporating enhanced materials such as carbon nanotubes (CNTs).
Nanomaterials have been very popular for electrode modification processes over a decade. One
of the most commonly used nanomaterial in enzymatic electrodes are CNTs mainly because of
their enhanced mechanical and electrical properties (Britto et al., 1999; Baughman et al., 2002).
In particular, non-covalent binding of molecules to the CNTs sidewalls has become very
popular recently. Obtaining strong π- π interactions using pyrene and its derivatives provides
wide range of possibilities for enzyme immobilization (Jönsson-Niedziolka et al., 2010). This
approach has been widely used in the field of enzymatic biofuel cell electrodes (Halámková et
al., 2012; Szczupak et al., 2012; MacVittie et al., 2013; Güven et al., 2016).
Incorporating MWCNTs into Fc-Nafion solutions might increase the electrical and mechanical
properties of coated films. High surface area carbon material on the electrode surface can
provide successful crosslinking of enzymes using pyrene and/or its derivatives. It has been
reported that dispersions prepared using MWCNTs and Nafion® showed promising results for
CNTs based biosensors such as for bilirubin determination (Filik et al., 2015),
electrochemically reduced graphene oxide (rGO) / MWCNTs glucose biosensors (Mani et al.,
2013) and graphene/gold/Nafion bio-composite materials (Zhou et al., 2010).
The use of P2O in the literature was summarised in Chapter 1, Section 1.2.1 and Chapter 2,
Section 2.21. The immobilization of P2O was recently achieved by direct adsorption of the
enzyme on meso-porous carbon and dried electrodes were coated with nafion® solution which
was then tested as biosensor and biofuel cell (Kwon et al., 2014). Although the biosensor and
biofuel cell tests showed promising results, there was no information in the preliminary study
about the leaching of adsorbed enzyme species into solution or the stability of the system.
MWCNT dispersions of Fc-Nafion mixture in high ethanol content can be used as electrically
conductive, stable and biocompatible electrode coating. Functionalizing the sidewalls of coated
MWCNTs with pyrene and/or its derivatives can provide simple and effective way of
immobilizing enzymes for biofuel cell applications. P2O-T169G demonstrated promising
results due to its low turnover rates and good stability in the presence of oxygen (Chapter 2,
Page 106
Chapter 3. Immobilization of Mutant P2O and GOx on Pyrenyl Carbon Structures for Glucose Oxidation
77
Section 2.3.1). Immobilizing oxygen resistant P2O-T169G enzyme to construct enzymatic
electrodes can represent a new approach in the literature for biofuel cell applications.
3.2. Experimental
3.2.1. Materials
Fc, 1-pyrenebutyric acid (pyrene), 1-pyrenebutyric acid N-hydroxysuccinimide ester (PBSE),
1-ethyl-3-(3-dimethylaminopropyl) carbodiimide (EDC), N-Hydroxysuccinimide (NHS),
nafion® (perfluorinated resin solution, 5 wt. % in mixure of lower aliphatic alcohols and water
contains 45% water), dimethylformamide (DMF), ethanol (EtOH) and sodium hydroxide
(NaOH) were purchased from Sigma-Aldrich (Dorset, UK). Universal indicator paper was
purchased from VWR International LTD (Leicestershire, UK). Multi-walled carbon nanotubes
(MWCNTs) (inner diameters of 20-50 nm and outer diameters of 70-200 nm) were obtained
from Applied Sciences Inc. (Ohio, USA).
Stock solutions of 0.01 M pyrene and PBSE were prepared by dissolving pyrene and PBSE in
DMF and kept refrigerated in a dark bottle at 4 °C. A fresh mixture of EDC and NHS was
dissolved in deionized water (~18 MΩ-cm) before each experiment to give final concentrations
of 0.1 M and 0.4 M respectively. All the enzyme solutions were made by dissolving and/or
diluting the enzyme stock solutions with 0.1 M PBS at pH 7 and were subsequently kept at -70
°C.
Figure 3. 1. Carbon screen printed electrodes (SPEs) used for the electrochemical experiments;
DRP-C110 (left) and DRP-C1110 (right) (DropSens, 2016)
Page 107
Chapter 3. Immobilization of Mutant P2O and GOx on Pyrenyl Carbon Structures for Glucose Oxidation
78
Carbon screen-printed electrodes (Carbon SPE, model DRP-C110 and model DRP-C1110)
were purchased from DropSens (Oviedo, Spain). Figure 3.1 shows the carbon SPEs where, the
DRP-C110 model has a WE diameter of 0.40 cm and a surface area of 0.126 cm2 and the DRP-
C1110 model has two elliptic working electrodes with a surface area of 0.059 cm2. Before used,
the reproducibility of the SPEs were investigated to ensure the electrodes are stable throughout
the study (Figure B.1 in Appendix B). The reference electrodes were silver/silver ion (Ag/Ag+)
(~ -0.15 V vs Ag/AgCl) and the counter electrodes were carbon. The dimensions of the
electrodes are 33 x 10 x 0.5 mm (Length x Width x Height) respectively. The electrodes were
stored at room temperature in a dry place and no pre-treatment was required. All other materials
were purchased as described in Section 2.2.1.
3.2.2. Preparation of Ferrocene-Nafion Redox Polymer with Multi-Walled Carbon Nanotubes
(Fc-Nafion-MWCNTs)
The preparation of Fc-Nafion redox polymer was reported previously in the literature (Merotra,
2013). In order to increase the electrical conductivity of the redox polymer and incorporation
of a high surface area carbon support for enzyme immobilization, a new modified procedure
was carried out. Briefly, nafion® (5 wt. %) was diluted to 1 wt. % in solution with 90 % EtOH.
Then, this solution was neutralized to pH 7 with dropwise addition of concentrated NaOH. The
pH of the solution was checked with pH indicator paper between each step until desired pH was
achieved. Fc was then dissolved in the neutralized solution to give 0.025 M of Fc-Nafion
solution. The final form of the solution was achieved by mixing 1 mg of MWCNTs with the
solution and sonicating for 3 h.
3.2.3. Fabrication of Enzyme Electrodes
Fabrication of crosslinked enzyme electrodes on unmodified carbon SPE
Enzyme immobilization based on chemical crosslinking of the enzymes on pyrenyl carbon
nanostructures has been reported in the literature (Krishnan and Armstrong, 2012). In this study,
immobilization of the enzymes on carbon surface of the carbon SPE was carried out using
similar procedure, as follows; 20 µL of pyrene solution (10 mM in DMF) was absorbed on
carbon SPE in the dark for 40 min to obtain strong π-π stacked structures between carbon and
pyrene. Then, the electrode was rinsed with de-ionized water consecutively. The free carboxylic
groups of pyrene were treated for 20 min using freshly prepared 20 µL of 0.4 M EDC and 0.1
M NHS mixture. The electrode was then again rinsed with de-ionized water. Finally, the
Page 108
Chapter 3. Immobilization of Mutant P2O and GOx on Pyrenyl Carbon Structures for Glucose Oxidation
79
enzyme electrode was rinsed with PBS at pH 7 before it was electrochemically tested. This
process is outlined in Fig 3.2 (A)
Figure 3. 2. Schematic representation of crosslinking of enzymes on bare carbon electrode (A)
and on Fc-Nafion-MWCNTs (B)
Fabrication of Fc-Nafion-MWCNTs modified enzyme electrodes
A solution of Fc-Nafion-MWCNTs (preparation described in Section 3.2.2) was drop coated
onto carbon SPE in small additions with drying time allowed between each step. Then, the dried
electrode was placed in a cell and a preconditioning step of 20 cyclic voltammetry (CV) scans
at 50 mV s-1 between -0.4 V and 0.4 V (vs Ag) was applied, similar to the reports elsewhere
(Dong et al., 1992). It was reported that the preconditioning step accumulates Fc+ inside the
ionic structure of Nafion® decreases the hydrophobicity of the Nafion® layer resulting in better
enzyme immobilization (Merotra, 2013). After the preconditioning step, the electrode was
washed with de-ionized water, dried in an oven at 35 for 10 mins and stored at room
temperature ready for enzyme immobilization. Immobilization of the enzymes was performed
as shown Figure 3.2 (A). A different pyrenyl compound, PBSE (10 mM in DMF) was used to
activate Fc-Nafion-MWCNTs electrode for 1h. Since it has an N-hydroxysuccinimide group
attached to the acid, it eliminates the extra EDC+NSH step hence resulting in easier fabrication
of enzyme electrodes. The fabrication of crosslinked enzyme electrodes is shown in Figure 3.2
(A)
(B) (B)
Page 109
Chapter 3. Immobilization of Mutant P2O and GOx on Pyrenyl Carbon Structures for Glucose Oxidation
80
(B). SPEs, Fc-Nafion-MWCNTs modified SPEs, PBSE activated Fc-Nafion-MWCNTs
modified SPEs and enzyme adsorbed Fc-Nafion SPEs were tested to ensure this method
provides successful crosslinking of the enzymes and successful electron transfer between the
enzyme and electrode. These results were shown in Figure B.2, B. 3 and B. 4 in Appendix B)
3.3. Electrochemical Measurements
All the electrochemical measurements were carried out by an Autolab potentiostat-galvanostat
(PGSTAT101) in an electrochemical cell (shown in Figure 3.3) containing 500 µL of electrolyte
solution (either 0.5 mM FcCOOH in PBS or PBS only, both at pH 7).
Figure 3. 3. Experimental set-up for electrochemical experiments.
Prior to the electrochemical tests the solutions were saturated with either air or nitrogen before
and between each consecutive glucose additions. Cyclic voltammetry (CV), linear sweep
voltammetry (LSV) and chronoamperometry (CA) were used to characterize the enzyme
Page 110
Chapter 3. Immobilization of Mutant P2O and GOx on Pyrenyl Carbon Structures for Glucose Oxidation
81
electrodes. CV experiments were performed at different scan rates from 500 mV s-1 to 5 mV s-
1, LSV experiments were performed at 1 mV s-1 and CA experiments were carried out by
applying constant voltage over time and recording the steady state current after consecutive
glucose additions in every 10 min. Also, CA for longer hours under constant nitrogen or air
sparging was carried out for stability analysis.
3.4. Results and Discussion
3.4.1. Enzyme electrodes in solution with FcCOOH
P2O-T169G and GOx enzymes were immobilised on pyrene activated carbon surface by cross-
linking and electrochemically tested using cyclic and linear sweep voltammetry techniques in
solutions of 0.5 mM FcCOOH (as an electron mediator) in PBS at pH 7. Figure 3.4 shows the
electrochemical response of P2O-T169G and GOx to 0 mM and 4 mM glucose in solution with
0.5 mM FcCOOH.
Redox potentials obtained from Fc and its derivatives used in glucose oxidation were reported
in literature in the range of 0.25 and 0.6 V vs Ag/AgCl (Nakabayashi et al., 1998; Koide and
Yokoyama, 1999; Fiorito and Torresi, 2001; Miao et al., 2001; Tkáč et al., 2002; Kase and
Muguruma, 2004) for difference solvents. The results showed the activity of FcCOOH when
there is no glucose present in the solution (Figure 3.4 black line). The electrochemical response
of the enzymes was observed upon glucose addition into the solution at around the same redox
potentials of FcCOOH suggesting successful mediation of the electrons from enzyme to
electrode had been achieved.
Although both enzymes showed similar onset potentials of around -0.1 V when glucose was
added, the peak potential of P2O-T169G shifted negatively by about 0.07 V. This could be
related to the experimental conditions of the CV as this difference was not observed for LSV at
1 mV s-1 (5 fold slower than CV, Figure B5 in Appendix B). The negative potential shifts of
the oxidation current peaks were reported previously when Fc is used in solution with enzymes
(Stepnicka, 2008).
Page 111
Chapter 3. Immobilization of Mutant P2O and GOx on Pyrenyl Carbon Structures for Glucose Oxidation
82
Figure 3. 4. CV (scan rate: 5 mV s-1) scans of (A) P2O-T169G and (B) GOx immobilised on
carbon SPE. Tested in nitrogen saturated solutions with 0 mM and 4 mM concentrations of
glucose added to the solution containing 0.5 mM FcCOOH in 0.1 M PBS at pH 7. Ag is the
silver/silver ion reference electrode used on the SPE (SPE surface area: 0.126 cm2).
GOx showed a similar response with the solution experiments discussed in Chapter 2, where
the reduction peak for the reaction between the enzymes and the mediator disappeared due to
the fast kinetics of the oxidative reaction. The enzymatic electrode showed increasing activity
up to 10 mM glucose concentration (Figure B.6 and Figure B.7 in Appendix B). On the other
hand, when P2O-T169G was used, the electrode showed increasing activity only up to 6 mM
glucose concentration (Figure B. 8, also LSV results: Figure B.5 in Appendix B). This is similar
to the results where both enzymes and the mediator were in the same solution discussed in
Chapter 2.
(A)
(B)
Page 112
Chapter 3. Immobilization of Mutant P2O and GOx on Pyrenyl Carbon Structures for Glucose Oxidation
83
Although the same concentrations of the both enzymes were used in the cross-linking reaction
(1 mg mL-1) there could be different enzyme loadings on the carbon surface. As previously
discussed in Chapter 1, Section 1.2.1, P2O enzyme has a different structure than GOx and this
could be affecting the cross-linking reaction. It should also be noted that the activity of the
mutant enzyme P2O-T160G is lower than the commercial GOx. The electrochemical responses
of both enzymes were similar to each other, however, P2O-T169G showed higher background
current than GOx when there was no glucose present. This could be related to the
intramolecular electrostatic interactions between the enzymes and FcCOOH mediator
(Stepnicka, 2008).
Table 3. 1. Summary of the electrochemical characteristics of P2O-T169G and GOx enzymes
immobilised on carbon SPE. Tested in nitrogen saturated solutions with 0 mM and 4 mM
concentrations of glucose added to the solution containing 0.5 mM FcCOOH in 0.1 M PBS at
pH 7. (SPE surface area: 0.126 cm2).
The summary of the electrochemical data derived from the CV results is presented in Table 3.1.
It was noted that the anodic potential for P2O-T169G was more positive than the GOx when
there is no glucose present, however, the results grew closer upon addition of glucose. This
might be related to the electrostatic interaction between the enzymes and Fc. P2O is a bigger
molecule with 4 times more FAD centres as explained before (Chapter 1, Section 1.2.1) so it
might cause different interactions with Fc. The differences in potential between anodic and
cathodic peaks were higher than the theoretical value of a reversible reaction (Scholz, 2010).
The reason for this could be the crosslinked enzyme on the electrode surface affecting the redox
reaction. The high peak current ratios also suggest that the anodic reaction was faster than the
cathodic reaction and increased further when more glucose was added showing fast reaction
and mediation by FcCOOH at given scan rate.
Enzyme Epa / V Epc / V E / V Ipa/Ipc
P2T169G
0 mM 0.320 0.020 0.300 1.64
4 mM 0.270 -0.020 0.290 3.17
GOx
0 mM 0.210 0.040 0.170 1.69
4 mM 0.230 - - -
Page 113
Chapter 3. Immobilization of Mutant P2O and GOx on Pyrenyl Carbon Structures for Glucose Oxidation
84
Figure 3. 5. (A) CA experiment at 0.2 V (vs Ag) of various glucose concentrations for P2O-
T169G enzyme immobilised on carbon SPE, (B) Current values for various glucose
concentrations derived from (A) and (C) the calibration curve for the linear region. Tested in
saturated solutions of 0.5 mM FcCOOH in PBS at pH 7. Ag is the silver/silver ion reference
electrode used on the SPE (SPE surface area: 0.126 cm2). Error bars are sample standard
deviations of measurements on n = 2 samples.
Figure 3.5 shows the results derived from CA experiments performed at 0.2 V by recording the
steady state current after consecutive glucose additions every 10 min under air and nitrogen
saturated solution conditions. P2O-T169G showed increasing current after every glucose
addition up around 4 mM glucose concentration and linearity up to 3 mM glucose concentration
(R2=0.97 and R2=0.96 for nitrogen and air respectively). The performance of the enzyme did
not decrease in the presence of oxygen, the current was also slightly higher which could be
because of the oxidative nature of the oxygen.
The CA results of GOx showed similarities to P2O-T169G with the current increasing after
each glucose addition up to around 8 mM glucose concentration and linearity up to 6 mM
glucose concentration (R2=0.98 and R2=0.97 for nitrogen and air respectively). Figure 3.6
shows the results derived from CA experiments for GOx performed at 0.2 V by recording the
Increasing glucose concentrations
(A) (B)
(C)
Page 114
Chapter 3. Immobilization of Mutant P2O and GOx on Pyrenyl Carbon Structures for Glucose Oxidation
85
steady state current after consecutive glucose additions every 10 min under air and nitrogen
saturated solution conditions. GOx showed higher current values and slightly better linearity
compared to P2O-T16G which was expected due to the higher activity of GOx.
Figure 3. 6. (A) CA experiment at 0.2 V (vs Ag) of various glucose concentrations for GOx
enzyme immobilised on carbon SPE, (B) Current values for various glucose concentrations
derived from (A) and (C) the calibration curve for the linear region. Tested in saturated
solutions of 0.5 mM FcCOOH in PBS at pH 7. Ag is the silver/silver ion reference electrode
used on the SPE (SPE surface area: 0.126 cm2). Error bars are sample standard deviations of
measurements on n = 2 samples.
The saturation currents and saturation concentrations for glucose have been summarized in
Table 3.2 for GOx and P2O-T169G. Both enzymes demonstrated similar behaviour in the mass
transport limited region where GOx showed bigger deviation in the presence of air. This could
be due to the effect of oxygen in the solution competing with the mediator as an electron
acceptor for GOx. GOx, also have ~ 2 times higher saturation concentration than P2O-T169G
for glucose. This shows this enzyme have better selectivity for glucose sensing. However this
could also be related to the activities of both enzymes where GOx is higher for the same enzyme
concentrations.
(A) (B)
(C)
Increasing glucose concentrations
Page 115
Chapter 3. Immobilization of Mutant P2O and GOx on Pyrenyl Carbon Structures for Glucose Oxidation
86
Enzyme
Saturation Current / µA Saturation Concentrations for
Glucose / mM
Nitrogen Air Nitrogen Air
P2O-T169G 16.5 ± 4.2 24.3 ± 2.2 4 4
GOx 32 ± 7.1 38 ± 9.3 8 8
Table 3. 2. The saturation currents and glucose concentrations of P2O-T169G and GOx
immobilised on carbon SPE from CA experiments at 0.2 V (vs Ag). All means and sample
standard deviations from replicate measurements on n = 2 samples (SPE surface area: 0.126
cm2).
Figure 3. 7. CA experiments at 0.2 V (vs Ag) of various glucose concentrations for P2O-T169G
and GOx enzymes immobilised on carbon SPE. Tested in air saturated solutions of 0.5 mM
FcCOOH in PBS at pH 7. Ag is the silver/silver ion reference electrode used on the SPE (SPE
surface area: 0.126 cm2).
Figure 3.7 shows the comparison between P2O-T169G and GOx with air at a constant voltage
of 0.2 V with consecutive glucose additions every 10 mins. The background current for P2O-
T169G was higher than GOx similar to the results obtain the CV experiments. GOx showed an
instant jump in current upon addition of glucose with each step following by a sharp decrease.
At lower glucose levels (where the linearity is), the drop in current between each glucose
concentrations for GOx was much higher than for P2O-T169G and the current after 10 min is
0 mM
0.5 mM 1 mM
2 mM 4 mM 6 mM
8 mM 10 mM 12 mM
Page 116
Chapter 3. Immobilization of Mutant P2O and GOx on Pyrenyl Carbon Structures for Glucose Oxidation
87
also lower. GOx loses its initial current response faster than P2O-T169G during first 10 min
indicating relatively poor performance of GOx compared to P2O-T169G.
A similar response was observed for GOx in the nitrogen saturated CA experiments at lower
glucose concentrations (Figure 3.6 (A)), hence it might be due to instability or poor
performance of the immobilised enzyme and not necessarily because of the oxygen present. At
higher glucose concentrations, on the other hand, the current does not show as sharp decreases
as in nitrogen saturated solution. The effect of oxygen might be more pronounced around the
saturation region where glucose oxidation is at its maximum and hence more electrons for
oxygen to compete with Fc.
P2O-T169G showed more stable current responses with consecutive glucose additions. Most
importantly it showed almost no significant current spikes on glucose addition in the saturation
region which might indicate that it could be beneficial for the stability of the systems where
P2O-T169G might be used. This kind of response could be because of its low affinity towards
oxygen and also the channelled structure of the enzyme would be controlling the mass transport
of the substrate and the products (Martin Hallberg et al., 2004). Similar results were obtained
from CA experiments for P2O-T169G under nitrogen saturation concentrations where there is
a slight decrease in current spikes on addition of glucose at lower glucose concentrations and
almost no decrease under high glucose concentrations (Figure 3.5 (A)).
Figure 3. 8. Lineweaver-Burk plot of P2O-T169G and GOx enzymes immobilised on carbon
SPE. Tested in air saturated solutions of 0.5 mM FcCOOH in 0.1 M PBS at pH 7. Ag is the
silver/silver ion reference electrode used on the SPE (SPE surface area: 0.126 cm2).
Page 117
Chapter 3. Immobilization of Mutant P2O and GOx on Pyrenyl Carbon Structures for Glucose Oxidation
88
Figure 3.8 shows the Lineweaver-Burk plot for P2O-169G and GOx tested in air saturated
solution derived from CA experiment data. As explained before in Chapter 2.3.1, the
Lineweaver-Burk equation (Eq 2.5) can be used to get information about enzyme kinetics in
systems when enzyme is responsive to increasing glucose concentrations.
Each enzyme might have different affinities (tendency to bind their substrate, usually shown as
Km) defined as the substrate concentration at which half of the enzyme’s active sites form
complexes with the substrate. In this case the enzymes will have different affinities towards
glucose. Where an enzyme is reported to have a high Km value for glucose oxidation, it means
that excessive amount of glucose must be present to saturate the enzyme that can be also
expressed as the enzyme having a low affinity for glucose. Therefore, low Km values are
important to show the affinity of the enzyme towards glucose as it will only need a small amount
of glucose to saturate the enzyme (Berg et al., 2002).
The Km values for P2O-T169G and GOx in air saturated solutions were calculated as 0.53 mM
and 2.97 mM respectively between 1 and 10 mM glucose concentration range (R2=0.97 and
R2=0.99 for P2O-T169G and GOx respectively). The lower Km value for P2O-T169G suggests
higher affinity toward glucose than GOx. Since increasing the glucose concentration would not
always increase the rate of glucose oxidation by the enzyme, saturation will be reached when
there is enough glucose to fill the enzymes’ active sites and where the maximum possible
electrochemical current imax will be reached (Berg et al., 2002). The imax values for P2O-T169G
and GOx were calculated as 25.64 µA and 46.73 µA, respectively. These calculated results
based on the Lineweaver-Burk plot are suggesting higher currents for GOx due to its activity
similar to experimental data presented and discussed in Table 3.2 within the given standard
deviation range.
The effectiveness, stability and turnover of the enzyme towards its substrate is highly dependent
on the immobilization of the enzyme on the electrode surface (Sarma et al., 2009). Results from
the immobilization of the enzymes showed higher current, higher glucose concentration and
better affinities towards glucose compared to the results where enzyme and mediator are in
solution. As a result, enhanced electron transfer and stability can be achieved by immobilizing
Fc on electrode surface.
Page 118
Chapter 3. Immobilization of Mutant P2O and GOx on Pyrenyl Carbon Structures for Glucose Oxidation
89
3.4.2. Enzyme electrodes modified with ferrocene-nafion-multi-walled carbon nanotubes (Fc-
Nafion-MWCNTs)
Figure 3.9 shows the CVs for the pre-conditinoning step of Fc-Nafion modified carbon SPE
performed at 50 mV s-1 scan rate in PBS at pH 7. The current increased with increasing scan
number and become saturated around the 20th cycle. The anodic peak of the first cycle behaved
different than the rest of the scans as the species might be moving into different domains of the
nafion® layer in the first cycle. This is similar to studies reported in literature (Dong et al.,
1992; Merotra, 2013).
The incorporation of a cationic redox couple into an anionic perfluorsulfonated polymer such
as nafion® has been reported previously (Vaillancourt et al., 1999). As more scans were applied,
the positively charged Fc+ accumulated inside the anionic sulphonate group of nafion® resulting
in increasing anodic and cathodic peaks until a constant redox couple of Fc formed. It was
suggested before that this processes increased the conductivity and stability of the coated film
(Dong et al., 1992).
Figure 3. 9. CV (scan rate: 50 mV s-1) scans for the pre-conditioning of the carbon SPEs
modified with Fc-Nafion. Tested in 0.1 M PBS at pH 7. Fc-Nafion loading is 0.06 mg cm-2. Ag
is the silver/silver ion reference electrode used on the SPE (SPE surface area: 0.126 cm2). (All
20 scans are shown in Figure B.9)
Page 119
Chapter 3. Immobilization of Mutant P2O and GOx on Pyrenyl Carbon Structures for Glucose Oxidation
90
Figure 3. 10. Comparison between Fc-Nafion and Fc-Nafion-MWCNTs coated electrodes after
pre-conditioning step. CVs performed at a scan rate of 10 mV s-1, tested in 0.1 M PBS at pH 7.
Fc-Nafion and Fc-Nafion-MWCNTs loadings are 0.06 mg cm-2. Ag is the silver/silver ion
reference electrode used on the SPE (SPE surface area: 0.126 cm2).
In this section, a new approach for fabricating Fc-Nafion films on carbon electrodes was
investigated. MWCNT dispersions (1 mg mL-1) of Fc-Nafion mixture in high ethanol content
were prepared to achieve stable, biocompatible and electrically conductive Fc-Nafion films.
Figure 3.10 shows the difference between two preconditioned carbon SPEs with Fc-Nafion and
Fc-Nafion-MWCNTs films tested in PBS at pH 7. The MWCNTs modified new film showed
larger current in both anodic and cathodic processes suggesting more efficient electron transfer
from Fc to the electrode due to high electrical conductive nature of the nanomaterial.
Different film loadings were applied on carbon SPEs and CVs was performed to test the
performance of the electrodes. The main purpose of this experiment was to find the minimum
film loading on the electrode with maximum concentration of Fc possible. In doing so, the
thickness of the nafion® layer can be minimised and the number of the mediator molecules can
be maximized on the electrode for more efficient electron transfer between enzyme and the
mediator.
Figure 3.11 shows the effect of different Fc-Nafion-MWCNTs coating amounts on the current
response of the electrodes. CVs were performed observing the anodic and cathodic processes
as more of the film was loaded onto the electrodes (Figure 3.11 (a)). Then, the peak currents
were presented as a function of film loading (Figure 3.11 (b)). The current response showed
Page 120
Chapter 3. Immobilization of Mutant P2O and GOx on Pyrenyl Carbon Structures for Glucose Oxidation
91
increasing current values until 0.06 mg cm-2 loading. It was observed that the error margin was
getting larger as the film loading was increased. This could be due to excessive loading of the
material hence resulting in leaching or instability of the film. The optimum film loading was
selected as 0.06 mg cm-2 and used as the electrode configuration for enzyme immobilization
procedures.
Figure 3. 11. (A) CVs (scan rate: 10 mV s-1) showing the effect of the different amounts of Fc-
Nafion-MWCNTs coated on SPEs after pre-conditioning step and (B) anodic peak current
values of the different electrodes prepared. Tested in 0.1 M PBS at pH 7. Ag is the silver/silver
ion reference electrode used on the SPE (SPE surface area: 0.126 cm2). Error bars are sample
standard deviations of measurements on n = 3 samples.
(A)
(B)
Page 121
Chapter 3. Immobilization of Mutant P2O and GOx on Pyrenyl Carbon Structures for Glucose Oxidation
92
Figure 3. 12. SEM images of the (A) bare electrode, Fc-Nafion (B) before and (C) after pre-
conditioning step and Fc-Nafion-MWCNTs (D) before and (E) after pre-conditioning step
(A)
(B) (C)
(D) (E)
Page 122
Chapter 3. Immobilization of Mutant P2O and GOx on Pyrenyl Carbon Structures for Glucose Oxidation
93
The morphology of the Fc-Nafion-MWCNTs film coated electrodes at different stages of the
electrode modification process were investigated using SEM. Figure 3.12 shows the images of
all the steps applied during the preparation of the electrodes.
Fc can be seen in the form of micrometric crystals in the SEM images, for both Fc-Nafion (Fig
3.12 (B)) and Fc-Nafion-MWCNTs (Fig 3.12 (D)) electrode samples. By looking at the
distribution of the crystals in these samples, it can be concluded that they are distributed fairly
even. The SEM of the Fc-Nafion-MWCNTs samples show that Fc is surrounded by MWCNTs
structure which is good considering the immobilization of the enzymes will take place on the
carbon surface therefore successful electron transfer can be achieved.
The conformation of the coating might be changing after the pre-conditioning steps as the Fc
crystals are observed to be accumulating to the sides of the electrode for both samples as seen
from the Fig. 3.12 (C). This could be due to the accumulation of the Fc+ ions in the negatively
charged sulphonate clusters of nafion® film as explained before.
Figure 3.13 shows unconditioned and pre-conditioned Fc-Nafion-MWCTNs (A) and (B)
respectively, also the MWCNTs (C) and conditioned Fc-Nafion-MWCNTs with higher
magnifications for comparison. The pre-condoned electrode gave clearer images when higher
magnification were used. This could suggest that the nafion® film structure may be changing
during the pre-conditioning step by accumulation of Fc.
The effect on the nafion® when mixed with MWCNTs is clarified if Figure 3.13 (c) and (d) are
compared. MWCNTs are observed to be integrated inside the nafion® and this could increase
the electron conductive properties of the film. This approach provides two main advantages to
conventional Fc-Nafion films:
i. Electrically conductive structure
ii. High surface area carbon support for protein immobilization
These two major improvements can be used to fabricate enzyme electrodes for enzymatic
biofuel cells. The pre-conditioning step might provide more stable electrodes due to the
advantages of the electrochemical treatment especially can prevent Fc leaching which may be
very important for implantable systems.
Page 123
Chapter 3. Immobilization of Mutant P2O and GOx on Pyrenyl Carbon Structures for Glucose Oxidation
94
Figure 3. 13. SEM images of (A) unconditioned, (B) pre-conditioned Fc-Nafion-MWCNTs
coated electrodes, (C) only MWCNTs and (D) pre-conditioned Fc-Nafion-MWCNTs with
higher magnification.
Figure 3.14 shows the electrochemical response of the P2O-T169G (a) and GOx (b)
immobilised on Fc-Nafion-MWCNTs pre-conditioned electrode (coating amount: 0.06 mg cm-
2) by crosslinking the enzymes on pyrene activated carbon nanostructures as explained in Figure
3.2 (B). The electrodes were placed in a pyrex cell (shown in Figure 3.3) and tested in nitrogen
saturated PBS at pH 7.
The catalytic current response of the electrodes without any glucose present in the solution was
similar either showing very low activity (P2O-T169G) or no activity (GOx). Both enzymes
(A) (B)
(D) (C)
Page 124
Chapter 3. Immobilization of Mutant P2O and GOx on Pyrenyl Carbon Structures for Glucose Oxidation
95
demonstrated an increased catalytic current response up to 4 mM glucose concentrations similar
to the results with FcCOOH in solution.
Figure 3. 14. CV (scan rate: 5 mV s-1) scans of (A) P2O-T169G and (B) GOx immobilised on
Fc-Nafion-MWCNTs pre-conditioned carbon SPE. Tested in nitrogen saturated solution for
various glucose concentrations containing 0.5 mM FcCOOH in PBS at pH 7. Ag is the
silver/silver ion reference electrode used on the SPE (SPE surface area: 0.126 cm2).
P2O-T169G showed a sharp increase in the presence of glucose whereas GOx showed similar
behaviour only in low glucose concentrations. They both displayed the same onset potential
(around -0.1 V vs Ag) dependant on the activation of the glucose oxidation reaction for different
glucose concentrations which is also similar as when FcCOOH was in solution. This suggests
(A)
(B)
Page 125
Chapter 3. Immobilization of Mutant P2O and GOx on Pyrenyl Carbon Structures for Glucose Oxidation
96
the successful immobilization of the enzymes on the electrode surface and successful electron
transfer between the enzyme and electrode via Fc mediator.
The different shapes obtained from CVs are also similar to the experiments discussed in Section
3.4.1, however P2O-T169G did not show significant shift in peak potentials with a 5 mV s-1
scan rate. On the other hand, the peak potentials for GOx were positively shifted as the glucose
amount is increased in solution. This could be due the saturation glucose concentrations that
affects the behaviour of the enzyme at peak potentials as it might change the reaction rate of
the glucose oxidation. The shape of the voltammograms for P2O-T169G and GOx was also
different. This could be because of the structural differences between two enzymes and different
sugar binding mechanism of P2O-T169G enzyme than GOx.
Figure 3. 15. (A) CA experiment at 0.15 V (vs Ag) of various glucose concentrations for P2O-
T169G enzyme immobilised on Fc-Nafion-MWCNTs pre-conditioned carbon SPE, (B) Current
values for various glucose concentrations derived from (A), (C) CA experiment at 0.15 V (vs
Ag) of various glucose concentrations for GOx enzyme immobilised on carbon SPE and (D)
Current values for various glucose concentrations derived from (C). Tested in 0.1 M PBS at pH
7. Ag is the silver/silver ion reference electrode used on the SPE (SPE surface area: 0.059 cm2).
Error bars are sample standard deviations of measurements on n = 2 samples.
(A) (B)
(C) (D) Increasing glucose concentrations
Increasing glucose concentrations
Page 126
Chapter 3. Immobilization of Mutant P2O and GOx on Pyrenyl Carbon Structures for Glucose Oxidation
97
Figure 3.15 shows the results derived from CA experiments performed at 0.15 V by recording
the steady state current after consecutive glucose additions every 10 min under air and nitrogen
saturated solution conditions. P2O-T169G demonstrated increasing current after each glucose
addition up to around 2 mM glucose concentration where GOx showed increasing current up
to 6 mM. The performance of the enzymes was lower than where the FcCOOH was used in the
solution (Figures 3.5 and 3.6). This sort of behaviour was expected due to the entrapped Fc
inside nafion® clusters since it is a diffusive mediator. Voltammetry experiments showed the
background current for the system was approximately 6 and 3 fold lower than where FcCOOH
was in the solution for P2O-T169G and GOx respectively. It could be the fact that less amount
of Fc trapped inside the nafion® layer than where it was free moving in the solution. The amount
of Fc interacting with the electrode surface was calculated to be approximately 2.7 fold less
than where it was used in the solution experiments.
Another set of experiments were carried out to test bigger surface area electrode and the
catalytic responses were compared with GOx. Figure 3.16 shows the behaviour of P2O-T169G
immobilised on different surface area electrodes (0.059 cm2 and 0.126 cm2)).
Figure 3. 16. (A) CA experiment at 0.15 V (vs Ag) of various glucose concentrations for P2O-
T169G enzyme immobilised on Fc-Nafion-MWCNTs pre-conditioned carbon SPE with a
surface area of 0.126 cm2, (B) Current density values for various glucose concentrations derived
from (A) with the data presented in Figure 3.15 (B). Tested in nitrogen saturated 0.1 M PBS at
pH 7. Ag is the silver/silver ion reference electrode used on the SPE. Error bars are sample
standard deviations of measurements on n = 2 samples.
The catalytic current response of P2O-T169G increased when bigger surface electrode was
used, however, the glucose concentration region where the catalytic current is linear did not
change significantly (between 0 to 2 mM). Better immobilization of the enzyme on a bigger
Increasing glucose concentrations
(A) (B)
Page 127
Chapter 3. Immobilization of Mutant P2O and GOx on Pyrenyl Carbon Structures for Glucose Oxidation
98
surface area might have caused higher current values, yet showed similar saturation behaviour.
This could be related to the immobilization efficiency of the enzyme. P2O-T169G is relatively
bigger molecule compared to GOx, therefore, the orientation of the enzyme molecules on small
area electrode could be different than GOx.
The performance of the P2O-T169G was similar at low glucose concentrations, and showed
similar linearity in parallel to previous tests, when compared to GOx. Figure 3.17 shows the
difference on performance between P2O-T169G and GOx enzymes under air saturated
solutions. Similar to previous results, GOx performs a lot less in terms of catalytic current at
high glucose concentrations (mass transport limited region) whereas P2O-T169G showed more
consistent response yet with lower current values.
Figure 3. 17. Comparison of current densities of P2O-T169G with GOx, both immobilised on
Fc-Nafion-MWCNTs pre-conditioned carbon SPE (surface area: 0.126 cm2). Data obtained
from CA experiments at 0.15 V (vs Ag) of various glucose concentrations. Tested in air
saturated 0.1 M PBS at pH 7. Ag is the silver/silver ion reference electrode used on the SPE.
Error bars are sample standard deviations of measurements on n = 2 samples. (Raw data: Figure
3.15 (C) and Figure 3.16 (A) for GOx and P2O-T169G respectively).
The linearity of the both systems are shown in Figure 3.18 where the GOx showed linear
response up to 4 mM glucose concentration (R2=0.99) and P2O-169G was 2 mM (R2= 0.97). It
was noted that whether Fc was used in the solution or immobilised, P2O-T169G enzyme
showed lower current values and not as good linearity as GOx. The main reason for this kind
of behaviour might be the lower activity of the mutant in comparison to commercial GOx
Page 128
Chapter 3. Immobilization of Mutant P2O and GOx on Pyrenyl Carbon Structures for Glucose Oxidation
99
enzyme. P2O-T169G has a different structure than GOx as described previously (Chapter 1,
Section 1.2.1) which might affect the immobilization of the protein and the interactions with
the diffusive mediator although they both oxidize glucose by similar reactions.
Figure 3. 18. Calibration curve for P2O-T169G and GOx enzymes immobilised on Fc-Nafion-
MWCNTs pre-conditioned carbon SPE. Tested in air saturated 0.1 M PBS at pH 7. Data
extracted from Fig 3.17. (SPE surface area: 0.126 cm2)
Figure 3.19 shows the Lineweaver-Burk plot for P2O-169G and GOx tested in air saturated
solution derived from CA experiment data. The Km values for P2O-T169G and GOx in air
saturated solutions were calculated as 0.68 mM and 0.17 mM respectively for 0.5-10 mM
glucose concentration range (R2=0.98 and R2=0.99 for P2O-T169G and GOx respectively). The
imax values for P2O-T169G and GOx were calculated as 201 µA cm-2 (25.3 µA) and 642 µA
cm-2 (37.9 µA) respectively.
Compared to the system where Fc was used in the solution, both of the enzymes showed better
affinity towards glucose (decreased Km values), however GOx performs better in this system
(in relation to lower Km). This is also similar to the voltammogram and amperometry
experiments where GOx showed better performance and linearity. The saturation current
densities calculated using the Lineweaver-Burk equation, was significantly higher than the
experimentally measured value for GOx. Considering relatively higher error margins for GOx,
this result can be expected. In the case of P2O-T169G the value of the maximum current density
was closer to the experimentally measured values.
Page 129
Chapter 3. Immobilization of Mutant P2O and GOx on Pyrenyl Carbon Structures for Glucose Oxidation
100
Figure 3. 19. Lineweaver-Burk plot for P2O-T169G and GOx immobilised on Fc-Nafion-
MWCNTs pre-conditioned carbon SPE. Tested in air saturated 0.1 M PBS at pH 7. Data
extracted from Fig 3.15 (B) and (D). (SPE surface area: 0.059 cm2)
Stability
Stability is a very important parameter especially for continuous systems such as enzymatic
biofuel cells. Figure 3.20 shows the difference in current density values for short term stability
when solution is saturated with air after different glucose concentrations are added.
Figure 3. 20. CA experiments at 0.15 V (vs Ag) of various glucose concentrations for P2O-
T169G and GOx enzymes immobilised on Fc-Nafion-MWCNTs pre-conditioned carbon SPE.
Tested in air saturated 0.1 M PBS at pH 7. Ag is the silver/silver ion reference electrode used
on the SPE (SPE surface area: 0.126 cm2).
0 mM 0.5 mM
1 mM
2 mM 4 mM
6 mM 8 mM
Page 130
Chapter 3. Immobilization of Mutant P2O and GOx on Pyrenyl Carbon Structures for Glucose Oxidation
101
Upon addition of each glucose concentration, GOx showed higher spikes in current density than
P2O-T169G following by a sharp decrease. P2O-T169G, on the other hand, showed consistent
and stable current values upon each additional glucose amount. Although this behaviour of
GOx provided higher currents, the currents were lower than what it achieved for P2O-T169G
at the end of each 10 min period (between glucose additions).
Figure 3. 21. CA experiments at 0.15 V (vs Ag) for (A) P2O-T169G and (B) GOx. Tested in
nitrogen and air saturated solutions of PBS at pH 7 containing 4 mM glucose for 12h. Ag is the
silver/silver ion reference electrode used on the SPE (SPE surface area: 0.126 cm2).
CA experiments for 12 h were also performed when solution is saturated with air and nitrogen
and 4 mM glucose concentration was present to compare the differences of the current
(A)
(B)
Page 131
Chapter 3. Immobilization of Mutant P2O and GOx on Pyrenyl Carbon Structures for Glucose Oxidation
102
responses for 12 h duration. The duration of 12 h was chosen based on the performance of the
enzymes, defined as the time when the current drops more than 50% from their initial readings.
Figure 3.21 shows the stability results for P2O-T169G (Figure 3.21 (A)) and GOx (Figure 3.21
(B)) enzymes when the solutions are saturated with nitrogen and air. In the case of GOx, the
current response showed a sharp decrease for both conditions (oxygen present or not) in which
it was even sharper when oxygen was present and kept decreasing until almost negligible
current values. On the other hand it showed a similar trend for P2O-T169G, keeping the initial
catalytic current difference mainly throughout 12 h. Both of the enzymes maintained their trend
of decreasing current over a time period of 12 h. This observation could be related to enzyme
activity and/or decreasing glucose concentrations or the combination of both. The film stability
is also another aspect that might be affecting the general performance of the electrodes.
These results are very similar to the stability experiments conducted where both enzyme and
mediator are in the solution in Chapter 2. This suggests that P2O-T169G enzyme might not be
utilising oxygen as an electron acceptor and the free oxygen is positively affecting the current
response.
Figure 3. 22. CA experiments at 0.15 V (vs Ag) for P2O-T169G and GOx. Tested in air
saturated solutions of PBS at pH 7 containing 4 mM glucose for 12 h. Ag is the silver/silver ion
reference electrode used on the SPE (SPE surface area: 0.126 cm2).
Figure 3.22 shows the CA experiments for 12 h comparing the performance of the two enzymes.
GOx, despite having more than 5 fold higher current response than P2O-T169G (initial current
around 55 µA and 10 µA for GOx and P2O-T169G respectively), almost shows no catalytic
Page 132
Chapter 3. Immobilization of Mutant P2O and GOx on Pyrenyl Carbon Structures for Glucose Oxidation
103
activity (around 0.1 µA) after 12 h of operation with 4 mM glucose present, with a sharp
decrease of 90% within the first hour of operation. However, P2O-T169G, after losing
approximately 30 % of its initial current in the first hour, continues to maintain current with
just a further 30% loss over the next 10 h (final current after 12 h is around 4 µA). The initial
current loss for both of the enzymes could be related to the activity of the enzyme and the
further decrease a combination of glucose consumption and activity. The results obtained from
CA experiments for 12 h suggests that P2O-T169G can provide more stable current than GOx
under the same conditions. This is an important finding for an enzymatic biofuel cell design
requiring stable current flow.
Based on the results obtained from voltammetry and amperometry experiments, GOx showed
higher current values, better linearity and even better affinity towards glucose in some cases.
However, P2O-T169G showed very promising results, in spite of its lower enzyme activity, by
virtue of its stability, glucose affinity and not showing decreasing catalytic current behaviour
in the in the mass transport limited region. These results suggests that the use of P2O-T1269G
can enhance the performance of the enzymatic fuel cells (EBFCs) especially for long term
stable operation.
3.5. Conclusions
In this chapter, the performance of P2O-T169G enzyme was investigated using two different
enzyme immobilization approaches where the mediator was either in solution or immobilised
on electrode surface. The results were then compared with commercial GOx enzyme to
investigate the feasibility of utilising P2O-T169G enzyme for enzymatic biofuel cell
applications.
Different immobilization strategies were successfully applied to immobilize the enzymes on
the carbon electrode surface. First, enzymes crosslinked onto pyrene activated carbon surface
and tested in solution contains the diffusive mediator Fc. In the second part, a novel
immobilization approach incorporating MWCNTs within Fc-Nafion film was successfully
developed and tested in PBS solution. The morphology of the fabricated Fc-Nafion-MWCNTs
electrodes were also characterized by SEM. The electrochemical tests showed successful
electron transfer from enzymes to the electrode via Fc mediator.
Both enzymes showed enhanced current values when Fc was immobilised on the electrode
compared to the results where Fc was in solution. When FcCOOH was used in solution and
Page 133
Chapter 3. Immobilization of Mutant P2O and GOx on Pyrenyl Carbon Structures for Glucose Oxidation
104
enzymes were immobilised, the current density values were 2.8 and 1.9 fold higher than when
both enzyme and FcCOOH were in the solution for P2O-T169G and GOx respectively (Chapter
2). Furthermore, co-immobilisation of Fc with the enzymes resulted in 3.3 and 2.3 fold higher
current densities for P2O-T169G and GOx respectively compared to when FcCOOH was used
in solution. These results show that a significant improvement was provided due to
immobilisation of enzymes and the mediator.
GOx, in general, demonstrated higher current values and broader linearity towards glucose due
to its high activity. However, P2O-T169G showed promising performance despite its low
activity and considering the fact that only 1 mg mL-1 enzyme was utilised for the experiments.
In agreement with the results in Chapter 2, P2O-T169G showed very consistent behaviour in
the voltammetry experiment where its current response in the region of mass transport
limitations was better than GOx.
CA experiments suggest that the stability of P2O-T169G was better than GOx. Although GOx
showed higher current values initially, it lost all of its activity over a 12 h period under constant
voltage, with a sharp decrease of approximately 90% within the first hour. P2O-T169G, on the
other hand, showed better stability with a 60% total current loss with 30% lost within the first
hour. It should be noted that the current decrease can be related to enzyme stability as well as
glucose consumption amount over time. However, considering both possibilities it can be
concluded that P2O-T169G might not be utilising oxygen as an electron acceptor for glucose
oxidation and hence was not affected by to the same extent as GOx does.
In conclusion, P2O-T169G has been successfully immobilised on a carbon surface using a
novel immobilization method and its performance compared to GOx. Further studies on
enzymatic biofuel cell studies are discussed in Chapter 4.
Page 134
105
Chapter 4. A Glucose-Air Enzymatic Biofuel Cell with Pyranose-2-Oxidase
In this chapter, different glucose/air enzymatic biofuel cells have been designed and tested
using pyranose-2-oxidase-T169G (P2O-T169G) and glucose oxidase (GOx) as anodic enzymes
and bilirubin oxidase (BOD) as cathodic enzyme. Enzymatic anodes were prepared by
crosslinking enzymes (P2O and GOx) on ferrocene nafion multi-walled carbon nanotubes (Fc-
Nafion-MWCNTs) modified electrodes as previously investigated in Chapter 3 and enzymatic
cathodes were prepared by crosslinking BOD on MWCNTs modified electrodes.
Initially, a proof of concept enzymatic biofuel cell was designed using P2O-T169G and BOD
enzymes for anode and cathode respectively and tested in a simple electrochemical cell with
5.5 mM glucose solution at pH 7. The performance of the enzymatic fuel cell was then
compared when GOx was utilised as an anodic enzyme. A biofuel cells were set up using P2O-
T169G/GOx and BOD as anodes and cathode, respectively for comparative analysis. Initial
tests showed that P2O-T169G based enzymatic fuel cell can reach up to a power density of 9.56
µW cm-2.
Further tests also showed P2O-T169 based enzymatic biofuel cell can produce ~25 % more
power output than GOx when oxygen is present in the solution. Finally, a biofuel cell anode
using P2O-T169G was combined with air breathing BOD cathode in a stack design enzymatic
biofuel cell (shown in Figure 1.26 (D)). The characteristics of the fuel cell design were
investigated in terms of cell voltage, maximum power, power density and stability. An
assembly of P2O-T169G – BOD based biofuel cell with an open circuit potential of 0.558 V
and maximum power density of 29.8±6.1 µW cm-2 at 0.318 V.
4.1. Introduction
Employing enzymes for glucose oxidation and oxygen reduction has attracted many researchers
for the last 30 years (Rasmussen et al., 2016). Promising results have been achieved in different
applications involving living animals (Schröder, 2012; Falk et al., 2013b) such as insects
(Rasmussen et al., 2012), snail and clams (Halámková et al., 2012; Szczupak et al., 2012),
lobsters (MacVittie et al., 2013), rats (Cinquin et al., 2010; Andoralov et al., 2013; Castorena-
Gonzalez et al., 2013; Cheng et al., 2013; Sales et al., 2013; Zebda et al., 2013) and rabbits
(Miyake et al., 2011). Plants (Mano et al., 2003a) and even fruit juice (Liu and Dong, 2007a),
were used to power enzymatic biofuel cells for applications such as wireless transmitting
Page 135
Chapter 4. A Glucose-Air Enzymatic Biofuel Cell with Pyranose-2-Oxidase
106
systems (MacVittie et al., 2015) or more recently enzymatic biofuel cells were integrated with
contact lenses for glucose sensing (Falk et al., 2013a).
Glucose is one of the most studied fuels for fuel cell applications especially for implantable
devices mostly because of its role in human metabolism. Developing efficient and long term
stable glucose/O2 fuel systems is therefore very essential for future applications. Since the first
membrane-less glucose enzymatic fuel cell was developed in 1999 (Katz et al., 1999b),
different enzymes and approaches have been used to improve the performance and stability of
the fuel cells.
According to the best of current knowledge, there is only one study reported utilising P2O in
an EBFC (Kwon et al., 2014): researchers employed P2O and GOx in a fuel cell, however, they
used air-breathing platinum as cathode so this system was not a fully enzymatic system (only
anode is enzymatic). A redox mediator, benzoquinone, was added to the glucose solution of
200 mM used (~35 fold more concentrated glucose than used in this study) and a proton
exchange membrane was also added to separate anode and cathode compartments. As a result,
a maximum power densities of 11.6 µW cm-2 and 40.7 µW cm-2 were reported with and without
the presence of the mediator, respectively. This values were also higher than it was for GOx
tested (8.4 µW cm-2 and 31.4 µW cm-2 respectively). However, there was no information about
the electrochemistry of the proposed direct electron transfer from enzymes and the mediator
was used in solution which is not very practical especially for implantable applications. Several
other fuel cell designs were also summarised in Chapter 1, Section 1.2.3.
In the scoop of this study, the investigation of the P2O enzymes in solution (Chapter 2),
different immobilisation strategies to employ P2O for biofuel cell applications (Chapter 3) have
been investigated so far and the performance parameters were compared with widely used GOx
enzyme. According to the results obtained, it was concluded that P2O is a very promising
candidate for biofuel cell applications especially with significant advantages in stability. In this
chapter, to best of current knowledge, a membrane-less fully enzymatic biofuel cell based on
P2O-T169G – BOD enzymes were studied for the first time. Comparative studies were again
conducted using GOx to demonstrate using P2O-T169G in biofuel cell applications.
Page 136
Chapter 4. A Glucose-Air Enzymatic Biofuel Cell with Pyranose-2-Oxidase
107
4.2. Experimental
4.2.1. Materials
Carbon paper with gas diffusion layer was purchased from Freudenberg (Weinheim, Germany).
BOD (from myrothecium verrucaria, lyophilized powder, 15-65 unit mg-1 protein) was
purchased from Sigma-Aldrich (Dorset, UK). Watson Marlow 101U/R peristaltic pump was
borrowed from School of Chemical Engineering and Advanced Materials (CEAM), Newcastle
University BioLab (Newcastle, UK). Resistor box Model RS-500 (range: 1Ω-10 MΩ) was
purchased from Elenco Electronics (Wheeling, US). High resolution data logger ADC-16 was
purchased from Pico Technology (Cambridgeshire, UK). The stack cells used in fuel cell
experiments were made by the mechanical workshop in CEAM (Newcastle, UK). All the
chemicals and other materials were purchased, handled and used as described in Chapter 3.2.1
and 2.2.1.
4.2.2. Preparation of Enzymatic Biofuel Cell Anode
Enzymatic biofuel cell anodes were prepared using the same method described in Chapter 3.2.3.
Briefly, a solution of Fc-Nafion-MWCNTs was drop-coated onto carbon SPE (0.126 cm2) or
carbon paper (1.767 cm2) to give 0.06 mg cm-2 loading amount (dried at room temperature).
The dried electrode was then pre-conditioned using cyclic voltammetry (CV) for 20 scans at 50
mV s-1 between -0.4 V and 0.4 V (vs Ag/Ag+) for SPE and 5 scans between -0.3 and 0.7 V (vs
Ag/AgCl) for carbon paper electrode. After the pre-conditioning step, the electrodes were
washed with de-ionized water and dried in oven at 35 °C for 10 min. The electrodes were
activated by 1-pyrenebutyric acid N-hydroxysuccinimide ester (PBSE, 10 mM in DMF) for 1
h and rinsed with de-ionized water. Finally, 4 mg mL-1 and/or 10mg mL-1 of P2O-T169G and/or
GOx were added on freshly activated electrodes at 4 °C for 2 h and rinsed with PBS at pH 7
before use.
4.2.3. Preparation of Enzymatic Biofuel Cell Cathode
Enzymatic biofuel cell cathodes were prepared using carbon SPE and carbon paper electrodes
used for the anode preparation. A dispersion of MWCTNs (1 mg mL-1 in DMF) was drop coated
onto the electrodes to give 0.08 mg cm-2 nanomaterial loading and dried at room temperature.
The electrodes then were activated by 10 mM PBSE in DMF for 1 h and rinsed with de-ionized
Page 137
Chapter 4. A Glucose-Air Enzymatic Biofuel Cell with Pyranose-2-Oxidase
108
water. Finally, 4 mg mL-1 of BOD was added on freshly activated carbon SPE and carbon paper
electrodes at 4 °C for 2 h respectively and rinsed with PBS at pH 7 before use.
4.2.4. Electrochemical and Fuel Cell Measurements
CV were used to characterise BOD in non-aerated and aerated solutions mimicking the same
conditions used in the fuel cell measurements. Fuel cell measurements were performed using a
resistor box to apply load and the output voltage was recorded by data logger. The anode and
cathode potentials were also recorded versus Ag/AgCl reference electrode. The current and
power were calculated using Ohm’s Law (V = I x R and P = I x V). The glucose concentration
used for the fuel cell measurements were 5.5 mM to mimic the glucose in levels human blood.
The measurements were carried out at room temperature.
Figure 4. 1. Experimental set-up for cells. (A) Fuel cell set-up with a glass cell beaker (B) Fuel
cell set-up with stack cell design with air breathing cathode (C) Overall view of the test
equipment while operating in batch mode with a glass cell beaker.
In this study, two different modes were used for fuel cell operation: batch mode and continuous
mode. Batch mode was used to obtain performance parameters such as current-voltage and
power curves and continuous mode was used to obtain stability information. There were also
two different cell designs to make use of different type of electrodes for fuel cell tests. A glass
(A) (B)
(C)
Anode
Cathode
RE
Resistor Box
Data Logger
Page 138
Chapter 4. A Glucose-Air Enzymatic Biofuel Cell with Pyranose-2-Oxidase
109
cell beaker was used to test SPEs and a stack cell design was used to test carbon paper
electrodes. The fuel cell set-ups used in this chapter are shown in Figure 4.1.
4.3. Results and Discussion
4.3.1. Performance of EBFCs with P2O-T169G, GOx and BOD
The EBFC anodes used in this chapter was prepared using the immobilization technique
developed in Chapter 3, Section 3.4.2. The EBFC cathodes were prepared using a similar
approach (explained in section 4.2.3) without using an electron transfer mediator because BOD
can exhibit direct electron transfer (DET) between its active site and the electrode (Ramírez et
al., 2008). The EBFC cathode was first characterised using CV to validate whether
functionalised electrode is capable of electron transfer to the electrode.
Figure 4. 2. CV (scan rate: 5 mV s-1) scans of a BOD cathode immobilised on MWCNTs coated
SPE (MWCNTs loading of 0.08 mg cm-1) tested in nitrogen and air saturated solution of 0.1 M
PBS at pH 7 containing 5.5 mM glucose. Ag is the silver/silver ion reference electrode used on
the SPE (SPE surface area: 0.126 cm2).
CVs of a BOD cathode on the SPE were obtained in 5.5 mM glucose solution is shown in Figure
4.2. This solution was chosen to maintain the same conditions used in the EBFC experiments
tested in this chapter. The solution was deaerated with N2 to obtain a baseline and then aerated
with air to test the electrochemical activity of BOD. The presence of O2 in glucose solution
clearly resulted in the formation of catalytic currents where the O2 reduction peak starts at
around 0.3 V vs Ag. This appearance of the cathodic current obtained is similar to the previously
-8
-4
0
4
8
12
-0.1 0.1 0.3 0.5 0.7
i /
µA
E / V (vs Ag)
Nitrogen Air
Page 139
Chapter 4. A Glucose-Air Enzymatic Biofuel Cell with Pyranose-2-Oxidase
110
reported currents based on immobilization on MWCNTs (Weigel et al., 2007). DET between
BOD and electrode was successfully achieved and this electrode configuration was used to
prepare the cathodes throughout this chapter. Another set of experiments were also performed
to ensure the electron transfer is provided by BOD. In these experiments MWCNTs coated
SPEs without BOD were tested and no catalytic current change was observed suggesting no
activity when BOD is not present (Figure C.1 in Appendix C).
Effect of Oxygen on the Performance of EBFC
Oxygen is a key parameter for EBFCs as its presence is often not desired at anode but it is
essential at cathode. The oxygen-resistant properties and relatively stable performance of P2O-
T169G was displayed in Chapter 3 previously, making it attractive for EBFCs. An EBFC was
set up using P2O-T169G and BOD as anode and cathode, respectively.
Parameters
EBFCs
Non-aerated Aerated
OCP / V 0.494 0.458
Max Power / µW 0.87 1.20
Max Power Density / (µW cm-2) 6.89 9.56
Limiting Current / µA 2.40 3.47
Limiting Current Density / (µA cm-2) 19.10 27.54
Table 4. 1. Summary of the EBFC performance parameters obtained from non-aerated and
aerated glucose concentrations. All enzymes used to construct EBFCs were at 4 mg mL-1
concentration and were immobilised on SPE (surface area: 0.126 cm2). Anode and cathode
potentials were also recorded as 0.050 and 0.544 V for non-aerated, 0.082 and 0.541 V for
aerated solutions respectively at OCP. The maximum power values were obtained at different
external loads of 150 kΩ (giving a cell potential of 0.361 V) and 100 kΩ (giving a cell potential
of 0.347 V) representing the values for non-aerated and aerated solutions, respectively.
The EBFC cell tests were carried out in 5.5 mM glucose solution at pH 7. This concentration
of glucose and pH were chosen to mimic the blood sugar levels in human (Digital, 2016). P2O-
Page 140
Chapter 4. A Glucose-Air Enzymatic Biofuel Cell with Pyranose-2-Oxidase
111
T169G and BOD concentrations used in this part were 4 mg mL-1 and the summary of the EBFC
performance parameters obtained from non-aerated and aerated glucose solutions are
summarised in Table 4.1.
Figure 4. 3. (A) Cell voltage-current and (B) fuel cell polarization curves operating in non-
aerated and aerated glucose concentrations. All enzymes used to construct EBFCs were at 4 mg
mL-1 concentration and were immobilised on SPE (surface area: 0.126 cm2). EBFCs were tested
at batch mode using a glass cell in non-aerated and aerated glucose concentrations of 5.5 mM
in 0.1 M PBS at pH 7.
Figure 4.3 shows the cell voltage and power as a function of current, also known as the
polarization curve. The EBFCs showed OCP values of 0.494 and 0.458 V for non-aerated and
aerated solutions of glucose, respectively. Anode and cathode potentials were also recorded as
0
0.1
0.2
0.3
0.4
0.5
0.6
0 1 2 3 4
Cel
l V
olt
age
/ V
Current / µA
Non-Aerated Aerated
0
0.2
0.4
0.6
0.8
1
1.2
1.4
0 1 2 3 4
Pow
er /
µW
Current / µA
Non-Aerated Aerated
(A)
(B)
Page 141
Chapter 4. A Glucose-Air Enzymatic Biofuel Cell with Pyranose-2-Oxidase
112
0.050 and 0.544 V for non-aerated, 0.082 and 0.541 V for aerated solutions respectively at
OCP.
Open circuit potential (OCP) is defined as the potential difference between anode and cathode
of a fuel cell (Güven et al., 2016). In practice, OCP is substantially lower than the theoretical
value due to various potential losses, particularly activation and kinetic losses (Güven et al.,
2016). The anodic potential obtained from the experiments conducted in Chapter 3 (Section
3.4.2) was started around -0.1 V vs Ag and the cathodic potential from Figure 4.2 was observed
at 0.3 V. Therefore, the OCP of 0.4 V between the reactions at the anode and cathode can
theoretically be achieved.
The OCP values for EBFCs were observed higher than the theoretically possible values. This
can be explained by analysing anode and cathode potentials recorded during polarization. The
anode showed a positive shift of 0.182 V from its theoretical value that was expected as it
should not reach or be more negative than its theoretical value. This value, on the other hand,
might show closer values to it theoretical value than it was in the polarisation test considering
the CV experiment was conducted at 5 mV s-1 scan rate. The cathode also showed a positive
shift of ~0.240 V, which was unexpected. Although CV experiment suggests a theoretical redox
potential of 0.3 V vs Ag, BOD was reported to show electron transfer properties at potentials
between 0.32-0.52 V vs Ag (Christenson et al., 2006). Therefore, the CV experiments at the
given scan rate perhaps does not reflect the real value of the redox potential. If the reported
values are taken into consideration, an OCP value of 0.458 V is possible from the designed
EBFC in this study.
The power reached up to a maximum value of 0.87 µW (power density and current density of
6.9 µW cm-2 and 19.10 µA cm-2 respectively) when the solution is not aerated. Then, increased
up to 1.2 µW (power density and current density of 9.56 µW cm-2 and 27.57 µA cm-2
respectively) showing ~ 40 % increase in performance when the solution is aerated. After the
fuel cell reached its maximum value, which was where the external resistance was equal to its
total internal resistance (Menicucci et al., 2006), it started to decay mainly due to mass transport
losses. The maximum power values were obtained at different external loads of 150 kΩ (giving
a cell potential of 0.361 V) and 100 kΩ (giving a cell potential of 0.347 V) representing the
values for non-aerated and aerated solutions, respectively.
Page 142
Chapter 4. A Glucose-Air Enzymatic Biofuel Cell with Pyranose-2-Oxidase
113
At high current density values, polarisation curves show fluctuations and power overshoot (Zhu
et al., 2013). This type of behaviour of a biological fuel cell was reported several times in
literature (Ieropoulos et al., 2010; Nien et al., 2011; Winfield et al., 2011; Güven et al., 2016).
It was observed that the internal resistance of the biofuel cell was also increased when power
overshoot occurs (Ieropoulos et al., 2010; Nien et al., 2011; Winfield et al., 2011). However,
the reasons of power overshoot are yet not be fully understood (Zhu et al., 2013).
Figure 4. 4. Non-aerated and aerated anode (left) and cathode (right) potentials versus current
curves obtained from EBFC tests. All enzymes used to construct EBFCs were at 4 mg mL-1
concentration and were immobilised on SPE (surface area: 0.126 cm2). EBFCs were tested at
batch mode using a glass cell in non-aerated and aerated solutions of 0.1 M PBS at pH 7
containing 5.5 mM glucose.
Figure 4.4 indicates anode and cathode performance throughout the fuel cell test for non-aerated
and aerated solutions. Electron transfer occurs between the anode and cathode, in which the
change in energy level can be measured as open circuit potential versus Ag/AgCl reference
electrode (Jadhav et al., 2014). Therefore, anodic and cathodic potentials were measured during
polarization. Anode potentials performed similar for both conditions whereas cathode potential
behaviour changed in the presence of oxygen significantly. The results indicate that cathode is
a main limiting parameter for the power generation depending on the oxygen levels in the
solution.
The fuel cell can produce more power under higher load (also higher internal resistance) than
when oxygen is present in the solution. This is a significant discovery as it shows that P2O-
0
0.1
0.2
0 1 2 3
Volt
age
/ V
Current / µA
Non-Aerated
Aerated
0
0.2
0.4
0.6
0 1 2 3
Volt
age
/ V
Current / µA
Non-Aerated
Aerated
(B) (A)
cathode limitation
Page 143
Chapter 4. A Glucose-Air Enzymatic Biofuel Cell with Pyranose-2-Oxidase
114
T169G was not affected by the presence of oxygen, on the contrary the performance of the fuel
cell was enhanced as possibly in accordance with cathode. In other words, presence of oxygen
increased the cathode performance without affecting anode hence the overall EBFC power
output was increased.
The anodic potentials between non-aerated and aerated conditions showed a difference of ~
0.032 V when the cell operates at open circuit and kept this difference during the test without
any significant change. The proof of this same trend can be checked by simplifying the Figure
4.4 (A) using log scale giving a slope of 0.02 for both lines (see Figure C.2 in Appendix C).
This shows that the anode performance is relatively same but limited to its initial capacity. The
cathodic potential, however, showed very similar values at the beginning until the fuel cell was
limited. This suggests that difference for OCP values are caused by the initial anode
performance. This could be due to the efficiency of the enzyme immobilization as discussed in
Chapter 3.
The EBFC was limited by cathode at the current value of 3 µA and 3.47 µA for non-aerated
and aerated solutions, respectively (the points where the cell voltage showed sharp decrease
and current values started to read the same value for different cell voltage values, marked on
Fig. 4.4) for non-aerated and aerated glucose solutions respectively. This type of outcome was
expected when the oxygen in the solution were not sufficient. However, the cathode was still
limited although the solution was aerated. This shows that the aeration process was not
sufficient enough to maintain the desired current requirements by the electrochemical reaction
at the cathode. This is an expected discovery for batch systems where the oxygen depletion is
inevitable in particular when continuously consumed by the cathode.
Performance Comparison between P2O-T169G and GOx
After demonstrating P2O-T169G in a biofuel cell, comparative fuel cell tests were carried out
using GOx. The performance parameters of P2O-T169G and GOx based EBFCs were
summarised in Table 4.2. The same fuel cell design and operating conditions with the oxygen
study were also used in this section of the chapter. The EBFCs showed OCP values of 0.442
and 0.444 V for P2O-T169G and GOx, respectively. Anode and cathode potentials were
0.093±0.015 and 0.534±0.031 V for P2O-T169G (BOD at the cathode) and 0.072±0.015 and
0.517±0.004 V for GOx (BOD at the cathode) respectively at OCP. The maximum power values
were obtained at 100 kΩ and 125 kΩ for P2O-T169G and GOx, respectively.
Page 144
Chapter 4. A Glucose-Air Enzymatic Biofuel Cell with Pyranose-2-Oxidase
115
Parameters EBFC Anode
P2O-T169G GOx
OCP / V 0.442±0.02 0.444±0.02
Max Power / µW 1.06±0.2 0.8±0.1
Max Power Density / (µW cm-2) 8.45±1.6 6.34±0.88
Limiting Current / µA 3.26±0.3 2.52±0.18
Limiting Current Density / (µA cm-2) 25.83±2.41 20.03±1.4
Table 4. 2. Summary of the enzymatic biofuel cell performance results comparing P2O-T169G
and GOx obtained from aerated system test. All enzymes used to construct EBFCs were at 4
mg mL-1 concentration and were immobilised on SPE (surface area: 0.126 cm2). Anode and
cathode potentials were 0.093±0.015 and 0.534±0.031 V for P2O-T169G (BOD at the cathode)
and 0.072±0.015 and 0.517±0.004 V for GOx (BOD at the cathode) at OCP respectively. The
maximum power values were obtained at 100 kΩ for P2O-T169G and 125 kΩ for GOx. All
means and sample standard deviations from replicate measurements on n = 2 samples of each
EBFC.
The cell voltage-current and power curves are displayed in Figure 4.5. P2O-T169G showed
better performance than GOx. P2O-T169G had ~ 25 % more power output with a maximum
power density value of 8.45 µW cm-2 than GOx when oxygen is present in the glucose solution
(max. power of 1.06 and 0.8 µW for P2O-T169G and GOx, respectively). Despite having
slightly different anode and cathode potentials, the difference between the OCP values were
very close to each other. Another important parameter worth mentioning is the limiting current
density, in which, P2O-T169G has a higher value than GOx (3.26 µA versus 2.52 µA).
Enhanced short circuit density suggests the contribution of more enzymes into the bio-
electrochemical reaction as reported before (Halámková et al., 2012).
Page 145
Chapter 4. A Glucose-Air Enzymatic Biofuel Cell with Pyranose-2-Oxidase
116
Figure 4. 5. (A) Cell voltage-current and (B) fuel cell polarization curves for P2O-T169G and
GOx as EBFC anodes combined with BOD cathode. All enzymes used to construct EBFCs
were at 4 mg mL-1 concentration and were immobilised on SPE (surface area: 0.126 cm2).
EBFCs were tested at batch mode using a glass cell in aerated solutions of 0.1 M PBS at pH 7
containing 5.5 mM glucose. Error bars are sample standard deviations of measurements on n =
2 samples of each EBFC.
Figure 4.6 shows the anode-cathode potentials versus current during polarisation test. The GOx
based fuel cell was limited by cathode at lower current values than the P2O-T169G based fuel
cell. Although both the cathodes were saturated with air prior to tests, P2O-T169G based fuel
cell cathode showed better performance which is noteworthy. As discussed in Chapter 1, section
1.2.1, oxygen is the natural electron acceptor of GOx whereas P2O-T169G mutant was
genetically modified not to utilise oxygen. Therefore, the enhanced performance of P2O-
0
0.1
0.2
0.3
0.4
0.5
0 1 2 3 4 5
Cel
l V
olt
age
/ V
Current / µA
P2O-T169G GOx
0
0.2
0.4
0.6
0.8
1
1.2
0 1 2 3 4 5
Pow
er /
µW
Current / µA
P2O-T169G GOx
(A)
(B)
Page 146
Chapter 4. A Glucose-Air Enzymatic Biofuel Cell with Pyranose-2-Oxidase
117
T169G might be because it does not utilise oxygen at the anode, hence there is no competition
with cathode regarding to oxygen. On the other hand, poor cathodic performance of the GOx
based fuel cell, under same aerobic conditions with P2O-T169G, suggests that GOx might be
competing with the cathode for oxygen resulting decreased fuel cell performance.
Figure 4. 6. Voltage-current curves of anode (dashed line)-cathode (straight line) potentials for
P2O-T169G and GOx as EBFC anodes combined with BOD cathode. All enzymes used to
construct EBFC were at 4 mg mL-1 concentration and were immobilised on SPE (surface area:
0.126 cm2). EBFCs were tested at batch mode using a glass cell in aerated solutions of 0.1 M
PBS at pH 7 containing 5.5 mM glucose. Error bars are sample standard deviations of
measurements on n = 2 samples of each EBFC.
Performance of EBFC with P2O-T169G and Air-breathing Cathode
Oxygen resistant properties of the P2O-T169G was shown to have significant advantage over
GOx in biofuel cell tests. The cathode limitation, on the other hand, is still a concern for batch
type fuel cells where oxygen will decay over time resulting decreased fuel cell performance. A
stack cell design with an air breathing carbon paper based cathode compartment was used to
improve the cathode performance of the fuel cell. The surface area of the carbon paper electrode
used in the stack cell was 1.77 cm2, 14 fold larger than it was for previous fuel cell electrodes
(SPE) presented in this study. Enzyme concentrations of 10 mg mL-1 and 4 mg mL-1 were used
for P2O-T169G and BOD respectively. The enzyme concentration for the anode was increased
to avoid decreased anodic performance in the case of improved cathodic performance would be
0
0.1
0.2
0.3
0.4
0.5
0.6
0 1 2 3 4
Volt
age
/ V
Current / µA
P2O-T169G GOx
Page 147
Chapter 4. A Glucose-Air Enzymatic Biofuel Cell with Pyranose-2-Oxidase
118
achieved. The performance parameters of P2O-T169G –BOD based EBFCs were summarised
in Table 4.3.
Parameters EBFCs
OCP / V 0.558
Max Power / µW 52.3±10.8
Max Power Density / (µW cm-2) 29.8±6.1
Limiting Current / mA 0.15±0.02
Limiting Current Density / (mA cm-2) 0.08±0.01
Table 4. 3. Summary of the enzymatic biofuel cell performance results obtained from P2O-
T169G anode and air breathing BOD cathode. Anode and cathode potentials were -0.019±0.035
and 0.524±0.014 V for P2O-T169G and BOD at OCP. The maximum power values were
obtained at 2.5 kΩ. All means and sample standard deviations from replicate measurements on
n = 2 samples of each EBFC.
The air-breathing EBFC showed an OCP value of 0.558 V where the anode and cathode
potentials were measured -0.019±0.035 and 0.524±0.014 V. This is ~26 % more of that
observed when air-breathing cathode was not used. The reason of the enhanced OCP value can
be explained by looking at the change in anode and cathode potentials. The anode potential was
shifted negatively by 0.091 V and the cathode potential was shifted 0.007 V showing improved
values for the electrodes.
Figure 4.7 shows the polarisation curve for air-breathing biofuel cell. The power generation
from the biofuel cell reached its maximum value at an external resistance of around 2.5 kΩ
which is 40 times more load applied to the biofuel cell than previous results. This results a
maximum power of 52.3 µW (60.2 µW for the best test) and a power density of 29.8 µW cm-2
(34 µW cm-2 for the best test). This is 3.4 times higher than the obtained values of when air-
breathing cathode was not used (49 fold increase when power is compared with the EBFC
where SPEs were used, from 1.07 µW to 52.57 µW). Also, significant improvement was
achieved for limiting current giving values of 0.14 mA (increased by 43 fold).
Page 148
Chapter 4. A Glucose-Air Enzymatic Biofuel Cell with Pyranose-2-Oxidase
119
Figure 4. 7. Cell voltage-current and fuel cell polarization curves showing the performance of
P2O-T169G anode and BOD cathode. Enzymes concentrations of 10 mg mL-1 and 4 mg mL-1
were used for anode and cathode respectively and were both immobilised on carbon paper
electrodes (surface area: 1.77 cm2). EBFCs were tested at batch mode using stack cell design
in aerated solutions of 0.1 M PBS at pH 7 containing 5.5 mM glucose. Error bars are sample
standard deviations of measurements on n = 2 samples of each EBFC.
Another important discovery for air-breathing EBFC is shown in Figure 4.8. The limitation of
the biofuel cell was switched from cathode to anode suggesting that the air-breathing add-on to
the fuel cell design significantly improved the cathode performance. These analyses show that
the oxygen concentration is highly important for the fuel cell performance. Oxygen resistant
properties of P2O-T169G combined with oxygen rich cathode leading an OCP and power
output values in the EBFC.
Kwon et al, 2014 demonstrated for the first time using P2O in an EBFC (Kwon et al., 2014).
However, they used air-breathing platinum as cathode not suggesting a fully enzymatic system
(only anode is enzymatic) producing maximum power densities of 11.6 µW cm-2 and 40.7 µW
cm-2 with and without the presence of the mediator, respectively. Although the systems are not
fully comparable due to having different designs and enzyme-mediator assemblies, fully
enzymatic, air-breathing, membrane-less EBFC developed in this study demonstrated
comparable power density values of 29.8 µW cm-2 (34 µW cm-2 for the best test) obtained in
5.5 mM glucose solution in 0.1 M PBS at pH 7 (200 mM used in the study by Kwon et al, 2014)
0
10
20
30
40
50
60
70
0
0.1
0.2
0.3
0.4
0.5
0.6
0 50 100 150
Pow
er /
µW
Cel
l V
olt
age
/ V
Current / µA
Page 149
Chapter 4. A Glucose-Air Enzymatic Biofuel Cell with Pyranose-2-Oxidase
120
Figure 4. 8. Voltage-current curves of anode and cathode potentials for P2O-T169G and BOD
resoectively. Enzymes concentrations of 10 mg mL-1 and 4 mg mL-1 were used for anode and
cathode respectively and were both immobilised on carbon paper electrodes (surface area: 1.77
cm2). EBFCs were tested at batch mode using stack cell design in aerated solutions of 0.1 M
PBS at pH 7 containing 5.5 mM glucose. Error bars are sample standard deviations of
measurements on n = 2 samples of each EBFC.
In the case of co-immobilizing GOx and Fc on the electrodes, the power density of 29.8±4.31
µW cm-2 at 0.318 V obtained in this study is 3 fold higher than that where FcCOOH was used
in solution and GOx entrapped in MWCNT-ionic liquid gel (10 µW cm-2) and ~ 3 fold higher
than that where GOx and Fc were directly crosslinked on the electrode without using
nanomaterials (13 µW cm-2) (Shim et al., 2011) and where Fc, MWCNTs and chitosan were
employed on the electrode (13 µW cm-2) (Park et al., 2011).
Furthermore, it is ~ 2 fold higher than the reported values (15.8 µW cm-2) where Fc was used
with carbon nanocomposite materials (Zhao et al., 2009) and higher performance than that
where graphene nano-sheets were used (24.3 µW cm-2), however the EBFC was tested in the
presence of 100 mM glucose solution which 18 fold higher than in this study (5.5 mM) (Liu et
al., 2010).
The performance of the biofuel cell in this study was also showed power densities in the same
range with that in which Fc is used as a mediator at the anode incorporation with nafion® and
MWCNTs similar to this study (Tan et al., 2010). However, this fuel cell lost 94 % of its initial
performance after 5 h of operation (also operated at pH 5).
-0.1
0
0.1
0.2
0.3
0.4
0.5
0.6
0 50 100
Volt
ag
e /
V
Current / µA
Anode Cathode
Page 150
Chapter 4. A Glucose-Air Enzymatic Biofuel Cell with Pyranose-2-Oxidase
121
4.3.2. Stability of EBFC with P2O-T169G and Air-breathing Cathode
The stability of the air-breathing EBFCs was investigated using two different approaches. In
the first approach, the operational stability of the EBFC was tested under constant external load
of 4 kΩ after the initial polarization test. Then, the external load was removed after EBFC lost
more than 60-70 % of its initial potential and left to rest until it reached steady-state. As the
glucose was consumed in the solution, a fresh solution of glucose was prepared and another
polarization and stability tests were carried out each time. This process was performed 3-times
in total resulting 4 polarization and 3 stability tests. The fuel cell performance parameters of
these tests are shown in Figure 4.9. (Raw data for stability: Figure C. 3 in Appendix C).
The maximum power output of the EBFC showed a decreasing trend in every test performed
after each stability test. The final value of 26.7 µW was obtained from the test performed on
the 37th hour. This is ~40 % less than its initial value of 45.4 µW. OCP values of the EBFC
before polarization tests showed similar trend with the maximum power output values with a
slight drift at the last test (Figure 4.9 (C)). This can also be seen from the voltage-current and
power curves (Figure 4.9 (A-B)). OCP of the EBFC was first decreased from 0.558 V to 0.539
V and then increased to 0.547 V. This might be because of the instabilities of the EBFC over
time such as; the solution of the EBFC was refreshed before each polarization test, the
electrodes were disturbed from their steady-state. Thus, fluctuations from expected trends can
be possible.
Although the same glucose concentration was added before each polarization test, a continuous
feeding system would be a better solution to test the stability of the EBFC. Another approach
to test the stability was taken to have better view of the performance of the EBFC. A constant
glucose feeding system was designed using a peristaltic pump operating at a flow rate of 0.3
mL min-1. The flow rate of glucose stock solution was chosen an estimate to be high enough to
maintain same glucose concentrations and low enough to prevent leaking due to excessive
pressure in the stack cell. However, optimization of the flow rate would be necessary for future
studies. Figure 4.11 shows the stability of the air breathing EBFC under 4 kΩ external load.
Anode and cathode potentials were recorded individually versus Ag/AgCl electrode to have a
better view on the performance of the biofuel cell.
Page 151
Chapter 4. A Glucose-Air Enzymatic Biofuel Cell with Pyranose-2-Oxidase
122
Figure 4. 9. Fuel cell performance parameters at different times of polarisation for air-breathing
EBFCs using P2O-T169G and BOD at the anode and cathode respectively. (A) Voltage-Current
(B) Power curve (C) OCP-Max. Power versus time. Enzymes concentrations of 10 mg mL-1
and 4 mg mL-1 were used for anode and cathode respectively and were both immobilised on
carbon paper electrodes (surface area: 1.77 cm2). EBFCs were tested at batch mode using stack
cell design in aerated solutions of 0.1 M PBS at pH 7 containing 5.5 mM glucose. The maximum
power values were obtained at 4 kΩ.
Figure 4.10 shows the continuous potential values of the cell and the power production from
the air breathing biofuel cell for 18 days. The cell voltage values showed a consistent decay
during the first 24 h (down to ~32 % capacity) and stabilized for the following 2 days (~23 and
~ 21 % capacity on 2nd and 3rd day respectively) resulting an average power density value of a
5.3 µW cm-2.
0
0.1
0.2
0.3
0.4
0.5
0.6
0 100 200
Cel
l V
olt
age
/ V
Current / µA
initial
after 14h
after 22h
after 37h
0
10
20
30
40
50
0 100 200
Pow
er /
µW
Current / µA
initialafter 14hafter 22hafter 37h
0
20
40
60
0.535
0.540
0.545
0.550
0.555
0.560
0 10 20 30
Pow
er /
µW
Volt
age
/ V
Time / h
OCP
Max. Power
(B) (A)
(C)
Page 152
Chapter 4. A Glucose-Air Enzymatic Biofuel Cell with Pyranose-2-Oxidase
123
Figure 4. 10. (A) Cell voltage, anode and cathode potentials and (B) Percentage power density
change of the EBFC over time during continuous operation of 18 days. P2O-T169G (10 mg
mL-1) and BOD (4 mg mL-1) were used at the anode and cathode respectively and were both
immobilised on carbon paper electrodes (surface area: 1.77 cm2). EBFCs were tested at
continuous mode using stack cell design with a flow rate of 0.3 mL min-1 in aerated solutions
of 0.1 M PBS at pH 7 containing 5.5 mM glucose.
The cell voltage then exponentially decayed for the next two weeks of operation reaching a
final value of 60 mV with a power density value of a 0.57 µW cm-2. During the 13th day of the
-0.1
0
0.1
0.2
0.3
0.4
0.5
0.6
0 5 10 15
Volt
age
/ V
Time / days
Cell Voltage Anode Potential Cathode Potential
0
10
20
30
40
50
60
70
80
90
100
0 5 10 15
% P
ow
er
Time / days
(A)
(B)
Page 153
Chapter 4. A Glucose-Air Enzymatic Biofuel Cell with Pyranose-2-Oxidase
124
operation, the load on the cell was removed and left at OCP for 24 h. It was intended to observe
the behaviour of the cell during the OCP state and re-applying load. It was found out that after
the resting period the cell was maintained the cell voltage from where it was left of. This
indicates that the decrease in cell voltage strongly depended of the enzyme activities. The anode
and cathode potentials suggest that the overall cell performance was limited by anode especially
during the first week of the operation. This is similar with the findings obtained from
polarisation experiments. The reason for the initial decay might be due to denaturation and/or
inactivation of the enzyme at the anode during a week of operation (Wieckowski, 2009). Later
the cathode also showed decreasing voltage characteristics accordingly with anode.
Furthermore, the reason why the sharp decay in the first 24 h following by moderate decrease
in the next few days might be also because of the external load chosen as it was rather closer to
the maximum current density of the biofuel cell. Selecting the external resistance that is
associated with the maximum sustainable power is very difficult as the rate of the charge
transfer at the current limiting electrode or the potential across the fuel cell cannot be controlled
externally (Menicucci et al., 2006). High instantaneous electric currents might be achieved
which results higher than the maximum sustainable rate of charge transfer from the current
limiting electrode, in this case, the anode (Menicucci et al., 2006). As a result, more studies
should be carried out regarding to determining the optimum external load for sustainable power
production. Cathode potential, on the other hand, was only decreased by 10 % during 3 days of
operation. This is promising because if the anode is improved, more stable biofuel cells can be
obtained.
4.4. Conclusions
In this chapter, the performance and stability of glucose/O2 fuel cells were investigated using
P2O-T169G, GOx at the anode and BOD at the cathode. The EBFC based on P2O-T169G
showed an increasing performance by 40 % when oxygen is present in the glucose solution
(from. 6.89 to 9.56 µW cm-2) which suggests that P2O-T169G was not affected from oxygen
which is a significant improvement for EBFC anodes. On the other hand, EBFC was limited by
cathode due to insufficient oxygen concentration in the solution although it was aerated prior
to tests. Oxygen limitation was found to be an important parameter for stable cathode to
enhance overall biofuel cell performance As a result, this becomes a design problem as the
amount of dissolved oxygen in liquid phase will always be limited to a point.
Page 154
Chapter 4. A Glucose-Air Enzymatic Biofuel Cell with Pyranose-2-Oxidase
125
The performance of P2O-T169G based biofuel cell was also compared with GOx based biofuel
cells using aerated glucose solutions. Maximum power density values of 8.45±1.6 and
6.34±0.88 µW cm-2 were obtained for P2O-T169G and GOx respectively. P2O-T169G based
anode showed ~25 % more current density than GOx. Furthermore, GOx based biofuel cell
showed poorer cathodic performance suggesting that GOx might be utilizing oxygen. This is
an important discovery towards the use of P2O-T169G as an alternative to GOx in biofuel cell
applications. Further investigation of P2O-T169G based anode configuration should also be
conducted to improve the anodic performance of the biofuel cell.
Finally, an air breathing bio fuel cell based on P2O-T169G and BOD was successfully achieved
resulting an OCP of 0.558 V and the maximum power density of 29.8±6.1 µW cm-2 (34 µW
cm-2 for the best test) at 0.318 V. The stability of fuel cell was observed for a duration of 18
days and the current-limiting electrode was found to be the anode. Power density of 5.3 µW
cm-2 was achieved after the fast decay within the first 24 h and stabilised for 2 days. The cell
voltage then exponentially decayed for the next two weeks of operation reaching a final value
of 60 mV with a power density value of a 0.57 µW cm-2.The results were relatively good
compared to literature, however, further investigations of fuel cell operation conditions needs
to be carried out to optimise the sustainable power output of the biofuel cell.
Page 155
Chapter 4. A Glucose-Air Enzymatic Biofuel Cell with Pyranose-2-Oxidase
126
Page 156
127
Chapter 5. Conclusion and Recommendations for Future Work
5.1. Conclusion
The aim of this project was to develop an enzymatic biofuel cell that can produce power from
glucose using pyronase-2-oxidase (P2O) enzyme. This study demonstrated the electrochemical
behaviour of P2O in solution or immobilised onto electrode surface under human physiological
conditions. A membrane-less enzymatic biofuel cell was developed based on P2O with good
current density and stability. Comparative analyses were conducted using glucose oxidase
(GOx) since it is one of the most employed enzymes in enzymatic electrode fabrication.
P2O and its mutants was first characterised when free in solution with ferrocene carboxylic acid
(FcCOOH) mediator using electrochemical techniques in terms of catalytic activity, glucose
affinity, oxygen utilisation and stability. P2O-T169G mutant exhibited promising performance
with good catalytic activity and stability suggesting significant advantage over GOx in aerobic
conditions. Although providing simplicity in design and operation, using enzymes in solution
is not practical. It was, however, helpful to understand the electrochemical behaviour of P2O
enzymes towards their utilisation for immobilised systems.
The performance of P2O-T169G and GOx were later investigated using different
immobilization techniques. A novel immobilisation method incorporating MWCNTs into Fc-
Nafion films was developed to achieve successful immobilisation. This is one of the good
methods for using Fc mediator in literature, however, it should further be improved and tested
in terms of enzyme deactivation or denaturation. P2O-T169G was showed not to utilise oxygen
for glucose oxidation where, GOx was significantly affected. This is an important outcome
from this study validating the steady-state kinetic experiments reported in literature using
electrochemical methods.
Finally, the performance and stability of glucose/O2 fuel cells were investigated. Fc-Nafion-
MWCTNs based anode combined with the promising properties of P2O-T169 showed better
performance than widely studied GOx under same circumstances. This is one of the most
significant outcomes of this study as it leads the way towards the use of P2O enzyme instead
of GOx in biofuel cell applications. Furthermore, a well-stable biocathode based on BOD
showed very good performance especially with the air-breathing cathode design. Further
investigations could be made to enhance mechanical properties of the enzyme electrode to have
Page 157
Chapter 5. Conclusions and Recommendations for Future Work
128
even more stable cathodes using new materials such as graphene. It is expected that developed
electrodes will be helpful to take a step forward for the applications of EBFCs and also useful
for the development of biosensors.
5.2. Recommendations for Future Work
5.2.1. Optimization of Enzyme Electrodes and EBFC
An enzymatic fuel cell using P2O-T169G and BOD enzymes at the anode and cathode side
respectively have been successfully developed in this study. However, further optimization of
enzymatic electrodes is needed to get better performance of the enzymatic fuel cell and improve
its stability. Therefore, following project objectives are outlined for the scoop of the future
work;
Optimization of enzymatic electrodes (anode and cathode) to be used in enzymatic fuel
cells will be carried out. Especially more work needs to be carried out for P2O and GOx
such as testing same unit of enzymes for better comparison of the enzymes between
each other and the reported values in literature.
Testing optimized electrodes in an enzymatic fuel cells design (stack) with/without
oxygen present for comparative study by using carbon paper electrodes (alternative
electrodes could also be used) and using different modes (batch, continuous, closed and
air-breathing mode).
Stability experiments for the enzymatic fuel cell in a continuous flow mode. This can
be further expanded to a microfluidic system using different electrodes such as gold.
Testing the enzymatic fuel cell for real samples such as blood, fruit juice and etc.
5.2.2. Enzymes
Pyranose-2-Oxidase mutant T169G (P2O-T169G) was shown to have good electrochemical
performance for biofuel cells applications, however, genetic modifications are needed to obtain
this enzyme which might be a limitation for mass production. Pyranose dehydrogenase (PDH)
on the other hand, is a fungal flavin-dependent sugar oxidoreductase with a molecular mass of
66.5 kD, related to the P2O both structurally and catalytically (Tan et al., 2013). It was also
reported to show similar biological functions (Tan et al., 2013). The main difference between
PDH and P2O is that, PDH does not utilise oxygen as an electron acceptor which can be
Page 158
Chapter 5. Conclusions and Recommendations for Future Work
129
important for membrane-less biofuel cell design where oxygen is also needed for the cathodic
reaction (Yakovleva et al., 2012). The structure of PDH is shown in Figure 5.1.
Figure 5. 1. Structure of PDH from Agaricus meleagris (Tan et al., 2013)
The enzymatic biofuel cells utilising PDH enzyme show promising results when used with
osmium polymers (Shao et al., 2013; Ó Conghaile et al., 2016). Osmium polymer, as explained
in Chapter 2, is still a concern especially for long term stable biofuel cell applications due to
their toxic and non-biocompatible natures (Hao Yu and Scott, 2010). However, a novel
immobilization method developed in this study incorporating ferrocene, nafion and multi-
walled carbon nanotubes would be a good alternative to utilise PHD for bio-sensing and biofuel
cell applications.
5.2.3. Materials for Electrode Fabrication
Graphene has become very popular in enzymatic biofuel cell electrode fabrication due to its
promising properties such as very high surface areas (2630 m2 g-1), high mechanical
conductivity and easy of functionalization. (Babadi et al., 2016). Electron transfer abilities of
graphene was already presented in literature for anodic or cathodic electrode fabrication (Shan
et al., 2009; Lalaoui et al., 2015). Figure 5.2 shows a representation of the use of graphene with
multi-walled carbon nanotubes (MWCNTs) in oxygen reduction by laccase.
Page 159
Chapter 5. Conclusions and Recommendations for Future Work
130
Figure 5. 2. Schematic for oxygen reduction by laccase using graphene-multi-walled carbon
nanotubes assembly (Lalaoui et al., 2015)
The feasibility of using reduced graphene oxide (rGO) was tested using different dispersions in
ethanol (1 mg mL-1) and mixture with MWCNTs (rGO-MWCNTs) were tested when for
oxygen reduction by bilirubin oxidase (BOD). BOD was immobilised on modified electrodes
as explained in Chapter 4 and tested in PBS at pH 7.
Figure 5.3 shows the CVs of BOD immobilised on rGO and rGO+MWCNTs modified
electrodes. The electrochemical activity of BOD using graphene as electrode material has been
successfully achieved. A mixture of MWCNTs and rGO was also prepared and it can be seen
from Figure 5.3 (B) that the catalytic current response of MWCNTs was enhanced when mixed
with rGO. Scanning-electrode microscopy (SEM) images of rGO and rGO+MWCNTs show
the incorporation of rGO in MWCNTs structure (Figure 5 insets). rGO was observed to form
thin flat flakes on the electrode surface, on the other hand when mixed with MWCNTs, it wraps
around the nanotubes and creates intermolecular connections. This might be the reason of the
enhanced catalytic current response. These results are very encouraging towards the use of
graphene in fabricating enzyme electrodes as it could also be used to improve the electron
transfer for glucose oxidation.
Page 160
Chapter 5. Conclusions and Recommendations for Future Work
131
Figure 5. 3. CVs of BOD immobilised on (A) rGO (inset: SEM image, 4 µm magnification)
and (B) rGO+MWCNTs (inset: SEM image, 4 µm magnification) modified electrodes, tested
in air and/or nitrogen saturated PBS at pH 7, 5 mV s-1 scan rate
5.2.4. Biofuel Cell Design
Different strategies can be used to design enzymatic biofuel cells where micro chemical systems
have several advantages towards the miniaturization of energy conversion for implantable
-200
-100
0
100
200
300
-0.1 0.1 0.3 0.5 0.7
j /
µA
cm
-2
E / V (vs Ag)
Nitrogen Air
-150
-100
-50
0
50
100
150
200
-0.1 0.1 0.3 0.5 0.7
j /
µA
cm
-2
E / V (vs Ag)
MWCNTs rGO + MWCNTs
Page 161
Chapter 5. Conclusions and Recommendations for Future Work
132
applications (Zebda et al., 2011). Therefore, microfluidic systems have been popular in the field
of enzymatic biofuel cell design (Togo et al., 2007; Zebda et al., 2009; González-Guerrero et
al., 2013). Figure 5.4 shows a glucose/O2 microfluidic biofuel cell which can produce a power
density of 110 µW cm2 at 0.3 V with 10 mM glucose at 23 C.
This type of fuel cells based on non-mixing two streams due to laminar fluid flows, therefore
specific streams can be fed for anode and cathode to eliminate negative effects such as oxygen
at the anode (Zebda et al., 2011). However, when used with enzymes such as P2O-T169G, the
complication of the design in microfluidic systems can be eliminated as it does not utilise
oxygen for glucose oxidation. Furthermore, air-breathing add-on could also be added to this
type of fuel cells. As a result, a novel microfluidic enzymatic fuel cell based on P2O-T169G at
the anode combined with air-breathing cathode based on BOD would be promising for future
studies.
Figure 5. 4. (A) Scheme of Y-shaped glucose/O2 microfluidic biofuel cell (B) PDMS-glass
device.
Page 162
133
Appendix
Appendix A
Figure A. 1. CV (scan rate: 10 mV s-1) scans of nitrogen saturated solution experiments with
P2O-WT. Tests were performed at various scan rates of 0.5 V s-1 (outer scan), 0.4 V s-1, 0.3 V
s-1, 0.2 V s-1, 0.1 V V s-1, 0.05 V s-1 and 0.01 V s-1 (inner scan) with 0 mM glucose concentration
of 0.5 mM FcCOOH in PBS at pH 7. (GCE surface area: 0.071 cm2).
Figure A. 2. CV (scan rate: 10 mV s-1) scans of nitrogen saturated solution experiments with
P2O-WT. Tests were performed at various scan rates of 0.5 V s-1 (outer scan), 0.4 V s-1, 0.3 V
s-1, 0.2 V s-1, 0.1 V V s-1, 0.05 V s-1 and 0.01 V s-1 (inner scan) with 2 mM glucose concentration
of 0.5 mM FcCOOH in PBS at pH 7. (GCE surface area: 0.071 cm2).
Page 163
Appendix
134
Figure A. 3. CV (scan rate: 10 mV s-1) scans of nitrogen saturated solution experiments with
P2O-T169S. Tests were performed at various scan rates of 0.5 V s-1 (outer scan), 0.4 V s-1, 0.3
V s-1, 0.2 V s-1, 0.1 V V s-1, 0.05 V s-1 and 0.01 V s-1 (inner scan) with 0 mM glucose
concentration of 0.5 mM FcCOOH in PBS at pH 7. (GCE surface area: 0.071 cm2).
Figure A. 4. CV (scan rate: 10 mV s-1) scans of nitrogen saturated solution experiments with
P2O-T169S. Tests were performed at various scan rates of 0.5 V s-1 (outer scan), 0.4 V s-1, 0.3
V s-1, 0.2 V s-1, 0.1 V V s-1, 0.05 V s-1 and 0.01 V s-1 (inner scan) with 2 mM glucose
concentration of 0.5 mM FcCOOH in PBS at pH 7. (GCE surface area: 0.071 cm2).
Page 164
Appendix
135
Figure A. 5. CV (scan rate: 10 mV s-1) scans of nitrogen saturated solution experiments with
P2O-T169G. Tests were performed at various scan rates of 0.5 V s-1 (outer scan), 0.4 V s-1, 0.3
V s-1, 0.2 V s-1, 0.1 V V s-1, 0.05 V s-1 and 0.01 V s-1 (inner scan) with 0 mM glucose
concentration of 0.5 mM FcCOOH in PBS at pH 7. (GCE surface area: 0.071 cm2).
Figure A. 6. CV (scan rate: 10 mV s-1) scans of nitrogen saturated solution experiments with
P2O-T169G. Tests were performed at various scan rates of 0.5 V s-1 (outer scan), 0.4 V s-1, 0.3
V s-1, 0.2 V s-1, 0.1 V V s-1, 0.05 V s-1 and 0.01 V s-1 (inner scan) with 2 mM glucose
concentration of 0.5 mM FcCOOH in PBS at pH 7. (GCE surface area: 0.071 cm2).
Page 165
Appendix
136
Figure A. 7. Raw data for the LSV (scan rate: 1 mV s-1) scans of nitrogen saturated solutions
with 2 mM concentrations of glucose added to the solution containing 0.5 mM FcCOOH and 1
mg mL-1 concentrations of P2O-WT, P2O-T169S and P2O-T169G at pH 7. (GCE surface area:
0.071 cm2)
Figure A. 8. LSV (scan rate: 1 mV s-1) scans of P2O-WT (1 mg mL-1 in PBS) in nitrogen and
air saturated solutions with 1 mM concentrations of glucose added to the solution containing
0.5 mM FcCOOH in PBS at pH 7. (GCE surface area: 0.071 cm2).
Page 166
Appendix
137
Figure A. 9. LSV (scan rate: 1 mV s-1) scans of nitrogen saturated solutions with various
glucose concentrations added to the solution containing 0.5 mM FcCOOH and 1 mg mL-1 GOx
in PBS at pH 7. (GCE surface area: 0.071 cm2).
Figure A. 10. CV (scan rate: 10 mV s-1) scans of nitrogen saturated solution experiments with
GOx. Tests were performed at various scan rates of 0.5 V s-1 (outer scan), 0.4 V s-1, 0.3 V s-1,
0.2 V s-1, 0.1 V V s-1, 0.05 V s-1 and 0.01 V s-1 (inner scan) with 0 mM glucose concentration
of 0.5 mM FcCOOH in PBS at pH 7. (GCE surface area: 0.071 cm2).
Page 167
Appendix
138
Figure A. 11. CV (scan rate: 10 mV s-1) scans of nitrogen saturated solution experiments with
GOx. Tests were performed at various scan rates of 0.5 V s-1 (outer scan), 0.4 V s-1, 0.3 V s-1,
0.2 V s-1, 0.1 V V s-1, 0.05 V s-1 and 0.01 V s-1 (inner scan) with 2 mM glucose concentration
of 0.5 mM FcCOOH in PBS at pH 7. (GCE surface area: 0.071 cm2).
Figure A. 12. CAs (1 h length) of air saturated solutions for P2O-T169G (1 mg mL-1) at 0.350
V for 0 mM and 4 mM concentrations of glucose added to the solution containing 0.5 mM
FcCOOH, at pH 7. (GCE, surface area: 0.071 cm2).
Page 168
Appendix
139
Figure A. 13. CAs (1 h length) of air saturated solutions for GOx (1 mg mL-1) at 0.350 V for 0
mM and 4 mM concentrations of glucose added to the solution containing 0.5 mM FcCOOH,
at pH 7. (GCE, surface area: 0.071 cm2).
Figure A. 14. CAs (3 h length) of air saturated solutions for P2O-T169G (1 mg mL-1) at 0.350
V for 4 mM concentration of glucose added to the solution containing 0.5 mM FcCOOH, at pH
7. (GCE, surface area: 0.071 cm2).
Page 169
Appendix
140
Figure A. 15. CAs (3 h length) of air saturated solutions for GOx (1 mg mL-1) at 0.350 V for 4
mM concentration of glucose added to the solution containing 0.5 mM FcCOOH, at pH 7.
(GCE, surface area: 0.071 cm2).
Page 170
141
Appendix B
Figure B. 1. CV (scan rate: 5 mV s-1) scans of carbon SPE to show reproducibility of the
electrode. Tested in 0.1 M PBS at pH 7. Ag is the silver/silver ion reference electrode used on
the SPE (SPE surface area: 0.126 cm2). Error bars are sample standard deviations of
measurements on n = 4 samples.
Figure B. 2. CV (scan rate: 5 mV s-1) scans of carbon SPEs to show its activity towards glucose.
Tested in 0.1 M PBS at pH 7 containing 0 mM and 5.5 mM glucose. Ag is the silver/silver ion
reference electrode used on the SPE (SPE surface area: 0.126 cm2). Graphs shown are mean
values based on n = 2 samples.
Page 171
Appendix
142
Figure B. 3. CV (scan rate: 5 mV s-1) scans of carbon SPEs modified with Fc-Nafion-MWCNTs
and then treated with PBSE to show its activity towards glucose. Tested in 0.1 M PBS at pH 7
containing 0 mM and 5.5 mM glucose. Ag is the silver/silver ion reference electrode used on
the SPE (SPE surface area: 0.126 cm2). Graphs shown are mean values based on n = 2 samples.
Figure B. 4. CV (scan rate: 5 mV s-1) scans of GOx adsorbed on carbon SPEs to show its
activity towards glucose. Tested in 0.1 M PBS at pH 7 containing 0 mM and 2 mM glucose.
Ag is the silver/silver ion reference electrode used on the SPE (SPE surface area: 0.126 cm2).
Page 172
Appendix
143
Figure B. 5. LSV (scan rate: 1 mV s-1) scans of P2O-T169G immobilised on carbon SPE.
Tested in nitrogen saturated solutions with various glucose concentrations added to the solution
containing 0.5 mM FcCOOH in 0.1 M PBS at pH 7. Ag is the silver/silver ion reference
electrode used on the SPE (SPE surface area: 0.126 cm2).
Figure B. 6. CV (scan rate: 5 mV s-1) scans of GOx immobilised on carbon SPE. Tested in
nitrogen saturated solutions with various glucose concentrations added to the solution
containing 0.5 mM FcCOOH in 0.1 M PBS at pH 7. Ag is the silver/silver ion reference
electrode used on the SPE (SPE surface area: 0.126 cm2).
Page 173
Appendix
144
Figure B. 7. LSV (scan rate: 1 mV s-1) scans of GOx immobilised on carbon SPE. Tested in
nitrogen saturated solutions with various glucose concentrations added to the solution
containing 0.5 mM FcCOOH in 0.1 M PBS at pH 7. Ag is the silver/silver ion reference
electrode used on the SPE (SPE surface area: 0.126 cm2).
Figure B. 8. CV (scan rate: 5 mV s-1) scans of P2O-T169G immobilised on carbon SPE. Tested
in nitrogen saturated solutions with various glucose concentrations added to the solution
containing 0.5 mM FcCOOH in 0.1 M PBS at pH 7. Ag is the silver/silver ion reference
electrode used on the SPE (SPE surface area: 0.126 cm2).
Page 174
Appendix
145
Figure B. 9. CV (scan rate: 50 mV s-1) scans for the pre-conditioning of the carbon SPEs
modified with Fc-Nafion. Tested in 0.1 M PBS at pH 7. Fc-Nafion loading is 0.06 mg cm-2. Ag
is the silver/silver ion reference electrode used on the SPE (SPE surface area: 0.126 cm2).
Page 175
146
Appendix C
Figure C. 1. CV (scan rate: 5 mV s-1) scans of MWCNTs modified carbon SPE (MWCNTs
loading of 0.08 mg cm-1) to show its inactivity towards oxygen present. Tested in nitrogen and
air saturated solutions containing 0.1 M PBS at pH 7. Ag is the silver/silver ion reference
electrode used on the SPE (SPE surface area: 0.126 cm2).
Figure C. 2. Log-log plot of non-aerated and aerated anode-cathode potentials versus current
curves obtained from enzymatic biofuel cell tests
y = 0.02x + 0.06
R² = 0.97
y = 0.02x + 0.09
R² = 0.97
0.01
0.1
1
1 10
Volt
age
/ V
Current / µA
without Air
with Air
Page 176
Appendix
147
Figure C. 3. Stability of the air-breathing biofuel cell under batch operation
0
0.1
0.2
0.3
0.4
0.5
0.6
0 5 10 15 20 25 30 35
Cel
l V
olt
ag
e /
V
Time / h
0.551 V-OCP after test
External load
applied (4 kΩ)
Glucose solution
(5.5 mM)
External load
applied (4 kΩ)
External resistance removed
Glucose solution
(5.5 mM)
Page 177
148
Appendix D
Publications from this work:
Sahin, S., Wongnate, T., Chaiyen, P., and Yu, E.H., Glucose Oxidation Using Oxygen Resistant
Pyranose-2-Oxidase for Biofuel Cell Applications. Chemical Engineering Transactions, 41,
2014, 367-372.
Oral presentations at conferences:
10th European Symposium on Electrochemical Engineering, Sardinia, Italy, September 28th to
October 2nd. Presentation titled ‘Glucose Oxidation Using Oxygen Resistant Pyranose-2-
Oxidase for Biofuel Cell Applications’.
Page 178
149
References
Ahmadi, M., Vahabzadeh, F., Bonakdarpour, B. and Mehranian, M. (2006) 'Empirical
modeling of olive oil mill wastewater treatment using loofa-immobilized Phanerochaete
chrysosporium', Process Biochemistry, 41(5), pp. 1148-1154.
Alexeyeva, N. and Tammeveski, K. (2008) 'Electroreduction of oxygen on gold
nanoparticle/PDDA-MWCNT nanocomposites in acid solution', Anal Chim Acta, 618(2), pp.
140-6.
Alkire, R.C., Kolb, D.M., Lipkowski, J. and Ross, P.N. (2013) Bioelectrochemistry:
fundamentals, applications and recent developments. John Wiley & Sons.
Allen, J.B. and Larry, R.F. (2001) 'Electrochemical methods: fundamentals and applications',
Department of Chemistry and Biochemistry University of Texas at Austin, John Wiley & Sons,
Inc, pp. 156-176.
Andoralov, V., Falk, M., Suyatin, D.B., Granmo, M., Sotres, J., Ludwig, R., Popov, V.O.,
Schouenborg, J., Blum, Z. and Shleev, S. (2013) 'Biofuel Cell Based on Microscale
Nanostructured Electrodes with Inductive Coupling to Rat Brain Neurons', Scientific Reports,
3, p. 3270.
Arribas, A.S., Bermejo, E., Chicharro, M., Zapardiel, A., Luque, G.L., Ferreyra, N.F. and Rivas,
G.A. (2007) 'Analytical applications of glassy carbon electrodes modified with multi-wall
carbon nanotubes dispersed in polyethylenimine as detectors in flow systems', Analytica
chimica acta, 596(2), pp. 183-194.
Babadi, A.A., Bagheri, S. and Hamid, S.B.A. (2016) 'Progress on implantable biofuel cell:
Nano-carbon functionalization for enzyme immobilization enhancement', Biosensors and
Bioelectronics, 79, pp. 850-860.
Baminger, U., Subramaniam, S.S., Renganathan, V. and Haltrich, D. (2001) 'Purification and
Characterization of Cellobiose Dehydrogenase from the Plant Pathogen Sclerotium (Athelia)
rolfsii', Applied and Environmental Microbiology, 67(4), pp. 1766-1774.
Bard, A.J., Faulkner, L.R., Leddy, J. and Zoski, C.G. (1980) Electrochemical methods:
fundamentals and applications. Wiley New York.
Page 179
References
150
Barrière, F., Kavanagh, P. and Leech, D. (2006) 'A laccase–glucose oxidase biofuel cell
prototype operating in a physiological buffer', Electrochimica Acta, 51(24), pp. 5187-5192.
Bartlett, P.N. and Pratt, K.F.E. (1995) 'A study of the kinetics of the reaction between ferrocene
monocarboxylic acid and glucose oxidase using the rotating-disc electrode', Journal of
Electroanalytical Chemistry, 397(1–2), pp. 53-60.
Barton, S.C., Kim, H.-H., Binyamin, G., Zhang, Y. and Heller, A. (2001) 'Electroreduction of
O2 to water on the “wired” laccase cathode', The Journal of Physical Chemistry B, 105(47), pp.
11917-11921.
Baughman, R.H., Zakhidov, A.A. and de Heer, W.A. (2002) 'Carbon nanotubes--the route
toward applications', science, 297(5582), pp. 787-792.
Bedekar, A.S., Feng, J.J., Krishnamoorthy, S., Lim, K.G., Palmore, G.T.R. and Sundaram, S.
(2007) 'Oxygen limitation in microfluidic biofuel cells', Chemical Engineering
Communications, 195(3), pp. 256-266.
Berg, J.M., Tymoczko, J.L. and Stryer, L. (2002) 'Biochemistry: International Version'.
Blake, N.P., Petersen, M.K., Voth, G.A. and Metiu, H. (2005) 'Structure of hydrated Na-Nafion
polymer membranes', The Journal of Physical Chemistry B, 109(51), pp. 24244-24253.
Bourourou, M., Elouarzaki, K., Lalaoui, N., Agnès, C., Le Goff, A., Holzinger, M., Maaref, A.
and Cosnier, S. (2013) 'Supramolecular immobilization of laccase on carbon nanotube
electrodes functionalized with (methylpyrenylaminomethyl) anthraquinone for direct electron
reduction of oxygen', Chemistry–A European Journal, 19(28), pp. 9371-9375.
Brett, C., Brett, M.A.O., Brett, A.M.C.M.A. and Brett, A.M.O. (1993) Electrochemistry:
principles, methods, and applications.
Britto, P.J., Santhanam, K.S.V., Rubio, A., Alonso, J.A. and Ajayan, P.M. (1999) 'Improved
charge transfer at carbon nanotube electrodes', Advanced Materials, 11(2), pp. 154-157.
Brooks, S.L., Ashby, R.E., Turner, A.P.F., Calder, M.R. and Clarke, D.J. (1988) 'Development
of an on-line glucose sensor for fermentation monitoring', Biosensors, 3(1), pp. 45-56.
Page 180
References
151
Brown, R.S. and Luong, J.H.T. (1995) 'A regenerable pseudo-reagentless glucose biosensor
based on Nafion polymer and l, 1'-dimethylferricinium mediator', Analytica chimica acta,
310(3), pp. 419-427.
Brunel, L., Denele, J., Servat, K., Kokoh, K.B., Jolivalt, C., Innocent, C., Cretin, M., Rolland,
M. and Tingry, S. (2007) 'Oxygen transport through laccase biocathodes for a membrane-less
glucose/O 2 biofuel cell', Electrochemistry Communications, 9(2), pp. 331-336.
Bu, H.-Z., Mikkelsen, S.R. and English, A.M. (1998) 'NAD (P) H sensors based on enzyme
entrapment in ferrocene-containing polyacrylamide-based redox gels', Analytical Chemistry,
70(20), pp. 4320-4325.
Bullen, R.A., Arnot, T.C., Lakeman, J.B. and Walsh, F.C. (2006) 'Biofuel cells and their
development', Biosensors and Bioelectronics, 21(11), pp. 2015-2045.
Bunte, C., Hussein, L. and Urban, G.A. (2014) 'Performance of non-compartmentalized
enzymatic biofuel cell based on buckypaper cathode and ferrocene-containing redox polymer
anode', Journal of Power Sources, 247, pp. 579-586.
Calabrese Barton, S., Gallaway, J. and Atanassov, P. (2004) 'Enzymatic Biofuel Cells for
Implantable and Microscale Devices', Chemical Reviews, 104(10), pp. 4867-4886.
Cass, A.E.G., Davis, G., Francis, G.D., Hill, H.A.O., Aston, W.J., Higgins, I.J., Plotkin, E.V.,
Scott, L.D.L. and Turner, A.P.F. (1984) 'Ferrocene-mediated enzyme electrode for
amperometric determination of glucose', Analytical chemistry, 56(4), pp. 667-671.
Castorena-Gonzalez, J.A., Foote, C., MacVittie, K., Halámek, J., Halámková, L., Martinez-
Lemus, L.A. and Katz, E. (2013) 'Biofuel Cell Operating in Vivo in Rat', Electroanalysis, 25(7),
pp. 1579-1584.
Chen, J.W., Bélanger, D. and Fortier, G. (1992) ACS Symposium Series. American Chemical
Soc 1155 16th St, NW, Washington, DC 20036 USA.
Chen, R.J., Zhang, Y., Wang, D. and Dai, H. (2001a) 'Noncovalent sidewall functionalization
of single-walled carbon nanotubes for protein immobilization', Journal of the American
Chemical Society, 123(16), pp. 3838-3839.
Page 181
References
152
Chen, T., Barton, S.C., Binyamin, G., Gao, Z., Zhang, Y., Kim, H.-H. and Heller, A. (2001b)
'A miniature biofuel cell', Journal of the American Chemical Society, 123(35), pp. 8630-8631.
Cheng, H., Yu, P., Lu, X., Lin, Y., Ohsaka, T. and Mao, L. (2013) 'Biofuel cell-based self-
powered biogenerators for online continuous monitoring of neurochemicals in rat brain',
Analyst, 138(1), pp. 179-185.
Christenson, A., Shleev, S., Mano, N., Heller, A. and Gorton, L. (2006) 'Redox potentials of
the blue copper sites of bilirubin oxidases', Biochimica et Biophysica Acta (BBA) -
Bioenergetics, 1757(12), pp. 1634-1641.
Cinquin, P., Gondran, C., Giroud, F., Mazabrard, S., Pellissier, A., Boucher, F., Alcaraz, J.-P.,
Gorgy, K., Lenouvel, F., Mathé, S., Porcu, P. and Cosnier, S. (2010) 'A Glucose BioFuel Cell
Implanted in Rats', PLoS ONE, 5(5), p. e10476.
Cohen, B. (1931) 'The bacterial culture as an electrical half-cell', J. Bacteriol, 21(1), pp. 18-19.
Cooney, M.J., Svoboda, V., Lau, C., Martin, G. and Minteer, S.D. (2008) 'Enzyme catalysed
biofuel cells', Energy & Environmental Science, 1(3), pp. 320-337.
Cosnier, S. (2000) 'Biosensors based on immobilization of biomolecules by electrogenerated
polymer films', Applied biochemistry and biotechnology, 89(2-3), pp. 127-138.
Cosnier, S., Holzinger, M. and Le Goff, A. (2014) 'Recent advances in carbon nanotube-based
enzymatic fuel cells', Frontiers in bioengineering and biotechnology, 2.
Costa, F., Carvalho, I.F., Montelaro, R.C., Gomes, P. and Martins, M.C.L. (2011) 'Covalent
immobilization of antimicrobial peptides (AMPs) onto biomaterial surfaces', Acta
Biomaterialia, 7(4), pp. 1431-1440.
Courjean, O., Gao, F. and Mano, N. (2009) 'Deglycosylation of glucose oxidase for direct and
efficient glucose electrooxidation on a glassy carbon electrode', Angewandte Chemie
International Edition, 48(32), pp. 5897-5899.
Cracknell, J.A., McNamara, T.P., Lowe, E.D. and Blanford, C.F. (2011) 'Bilirubin oxidase from
Myrothecium verrucaria: X-ray determination of the complete crystal structure and a rational
surface modification for enhanced electrocatalytic O2reduction', Dalton Transactions, 40(25),
pp. 6668-6675.
Page 182
References
153
Cracknell, J.A., Vincent, K.A. and Armstrong, F.A. (2008) 'Enzymes as working or
inspirational electrocatalysts for fuel cells and electrolysis', Chemical Reviews, 108(7), pp.
2439-2461.
Danilov, R.A. and Ekelund, N.G.A. (2001) 'Comparison of usefulness of three types of artificial
substrata (glass, wood and plastic) when studying settlement patterns of periphyton in lakes of
different trophic status', Journal of Microbiological Methods, 45(3), pp. 167-170.
Davis, J.B. and Yarbrough, H.F. (1962) 'Preliminary experiments on a microbial fuel cell',
Science, 137(3530), pp. 615-616.
Degani, Y. and Heller, A. (1988) 'Direct electrical communication between chemically
modified enzymes and metal electrodes. 2. Methods for bonding electron-transfer relays to
glucose oxidase and D-amino-acid oxidase', Journal of the American Chemical Society, 110(8),
pp. 2615-2620.
Deng, L., Shang, L., Wang, Y., Wang, T., Chen, H. and Dong, S. (2008) 'Multilayer structured
carbon nanotubes/poly-l-lysine/laccase composite cathode for glucose/O 2 biofuel cell',
Electrochemistry Communications, 10(7), pp. 1012-1015.
Digital, D. (2016) Blood Sugar Level Ranges. Available at:
http://www.diabetes.co.uk/diabetes_care/blood-sugar-level-ranges.html (Accessed: 14 May
2016).
Dong, S., Wang, B. and Liu, B. (1992) 'Amperometric glucose sensor with ferrocene as an
electron transfer mediator', Biosensors and Bioelectronics, 7(3), pp. 215-222.
Dörnenburg, H. and Knorr, D. (1995) 'Strategies for the improvement of secondary metabolite
production in plant cell cultures', Enzyme and Microbial Technology, 17(8), pp. 674-684.
DropSens (2016) Screen-printed electrodes. Available at:
http://www.dropsens.com/en/screen_printed_electrodes_pag.html (Accessed: 6 April 2016).
Du Toit, H. and Di Lorenzo, M. (2014) 'Glucose oxidase directly immobilized onto highly
porous gold electrodes for sensing and fuel cell applications', Electrochimica Acta, 138, pp. 86-
92.
Page 183
References
154
du Toit, H., Rashidi, R., Ferdani, D.W., Delgado-Charro, M.B., Sangan, C.M. and Di Lorenzo,
M. (2016) 'Generating power from transdermal extracts using a multi-electrode miniature
enzymatic fuel cell', Biosensors & Bioelectronics, 78, pp. 411-417.
Espenscheid, M.W., Ghatak-Roy, A.R., Moore, R.B., Penner, R.M., Szentirmay, M.N. and
Martin, C.R. (1986) 'Sensors from polymer modified electrodes', Journal of the Chemical
Society, Faraday Transactions 1: Physical Chemistry in Condensed Phases, 82(4), pp. 1051-
1070.
Facchini, P.J. and DiCosmo, F. (1990) 'Immobilization of cultured Catharanthus roseus cells
using a fibreglass substratum', Applied microbiology and biotechnology, 33(1), pp. 36-42.
Falk, M., Andoralov, V., Silow, M., Toscano, M.D. and Shleev, S. (2013a) 'Miniature Biofuel
Cell as a Potential Power Source for Glucose-Sensing Contact Lenses', Analytical Chemistry,
85(13), pp. 6342-6348.
Falk, M., Narváez Villarrubia, C.W., Babanova, S., Atanassov, P. and Shleev, S. (2013b)
'Biofuel Cells for Biomedical Applications: Colonizing the Animal Kingdom',
ChemPhysChem, 14(10), pp. 2045-2058.
Fatoni, A., Numnuam, A., Kanatharana, P., Limbut, W., Thammakhet, C. and Thavarungkul,
P. (2013) 'A highly stable oxygen-independent glucose biosensor based on a chitosan-albumin
cryogel incorporated with carbon nanotubes and ferrocene', Sensors and Actuators B:
Chemical, 185, pp. 725-734.
Fernández, L. and Carrero, H. (2005) 'Electrochemical evaluation of ferrocene carboxylic acids
confined on surfactant–clay modified glassy carbon electrodes: oxidation of ascorbic acid and
uric acid', Electrochimica Acta, 50(5), pp. 1233-1240.
Filik, H., A Avan, A. and Aydar, S. (2015) 'Nafion/Multi-wall Carbon Nanotubes Composite
Modified Glassy Carbon Electrode for Sensitive Determination of Bilirubin', Current
Nanoscience, 11(6), pp. 784-791.
Fiorito, P.A. and Torresi, S.I. (2001) 'Glucose amperometric biosensor based on the co-
immobilization of glucose oxidase (GOx) and ferrocene in poly (pyrrole) generated from
ethanol/water mixtures', Journal of the Brazilian Chemical Society, 12(6), pp. 729-733.
Page 184
References
155
Fischback, M.B., Youn, J.K., Zhao, X., Wang, P., Park, H.G., Chang, H.N., Kim, J. and Ha, S.
(2006) 'Miniature biofuel cells with improved stability under continuous operation',
Electroanalysis, 18(19‐20), pp. 2016-2022.
Galvani, L. (1791) '``De viribus electricitatis in motu musculari Commentarius''De bononiensi
scientiarum et artium instituto atque academia Commentarii (Bononiae), cited in Bernardi
(2000)'.
Gao, F., Courjean, O. and Mano, N. (2009) 'An improved glucose/O 2 membrane-less biofuel
cell through glucose oxidase purification', Biosensors and Bioelectronics, 25(2), pp. 356-361.
Gao, F., Yan, Y., Su, L., Wang, L. and Mao, L. (2007) 'An enzymatic glucose/O 2 biofuel cell:
preparation, characterization and performance in serum', Electrochemistry Communications,
9(5), pp. 989-996.
Ghica, M.E. and Brett, C.M.A. (2005) 'Development of a carbon film electrode ferrocene‐
mediated glucose biosensor', Analytical letters, 38(6), pp. 907-920.
Girelli, A.M. and Mattei, E. (2005) 'Application of immobilized enzyme reactor in on-line high
performance liquid chromatography: A review', Journal of Chromatography B, 819(1), pp. 3-
16.
Gold, S.A. (2012) 'Low-Temperature Fuel Cell Technology for Green Energy', in Handbook
of Climate Change Mitigation. Springer, pp. 1657-1702.
González-Guerrero, M.J., Esquivel, J.P., Sánchez-Molas, D., Godignon, P., Muñoz, F.X., Del
Campo, F.J., Giroud, F., Minteer, S.D. and Sabaté, N. (2013) 'Membraneless glucose/O 2
microfluidic enzymatic biofuel cell using pyrolyzed photoresist film electrodes', Lab on a Chip,
13(15), pp. 2972-2979.
Goodsell, D. (2006) Glucose Oxidase. Available at: http://pdb101.rcsb.org/motm/77.
Gorton, L., Karan, H.I., Hale, P.D., Inagaki, T., Okamoto, Y. and Skotheim, T.A. (1990) 'A
glucose electrode based on carbon paste chemically modified with a ferrocene-containing
siloxane polymer and glucose oxidase, coated with a poly (ester-sulfonic acid) cation-
exchanger', Analytica chimica acta, 228, pp. 23-30.
Page 185
References
156
Gregg, B.A. and Heller, A. (1991) 'Redox polymer films containing enzymes. 1. A redox-
conducting epoxy cement: synthesis, characterization, and electrocatalytic oxidation of
hydroquinone', The Journal of Physical Chemistry, 95(15), pp. 5970-5975.
Grove, W.R. (1839) 'XXIV. On voltaic series and the combination of gases by platinum', The
London and Edinburgh philosophical magazine and journal of science, 14(86), pp. 127-130.
Güven, G., Şahin, S., Güven, A. and Yu, E.H. (2016) 'Power Harvesting from Human Serum
in Buckypaper-Based Enzymatic Biofuel Cell', Frontiers in Energy Research, 4, p. 4.
Habrioux, A., Merle, G., Servat, K., Kokoh, K.B., Innocent, C., Cretin, M. and Tingry, S. (2008)
'Concentric glucose/O 2 biofuel cell', Journal of Electroanalytical Chemistry, 622(1), pp. 97-
102.
Habrioux, A., Servat, K., Tingry, S. and Kokoh, K.B. (2009) 'Enhancement of the performances
of a single concentric glucose/O 2 biofuel cell by combination of bilirubin oxidase/Nafion
cathode and Au–Pt anode', Electrochemistry Communications, 11(1), pp. 111-113.
Haccoun, J., Piro, B., Noël, V. and Pham, M.C. (2006) 'The development of a reagentless lactate
biosensor based on a novel conducting polymer', Bioelectrochemistry, 68(2), pp. 218-226.
Halámková, L., Halámek, J., Bocharova, V., Szczupak, A., Alfonta, L. and Katz, E. (2012)
'Implanted Biofuel Cell Operating in a Living Snail', Journal of the American Chemical Society,
134(11), pp. 5040-5043.
Hanashi, T., Yamazaki, T., Tsugawa, W., Ikebukuro, K. and Sode, K. (2011)
'BioRadioTransmitter: A Self-Powered Wireless Glucose-Sensing System', Journal of Diabetes
Science and Technology, 5(5), pp. 1030-1035.
Hao Yu, E. and Scott, K. (2010) 'Enzymatic Biofuel Cells—Fabrication of Enzyme Electrodes',
Energies, 3(1), p. 23.
Harkness, J.K., Murphy, O.J. and Hitchens, G.D. (1993) 'Enzyme electrodes based on ionomer
films coated on electrodes', Journal of Electroanalytical Chemistry, 357(1), pp. 261-272.
Harper, A. and Anderson, M.R. (2010) 'Electrochemical glucose sensors—developments using
electrostatic assembly and carbon nanotubes for biosensor construction', Sensors, 10(9), pp.
8248-8274.
Page 186
References
157
Harrison, D.J., Turner, R.F.B. and Baltes, H.P. (1988) 'Characterization of perfluorosulfonic
acid polymer coated enzyme electrodes and a miniaturized integrated potentiostat for glucose
analysis in whole blood', Analytical Chemistry, 60(19), pp. 2002-2007.
Hecht, H.J., Kalisz, H.M., Hendle, J., Schmid, R.D. and Schomburg, D. (1993a) 'Crystal
structure of glucose oxidase from aspergillus niger refined at 2· 3 å reslution', Journal of
molecular biology, 229(1), pp. 153-172.
Hecht, H.J., Schomburg, D., Kalisz, H. and Schmid, R.D. (1993b) 'The 3D structure of glucose
oxidase from Aspergillus niger. Implications for the use of GOD as a biosensor enzyme',
Biosensors and Bioelectronics, 8(3), pp. 197-203.
Heller, A. (2004) 'Miniature biofuel cells', Physical Chemistry Chemical Physics, 6(2), pp. 209-
216.
Heller, A. (2006) 'Electron-conducting redox hydrogels: design, characteristics and synthesis',
Current opinion in chemical biology, 10(6), pp. 664-672.
Ieropoulos, I., Winfield, J. and Greenman, J. (2010) 'Effects of flow-rate, inoculum and time
on the internal resistance of microbial fuel cells', Bioresource technology, 101(10), pp. 3520-
3525.
Iqbal, J., Iqbal, S. and Müller, C.E. (2013) 'Advances in immobilized enzyme microbioreactors
in capillary electrophoresis', Analyst, 138(11), pp. 3104-3116.
Ivanov, I., Vidaković-Koch, T. and Sundmacher, K. (2010) 'Recent Advances in Enzymatic
Fuel Cells: Experiments and Modeling', Energies, 3(4), p. 803.
Jadhav, D.A., Ghadge, A.N., Mondal, D. and Ghangrekar, M.M. (2014) 'Comparison of oxygen
and hypochlorite as cathodic electron acceptor in microbial fuel cells', Bioresource technology,
154, pp. 330-335.
Jönsson-Niedziolka, M., Kaminska, A. and Opallo, M. (2010) 'Pyrene-functionalised single-
walled carbon nanotubes for mediatorless dioxygen bioelectrocatalysis', Electrochimica Acta,
55(28), pp. 8744-8750.
Page 187
References
158
Jung, D., Streb, C. and Hartmann, M. (2010) 'Covalent anchoring of chloroperoxidase and
glucose oxidase on the mesoporous molecular sieve SBA-15', International journal of
molecular sciences, 11(2), pp. 762-778.
Kamitaka, Y., Tsujimura, S., Setoyama, N., Kajino, T. and Kano, K. (2007) 'Fructose/dioxygen
biofuel cell based on direct electron transfer-type bioelectrocatalysis', Physical Chemistry
Chemical Physics, 9(15), pp. 1793-1801.
Kang, C., Shin, H. and Heller, A. (2006) 'On the stability of the “wired” bilirubin oxidase
oxygen cathode in serum', Bioelectrochemistry, 68(1), pp. 22-26.
Kang, J., Hussain, A.T., Catt, M., Trenell, M., Haggett, B. and Yu, E.H. (2014) 'Electrochemical
detection of non-esterified fatty acid by layer-by-layer assembled enzyme electrodes', Sensors
and Actuators B: Chemical, 190, pp. 535-541.
Kannan, A.M., Renugopalakrishnan, V., Filipek, S., Li, P., Audette, G.F. and Munukutla, L.
(2009) 'Bio-batteries and bio-fuel cells: leveraging on electronic charge transfer proteins',
Journal of nanoscience and nanotechnology, 9(3), pp. 1665-1678.
Karyakin, A.A., Karyakina, E.E., Gorton, L., Bobrova, O.A., Lukachova, L.V., Gladilin, A.K.
and Levashov, A.V. (1996) 'Improvement of electrochemical biosensors using enzyme
immobilization from water-organic mixtures with a high content of organic solvent', Analytical
Chemistry, 68(24), pp. 4335-4341.
Kase, Y. and Muguruma, H. (2004) 'Amperometric glucose biosensor based on mediated
electron transfer between immobilized glucose oxidase and plasmapolymerized thin film of
dimethylaminomethylferrocene on sputtered gold electrode', Analytical sciences, 20(8), pp.
1143-1146.
Katz, E. (1994) 'Application of bifunctional reagents for immobilization of proteins on a carbon
electrode surface: oriented immobilization of photosynthetic reaction centers', Journal of
Electroanalytical Chemistry, 365(1-2), pp. 157-164.
Katz, E., Riklin, A., Heleg-Shabtai, V., Willner, I. and Bückmann, A.F. (1999a) 'Glucose
oxidase electrodes via reconstitution of the apo-enzyme: tailoring of novel glucose biosensors',
Analytica chimica acta, 385(1), pp. 45-58.
Page 188
References
159
Katz, E., Willner, I. and Kotlyar, A.B. (1999b) 'A non-compartmentalized glucose ∣ O2 biofuel
cell by bioengineered electrode surfaces', Journal of Electroanalytical Chemistry, 479(1), pp.
64-68.
Kim, H.-H., Mano, N., Zhang, Y. and Heller, A. (2003) 'A miniature membrane-less biofuel
cell operating under physiological conditions at 0.5 V', Journal of The Electrochemical Society,
150(2), pp. A209-A213.
Kim, J., Parkey, J., Rhodes, C. and Gonzalez-Martin, A. (2009) 'Development of a biofuel cell
using glucose-oxidase-and bilirubin-oxidase-based electrodes', Journal of Solid State
Electrochemistry, 13(7), pp. 1043-1050.
Koide, S. and Yokoyama, K. (1999) 'Electrochemical characterization of an enzyme electrode
based on a ferrocene-containing redox polymer', Journal of Electroanalytical Chemistry,
468(2), pp. 193-201.
Komaba, S., Mitsuhashi, T. and Shiraishi, S. (2008) 'Optimization of enzyme anode and cathode
with polyion complex for the application to biofuel cells', Electrochemistry, 76(8), pp. 619-624.
Krishnan, S. and Armstrong, F.A. (2012) 'Order-of-magnitude enhancement of an enzymatic
hydrogen-air fuel cell based on pyrenyl carbon nanostructures', Chemical Science, 3(4), pp.
1015-1023.
Kujawa, M., Ebner, H., Leitner, C., Hallberg, B.M., Prongjit, M., Sucharitakul, J., Ludwig, R.,
Rudsander, U., Peterbauer, C., Chaiyen, P., Haltrich, D. and Divne, C. (2006) 'Structural Basis
for Substrate Binding and Regioselective Oxidation of Monosaccharides at C3 by Pyranose 2-
Oxidase', Journal of Biological Chemistry, 281(46), pp. 35104-35115.
Kuwahara, T., Oshima, K., Shimomura, M. and Miyauchi, S. (2007) 'Properties of the enzyme
electrode fabricated with a film of polythiophene derivative and its application to a glucose fuel
cell', Journal of applied polymer science, 104(5), pp. 2947-2953.
Kwon, K.Y., Kim, J.H., Youn, J., Jeon, C., Lee, J., Hyeon, T., Park, H.G., Chang, H.N., Kwon,
Y. and Ha, S. (2014) 'Electrochemical Activity Studies of Glucose Oxidase (GOx)‐Based and
Pyranose Oxidase (POx)‐Based Electrodes in Mesoporous Carbon: Toward Biosensor and
Biofuel Cell Applications', Electroanalysis, 26(10), pp. 2075-2079.
Page 189
References
160
Lalaoui, N., Le Goff, A., Holzinger, M., Mermoux, M. and Cosnier, S. (2015) 'Wiring Laccase
on Covalently Modified Graphene: Carbon Nanotube Assemblies for the Direct Bio‐
electrocatalytic Reduction of Oxygen', Chemistry–A European Journal, 21(8), pp. 3198-3201.
Lange, M.A. and Chambers, J.Q. (1985) 'Amperometric determination of glucose with a
ferrocene-mediated glucose oxidase/polyacrylamide gel electrode', Analytica Chimica Acta,
175, pp. 89-97.
Larminie, J., Dicks, A. and McDonald, M.S. (2003) Fuel cell systems explained. Wiley New
York.
Laschi, S., Bulukin, E., Palchetti, I., Cristea, C. and Mascini, M. (2008) 'Disposable electrodes
modified with multi-wall carbon nanotubes for biosensor applications', Irbm, 29(2), pp. 202-
207.
Leech, D., Kavanagh, P. and Schuhmann, W. (2012) 'Enzymatic fuel cells: Recent progress',
Electrochimica Acta, 84, pp. 223-234.
Leitner, C., Volc, J. and Haltrich, D. (2001) 'Purification and Characterization of Pyranose
Oxidase from the White Rot Fungus Trametes multicolor', Applied and Environmental
Microbiology, 67(8), pp. 3636-3644.
Li, J., Chia, L.S., Goh, N.K., Tan, S.N. and Ge, H. (1997) 'Mediated amperometric glucose
sensor modified by the sol-gel method', Sensors and Actuators B: Chemical, 40(2), pp. 135-
141.
Li, X., Zhou, H., Yu, P., Su, L., Ohsaka, T. and Mao, L. (2008) 'A Miniature glucose/O 2 biofuel
cell with single-walled carbon nanotubes-modified carbon fiber microelectrodes as the
substrate', Electrochemistry Communications, 10(6), pp. 851-854.
Lidén, H., Volc, J., Marko-Varga, G. and Gorton, L. (1998) 'Pyranose Oxidase Modified
Carbon Paste Electrodes for Monosaccharide Determination', Electroanalysis, 10(4), pp. 223-
230.
Lim, J., Malati, P., Bonet, F. and Dunn, B. (2007) 'Nanostructured sol-gel electrodes for biofuel
cells', Journal of the Electrochemical Society, 154(2), pp. A140-A145.
Page 190
References
161
Lim, K.G. and Palmore, G.T.R. (2007) 'Microfluidic biofuel cells: the influence of electrode
diffusion layer on performance', Biosensors and Bioelectronics, 22(6), pp. 941-947.
Linford, R. and Schlindwein, W. (2006) 'Medical applications of solid state ionics', Solid state
ionics, 177(19), pp. 1559-1565.
Liu, C., Alwarappan, S., Chen, Z., Kong, X. and Li, C.-Z. (2010) 'Membraneless enzymatic
biofuel cells based on graphene nanosheets', Biosensors and Bioelectronics, 25(7), pp. 1829-
1833.
Liu, Y. and Dong, S. (2007a) 'A biofuel cell harvesting energy from glucose–air and fruit juice–
air', Biosensors and Bioelectronics, 23(4), pp. 593-597.
Liu, Y. and Dong, S. (2007b) 'A biofuel cell with enhanced power output by grape juice',
Electrochemistry Communications, 9(7), pp. 1423-1427.
Liu, Y., Wang, M., Zhao, F., Liu, B. and Dong, S. (2005) 'A Low‐Cost Biofuel Cell with pH‐
Dependent Power Output Based on Porous Carbon as Matrix', Chemistry–A European Journal,
11(17), pp. 4970-4974.
Luo, X.-L., Xu, J.-J., Wang, J.-L. and Chen, H.-Y. (2005) 'Electrochemically deposited
nanocomposite of chitosan and carbon nanotubes for biosensor application', Chemical
communications, (16), pp. 2169-2171.
MacVittie, K., Conlon, T. and Katz, E. (2015) 'A wireless transmission system powered by an
enzyme biofuel cell implanted in an orange', Bioelectrochemistry, 106, Part A, pp. 28-33.
MacVittie, K., Halamek, J., Halamkova, L., Southcott, M., Jemison, W.D., Lobel, R. and Katz,
E. (2013) 'From "cyborg" lobsters to a pacemaker powered by implantable biofuel cells', Energy
& Environmental Science, 6(1), pp. 81-86.
Malinauskas, A., Kuzmarskyt, J., Meškys, R. and Ramanavičius, A. (2004) 'Bioelectrochemical
sensor based on PQQ-dependent glucose dehydrogenase', Sensors and Actuators B: Chemical,
100(3), pp. 387-394.
Mani, V., Devadas, B. and Chen, S.-M. (2013) 'Direct electrochemistry of glucose oxidase at
electrochemically reduced graphene oxide-multiwalled carbon nanotubes hybrid material
modified electrode for glucose biosensor', Biosensors and Bioelectronics, 41, pp. 309-315.
Page 191
References
162
Mano, N. and Heller, A. (2003) 'A miniature membraneless biofuel cell operating at 0.36 V
under physiological conditions', Journal of The Electrochemical Society, 150(8), pp. A1136-
A1138.
Mano, N., Kim, H.-H. and Heller, A. (2002a) 'On the Relationship between the Characteristics
of Bilirubin Oxidases and O2 Cathodes Based on Their “Wiring”', The Journal of Physical
Chemistry B, 106(34), pp. 8842-8848.
Mano, N., Mao, F. and Heller, A. (2002b) 'A miniature biofuel cell operating in a physiological
buffer', Journal of the American Chemical Society, 124(44), pp. 12962-12963.
Mano, N., Mao, F. and Heller, A. (2003a) 'Characteristics of a miniature compartment-less
glucose-O2 biofuel cell and its operation in a living plant', Journal of the American Chemical
Society, 125(21), pp. 6588-6594.
Mano, N., Mao, F., Shin, W., Chen, T. and Heller, A. (2003b) 'A miniature biofuel cell
operating at 0.78 V', Chemical Communications, (4), pp. 518-519.
Martin, C.R. and Freiser, H. (1981) 'Ion-selective electrodes based on an ionic polymer',
Analytical Chemistry, 53(6), pp. 902-904.
Martin Hallberg, B., Leitner, C., Haltrich, D. and Divne, C. (2004) 'Crystal Structure of the 270
kDa Homotetrameric Lignin-degrading Enzyme Pyranose 2-Oxidase', Journal of Molecular
Biology, 341(3), pp. 781-796.
Menicucci, J., Beyenal, H., Marsili, E., Veluchamy, Demir, G. and Lewandowski, Z. (2006)
'Procedure for Determining Maximum Sustainable Power Generated by Microbial Fuel Cells',
Environmental Science & Technology, 40(3), pp. 1062-1068.
Merchant, S.A., Glatzhofer, D.T. and Schmidtke, D.W. (2007) 'Effects of electrolyte and pH
on the behavior of cross-linked films of ferrocene-modified poly (ethylenimine)', Langmuir,
23(22), pp. 11295-11302.
Meredith, M.T., Kao, D.-Y., Hickey, D., Schmidtke, D.W. and Glatzhofer, D.T. (2011) 'High
current density ferrocene-modified linear poly (ethylenimine) bioanodes and their use in biofuel
cells', Journal of the Electrochemical Society, 158(2), pp. B166-B174.
Page 192
References
163
Merle, G., Habrioux, A., Servat, K., Rolland, M., Innocent, C., Kokoh, K.B. and Tingry, S.
(2009) 'Long-term activity of covalent grafted biocatalysts during intermittent use of a
glucose/O 2 biofuel cell', Electrochimica Acta, 54(11), pp. 2998-3003.
Merotra, J. (2013) 'Fabrication & characterisation of enzyme electrodes for biosensor and
biofuel cell applications'.
Mertens, R. and Liese, A. (2004) 'Biotechnological applications of hydrogenases', Current
opinion in biotechnology, 15(4), pp. 343-348.
Miao, Y., Chia, L.S., Goh, N.K. and Tan, S.N. (2001) 'Amperometric glucose biosensor based
on immobilization of glucose oxidase in chitosan matrix cross‐linked with glutaraldehyde',
Electroanalysis, 13(4), pp. 347-349.
Milton, R.D., Lim, K., Hickey, D.P. and Minteer, S.D. (2015) 'Employing FAD-dependent
glucose dehydrogenase within a glucose/oxygen enzymatic fuel cell operating in human serum',
Bioelectrochemistry, 106, pp. 56-63.
Miyake, T., Haneda, K., Nagai, N., Yatagawa, Y., Onami, H., Yoshino, S., Abe, T. and
Nishizawa, M. (2011) 'Enzymatic biofuel cells designed for direct power generation from
biofluids in living organisms', Energy & Environmental Science, 4(12), pp. 5008-5012.
Moore, C.M., Akers, N.L., Hill, A.D., Johnson, Z.C. and Minteer, S.D. (2004) 'Improving the
environment for immobilized dehydrogenase enzymes by modifying Nafion with
tetraalkylammonium bromides', Biomacromolecules, 5(4), pp. 1241-1247.
Nakabayashi, Y., Wakuda, M. and Imai, H. (1998) 'Amperometric Glucose Sensors Fabricated
by Electrochemical Polymerization of Phenols on Carbon Paste Electrodes Containing
Ferrocene as an Electron Transfer Mediator', Analytical sciences, 14(6), pp. 1069-1076.
Nazaruk, E., Sadowska, K., Biernat, J.F., Rogalski, J., Ginalska, G. and Bilewicz, R. (2010)
'Enzymatic electrodes nanostructured with functionalized carbon nanotubes for biofuel cell
applications', Analytical and bioanalytical chemistry, 398(4), pp. 1651-1660.
Nazaruk, E., Smoliński, S., Swatko-Ossor, M., Ginalska, G., Fiedurek, J., Rogalski, J. and
Bilewicz, R. (2008) 'Enzymatic biofuel cell based on electrodes modified with lipid liquid-
crystalline cubic phases', Journal of Power Sources, 183(2), pp. 533-538.
Page 193
References
164
Ndlovu, T., Arotiba, O.A., Sampath, S., Krause, R.W. and Mamba, B.B. (2012) 'Reactivities of
Modified and Unmodified Exfoliated Graphite Electrodes in Selected Redox Systems',
International Journal of Electrochemical Science, 7(10), pp. 9441-9453.
Nguyen, Q.T., Glinel, K., Pontié, M. and Ping, Z. (2004) 'Immobilization of bio-
macromolecules onto membranes via an adsorbed nanolayer: An insight into the mechanism',
Journal of membrane science, 232(1), pp. 123-132.
Nicholson, R.S. (1965) 'Theory and Application of Cyclic Voltammetry for Measurement of
Electrode Reaction Kinetics', Analytical Chemistry, 37(11), pp. 1351-1355.
Nien, P.-C., Lee, C.-Y., Ho, K.-C., Adav, S.S., Liu, L., Wang, A., Ren, N. and Lee, D.-J. (2011)
'Power overshoot in two-chambered microbial fuel cell (MFC)', Bioresource technology,
102(7), pp. 4742-4746.
O'Gorman, J. (1998) Novel electroanalytical methods. Dublin City University.
Ó Conghaile, P., Falk, M., MacAodha, D., Yakovleva, M.E., Gonaus, C., Peterbauer, C.K.,
Gorton, L., Shleev, S. and Leech, D. (2016) 'Fully Enzymatic Membraneless Glucose|Oxygen
Fuel Cell That Provides 0.275 mA cm–2 in 5 mM Glucose, Operates in Human Physiological
Solutions, and Powers Transmission of Sensing Data', Analytical Chemistry, 88(4), pp. 2156-
2163.
Odaci, D., Telefoncu, A. and Timur, S. (2008) 'Pyranose oxidase biosensor based on carbon
nanotube (CNT)-modified carbon paste electrodes', Sensors and Actuators B: Chemical,
132(1), pp. 159-165.
Ozdemir, C., Yeni, F., Odaci, D. and Timur, S. (2010) 'Electrochemical glucose biosensing by
pyranose oxidase immobilized in gold nanoparticle-polyaniline/AgCl/gelatin nanocomposite
matrix', Food Chemistry, 119(1), pp. 380-385.
Palmore, G.T.R. and Kim, H.-H. (1999) 'Electro-enzymatic reduction of dioxygen to water in
the cathode compartment of a biofuel cell', Journal of Electroanalytical Chemistry, 464(1), pp.
110-117.
Page 194
References
165
Park, H.J., Won, K., Lee, S.Y., Kim, J.H., Kim, W.-J., Lee, D.S. and Yoon, H.H. (2011)
'Fabrication of CNT/ferrocene/glucose oxidase/chitosan-layered bioanode for glucose/oxygen
biofuel cells', Molecular Crystals and Liquid Crystals, 539(1), pp. 238/[578]-246/[586].
Piontek, K., Antorini, M. and Choinowski, T. (2002) 'Crystal structure of a laccase from the
fungus Trametes versicolor at 1.90-A resolution containing a full complement of coppers', J
Biol Chem, 277(40), pp. 37663-9.
Pitsawong, W., Sucharitakul, J., Prongjit, M., Tan, T.-C., Spadiut, O., Haltrich, D., Divne, C.
and Chaiyen, P. (2010) 'A Conserved Active-site Threonine Is Important for Both Sugar and
Flavin Oxidations of Pyranose 2-Oxidase', The Journal of Biological Chemistry, 285(13), pp.
9697-9705.
Pizzariello, A., Stred'ansky, M. and Miertuš, S. (2002) 'A glucose/hydrogen peroxide biofuel
cell that uses oxidase and peroxidase as catalysts by composite bulk-modified bioelectrodes
based on a solid binding matrix', Bioelectrochemistry, 56(1), pp. 99-105.
Princeton (2016) A Review of Techniques for Electrochemical Analysis Available at:
file://tower7/home42/b2019833/Downloads/Application_Note_E-4%20(1).pdf (Accessed: 08
May 2016).
Qiu, J.-D., Zhou, W.-M., Guo, J., Wang, R. and Liang, R.-P. (2009) 'Amperometric sensor
based on ferrocene-modified multiwalled carbon nanotube nanocomposites as electron
mediator for the determination of glucose', Analytical biochemistry, 385(2), pp. 264-269.
Ramanavicius, A. and Ramanaviciene, A. (2009) 'Hemoproteins in design of biofuel cells', Fuel
cells, 9(1), pp. 25-36.
Ramírez, P., Mano, N., Andreu, R., Ruzgas, T., Heller, A., Gorton, L. and Shleev, S. (2008)
'Direct electron transfer from graphite and functionalized gold electrodes to T1 and T2/T3
copper centers of bilirubin oxidase', Biochimica et Biophysica Acta (BBA)-Bioenergetics,
1777(10), pp. 1364-1369.
Rasmussen, M., Abdellaoui, S. and Minteer, S.D. (2016) 'Enzymatic biofuel cells: 30 years of
critical advancements', Biosensors and Bioelectronics, 76, pp. 91-102.
Page 195
References
166
Rasmussen, M., Ritzmann, R.E., Lee, I., Pollack, A.J. and Scherson, D. (2012) 'An Implantable
Biofuel Cell for a Live Insect', Journal of the American Chemical Society, 134(3), pp. 1458-
1460.
Rayment, C. and Sherwin, S. (2003) 'Introduction to fuel cell technology', Department of
Aerospace and Mechanical Engineering, University of Notre Dame, Notre Dame, IN, 46556,
pp. 11-12.
Razumien, J., Marcinkevičien, L., Bachmatova, I., Meškys, R. and Laurinavičius, V. (2003)
'Improvement of screen-printed carbon electrodes by modification with ferrocene derivative',
Sensors and Actuators B: Chemical, 95(1), pp. 378-383.
Robertson, M.A.F. and Yeager, H.L. (1996) 'A fluorescent probe investigation of the origin of
superselectivity in perfluorinated ionomer membranes', Macromolecules, 29(15), pp. 5166-
5171.
Rogers, M.J. and Brandt, K.G. (1971) 'Interaction of D-glucal with Aspergillus niger glucose
oxidase', Biochemistry, 10(25), pp. 4624-4630.
Rubianes, M.D. and Rivas, G.A. (2007) 'Dispersion of multi-wall carbon nanotubes in
polyethylenimine: a new alternative for preparing electrochemical sensors', Electrochemistry
communications, 9(3), pp. 480-484.
Rubinstein, I. (1984) 'Voltammetric pH measurements with surface-modified electrodes and a
voltammetric internal reference', Analytical Chemistry, 56(7), pp. 1135-1137.
Rubinstein, I. and Bard, A.J. (1980) 'Polymer films on electrodes. 4. Nafion-coated electrodes
and electrogenerated chemiluminescence of surface-attached tris (2, 2'-bipyridine) ruthenium
(2+)', Journal of the American Chemical Society, 102(21), pp. 6641-6642.
Sakai, H., Nakagawa, T., Tokita, Y., Hatazawa, T., Ikeda, T., Tsujimura, S. and Kano, K. (2009)
'A high-power glucose/oxygen biofuel cell operating under quiescent conditions', Energy &
Environmental Science, 2(1), pp. 133-138.
Sales, F.C.P.F., Iost, R.M., Martins, M.V.A., Almeida, M.C. and Crespilho, F.N. (2013) 'An
intravenous implantable glucose/dioxygen biofuel cell with modified flexible carbon fiber
electrodes', Lab on a Chip, 13(3), pp. 468-474.
Page 196
References
167
Sarma, A.K., Vatsyayan, P., Goswami, P. and Minteer, S.D. (2009) 'Recent advances in
material science for developing enzyme electrodes', Biosensors and Bioelectronics, 24(8), pp.
2313-2322.
Sato, F., Togo, M., Islam, M.K., Matsue, T., Kosuge, J., Fukasaku, N., Kurosawa, S. and
Nishizawa, M. (2005) 'Enzyme-based glucose fuel cell using Vitamin K 3-immobilized
polymer as an electron mediator', Electrochemistry Communications, 7(7), pp. 643-647.
Scholz, F. (2010) 'Thermodynamics of electrochemical reactions', in Electroanalytical
Methods. Springer, pp. 11-31.
Schröder, U. (2012) 'From In Vitro to In Vivo—Biofuel Cells Are Maturing', Angewandte
Chemie International Edition, 51(30), pp. 7370-7372.
Scientific, T.F. (2016) Chemistry of Crosslinking. Available at:
http://www.piercenet.com/method/chemistry-crosslinking.
Sekretaryova, A. (2014) Novel reagentless electrodes for biosensing. Linköping University
Electronic Press.
Shan, C., Yang, H., Song, J., Han, D., Ivaska, A. and Niu, L. (2009) 'Direct electrochemistry of
glucose oxidase and biosensing for glucose based on graphene', Analytical Chemistry, 81(6),
pp. 2378-2382.
Shao, M., Zafar, M.N., Falk, M., Ludwig, R., Sygmund, C., Peterbauer, C.K., Guschin, D.A.,
MacAodha, D., Ó Conghaile, P., Leech, D., Toscano, M.D., Shleev, S., Schuhmann, W. and
Gorton, L. (2013) 'Optimization of a Membraneless Glucose/Oxygen Enzymatic Fuel Cell
Based on a Bioanode with High Coulombic Efficiency and Current Density', ChemPhysChem,
14(10), pp. 2260-2269.
Shim, J., Kim, G.-Y. and Moon, S.-H. (2011) 'Covalent co-immobilization of glucose oxidase
and ferrocenedicarboxylic acid for an enzymatic biofuel cell', Journal of electroanalytical
chemistry, 653(1), pp. 14-20.
Shleev, S., Jarosz-Wilkolazka, A., Khalunina, A., Morozova, O., Yaropolov, A., Ruzgas, T.
and Gorton, L. (2005) 'Direct electron transfer reactions of laccases from different origins on
carbon electrodes', Bioelectrochemistry, 67(1), pp. 115-124.
Page 197
References
168
Shuler, M.L., Hallsby, G.A., Pyne, J.W. and Cho, T. (1986) 'Bioreactors for Immobilized Plant
Cell Culturesa', Annals of the New York Academy of Sciences, 469(1), pp. 270-278.
Smolander, M., Boer, H., Valkiainen, M., Roozeman, R., Bergelin, M., Eriksson, J.-E., Zhang,
X.-C., Koivula, A. and Viikari, L. (2008) 'Development of a printable laccase-based biocathode
for fuel cell applications', Enzyme and Microbial Technology, 43(2), pp. 93-102.
Soukharev, V., Mano, N. and Heller, A. (2004) 'A four-electron O2-electroreduction biocatalyst
superior to platinum and a biofuel cell operating at 0.88 V', Journal of the American Chemical
Society, 126(27), pp. 8368-8369.
Spadiut, O., Brugger, D., Coman, V., Haltrich, D. and Gorton, L. (2010) 'Engineered Pyranose
2-Oxidase: Efficiently Turning Sugars into Electrical Energy', Electroanalysis, 22(7-8), pp.
813-820.
Stepnicka, P. (2008) Ferrocenes: ligands, materials and biomolecules. John Wiley & Sons.
Stolten, D. (2010) Hydrogen and fuel cells: fundamentals, technologies and applications. John
Wiley & Sons.
Svoboda, V., Cooney, M., Liaw, B.Y., Minteer, S., Piles, E., Lehnert, D., Calabrese Barton, S.,
Rincon, R. and Atanassov, P. (2008) 'Standardized characterization of electrocatalytic
electrodes', Electroanalysis, 20(10), pp. 1099-1109.
Szczupak, A., Halamek, J., Halamkova, L., Bocharova, V., Alfonta, L. and Katz, E. (2012)
'Living battery - biofuel cells operating in vivo in clams', Energy & Environmental Science,
5(10), pp. 8891-8895.
Tamaki, T. and Yamaguchi, T. (2006) 'High-surface-area three-dimensional biofuel cell
electrode using redox-polymer-grafted carbon', Industrial & engineering chemistry research,
45(9), pp. 3050-3058.
Tan, T.C., Spadiut, O., Wongnate, T., Sucharitakul, J., Krondorfer, I., Sygmund, C., Haltrich,
D., Chaiyen, P., Peterbauer, C.K. and Divne, C. (2013) 'The 1.6 Å crystal structure of pyranose
dehydrogenase from Agaricus meleagris rationalizes substrate specificity and reveals a flavin
intermediate', PLoS One, 8(1), p. e53567.
Page 198
References
169
Tan, Y., Deng, W., Ge, B., Xie, Q., Huang, J. and Yao, S. (2009) 'Biofuel cell and phenolic
biosensor based on acid-resistant laccase–glutaraldehyde functionalized chitosan–multiwalled
carbon nanotubes nanocomposite film', Biosensors and Bioelectronics, 24(7), pp. 2225-2231.
Tan, Y., Deng, W., Li, Y., Huang, Z., Meng, Y., Xie, Q., Ma, M. and Yao, S. (2010) 'Polymeric
bionanocomposite cast thin films with in situ laccase-catalyzed polymerization of dopamine for
biosensing and biofuel cell applications', The Journal of Physical Chemistry B, 114(15), pp.
5016-5024.
Tasca, F., Gorton, L., Harreither, W., Haltrich, D., Ludwig, R. and Noll, G. (2008) 'Highly
efficient and versatile anodes for biofuel cells based on cellobiose dehydrogenase from
Myriococcum thermophilum', The Journal of Physical Chemistry C, 112(35), pp. 13668-13673.
Tasca, F., Timur, S., Ludwig, R., Haltrich, D., Volc, J., Antiochia, R. and Gorton, L. (2007)
'Amperometric Biosensors for Detection of Sugars Based on the Electrical Wiring of Different
Pyranose Oxidases and Pyranose Dehydrogenases with Osmium Redox Polymer on Graphite
Electrodes', Electroanalysis, 19(2-3), pp. 294-302.
Thevenot, D.R., Toth, K., Durst, R.A. and Wilson, G.S. (1999) 'Electrochemical biosensors:
recommended definitions and classification', Pure and Applied Chemistry, 71(12), pp. 2333-
2348.
Timur, S., Yigzaw, Y. and Gorton, L. (2006) 'Electrical wiring of pyranose oxidase with
osmium redox polymers', Sensors and Actuators B: Chemical, 113(2), pp. 684-691.
Tkáč, J., Voštiar, I., Gemeiner, P. and Šturdık, E. (2002) 'Stabilization of ferrocene leakage by
physical retention in a cellulose acetate membrane. The fructose biosensor',
Bioelectrochemistry, 55(1), pp. 149-151.
Togo, M., Takamura, A., Asai, T., Kaji, H. and Nishizawa, M. (2007) 'An enzyme-based
microfluidic biofuel cell using vitamin K 3-mediated glucose oxidation', Electrochimica Acta,
52(14), pp. 4669-4674.
Tran, T.O., Lammert, E.G., Chen, J., Merchant, S.A., Brunski, D.B., Keay, J.C., Johnson, M.B.,
Glatzhofer, D.T. and Schmidtke, D.W. (2011) 'Incorporation of single-walled carbon nanotubes
into ferrocene-modified linear polyethylenimine redox polymer films', Langmuir, 27(10), pp.
6201-6210.
Page 199
References
170
Tsujimura, S., Kano, K. and Ikeda, T. (2002) 'Glucose/O-2 biofuel cell operating at
physiological conditions', Electrochemistry, 70(12), pp. 940-942.
Turner, R.F.B., Harrison, D.J., Rajotte, R.V. and Baltes, H.P. (1990) 'A biocompatible enzyme
electrode for continuous in vivo glucose monitoring in whole blood', Sensors and Actuators B:
Chemical, 1(1), pp. 561-564.
Uang, Y.-M. and Chou, T.-C. (2003) 'Fabrication of glucose oxidase/polypyrrole biosensor by
galvanostatic method in various pH aqueous solutions', Biosensors and Bioelectronics, 19(3),
pp. 141-147.
Vaillancourt, M., Wei Chen, J., Fortier, G. and Bélanger, D. (1999) 'Electrochemical and
Enzymatic Studies of Electron Transfer Mediation by Ferrocene Derivatives with Nafion‐
Glucose Oxidase Electrodes', Electroanalysis, 11(1), pp. 23-31.
Vidal, J.-C., Garcia, E. and Castillo, J.-R. (2002) 'Development of a platinized and ferrocene-
mediated cholesterol amperometric biosensor based on electropolymerization of polypyrrole in
a flow system', Analytical sciences, 18(5), pp. 537-542.
Vishnyakov, A. and Neimark, A.V. (2001) 'Molecular dynamics simulation of microstructure
and molecular mobilities in swollen Nafion membranes', The Journal of Physical Chemistry B,
105(39), pp. 9586-9594.
Wang, S.C., Yang, F., Silva, M., Zarow, A., Wang, Y. and Iqbal, Z. (2009a) 'Membrane-less
and mediator-free enzymatic biofuel cell using carbon nanotube/porous silicon electrodes',
Electrochemistry Communications, 11(1), pp. 34-37.
Wang, Z.-G., Wan, L.-S., Liu, Z.-M., Huang, X.-J. and Xu, Z.-K. (2009b) 'Enzyme
immobilization on electrospun polymer nanofibers: an overview', Journal of Molecular
Catalysis B: Enzymatic, 56(4), pp. 189-195.
Wei, X., Cruz, J. and Gorski, W. (2002) 'Integration of enzymes and electrodes: spectroscopic
and electrochemical studies of chitosan-enzyme films', Analytical chemistry, 74(19), pp. 5039-
5046.
Page 200
References
171
Weigel, M.C., Tritscher, E. and Lisdat, F. (2007) 'Direct electrochemical conversion of bilirubin
oxidase at carbon nanotube-modified glassy carbon electrodes', Electrochemistry
Communications, 9(4), pp. 689-693.
White, H.S., Leddy, J. and Bard, A.J. (1982) 'Polymer films on electrodes. 8. Investigation of
charge-transport mechanisms in Nafion polymer modified electrodes', Journal of the American
Chemical Society, 104(18), pp. 4811-4817.
Wieckowski, A. (2009) Fuel cell catalysis: a surface science approach. John Wiley & Sons.
Willner, I., Arad, G. and Katz, E. (1998a) 'A biofuel cell based on pyrroloquinoline quinone
and microperoxidase-11 monolayer-functionalized electrodes', Bioelectrochemistry and
Bioenergetics, 44(2), pp. 209-214.
Willner, I., Katz, E., Patolsky, F. and F. Buckmann, A. (1998b) 'Biofuel cell based on glucose
oxidase and microperoxidase-11 monolayer-functionalized electrodes', Journal of the Chemical
Society, Perkin Transactions 2, (8), pp. 1817-1822.
Willner, I., Yan, Y.M., Willner, B. and Tel‐Vered, R. (2009) 'Integrated Enzyme‐Based Biofuel
Cells–A Review', Fuel Cells, 9(1), pp. 7-24.
Wilson, R. and Turner, A.P.F. (1992) 'Glucose oxidase: an ideal enzyme', Biosensors and
Bioelectronics, 7(3), pp. 165-185.
Winfield, J., Ieropoulos, I., Greenman, J. and Dennis, J. (2011) 'The overshoot phenomenon as
a function of internal resistance in microbial fuel cells', Bioelectrochemistry, 81(1), pp. 22-27.
Wongnate, T., Sucharitakul, J. and Chaiyen, P. (2011) 'Identification of a Catalytic Base for
Sugar Oxidation in the Pyranose 2-Oxidase Reaction', ChemBioChem, 12(17), pp. 2577-2586.
Woodward, J., Mattingly, S.M., Danson, M., Hough, D., Ward, N. and Adams, M. (1996) 'In
vitro hydrogen production by glucose dehydrogenase and hydrogenase', Nature Biotechnology,
14(7), pp. 872-874.
Wu, J.C.Y., Hutchings, C.H., Lindsay, M.J., Werner, C.J. and Bundy, B.C. (2015) 'Enhanced
Enzyme Stability Through Site-Directed Covalent Immobilization', Journal of Biotechnology,
193, pp. 83-90.
Page 201
References
172
Wu, X., Zhao, F., Varcoe, J.R., Thumser, A.E., Avignone-Rossa, C. and Slade, R.C.T. (2009)
'A one-compartment fructose/air biological fuel cell based on direct electron transfer',
Biosensors and Bioelectronics, 25(2), pp. 326-331.
Yahiro, A.T., Lee, S.M. and Kimble, D.O. (1964) 'Bioelectrochemistry: I. Enzyme utilizing
bio-fuel cell studies', Biochimica et Biophysica Acta (BBA)-Specialized Section on Biophysical
Subjects, 88(2), pp. 375-383.
Yakovleva, M.E., Killyéni, A., Ortiz, R., Schulz, C., MacAodha, D., Conghaile, P.Ó., Leech,
D., Popescu, I.C., Gonaus, C. and Peterbauer, C.K. (2012) 'Recombinant pyranose
dehydrogenase—A versatile enzyme possessing both mediated and direct electron transfer',
Electrochemistry Communications, 24, pp. 120-122.
Yan, Y.-M., Baravik, I., Yehezkeli, O. and Willner, I. (2008) 'Integrated electrically contacted
glucose oxidase/carbon nanotube electrodes for the bioelectrocatalyzed detection of glucose',
The Journal of Physical Chemistry C, 112(46), pp. 17883-17888.
Yan, Y., Su, L. and Mao, L. (2007a) 'Multi-walled carbon nanotube-based glucose/O2 biofuel
cell with glucose oxidase and laccase as biocatalysts', Journal of nanoscience and
nanotechnology, 7(4-5), pp. 1625-1630.
Yan, Y., Zheng, W., Su, L. and Mao, L. (2006) 'Carbon‐Nanotube‐Based Glucose/O2 Biofuel
Cells', Advanced Materials, 18(19), pp. 2639-2643.
Yan, Y.M., Yehezkeli, O. and Willner, I. (2007b) 'Integrated, Electrically Contacted NAD (P)+‐
Dependent Enzyme–Carbon Nanotube Electrodes for Biosensors and Biofuel Cell
Applications', Chemistry–A European Journal, 13(36), pp. 10168-10175.
Yang, X.-Y., Tian, G., Jiang, N. and Su, B.-L. (2012) 'Immobilization technology: a sustainable
solution for biofuel cell design', Energy & Environmental Science, 5(2), pp. 5540-5563.
Yang, X., Hua, L., Gong, H. and Tan, S.N. (2003) 'Covalent immobilization of an enzyme
(glucose oxidase) onto a carbon sol–gel silicate composite surface as a biosensing platform',
Analytica chimica acta, 478(1), pp. 67-75.
Page 202
References
173
Yin, D.-M., Wu, J.-C. and Yuan, Y.-J. (2006) 'Spatio-temporal distributions of metal ions and
Taxol of Taxus cuspidata cells immobilized on polyurethane foam', Biotechnology letters,
28(1), pp. 29-32.
Zafar, M.N., Tasca, F., Boland, S., Kujawa, M., Patel, I., Peterbauer, C.K., Leech, D. and
Gorton, L. (2010) 'Wiring of pyranose dehydrogenase with osmium polymers of different redox
potentials', Bioelectrochemistry, 80(1), pp. 38-42.
Zebda, A., Cosnier, S., Alcaraz, J.P., Holzinger, M., Le Goff, A., Gondran, C., Boucher, F.,
Giroud, F., Gorgy, K., Lamraoui, H. and Cinquin, P. (2013) 'Single Glucose Biofuel Cells
Implanted in Rats Power Electronic Devices', Scientific Reports, 3, p. 1516.
Zebda, A., Innocent, C., Renaud, L., Cretin, M., Pichot, F., Ferrigno, R. and Tingry, S. (2011)
'Enzyme-based microfluidic biofuel cell to generate micropower', Enzyme, 2, p. O2.
Zebda, A., Renaud, L., Cretin, M., Pichot, F., Innocent, C., Ferrigno, R. and Tingry, S. (2009)
'A microfluidic glucose biofuel cell to generate micropower from enzymes at ambient
temperature', Electrochemistry Communications, 11(3), pp. 592-595.
Zhang, L.P., Gong, W.J., Pan, Y. and Zhang, Y.Z. (2008) 'Fabrication of multilayer-film-
modified gold electrode composed of myoglobin, chitosan, and polyelectrolyte-wrapped multi-
wall carbon nanotubes by layer-by-layer assembled technique and electrochemical catalysis for
hydrogen peroxide and trichloroacetic acid', Russian Journal of Electrochemistry, 44(11), pp.
1271-1279.
Zhang, M., Smith, A. and Gorski, W. (2004a) 'Carbon nanotube-chitosan system for
electrochemical sensing based on dehydrogenase enzymes', Analytical Chemistry, 76(17), pp.
5045-5050.
Zhang, S., Yang, W., Niu, Y. and Sun, C. (2004b) 'Multilayered construction of glucose oxidase
on gold electrodes based on layer-by-layer covalent attachment', Analytica chimica acta,
523(2), pp. 209-217.
Zhang, X.-C., Ranta, A. and Halme, A. (2006) 'Direct methanol biocatalytic fuel cell—
Considerations of restraints on electron transfer', Biosensors and Bioelectronics, 21(11), pp.
2052-2057.
Page 203
References
174
Zhao, H.Y., Zhou, H.M., Zhang, J.X., Zheng, W. and Zheng, Y.F. (2009) 'Carbon nanotube–
hydroxyapatite nanocomposite: A novel platform for glucose/O 2 biofuel cell', Biosensors and
Bioelectronics, 25(2), pp. 463-468.
Zheng, L., Yao, X. and Li, J. (2006) 'Layer-by-layer assembly films and their applications in
electroanalytical chemistry', Current Analytical Chemistry, 2(3), pp. 279-296.
Zhou, K., Zhu, Y., Yang, X. and Li, C. (2010) 'Electrocatalytic Oxidation of Glucose by the
Glucose Oxidase Immobilized in Graphene-Au-Nafion Biocomposite', Electroanalysis, 22(3),
pp. 259-264.
Zhou, M., Deng, L., Wen, D., Shang, L., Jin, L. and Dong, S. (2009) 'Highly ordered
mesoporous carbons-based glucose/O 2 biofuel cell', Biosensors and Bioelectronics, 24(9), pp.
2904-2908.
Zhou, Q., Xie, Q., Fu, Y., Su, Z., Jia, X.e. and Yao, S. (2007) 'Electrodeposition of carbon
nanotubes-chitosan-glucose oxidase biosensing composite films triggered by reduction of p-
benzoquinone or H2O2', The Journal of Physical Chemistry B, 111(38), pp. 11276-11284.
Zhu, X., Tokash, J.C., Hong, Y. and Logan, B.E. (2013) 'Controlling the occurrence of power
overshoot by adapting microbial fuel cells to high anode potentials', Bioelectrochemistry, 90,
pp. 30-35.
Zhu, Z., Momeu, C., Zakhartsev, M. and Schwaneberg, U. (2006) 'Making glucose oxidase fit
for biofuel cell applications by directed protein evolution', Biosensors and Bioelectronics,
21(11), pp. 2046-2051.