48
DEVELOPMENT OF FORCED-FLOW ELECTROPHORESIS FOR PROTEINS CONCENTRATION HAIRUL NAZIRAH BINTI ABDUL HALIM UNIVERSITI SAINS MALAYSIA 2007

DEVELOPMENT OF FORCED-FLOW ELECTROPHORESIS FOR PROTEINS
CONCENTRATION
HAIRUL NAZIRAH BINTI ABDUL HALIM
UNIVERSITI SAINS MALAYSIA 2007

DEVELOPMENT OF FORCED-FLOW ELECTROPHORESIS FOR PROTEINS CONCENTRATION
HAIRUL NAZIRAH BINTI ABDUL HALIM
UNIVERSITI SAINS MALAYSIA
2007

DEVELOPMENT OF FORCED-FLOW ELECTROPHORESIS FOR PROTEINS CONCENTRATION
by
HAIRUL NAZIRAH BINTI ABDUL HALIM
Thesis submitted in fulfillment of the requirements for the degree of
Master of Science
OCTOBER 2007

DEVELOPMENT OF FORCED-FLOW ELECTROPHORESIS FOR PROTEINS CONCENTRATION
by
HAIRUL NAZIRAH BINTI ABDUL HALIM
Thesis submitted in fulfillment of the requirements for the degree of
Master of Science
OCTOBER 2007
ii
ACKNOWLEDGEMENTS
First of all, a great thankful to The Great Almighty, Allah for the strength, guidance and
blessing until I accomplished my studies. A million thanks to my family, especially to my
beloved parents, Mr. Abdul Halim bin Abdul Majid and Mrs. Naemah bt Tasir and my
siblings for their support and blessing.
I would like express my heartiest appreciation to my supervisor and also representing
as a Dean of School of Chemical Engineering, Professor Abdul Latif Ahmad for the
guidance and supervision of the research project till the completion of this thesis. My
deepest appreciation also goes to my previous supervisors, Professor Ghassem
Najafpour Darzi, Associate Professor Mohamed Zulkali Mohamed Daud and Dr. Long
Wei Sing which helped me in the early stage of my study.
I would like to express my appreciation to MOSTI for providing me PASCA Siswazah
scholarship as well as the allocation for funding this research through IRPA R&D grant.
Sincere thanks to all lecturers and staffs of School of Chemical Engineering, USM for
their kindness and support. Thanks to all laboratory technicians especially Mr. Shamsul
Hidayat Shaharan for their technical assistance during this work.
Special thanks also to all my beloved friends Kak Da, Ayuwahida, Chah, Aziah, Nain,
Pakaque, Abir, Syed, Syura, Jus, Nora, Haza, Chena, Kak Sunet, Kak Ida, Zaliza,
Zahrah, Huda, Midah, K. Anis, Dila, KK Lau, Lian See, Siew Chun and other
colleagues for your kindness and moral supports.
- Hairul Nazirah Abdul Halim, October 2007 -

iii
TABLE OF CONTENTS
Page
ACKNOWLEDGEMENTS ii
TABLE OF CONTENTS iii
LIST OF TABLES vii
LIST OF FIGURES ix
LIST OF PLATES xiii
LIST OF SYMBOLS xiv
LIST OF ABBREVIATIONS xvi
ABSTRAK xvii
ABSTRACT
xix
CHAPTER ONE : INTRODUCTION
1
1.1 The Demand of Plasma Protein Products
1.2 Membrane Application in Pharmaceutical Industry
1.3 Problem Statement
1.4 Research Objectives
1.5 Scope of Study
1.6 Organization of Thesis
1
4
5
8
8
9
CHAPTER TWO : LITERATURE REVIEW
11
2.0 Introduction
2.1 Plasma Proteins
2.1.1 Human Serum Albumin
2.1.2 Gamma Globulin
2.1.3 Isoelectric Point (IEP) of Protein
2.2 Industrial Method for Protein Concentration
2.2.1 Thin Film Evaporation
2.2.2 Vacuum Freeze Drying
2.2.3 Membrane Processes
2.3 Ultrafiltration
2.3.1 Ultrafiltration Membranes
2.3.2 Fouling and Concentration Polarization in Ultrafiltration
2.3.3 Effect of Protein-Membrane Interactions on Membrane
Fouling
2.3.4 Various Filtration Techniques to Enhance Ultrafiltration
11
11
12
12
14
15
15
16
17
19
19
21
24
25
iv
2.4 Forced-Flow Electrophoresis (FFE)
2.4.1 Description of FFE Process
2.4.2 Driving Force in FFE Process
2.4.3 Force Interactions
2.4.4 Electrokinetic Effects in FFE
2.4.5 Various Configuration of Electro-Membrane Filtration (EMF)
Module
2.4.5(a) Tubular module
2.4.5(b) Flat Sheet Membrane Module without Ion Exchange
Membranes
2.4.5(c) Flat Sheet Membrane Module with Ion Exchange
Membranes
2.4.5(d) Selection of Module Configuration
28
28
30
31
32
34
34
35
36
38
CHAPTER THREE : MATERIALS AND METHODS
43
3.0 Introduction
3.1 Materials and Chemicals
3.1.1 Membranes
3.1.1(a) Biomax Polyethersulfone (PES) membrane
3.1.1(b) Cation Exchange Membrane (CEM)
3.1.2 Proteins
3.1.3 Chemicals and Reagents
3.2 Flowchart of the Overall Process Study
3.3 Forced-Flow Electrophoresis (FFE) System
3.3.1 Configuration of FFE module
3.3.2 Set-up of Forced-Flow Electrophoresis (FFE) System
3.4 Experimental Procedures
3.4.1 Preparation of Phosphate Buffer Solution (PBS)
3.4.2 Preparation of Proteins Solution
3.4.3 Normal Water Permeability (NWP) of the UF Membrane
3.4.4 Filtration Experiment
3.4.5 Membrane Cleaning
3.4.6 Selection of Suitable MWCO of UF Membrane
3.4.7 Comparison of Ultrafiltration and Forced-Flow
Electrophoresis
3.5 Parameter Study of Forced-Flow Electrophoresis (FFE) Process
3.5.1 Effect of Electric Field Strength on Transmembrane Pressure
(TMP)
43
43
43
43
44
45
45
46
47
47
49
51
51
51
52
52
53
54
54
54
54
v
3.5.2 Effect of Electric Field Strength on Initial Protein
Concentration
3.5.3 Effect of Electric Field Strength on Initial pH Buffer
3.5.4 Effect of Electric Field Strength on Initial Ionic Strength of
PBS
3.6 Analytical Methods
3.6.1 Analytical Equipment
3.6.2 Determination of Isoelectric Point (IEP) of Protein by Rotofor
System (Bio-rad, USA)
3.6.3 Protein Measurement by Coomassie (Bradford) Protein
Assay
3.6.3(a) Preparation of Diluted BSA and BGG Standards
3.6.3(b) Test Tube Procedure
3.6.3(c) Standard Calibration Curves
3.7 Calculation of Experimental Data
3.7.1 Percentage of Protein Rejection
3.7.2 Permeate Flux
3.7.3 Global Hydraulic Resistance
3.7.4 Final Protein Concentration
3.7.5 Percentage of Protein Concentrated
55
55
55
56
56
56
58
58
59
60
61
61
61
61
62
62
CHAPTER FOUR : RESULTS AND DISCUSSION
63
4.0 Introduction
4.1 Determination of Isoelectric Point of Protein
4.2 Selection of Suitable MWCO of UF Membrane
4.3 Comparison between Ultrafiltration and Forced-Flow Electrophoresis
(FFE)
4.4 Parameter Study of Forced-Flow Electrophoresis (FFE) Process
4.4.1 Effect of Electric Field Strength
4.4.1(a) Effect of Electric Field Strength on the Permeate
Flux at Various Transmembrane Pressure (TMP)
4.4.1(b) Effect of Electric Field Strength on the Permeate
Flux at Various Initial Protein Concentration
4.4.1(c) Effect of Electric Field Strength on the Permeate
Flux at Various Initial pH Buffer
4.4.1(d) Effect of Electric Field Strength on the Permeate
Flux at Various Initial Ionic Strength of PBS
63
63
64
66
69
69
69
77
80
83

vi
4.4.2 Effect of Transmembrane Pressure
4.4.2(a) Effect of Transmembrane Pressure on the
Permeate Flux
4.4.2(b) Effect of Transmembrane Pressure on the Global
Hydraulic Resistance
4.4.2(c) Effect of Transmembrane Pressure on the Final
Protein Concentration
4.4.3 Effect of Initial Protein Concentration
4.4.3(a) Effect of Initial Protein Concentration on the
Permeate Flux
4.4.3(b) Effect of Initial Protein Concentration on the Global
Hydraulic Resistance
4.4.3(c) Effect of Initial Protein Concentration on the Final
Protein Concentration
4.4.4 Effect of Initial pH Buffer
4.4.4(a) Effect of Initial pH Buffer on the Permeate Flux
4.4.4(b) Effect of Initial pH Buffer on the Global Hydraulic
Resistance
4.4.4(c) Effect of Initial pH Buffer on the Final Protein
Concentration
4.4.5 Effect of Initial Ionic Strength of PBS
4.4.5(a) Effect of Initial Ionic Strength on the Permeate Flux
4.4.5(b) Effect of Initial Ionic Strength on the Global
Hydraulic Resistance
4.4.5(c) Effect of Initial Ionic Strength on the Final Protein
Concentration
87
87
90
91
92
92
95
96
96
97
100
101
102
102
104
105
CHAPTER FIVE : CONCLUSIONS AND RECOMMENDATIONS 107
5.1 Conclusions
5.2 Recommendations for Future Work
107
109
REFERENCES 110 APPENDICES 116 LIST OF PUBLICATION AND SEMINAR 124
vii
LIST OF TABLES
Page Table 2.1 Summary of Blood Component (Cambrian College, 2005) Table 2.2 Properties of albumin and IgG Table 2.3 Isoelectric points of several common proteins (Voet et al.,
2002) Table 2.4 Advantages and disadvantages of the thin film evaporation,
lyophilization and membrane processes for protein concentration
Table 2.5 Various filtration techniques to enhance UF Table 2.6 Literature on the electro-membrane filtration (EMF)
11
13
15
19
26
39
Table 3.1 Membrane specifications for Biomax Polyethersulfone Membranes
Table 3.2 Membrane specifications for cation exchange membranes Table 3.3 Product description of Bovine Serum Albumin (BSA) and
Bovine γ-Globulin (BGG) Table 3.4 Chemicals and reagents used in the experiment Table 3.5 Specifications of FFE module Table 3.6 Dilution scheme for Standard Test Tube (Working Range = 25
to 250 µg/ml) Table 3.7 Dilution scheme for Micro Test Tube (Working Range = 1 to 25
µg/ml)
44
44
45
45
49
59
59
Table 4.1 Rotofor System analysis for BSA and BGG Table 4.2 Performance of different MWCO of PES membrane on FFE
process. E = 3.0 V/cm, TMP = 100 kPa, pH8.0, 20 mM of PBS, Co = 0.50 g/L of protein
Table 4.3 pH of retentate at the end of experiments (after 102 minutes of
operation) under the influence of TMP: 100 to 250 kPa Table 4.4 pH of retentate at the end of experiments (after 102 minutes of
operation) for different initial pH buffer: pH 5.0, 6.0, 7.0 and 8.0
Table 4.5 pH of retentate at the end of experiments (after 102 minutes of operation) for different initial ionic strength: 20, 50, 100 and 150 mM
Table 4.6 Percentage of protein rejection at various experimental
parameters
64
65
70
80
84
90
viii
Table 4.7 Global hydraulic resistance at different transmembrane pressure after 102 minutes of experiments. E = 3.0 V/cm, pH 8.0, Co = 0.50 g/L of protein, 20 mM of PBS, MWCO of membrane: 30 kDa (BSA) and 50 kDa (BGG)
Table 4.8 Final protein concentration at different transmembrane
pressure (TMP) under the influence of electric field. E = 3.0 V/cm, pH 8.0, Co = 0.50 g/L of protein, 20 mM of PBS, MWCO of membrane: 30 kDa (BSA) and 50 kDa (BGG)
Table 4.9 Final protein concentration at different initial protein
concentration under the influence of electric field. E = 3.0 V/cm, pH 8.0, Co = 0.50 g/L of protein, 20 mM of PBS, MWCO of membrane: 30 kDa (BSA) and 50 kDa (BGG)
Table 4.10 Final protein concentration at different initial pH buffer under
the influence of electric field. E = 3.0 V/cm, pH 8.0, Co = 0.50 g/L of protein, 20 mM of PBS, MWCO of membrane: 30 kDa (BSA) and 50 kDa (BGG)
Table 4.11 Final protein concentration at different initial ionic strength
under the influence of electric field. E = 3.0 V/cm, pH 8.0, Co = 0.50 g/L of protein, 20 mM of PBS, MWCO of membrane: 30 kDa (BSA) and 50 kDa (BGG)
91
92
96
101
106

ix
LIST OF FIGURES
Page
Figure 1.1 Total Revenue (CSL Limited, 2006)
Figure 1.2 Albumin actual global consumption and projection (Robert, 2006)
Figure 1.3 Intravenous immunoglobulin (IVIg) actual global consumption
and projection (Robert, 2006)
2
3
3
Figure 2.1 Structure of immunoglobulin molecule (Source: Chanarin et. al, 1984)
Figure 2.2 Repeating unit structure for polyethersulfone
Figure 2.3 Solute concentration gradient in semipermeable membrane Figure 2.4 Illustration of Forced-Flow Electrophoresis (Hwang and
Kammermeyer, 1975) Figure 2.5 Force balance on a particle during the filtration process
(Source: Weigert et al., 1999)
Figure 2.6 Schematic diagram of EMF with tubular module Figure 2.7 Schematic diagram of flat sheet membrane module without ion
exchange membranes Figure 2.8 Schematic diagram of flat sheet membrane module with ion
exchange membranes Figure 2.9 Schematic diagram of the electrodialysis process (Baker et al.,
1991)
13
21
22
29
31
34
35
37
38
Figure 3.1 Flowchart of the overall process study Figure 3.2 Cross section of the FFE module Figure 3.3 Schematic diagram of the experimental set-up: [1 feed tank, 2
peristaltic pump, 3 flowmeter, 4 pressure gauge, 5 forced flow electrophoresis module, 6 adjustable valve, 7 diaphragm pump, 8 electrolyte tank (anode), 9 electrolyte tank (cathode), 10 permeate tank]
46
48
50
Figure 4.1 Comparison between UF and FFE on permeate flux with time for BSA and BGG filtration. TMP = 100 kPa, Co = 0.50 g/L of protein, pH 8.0, 20 mM of PBS, MWCO of membrane: 30 kDa (BSA) and 50 kDa (BGG)
Figure 4.2 Global hydraulic resistance of UF and FFE with time for BSA
and BGG filtration. TMP = 100 kPa, Co = 0.50 g/L of protein, pH 8.0, 20 mM of PBS, MWCO of membrane: 30 kDa (BSA) and 50 kDa (BGG)
66
68
x
Figure 4.3 Effect of electric field strength on the permeate flux for FFE of BSA at various transmembrane pressure after 102 minutes of experiments. Co = 0.50 g/L of BSA, pH 8.0, 20 mM of PBS, MWCO of membrane: 30 kDa
Figure 4.4 Effect of electric field strength on the permeate flux for FFE of
BGG at various transmembrane pressure after 102 minutes of experiments. Co = 0.50 g/L of BGG, pH 8.0, 20 mM of PBS, MWCO of membrane: 50 kDa
Figure 4.5 Illustration of the interaction between charged protein and
membrane charged surface in the feed/retentate compartment (E = 1.0 to 8.0 V/cm)
Figure 4.6 Illustration of the proteins deposition at their IEP on PES
membrane surface in the feed/retentate compartment (E = 10.0 V/cm for BSA and E = 5.0 to 8.0 V/cm for BGG)
Figure 4.7 Illustration of the interaction between charged protein and
membrane charged surface in the feed/retentate compartment (E = 10.0 to 20.0 V/cm)
Figure 4.8 Variation of electric current over time. E = 3.0 V/cm, pH 8.0,
TMP = 100 kPa, Co = 0.50 g/L BSA, 20 mM of PBS, MWCO of membrane: 30 kDa
Figure 4.9 Effect of electric field strength on the permeate flux for FFE of
BSA at various initial BSA concentration after 102 minutes of experiments. TMP = 100 kPa, pH 8.0, 20 mM of PBS, MWCO of membrane: 30 kDa
Figure 4.10 Effect of electric field strength on the permeate flux for FFE of
BGG at various initial BGG concentration after 102 minutes of experiments. TMP = 100 kPa, pH 8.0, 20 mM of PBS, MWCO of membrane: 50 kDa
Figure 4.11 Effect of electric field strength on the permeate flux for FFE of
BSA at various initial pH buffer after 102 minutes of experiments. TMP = 100 kPa, Co = 0.50 g/L of BSA, 20 mM of PBS, MWCO of membrane: 30 kDa
Figure 4.12 Effect of electric field strength on the permeate flux for FFE of
BGG at various initial pH buffer after 102 minutes of experiments. TMP = 100 kPa, Co = 0.50 g/L of BGG, 20 mM of PBS, MWCO of membrane: 50 kDa
Figure 4.13 Effect of electric field strength on the permeate flux for FFE of
BSA at various initial ionic strength after 102 minutes of experiments. TMP = 100 kPa, pH 8.0, Co = 0.50 g/L of BSA, MWCO of membrane: 30 kDa
Figure 4.14 Effect of electric field strength on the permeate flux for FFE of
BGG at various initial ionic strength after 102 minutes of experiments. TMP = 100 kPa, pH 8.0, Co = 0.50 g/L of BGG, MWCO of membrane: 50 kDa
71
71
72
74
76
76
78
78
81
82
85
85
xi
Figure 4.15 Variation of the permeate flux over time for FFE of BSA at various transmembrane pressure. E = 3.0 V/cm, pH 8.0, Co = 0.50 g/L BSA, 20 mM of PBS, MWCO of membrane: 30 kDa
Figure 4.16 Variation of the permeate flux over time for FFE of BGG filtration at various transmembrane pressure. E = 3.0 V/cm, pH 8.0, Co = 0.50 g/L BGG, 20 mM of PBS, MWCO of membrane: 50 kDa
Figure 4.17 Effect of transmembrane pressure on the permeate flux after
102 minutes of experiments. E = 3.0 V/cm, pH 8.0, Co = 0.50 g/L of protein, 20 mM of PBS, MWCO of membrane: 30 kDa (BSA) and 50 kDa (BGG)
Figure 4.18 Variation of the permeate flux over time at various initial BSA
concentration for FFE of BSA. E = 3.0 V/cm, TMP = 100 kPa, pH 8.0, 20 mM of PBS, MWCO of membrane: 30 kDa
Figure 4.19 Variation of the permeate flux over time at various initial BGG
concentration for FFE of BGG. E = 3.0 V/cm, TMP = 100 kPa, pH 8.0, 20 mM of PBS, MWCO of membrane: 50 kDa
Figure 4.20 Effect of initial protein concentration on the permeate flux after
102 minutes of experiments. E = 3.0 V/cm, TMP = 100 kPa, pH 8.0, 20 mM of PBS, MWCO of membrane: 30 kDa (BSA) and 50 kDa (BGG)
Figure 4.21 Effect of initial protein concentration on global hydraulic
resistance after 102 minutes of experiments. E = 3.0 V/cm, pH 8.0, Co = 0.50 g/L of protein, 20 mM of PBS, MWCO of membrane: 30 kDa (BSA) and 50 kDa (BGG)
Figure 4.22 Variation of the permeate flux over time for FFE of BSA at
various initial pH buffer. E = 3.0 V/cm, TMP = 100 kPa, Co = 0.50 g/L of BSA, 20 mM of PBS, MWCO of membrane: 30 kDa
Figure 4.23 Variation of the permeate flux over time for FFE of BGG at various initial pH buffer. E = 3.0 V/cm, TMP = 100 kPa, Co = 0.50 g/L BGG, 20 mM of PBS, MWCO of membrane: 50 kDa
Figure 4.24 Effect of initial pH buffer on the permeate flux after 102 minutes of experiments. E = 3.0 V/cm, TMP = 100 kPa, Co = 0.50 g/L of protein, 20 mM of PBS, MWCO of membrane: 30 kDa (BSA) and 50 kDa (BGG)
Figure 4.25 Effect of initial pH buffer on global hydraulic resistance after
102 minutes of experiments. E = 3.0 V/cm, pH 8.0, Co = 0.50 g/L of protein, 20 mM of PBS, MWCO of membrane: 30 kDa (BSA) and 50 kDa (BGG)
Figure 4.26 Variation of the permeate flux over time for FFE of BSA at
various ionic strength concentration. E = 3.0 V/cm, pH 8.0, Co = 0.50 g/L BSA, TMP = 100 kPa, MWCO of membrane: 30 kDa
87
88
89
93
93
94
95
97
98
99
100
102

xii
Figure 4.27 Variation of the permeate flux over time for FFE of BGG at various ionic strength concentration. E = 3.0 V/cm, pH 8.0, Co = 0.50 g/L BGG, TMP = 100 kPa, MWCO of membrane: 50 kDa
Figure 4.28 Effect of initial ionic strength on the permeate flux after 102
minutes of experiments. E = 3.0 V/cm, pH 8.0, Co = 0.50 g/L of proteins, TMP = 100 kPa, MWCO of membrane: 30 kDa (BSA) and 50 kDa (BGG)
Figure 4.29 Effect of initial ionic strength on global hydraulic resistance
after 102 minutes of experiments. E = 3.0 V/cm, pH 8.0, Co = 0.50 g/L of protein, TMP = 100 kPa, MWCO of membrane: 30 kDa (BSA) and 50 kDa (BGG)
103
103
105
Figure A.1 Effect of transmembrane pressure on water flux for 30 kDa membrane
Figure A.2 Effect of transmembrane pressure on water flux for 50 kDa
membrane Figure B.1 Standard calibration curve for BSA at different pH. (Working
Range = 25 to 250 µm/ml) Figure B.2 Standard calibration curve for BSA at different pH. (Working
Range = 1 to 25 µm/ml) Figure B.3 Standard calibration curve for BSA at different ionic strength.
(Working Range = 25 to 250 µm/ml) Figure B.4 Standard calibration curve for BSA at different ionic strength.
(Working Range = 1 to 25 µm/ml) Figure B.5 Standard calibration curve for BGG at different pH. (Working
Range = 25 to 250 µm/ml) Figure B.6 Standard calibration curve for BGG at different pH. (Working
Range = 1 to 25 µm/ml) Figure B.7 Standard calibration curve for BGG at different ionic
strength. (Working Range = 25 to 250 µm/ml) Figure B.8 Standard calibration curve for BGG at different ionic
strength. (Working Range = 1 to 25 µm/ml)
116
116
117
117
118
118
119
119
120
120
xiii
LIST OF PLATES
Page Plate 3.1 Detachable compartments of FFE module Plate 3.2 Experimental rig for the FFE system Plate 3.3 Rotofor System (Bio-rad, USA) Plate 3.4 The Genesys 20 Vis Spectrophotometer (Thermo Fisher Scientific,
MA) used in this work
48
51
56
60
xiv
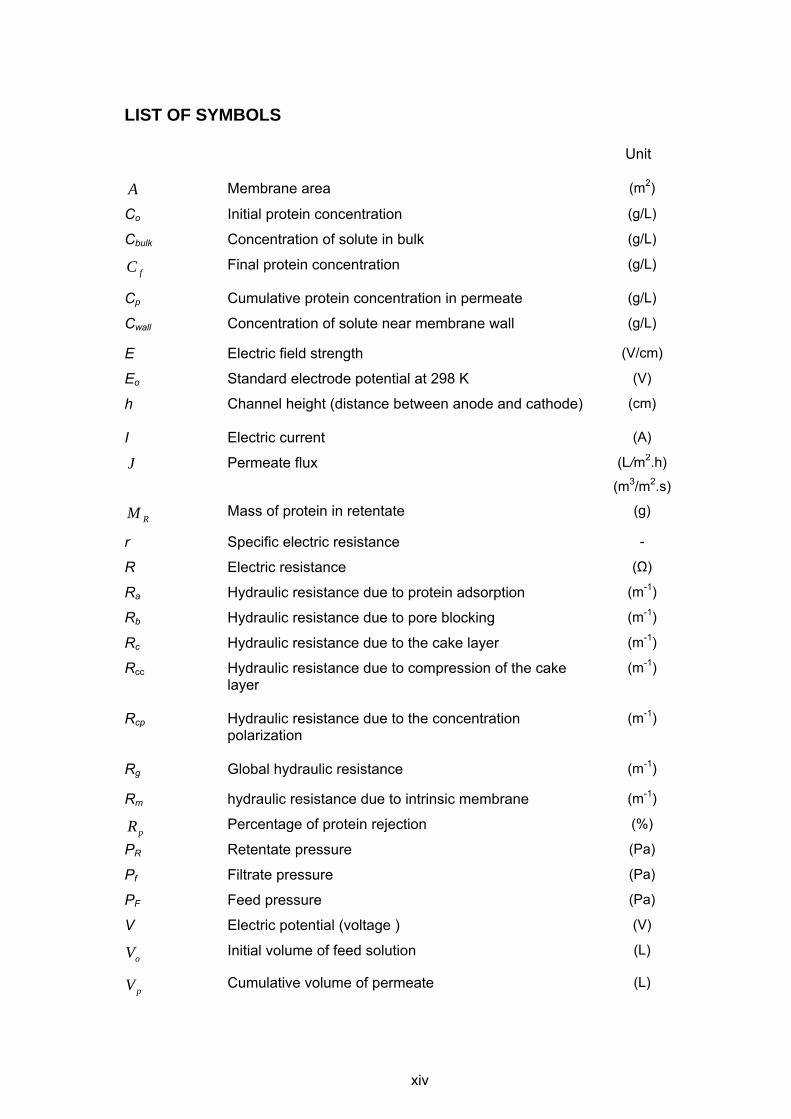
LIST OF SYMBOLS Unit
A Membrane area (m2)
Co Initial protein concentration (g/L)
Cbulk Concentration of solute in bulk (g/L)
fC Final protein concentration (g/L)
Cp Cumulative protein concentration in permeate (g/L)
Cwall Concentration of solute near membrane wall (g/L)
E Electric field strength (V/cm)
Eo Standard electrode potential at 298 K (V)
h Channel height (distance between anode and cathode)
(cm)
I Electric current (A)
J Permeate flux (L/m2.h)
(m3/m2.s)
RM Mass of protein in retentate (g)
r Specific electric resistance -
R Electric resistance (Ω)
Ra Hydraulic resistance due to protein adsorption (m-1)
Rb Hydraulic resistance due to pore blocking (m-1)
Rc Hydraulic resistance due to the cake layer (m-1)
Rcc Hydraulic resistance due to compression of the cake layer
(m-1)
Rcp Hydraulic resistance due to the concentration polarization
(m-1)
Rg Global hydraulic resistance (m-1)
Rm hydraulic resistance due to intrinsic membrane (m-1)
pR Percentage of protein rejection (%)
PR Retentate pressure (Pa)
Pf Filtrate pressure (Pa)
PF Feed pressure (Pa)
V Electric potential (voltage ) (V)
oV Initial volume of feed solution (L)
pV Cumulative volume of permeate (L)

xv
Greek letters k Conductivity (µS/cm) μ Dynamic viscosity (Pa.s)
∆P Transmembrane pressure Pa
tΔ Time difference (h)
VΔ Cumulative volume difference (L)
xvi
LIST OF ABBREVIATIONS
AEM
BSA
BGG
CEM
EMF
FFE
HSA
IEF
IEP
IgA
IgD
IgE
IgG
IgM
IVIg
M
MF
MWCO
NWP
PBS
PES
SPE
TMP
UF
Anion exchange membrane
Bovine Serum Albumin
Bovine γ-globulin
Cation exchange membrane
Electro-membrane filtration
Forced-Flow Electrophoresis
Human Serum Albumin
Isoelectric focusing
Isoelectric point
Immunoglobulin A
Immunoglobulin D
Immunoglobulin E
Immunoglobulin G
Immunoglobulin M
Intravenous immunoglobulin
Electrode material
Microfiltration
Molecular weight cut off
Normal water permeability
Phosphate buffer solution
Polyethersulfone
Soy protein extract
Transmembrane pressure
Ultrafiltration
xvii
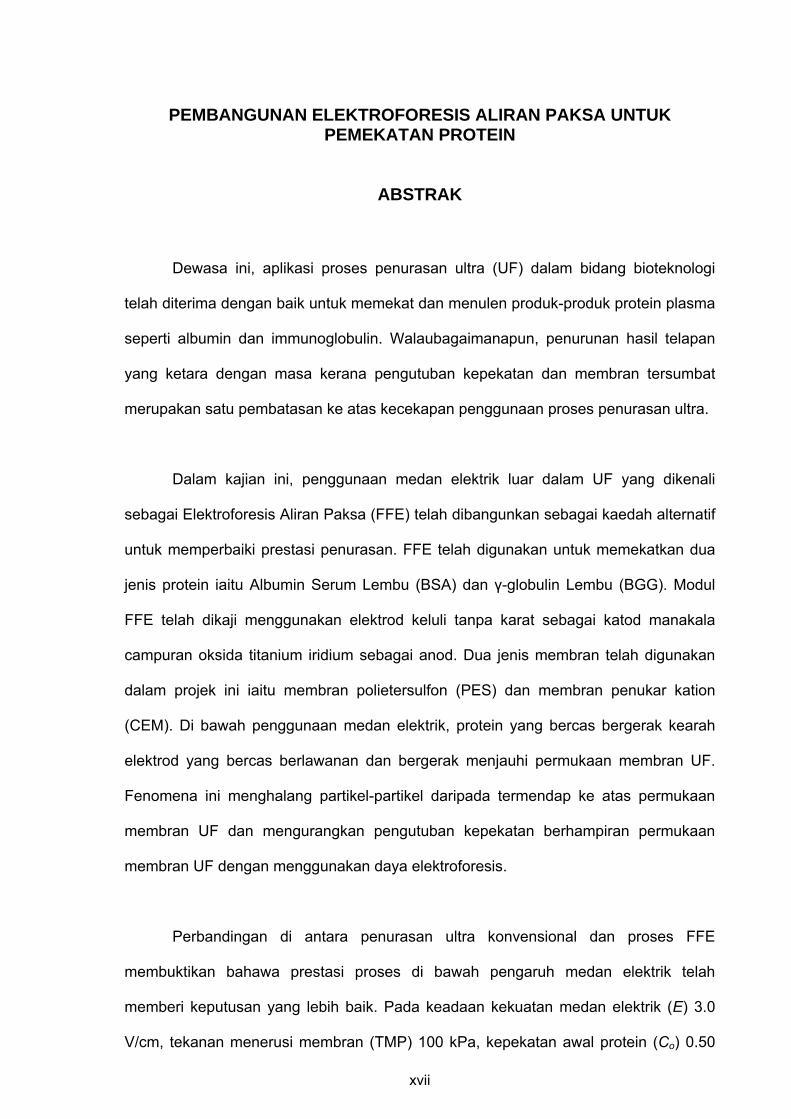
PEMBANGUNAN ELEKTROFORESIS ALIRAN PAKSA UNTUK PEMEKATAN PROTEIN
ABSTRAK
Dewasa ini, aplikasi proses penurasan ultra (UF) dalam bidang bioteknologi
telah diterima dengan baik untuk memekat dan menulen produk-produk protein plasma
seperti albumin dan immunoglobulin. Walaubagaimanapun, penurunan hasil telapan
yang ketara dengan masa kerana pengutuban kepekatan dan membran tersumbat
merupakan satu pembatasan ke atas kecekapan penggunaan proses penurasan ultra.
Dalam kajian ini, penggunaan medan elektrik luar dalam UF yang dikenali
sebagai Elektroforesis Aliran Paksa (FFE) telah dibangunkan sebagai kaedah alternatif
untuk memperbaiki prestasi penurasan. FFE telah digunakan untuk memekatkan dua
jenis protein iaitu Albumin Serum Lembu (BSA) dan γ-globulin Lembu (BGG). Modul
FFE telah dikaji menggunakan elektrod keluli tanpa karat sebagai katod manakala
campuran oksida titanium iridium sebagai anod. Dua jenis membran telah digunakan
dalam projek ini iaitu membran polietersulfon (PES) dan membran penukar kation
(CEM). Di bawah penggunaan medan elektrik, protein yang bercas bergerak kearah
elektrod yang bercas berlawanan dan bergerak menjauhi permukaan membran UF.
Fenomena ini menghalang partikel-partikel daripada termendap ke atas permukaan
membran UF dan mengurangkan pengutuban kepekatan berhampiran permukaan
membran UF dengan menggunakan daya elektroforesis.
Perbandingan di antara penurasan ultra konvensional dan proses FFE
membuktikan bahawa prestasi proses di bawah pengaruh medan elektrik telah
memberi keputusan yang lebih baik. Pada keadaan kekuatan medan elektrik (E) 3.0
V/cm, tekanan menerusi membran (TMP) 100 kPa, kepekatan awal protein (Co) 0.50
xviii
g/L, pH 8.0 dan 20 mM larutan penimbal fosfat (PBS), kadar hasil telapan FFE bagi
penurasan BSA dan BGG, telah bertambah baik sebanyak 116.67% dan 46.56%,
masing-masing berbanding penurasan ultra konvensional. Rintangan hidraulik global
bagi BSA dan BGG berkurang sebanyak 53.94% dan 31.87%, masing-masing di
bawah keadaan yang sama.
Prestasi bagi proses FFE dipengaruhi oleh potongan berat molekul (MWCO)
bagi membran PES, kekuatan medan elektrik (E), tekanan menerusi membran (TMP),
kepekatan awal protein (Co), pH awal penimbal dan kepekatan awal ionik bagi larutan
penimbal fosfat (PBS). Didapati bahawa 30 kDa membran polietersulfon (PES) adalah
sesuai bagi penurasan BSA manakala 50 kDa membran polietersulfon (PES) pula
sesuai bagi penurasan BGG. Pada E = 3.0 V/cm, keadaan optimum operasi bagi
pemekatan kedua-dua BSA dan BGG dalam sistem FFE ialah pH 8.0, 20 mM PBS, Co
0.50 g/L dan TMP 100 kPa. Pada keadaan ini, kadar hasil telapan bagi BSA ialah
33.78 L/m2.h manakala bagi BGG ialah 14.29 L/m2.h. Rintangan hidraulik global bagi
BSA dan BGG ialah1.17 x 1013 m-1 and 2.77 x 10¹³ m-1, masing-masing. Pada akhir
eksperimen, BSA dan BGG telah dipekatkan daripada 0.50 g/L kepada 1.45 g/L dan
0.76 g/L, masing-masing. Daripada kajian ini, telah didapati bahawa penggunaan
medan elektrik dalam UF telah memperbaiki prestasi penurasan untuk pemekatan
larutan protein.

xix
DEVELOPMENT OF FORCED-FLOW ELECTROPHORESIS FOR PROTEINS CONCENTRATION
ABSTRACT
Nowadays, the application of ultrafiltration (UF) process in the field of
biotechnology has been well accepted to concentrate and purify plasma protein
products such as albumin and immunoglobulin. However, the significant flux declines
with time due to concentration polarization and membrane fouling is a limitation to the
efficient use of ultrafiltration process.
In this work, the application of external electric field in UF which is known as
Forced-Flow Electrophoresis (FFE) was developed as an alternative technique to
improve the filtration performance. The FFE was used to concentrate two types of
proteins, Bovine Serum Albumin (BSA) and Bovine γ-globulin (BGG). The FFE module
was studied using a stainless steel electrode as a cathode while titanium iridium mixed
oxide electrode as an anode. Two types of membrane were used in this project which
include polyethersulfone (PES) membrane and cation exchange membrane (CEM).
Under the application of electric field, the charged protein moves towards the opposite
charged electrode and migrates away from the UF membrane surface. This
phenomenon prevents particles from depositing onto the UF membrane surface and
minimized the concentration polarization near the UF membrane by the imposed
electrophoretic force.
The comparison between conventional ultrafiltration and FFE process has
proven that the process performance under the influence of electric field gave better
results. At the condition of electric field strength (E) of 3.0 V/cm, transmembrane
pressure (TMP) of 100 kPa, initial protein concentration (Co) of 0.50 g/L, pH 8.0 and 20
xx
mM of PBS, the permeate flux of FFE for BSA and BGG filtration improved for about
116.67% and 46.56%, respectively as compared to the conventional UF. The global
hydraulic resistance of BSA and BGG were minimized by 53.94% and 31.87%,
respectively under the same conditions.
The performance of FFE process was affected by molecular weight cut off
(MWCO) of PES membrane, electric field strength (E), transmembrane pressure
(TMP), initial protein concentration (Co), initial pH buffer and initial ionic strength of
phosphate buffer solution (PBS). It was found that the 30 kDa of PES membrane was
suitable for BSA filtration while the 50 kDa of PES membrane was suitable for BGG
filtration. At E = 3.0 V/cm, the optimum operating conditions for concentrating both BSA
and BGG in FFE system were pH 8.0, 20 mM of PBS, Co of 0.50 g/L proteins and TMP
of 100 kPa. At this condition, the permeate flux of BSA was 33.78 L/m2.h while for BGG
was 14.29 L/m2.h. The global hydraulic resistance for BSA and BGG was 1.17 x 10¹³
m-1 and 2.77 x 10¹³ m-1, respectively. At the end of experiment, the BSA and BGG was
concentrated from 0.50 g/L to 1.45 g/L and 0.76 g/L, respectively. From this research, it
was found that the application of electric field in UF has improved the filtration
performance for concentrating proteins solution.
1
CHAPTER ONE
INTRODUCTION
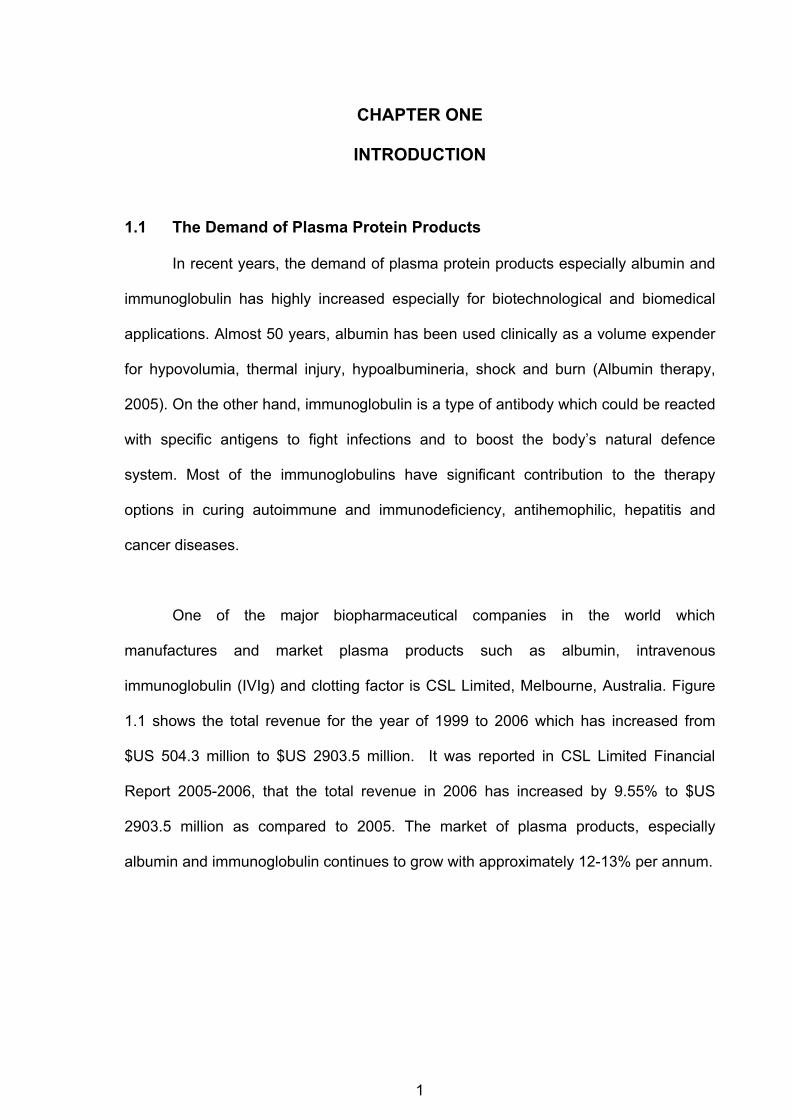
1.1 The Demand of Plasma Protein Products
In recent years, the demand of plasma protein products especially albumin and
immunoglobulin has highly increased especially for biotechnological and biomedical
applications. Almost 50 years, albumin has been used clinically as a volume expender
for hypovolumia, thermal injury, hypoalbumineria, shock and burn (Albumin therapy,
2005). On the other hand, immunoglobulin is a type of antibody which could be reacted
with specific antigens to fight infections and to boost the body’s natural defence
system. Most of the immunoglobulins have significant contribution to the therapy
options in curing autoimmune and immunodeficiency, antihemophilic, hepatitis and
cancer diseases.
One of the major biopharmaceutical companies in the world which
manufactures and market plasma products such as albumin, intravenous
immunoglobulin (IVIg) and clotting factor is CSL Limited, Melbourne, Australia. Figure
1.1 shows the total revenue for the year of 1999 to 2006 which has increased from
$US 504.3 million to $US 2903.5 million. It was reported in CSL Limited Financial
Report 2005-2006, that the total revenue in 2006 has increased by 9.55% to $US
2903.5 million as compared to 2005. The market of plasma products, especially
albumin and immunoglobulin continues to grow with approximately 12-13% per annum.

2
504.3
854.8
1350.2 1313.2
1835.7
2650.32903.5
0
500
1000
1500
2000
2500
3000
3500
1999-2000
2000-2001
2001-2002
2002-2003
2003-2004
2004-2005
2005-2006
Year
Tota
l Rev
enue
($U
S m
illio
n)
Figure 1.1 Total Revenue (CSL Limited, 2006)
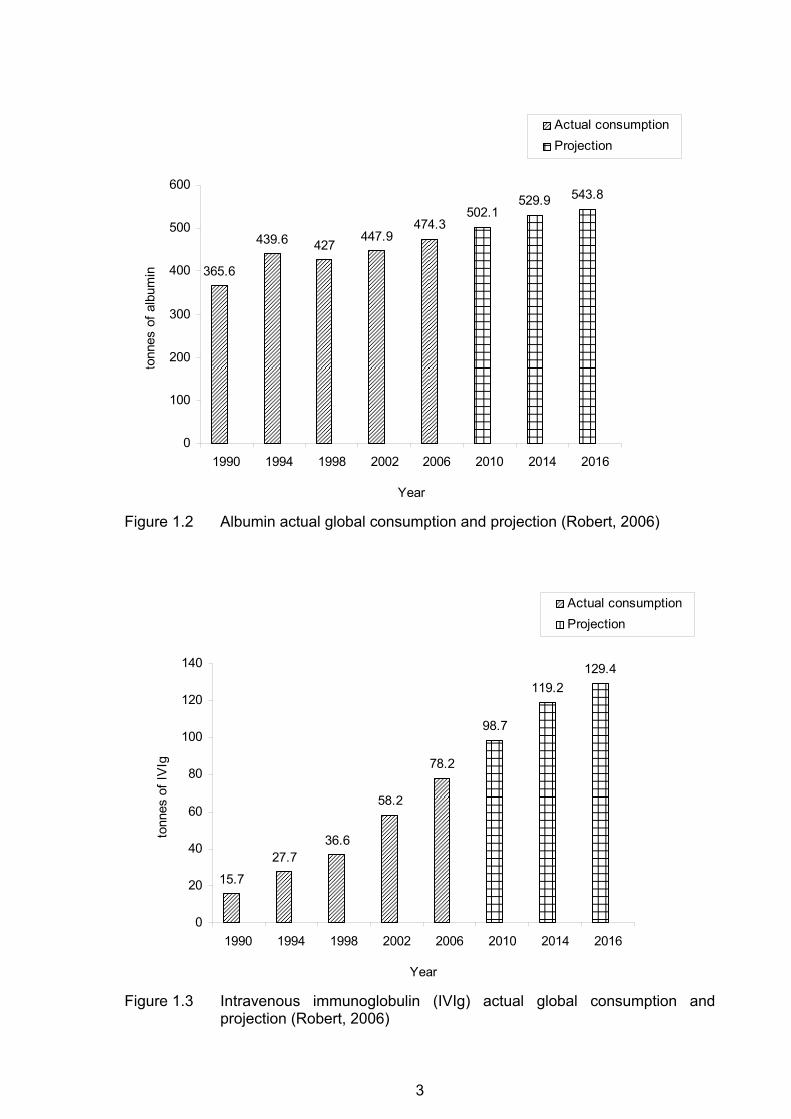
Figure 1.2 and Figure 1.3 show the market demands for both albumin and
intravenous immunoglobulin (IVIg) which were reported by Robert (2006) in Market
statistics and trends of plasma protein products. The actual global consumption of both
proteins has been slightly increased since 1990 until 2006. A projected trend
extrapolated until 2016, with respect to the global demand for intravenous
immunoglobulin and albumin is represented in both figures. The trend is based on
historical demand figures dating from 2000 onwards and suggests an increase in
demand of 7.0 tonnes of albumin and 5.1 tonnes of intravenous immunoglobulin
annually for the period of 2006 – 2016. The high demand of plasma products should be
in lines with the production capacity of the plasma products and will turn to reduce
gradually without the appropriate plant facilities and process development. Thus, the
maintenance and process improvement are considered as one of the important
requirements in the production process.
3
365.6
439.6 427447.9
474.3502.1
529.9 543.8
0
100
200
300
400
500
600
1990 1994 1998 2002 2006 2010 2014 2016
Year
tonn
es o
f alb
umin
Actual consumptionProjection
Figure 1.2 Albumin actual global consumption and projection (Robert, 2006)
15.7
27.736.6
58.2
78.2
98.7
119.2129.4
0
20
40
60
80
100
120
140
1990 1994 1998 2002 2006 2010 2014 2016
Year
tonn
es o
f IV
Ig
Actual consumptionProjection
Figure 1.3 Intravenous immunoglobulin (IVIg) actual global consumption and
projection (Robert, 2006)
4
1.2 Membrane Application in Pharmaceutical Industry
The applications of membrane processes in the field of biotechnology are widely
used both in the laboratory and in industry to clarify, concentrate and purify
macromolecular products. The developed membrane operations have played an
important role in the production of high value added products, such as antibiotics,
enzymes, albumin, antibody and other bio-products (Tarazaga et al., 2006).
In downstream processing, membranes are suitable to be used for separation of
desired material from unwanted components and concentrating the diluted biological
substances to the desired final concentration. Membrane processes such as
ultrafiltration, microfiltration, reverse osmosis, pervaporation and electrodialysis are
finding niches in downstream processing of recombinant proteins and proteins
produced from fused cell cultures (Crespo and Boddeker, 1994). Combining membrane
processes with other unit processes such as precipitation, affinity ligand adsorption and
coupling several chromatographic techniques one after the other such as ion
exchange, gel filtration and affinity chromatography also becoming economically
attractive which has been applied in commercial plasma fractionation process.
Although membrane technology has not played a critical role in the discovery
process of the biological revolution, it is an important component in the production of
valuable pharmaceuticals and other biological molecules. The development of novel
approaches to improve the efficiency of downstream processes is desirable to simplify
processing or improve product yield and purity. Since the growing demand for the
production of protein biopharmaceuticals products has been largely increased, there is
consequently an increasing requirement to improve the efficiency of bioprocess
involved. One way of achieving this could be to develop tools and techniques for the
rapid, smaller energy consumption and operation flexibility.

5
1.3 Problem Statement
The development of an alternative method for the industrial protein
concentration is desirable since it is gaining great importance in the biopharmaceutical
processes. Nowadays, membrane technology has been well accepted in commercial
application as a unit process in the downstream part of biopharmaceutical processes to
concentrate most valuable components such as albumin and immunoglobulin.
Ultrafiltration is preferred for protein concentration, ethanol removal and desalting
because there is less denaturation and more efficient than vacuum freeze-drying
(lyophilization) or thin film evaporation (Porter, 1990). A major advantage of
concentration by ultrafiltration over conventional evaporation or lyophilization is the
reduction of energy cost due to no latent heat required to evaporate the diluted protein
solution while maintaining product purity under ambient conditions (Porter, 1990).
The application of ultrafiltration process in the field of biotechnology is being
increasingly integrated into the recovery schemes for the production of valuable
biological molecules. The problems facing with the ultrafiltration process are flux
declination during the operation time. The limitation is attributed to several factors,
namely, broad membrane pore size distribution, concentration polarization, membrane
fouling, solute-solute and solute-membrane interactions (Nakatsuka and Micheals,
1992). The accumulation of solute particles on the membrane surface which known as
concentration polarization increases the viscosity and osmotic pressure during a
process. On the other hand, the deposition of retained colloidal and macromolecular
material on the membrane surface creates membrane fouling which closely related with
the interaction between protein charged and the membrane surface charge during the
process. These phenomena offer to some external extra resistance to the solvent flow
through the membrane. These limitations consequently contribute to the cost of the
process as it requires frequent cleaning and replacement of the membrane.
6
There are four types of membrane modules in the ultrafiltration which is tubular,
hollow fiber, spiral wound and plate-and-frame modules. Among these, the plate-and-
frame module found to be high resistant to fouling. In downstream processing of
plasma fractionation process, spiral wound ultrafiltration has been used as a unit
operation to concentrate the albumin and immunoglobulin. One of the disadvantages
of the module is if only a part of the spiral wound ultrafiltration membrane fails (due to
fouling); the entire module must be discarded (Schafer et al., 2005). However, in plate-
and-frame module, if the membrane in one of the plates fails, it can be individually
replaced and the entire module does not have to be discarded (Schafer et al., 2005).
Intensive researches on alternative anti-fouling strategy for plate-and-frame
module have been carried out by some researchers. A challenge faced in the
development of the new techniques which can improve the flux performance as
compared to the conventional ultrafiltration. Several techniques have been developed
including promoting turbulence at or near a membrane surface (Oussedik et al., 2000),
gas sparged membrane filtration (Cheng and Li, 2007; Cheng 2002) and electro-
membrane filtration (Park, 2006; Tarazaga et al., 2006; Weber and Stahl, 2002; Karthik
et al., 2002; Oussedik et al., 2000; Iritani et al., 2000; Mameri et al., 1999; Weigert et
al., 1999 and Zumbusch et al., 1998). Among these techniques, the electro-membrane
filtration (EMF) seems to be the most effective methods to minimize the existing
problems. In EMF process, the application of electric field at low operating pressure will
minimize the accumulation of the solutes on the membrane surface by imposing the
electrophoretic force.
There are a few configurations of electro-membrane filtration modules. The
simplest configuration is to insert the electrodes into the suspension and permeate
channels which have been investigated by Weber and Stahl (2002), Karthik et al.
(2002), Oussedik et al. (2000), Iritani et al. (2000), Mameri et al. (1999) and Zumbusch

7
et al. (1998). However, the major disadvantage of this configuration is that the
electrolysis products enter the filtration cycle and significantly change the suspension
pH value (Weigert et al., 1999). Alternatively, the ion exchange membrane (cation
exchange membrane and anion exchange membrane) were used to separate the
filtration and rinsing cycle which at the same time helps to prevent the direct contact
between feed and electrolysis products (Pribyl et al., 2003; Bargeman et al., 2002;
Weigert et al., 1999; O’Connor et al., 1996).
It was reported by Hwang and Kammermeyer (1975) that most of the synthetic
polymeric anion exchange membranes (AEM) are not stable as compared to the cation
exchange membrane (CEM). When the feed streams contain high molecular weight
anions, they usually adsorb on the AEM and thus foul the surface. At a sufficient
electric current, the transport depletion occurs where the total ionic concentration near
the AEM interface becomes severely depleted due to the concentration polarization
effect. The ionic concentration is often polarized to such an extent which resulted in the
changes of the pH value near the interface (Hwang and Kammermeyer, 1975). In this
case, the AEM which is unstable at a high pH value generally deteriorates and the
effective membrane life is shortened. In order to eliminate such a membrane
deterioration, the array of cation exchange membrane (CEM) and ultrafiltration
membrane will be investigated in this project rather than the usual anion-cation
membrane combination. The process is known as Forced-Flow Electrophoresis (FFE).
In the Forced-Flow Electrophoresis, the employment of two types of
membranes; polyethersulfone ultrafiltration and cation exchange membranes in the
plate-and-frame module are expected to minimize the concentration polarization effect
in the membrane processes under the influence of external electric field. The
movement of protein charged away from the membrane surface under the influence of
8
electric field has a potential to improve the filtration performance as compared to the
conventional ultrafiltration in terms of flux decay and concentration polarization effect.
1.4 Research Objectives The present research study has the following objectives:
1. To develop a Forced-Flow Electrophoresis (FFE) method to improve the
ultrafiltration process for concentrating proteins solution, Bovine Serum
Albumin (BSA) and Bovine γ-globulin (BGG) based on the difference in
terms of charge and molecular size.
2. To compare the performance of Forced-Flow Electrophoresis (FFE) and
conventional ultrafiltration (UF) in terms of the permeate flux and global
hydraulic resistance for BSA and BGG.
3. To study the process parameters covering molecular weight cut off (MWCO)
of membrane, electric field strength, transmembrane pressure, initial protein
concentration, initial pH buffer and initial ionic strength of buffer in terms of
flux profile, global hydraulic resistance and final protein concentration.
1.5 Scope of Study
Two types of proteins, Bovine Serum Albumin (BSA) and Bovine γ-globulin
(BGG) purchased from Sigma Aldrich (USA) were used to study the performance of
FFE process. The albumin and γ-globulin were selected because they are found in
major fraction in the human protein plasma and have valuable potential to be used
clinically as a therapeutic agent. The technique of Rotofor System was used to
determine the isoelectric point (IEP) of protein. The ultrafiltration membrane of Biomax
polyethersulfone (PES) membranes made by Millipore Corporation (USA), with
different molecular weight cut off (MWCO), 30 kDa and 50 kDa were studied to find the
highest rejection of the protein. The experiment was conducted using fabricated FFE
module.

9
The performance of conventional ultrafiltration and FFE process were compared
in term of the permeate flux and global hydraulic resistances. The pertinent process
parameters were identified to gauge the process performance covering
transmembrane pressure (100 to 250 kPa), initial protein concentration (0.50 to 7.50
g/L), initial pH (pH 5.0 to 8.0) and initial ionic strength of buffer (20 to 150 mM). The
effect of electric field strength (E) was studied in the range of 1.0 to 20.0 V/cm for each
process parameter to study the filtration behavior on each process parameter. The
performance of the Forced-Flow Electrophoresis (FFE) process was studied in terms of
flux profile, global hydraulic resistance and final protein concentration.
1.6 Organization of Thesis Chapter 1: Introduction describes the general application of protein plasma products,
albumin and gamma-globulin and the current biopharmaceutical demand in the world.
Then, the application of membrane processes in the pharmaceutical industry is
described in general. The problem statement of the research is stated to give the clear
objectives of the present study. The scope of the study covers the research work done
to meet these objectives.
Chapter 2: Literature Review is divided into four main sections. The first section
describes the structures and the characteristics of protein plasma, albumin and
gamma-globulin. The second section elaborates the industrial method for protein
concentration such as thin film evaporation, vacuum freeze-drying and membrane
filtration. The third section describes the ultrafiltration process covering ultrafiltration
membrane, concentration polarization and fouling problem, the interaction between
protein charge and membrane charge on fouling and the various filtration techniques to
enhance ultrafiltration. Section four describes the proposed Forced-Flow
Electrophoresis (FFE) to improve the performance of ultrafiltration of protein solution.
10
This section covers the description of the process, the driving force involved, force
interaction and electrokinetic effect in FFE process and various configuration of electro-
membrane filtration (EMF) module.
Chapter 3: This chapter is divided into seven main sections. The first section is about
the materials and chemicals used in the present work. The second section presents the
flowchart of the overall process study. The third section describes the set up of FFE
module and experimental rig used in the experiment. Section four describes the
experimental procedures in this work followed by parameters study of FFE process in
section five. The analytical techniques used in this experiment were described in
section six while the calculation of experimental data is given in section seven.
Chapter 4: Results and Discussion chapter presents the experimental data and results
along with the useful observations and findings. It covers the discussion about
isoelectric point of BSA and BGG, selection of membrane pore size, comparison
between ultrafiltration and Forced-Flow Electrophoresis (FFE) and parameter study of
Forced-Flow Electrophoresis (FFE). The parameters studied include electric field
strength, transmembrane pressure, initial protein concentration, initial pH buffer and
initial ionic strength of buffer. It is discussed in term of flux profile, global hydraulic
resistance and final protein concentration.
Chapter 5: Conclusions and Recommendations chapter presents the concluding
remarks on the potential of Forced-Flow Electrophoresis to improve the ultrafiltration of
protein solutions. Some recommendations for the future studies are also given in this
chapter.
CHAPTER TWO
LITERATURE REVIEW
11
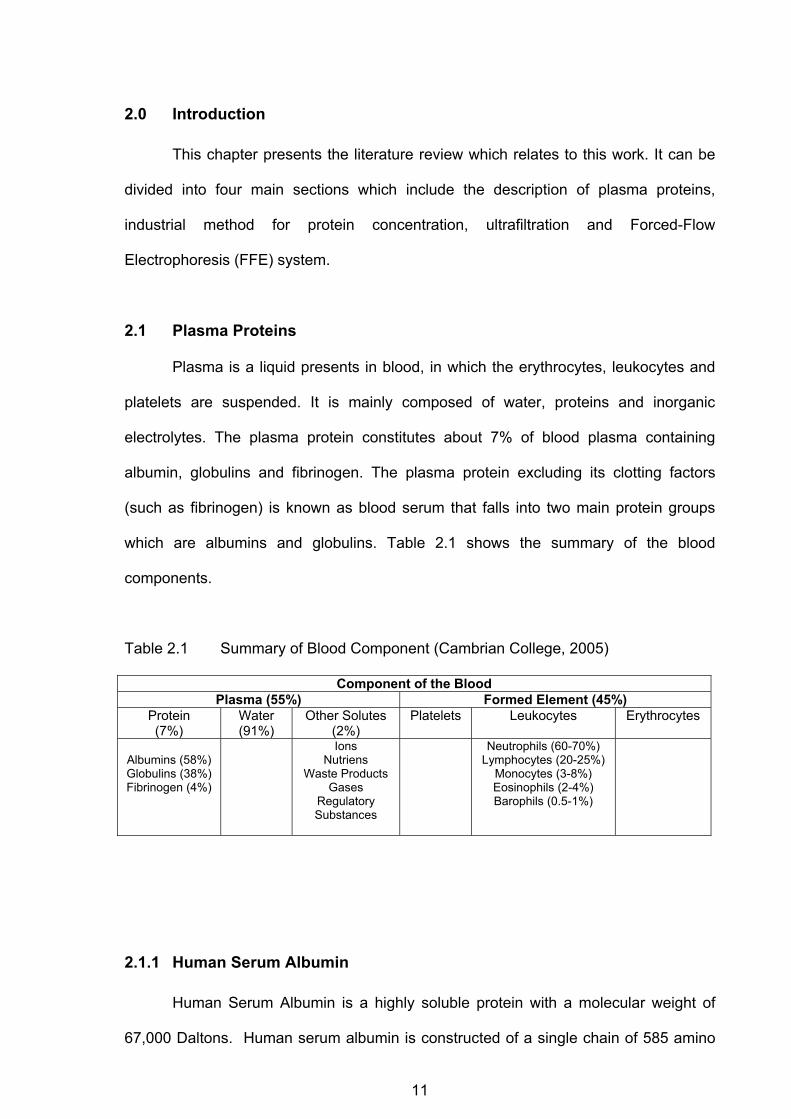
2.0 Introduction This chapter presents the literature review which relates to this work. It can be
divided into four main sections which include the description of plasma proteins,
industrial method for protein concentration, ultrafiltration and Forced-Flow
Electrophoresis (FFE) system.
2.1 Plasma Proteins
Plasma is a liquid presents in blood, in which the erythrocytes, leukocytes and
platelets are suspended. It is mainly composed of water, proteins and inorganic
electrolytes. The plasma protein constitutes about 7% of blood plasma containing
albumin, globulins and fibrinogen. The plasma protein excluding its clotting factors
(such as fibrinogen) is known as blood serum that falls into two main protein groups
which are albumins and globulins. Table 2.1 shows the summary of the blood
components.
Table 2.1 Summary of Blood Component (Cambrian College, 2005)
Component of the Blood Plasma (55%) Formed Element (45%)
Protein (7%)
Water (91%)
Other Solutes (2%)
Platelets Leukocytes Erythrocytes
Albumins (58%) Globulins (38%) Fibrinogen (4%)
Ions Nutriens
Waste Products Gases
Regulatory Substances
Neutrophils (60-70%) Lymphocytes (20-25%)
Monocytes (3-8%) Eosinophils (2-4%) Barophils (0.5-1%)
2.1.1 Human Serum Albumin Human Serum Albumin is a highly soluble protein with a molecular weight of
67,000 Daltons. Human serum albumin is constructed of a single chain of 585 amino

12
acids, crosslinked by 17 disulfide bridges. It has been used as a therapeutic agent for
over 50 years (Matejtschuk et al., 2000). The main functions of albumin include
maintaining the colloid osmotic pressure and transporting hormones, enzymes, fatty
acids, metal ions and drugs. At normal physiological concentrations of plasma
proteins, albumin contributes 80% of the colloidal osmotic (oncotic) pressure of plasma.
Clinical uses of albumin as therapeutic has been widely used to treat hypovolemic
shock, thermal injury, hypoalbuminaemia, trauma, surgery and blood loss, burn
management and plasma exchange (Albumin Therapy, 2005).
2.1.2 Gamma Globulin
Gamma globulin or also known as immunoglobulin is a type of protein found in
serum plasma with a molecular weight of 158,000 Daltons. It is a type of antibody
which could be reacted with specific antigens to fight infections and to boost the body’s
natural defense system (Peeters, 1975). The immunoglobulin is formed from two
identical light (L) and two identical heavy (H) polypeptide chains. These chains are
linked by interchain disulfide bridges from the carboxyl-terminal ends of the light chain
to the heavy chain between the heavy chains in their mid-region (Painter and
Dorrington, 1979). The heavy chains make it possible to divide antibodies into major
immunoglobulin groups termed IgG, IgA, IgM, IgD and IgE. Small differences in the
structure of the heavy chains have made it possible to subdivide immunoglobulins
(IgG) into four subclasses (IgG1 to IgG4) and IgA and IgM into two subclasses. The
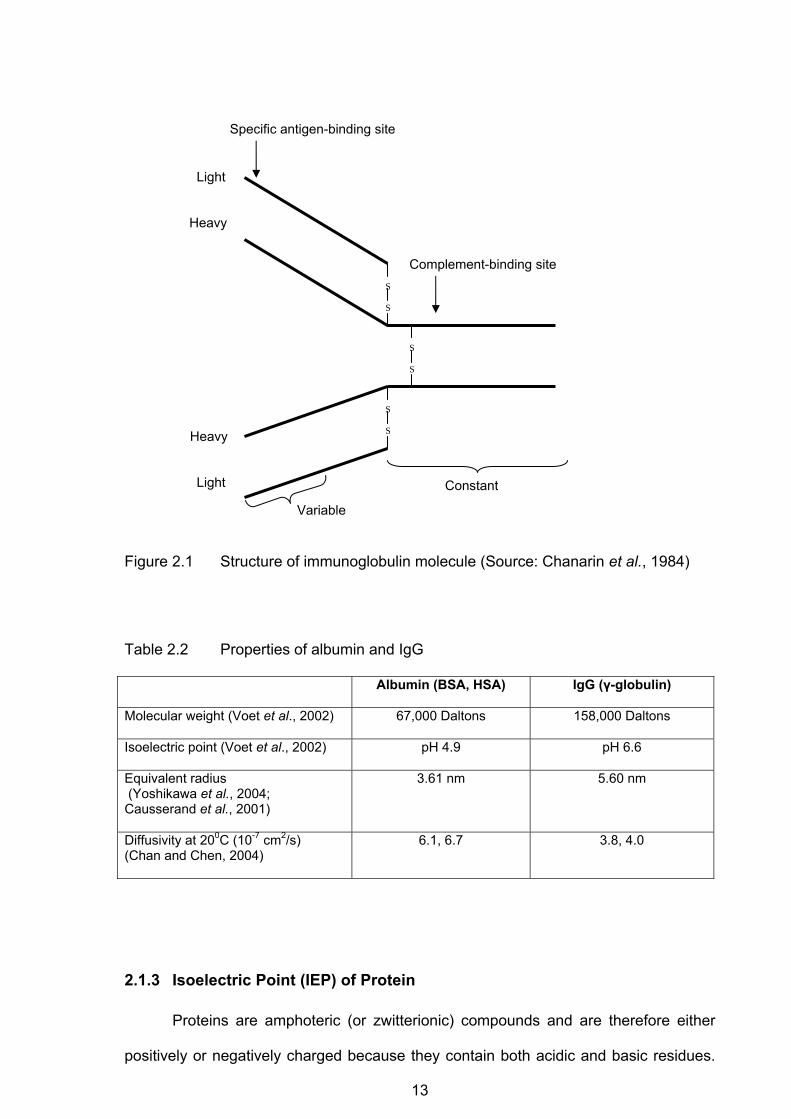
IgG molecule is shown in the Figure 2.1. Most of the immunoglobulin have significant
contribution to the therapy options in curing autoimmune and immunodeficiency,
antihemophilic, hepatitis and cancer diseases. Table 2.2 shows the properties of
albumin and IgG.
13
Figure 2.1 Structure of immunoglobulin molecule (Source: Chanarin et al., 1984)
Table 2.2 Properties of albumin and IgG
Albumin (BSA, HSA) IgG (γ-globulin)
Molecular weight (Voet et al., 2002)
67,000 Daltons 158,000 Daltons
Isoelectric point (Voet et al., 2002)
pH 4.9 pH 6.6
Equivalent radius (Yoshikawa et al., 2004; Causserand et al., 2001)
3.61 nm 5.60 nm
Diffusivity at 200C (10-7 cm2/s) (Chan and Chen, 2004)
6.1, 6.7 3.8, 4.0
2.1.3 Isoelectric Point (IEP) of Protein
Proteins are amphoteric (or zwitterionic) compounds and are therefore either
positively or negatively charged because they contain both acidic and basic residues.
S S
S S
S S
Light Heavy
Heavy Light
Specific antigen-binding site
Complement-binding site
Constant
Variable
14
Most of the charges of protein come from the pH-dependent ionization of amino acid
side-chain carboxyl and amino groups as shown in Equation 2.1 and Equation 2.2.
Carboxyl group: -COOH COO - + H+ (2.1)
Amino group: -NH2 + H+ NH3
+ (2.2)
These proteins show different net charges at different pH media (Peng et al., 2004).
The net charge of a protein is determined by the pH of the surrounding medium and
the number and types of amino acids carrying amino or carboxyl groups.
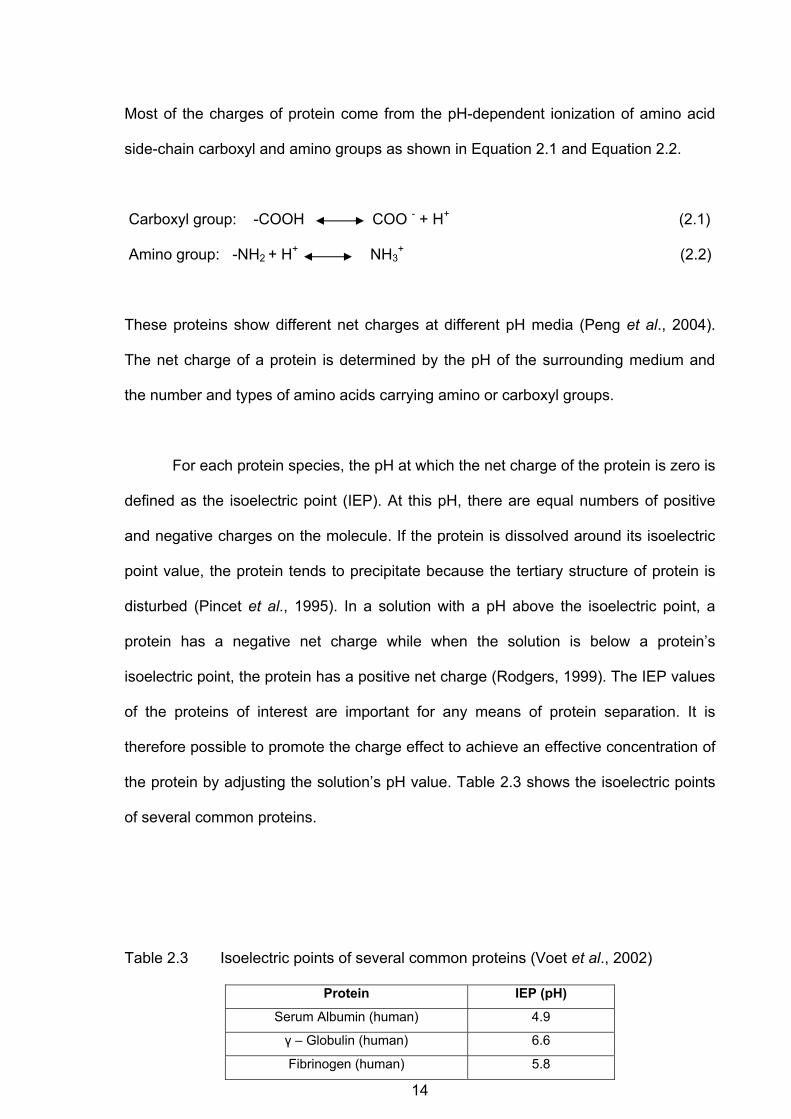
For each protein species, the pH at which the net charge of the protein is zero is
defined as the isoelectric point (IEP). At this pH, there are equal numbers of positive
and negative charges on the molecule. If the protein is dissolved around its isoelectric
point value, the protein tends to precipitate because the tertiary structure of protein is
disturbed (Pincet et al., 1995). In a solution with a pH above the isoelectric point, a
protein has a negative net charge while when the solution is below a protein’s
isoelectric point, the protein has a positive net charge (Rodgers, 1999). The IEP values
of the proteins of interest are important for any means of protein separation. It is
therefore possible to promote the charge effect to achieve an effective concentration of
the protein by adjusting the solution’s pH value. Table 2.3 shows the isoelectric points
of several common proteins.
Table 2.3 Isoelectric points of several common proteins (Voet et al., 2002)
Protein IEP (pH)
Serum Albumin (human) 4.9
γ – Globulin (human) 6.6
Fibrinogen (human) 5.8
15
Hemoglobin (human) 7.1
Insulin (bovine) 5.4
Ovalbumin (hen) 4.6
2.2 Industrial Method for Protein Concentration
In the industrial processes, there are quite a number of feed streams which
have to be concentrated to obtain the solute in pure form. The industries involved
include food, dairy, pharmaceutical, biotechnological and chemical industries.
Generally, the concentration of the required products in the feed stream is very low
(Crespo and Boddeker, 1994). This implies that all the solvent (in most cases water)
must be removed in order to achieve the final product concentration. Several methods
for protein concentration in industrial scale have established such as thin film
evaporation, vacuum freeze drying (lyophilization) and membrane processes.
2.2.1 Thin Film Evaporation
Evaporation is primarily associated with the removal of water and other solvent
by boiling in batch processes. Evaporation is conducted by vaporizing a portion of the
solvent to produce a concentrated solution of thick liquor. Most evaporators are heated
by steam condensing on metal tubes. The material to be evaporated flows inside the
tubes.
Thin Film Evaporation is operated under high vacuum while the temperature of
the liquid can be kept low during the process. It is once-through operation where the
feed liquor passes through the tubes only once at the evaporation temperature and can
be quickly cooled as soon as it leaves the evaporator. Then, it leaves the unit as a thick
liquor. This process is especially useful for heat-sensitive materials such as
pharmaceutical products and foods. However, the disadvantage of this process is the
high energy demand during operation which leads to high energy cost.
16
2.2.2 Vacuum Freeze Drying
Freeze drying also known as lyophilization is a dehydration process that being
used more commonly in the bioseparations, food industry and pharmaceutical industry.
In pharmaceutical industries, the freeze drying method is often used to increase the
shelf life of products and reserved for materials that are heat-sensitive, such as
proteins, vaccines, enzymes, microorganisms, and blood plasma (Freeze drying,
2007). In bioseparations, freeze drying can also be used as a late-stage purification
procedure, because it can effectively remove solvents. Furthermore, it is capable of
concentrating molecules with low molecular weights that are too small to be filtered out
by a filtration membrane (Freeze drying, 2007).
Generally, the rotary freeze dryers are usually used with liquid products such as
pharmaceutical solutions and tissue extracts. There are three stages in the complete
freeze drying process which consist of freezing, primary drying, and secondary drying.
For a larger scale operation, freezing is usually done using a freeze drying machine. In
this step, it is important to freeze the material at a temperature below the eutectic point
of the material. Since the eutectic point occurs at the lowest temperature where the
solid and liquid phase of the material can coexist, freezing the material at a
temperature below this point ensures that sublimation rather than melting occurs in the
following steps.
During the primary drying phase the pressure is lowered and enough heat is
supplied to the material for the water to sublime. In this initial drying phase about 98%
of the water in the material is sublimated. This phase may be slow, because if too
much heat is added the material’s structure could be altered. In this phase, pressure is
controlled through the application of partial vacuum. The vacuum speeds up
17
sublimation process making it useful as a deliberate drying process. Furthermore, a
cold condenser chamber and/or condenser plates provides a surface(s) for the water
vapour to re-solidify on. Condenser temperatures are typically below −50 °C.
The secondary drying phase aims to sublime the water molecules that are
adsorbed during the freezing process, since the mobile water molecules were
sublimated in the primary drying phase. This part of the freeze-drying process is
governed by the material’s adsorption isotherms. In this phase, the temperature is
raised even higher than in the primary drying phase to break any physico-chemical
interactions that have formed between the water molecules and the frozen material.
Usually the pressure is also lowered in this stage to encourage sublimation.
This process is relatively expensive due to high energy demands during the
process. It consumes long processing time and the additional of too much heat to the
material can cause melting or structural deformation (Freeze drying, 2007).
2.2.3 Membrane Processes
Pressure-driven membrane processes are being increasingly integrated into
isolation and recovery schemes for the production of valuable biological molecules.
Well known membrane processes such as microfiltration (MF) and ultrafiltration (UF)
are known to be effective methods for removal of particulates and protein
concentration. The heart of the microfiltration field is sterile filtration using microfilters
with small pores which microorganisms cannot pass through the membrane. Some of
the sterile microfiltration applications replace thermal sterilization which may offer a
direct energy saving in the process and indirect saving through avoidance of heat
exchange equipment (Baker et al., 1991).
18
The diversity of applications for UF in pharmaceutical industry includes the
concentration, purification, desalting, fractionation and sterilization of the
pharmaceutical products such as viruses, hormones, vaccines, antibiotics, albumin and
antibodies (Porter, 1990). Membrane processes is suitable for biological products
because it is usually performed at ambient temperature which is suitable for
temperature sensitive solutions to be treated without the constituents being damaged
or chemically altered (Porter, 1990). In ultrafiltration process, the separation is
achieved by concentrating the large molecule present in the feed on one side of the
membrane, while the solvent and microsolutes are depleted as they pass through the
membrane. In some applications, the product is the retentate and the objective is to
concentrate or purify the retained species by passing unwanted contaminant through
the membrane. In other applications, the product is the permeate, and the objective is
to remove unwanted contaminant which are large enough to be retained by the
membrane. However, in a few applications, both retentate and filtrate contain valuable
products.
A major advantage of concentration by UF over evaporation and lyophilization is
that the salts are not concentrated by the process, but freely pass through the
membrane (Crespo and Boddeker, 1994). Thus, the ionic environment for the protein
remains constant. Furthermore, since no latent heat is required in this process, the
energy costs are reduced as compared to the evaporation and lyophilization
processes. Table 2.4 shows the advantages and disadvantages of the thin film
evaporation, lyophilization and membrane processes for protein concentration.
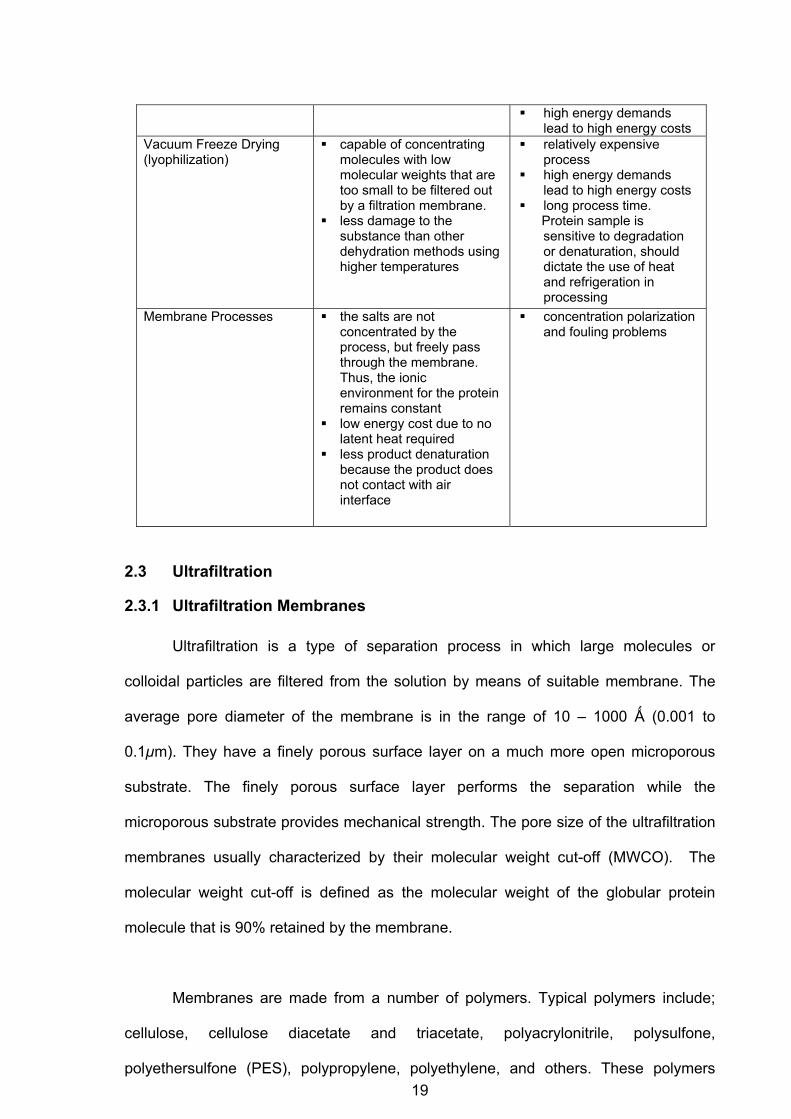
Table 2.4 Advantages and disadvantages of the thin film evaporation, lyophilization and membrane processes for protein concentration
Method Advantage Disadvantage
Thin Film Evaporation
alternative process to concentrate heat-sensitive products
temperature sensitivity lead to protein denaturation
19
high energy demands lead to high energy costs
Vacuum Freeze Drying (lyophilization)
capable of concentrating molecules with low molecular weights that are too small to be filtered out by a filtration membrane.
less damage to the substance than other dehydration methods using higher temperatures
relatively expensive process
high energy demands lead to high energy costs
long process time. Protein sample is
sensitive to degradation or denaturation, should dictate the use of heat and refrigeration in processing
Membrane Processes
the salts are not concentrated by the process, but freely pass through the membrane. Thus, the ionic environment for the protein remains constant
low energy cost due to no latent heat required
less product denaturation because the product does not contact with air interface
concentration polarization and fouling problems
2.3 Ultrafiltration
2.3.1 Ultrafiltration Membranes
Ultrafiltration is a type of separation process in which large molecules or
colloidal particles are filtered from the solution by means of suitable membrane. The
average pore diameter of the membrane is in the range of 10 – 1000 Ǻ (0.001 to
0.1µm). They have a finely porous surface layer on a much more open microporous
substrate. The finely porous surface layer performs the separation while the
microporous substrate provides mechanical strength. The pore size of the ultrafiltration
membranes usually characterized by their molecular weight cut-off (MWCO). The
molecular weight cut-off is defined as the molecular weight of the globular protein
molecule that is 90% retained by the membrane.
Membranes are made from a number of polymers. Typical polymers include;
cellulose, cellulose diacetate and triacetate, polyacrylonitrile, polysulfone,
polyethersulfone (PES), polypropylene, polyethylene, and others. These polymers
20
have shown to provide the basic properties such as mechanical strength and ability to
be cleaned. The selection of suitable membrane materials that exhibit low non-specific
protein adsorption is one of the important criteria in protein separation process.
The chemical composition of the polymer can have a profound effect on the
adsorbtivity of proteins. The property of the membrane material which describes its
interaction with proteins is classified as the relative hydrophobicity. Usually hydrophilic
surface groups such as hydroxyls, sulfonates and amines result in low protein fouling
and hydrophobic such as aromatic or aliphatic hydrocarbons result in significant
hydrophobic adsorption (Rodgers, 1999). However, many hydrophilic groups can
contribute to extensive protein interaction due, possibly, to dipole-dipole or coulombic
interaction especially for polyethersulfone and cellulose acetate (Rodgers, 1999).
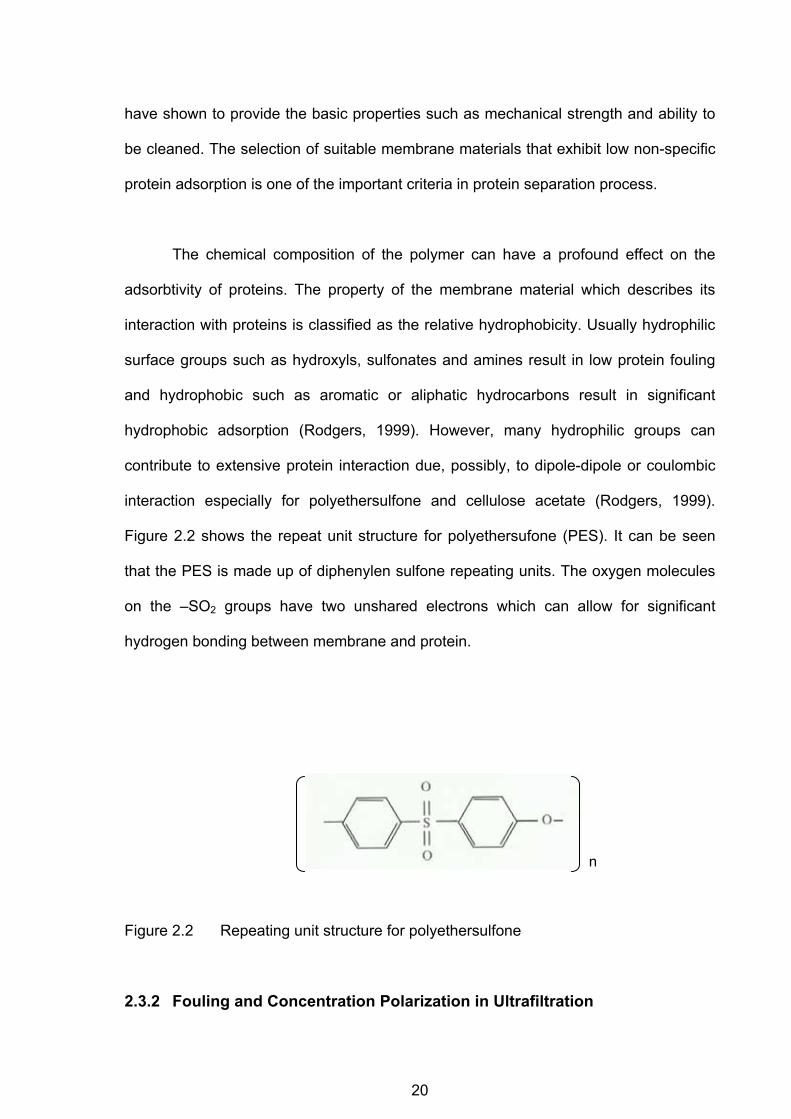
Figure 2.2 shows the repeat unit structure for polyethersufone (PES). It can be seen
that the PES is made up of diphenylen sulfone repeating units. The oxygen molecules
on the –SO2 groups have two unshared electrons which can allow for significant
hydrogen bonding between membrane and protein.
Figure 2.2 Repeating unit structure for polyethersulfone
2.3.2 Fouling and Concentration Polarization in Ultrafiltration
n
21
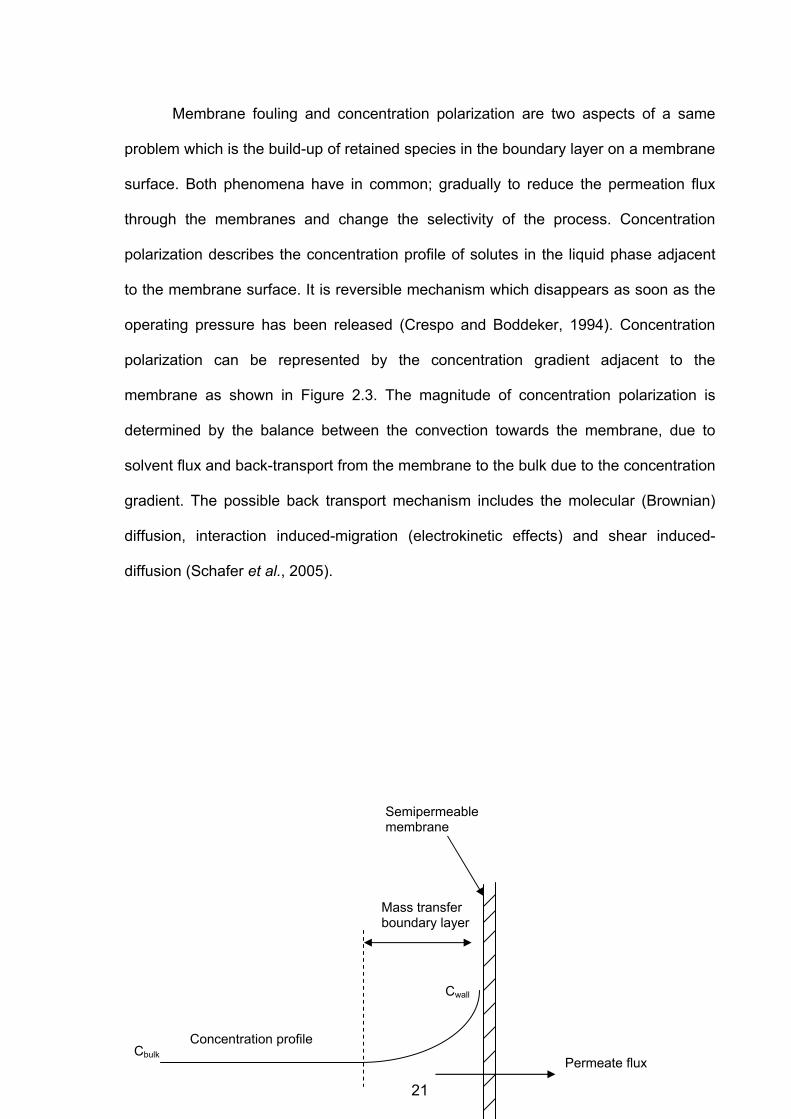
Membrane fouling and concentration polarization are two aspects of a same
problem which is the build-up of retained species in the boundary layer on a membrane
surface. Both phenomena have in common; gradually to reduce the permeation flux
through the membranes and change the selectivity of the process. Concentration
polarization describes the concentration profile of solutes in the liquid phase adjacent
to the membrane surface. It is reversible mechanism which disappears as soon as the
operating pressure has been released (Crespo and Boddeker, 1994). Concentration
polarization can be represented by the concentration gradient adjacent to the
membrane as shown in Figure 2.3. The magnitude of concentration polarization is
determined by the balance between the convection towards the membrane, due to
solvent flux and back-transport from the membrane to the bulk due to the concentration
gradient. The possible back transport mechanism includes the molecular (Brownian)
diffusion, interaction induced-migration (electrokinetic effects) and shear induced-
diffusion (Schafer et al., 2005).
Concentration profile
Permeate flux
Mass transfer boundary layer
Semipermeable membrane
Cbulk
Cwall
22
Figure 2.3 Solute concentration gradient in semipermeable membrane
According to Koros et al. (1996), fouling is defined as a process resulting in loss
of performance of a membrane due to deposition of suspended or dissolved
substances on its external surfaces, at its pore openings, or within its pores. One part
of fouling may be permanent (irreversible), because a mechanical and chemical
cleaning is required to restore the membrane properties. One fraction of fouling may be
non-permanent (reversible) as in some cases, the deposited material is swept away by
the cross flow just after the pressure difference has been released. Fouling can be
subdivided in essentially five mechanisms, each monitored as a build up of global
hydraulic resistance (Rg) (Rooda and van der Graaf, 2001):
• adsorption inside the membrane pores (Ra);
• blocking of the membrane pores (Rb);
• concentration of foulants near the membrane surface, also called
concentration polarisation (Rcp);
• deposition on the membrane surface forming a cake layer (Rc);
• compression of the cake layer (Rcc).
During filtration these mechanisms may occur simultaneously. According to
Oussedik et al. (2000), the global hydraulic resistance, Rg (m-1) through the membrane
may be expressed by the sum of the hydraulic resistance due to protein adsorption
onto the membrane Ra, pore blocking Rb, the concentration polarization Rcp, the cake
layer Rc, and intrinsic membrane Rm. The average pore diameter and the porosity of
the membrane mainly determine the initial resistance of the membrane (Rm). The
global hydraulic resistance, Rg (m-1) is expressed in Equation 2.3 as follow:
Rg = Ra + Rb + Rcp + Rc + Rm (2.3)
23
The relationship between the permeate flux and the global hydraulic resistance of
membrane is shown in Equation 2.4 as follow:
gRPJ
μΔ
= (2.4)
Where J is the permeate flux (m3/m2.s), ∆P is the transmembrane pressure (Pa) and µ
is the dynamic viscosity (Pa.s). The dynamic viscosity of aqueous protein solutions can
be determined by an empirical correlation as shown in Equation 2.5 (Kozinski and
Lightfoot, 1972):
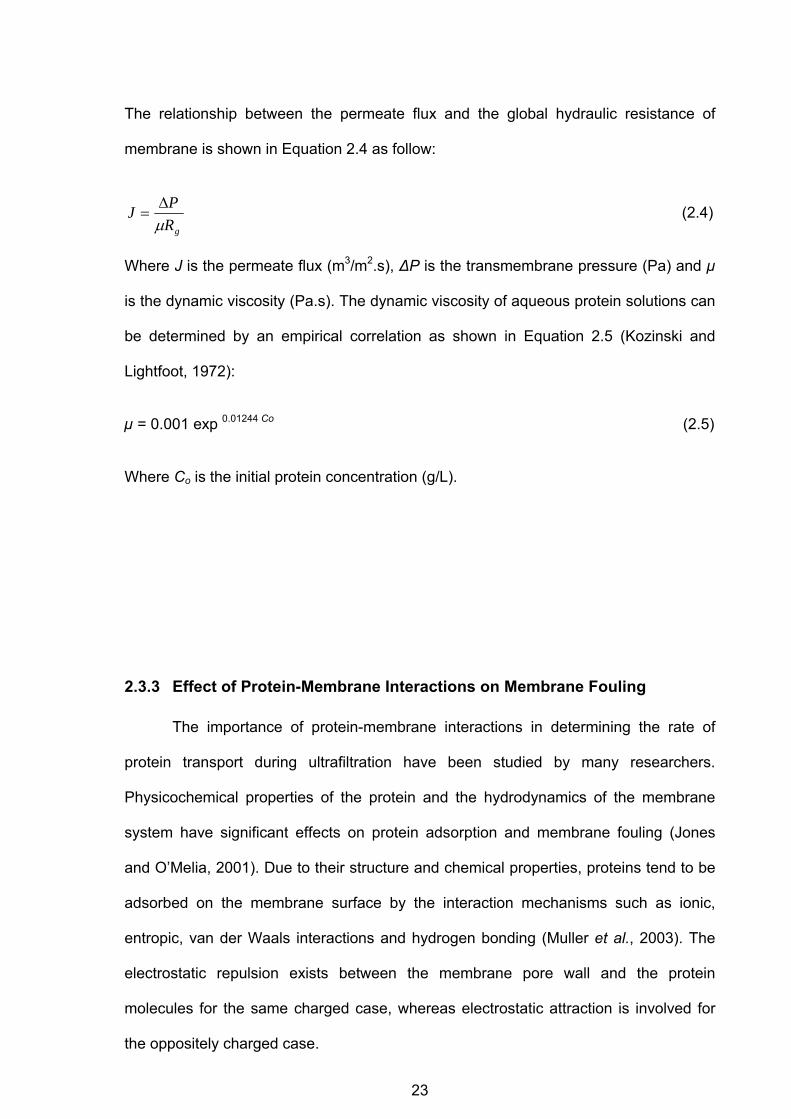
µ = 0.001 exp 0.01244 Co (2.5) Where Co is the initial protein concentration (g/L).
2.3.3 Effect of Protein-Membrane Interactions on Membrane Fouling
The importance of protein-membrane interactions in determining the rate of
protein transport during ultrafiltration have been studied by many researchers.
Physicochemical properties of the protein and the hydrodynamics of the membrane
system have significant effects on protein adsorption and membrane fouling (Jones
and O’Melia, 2001). Due to their structure and chemical properties, proteins tend to be
adsorbed on the membrane surface by the interaction mechanisms such as ionic,
entropic, van der Waals interactions and hydrogen bonding (Muller et al., 2003). The
electrostatic repulsion exists between the membrane pore wall and the protein
molecules for the same charged case, whereas electrostatic attraction is involved for
the oppositely charged case.
24
Many problems with protein fouling in ultrafiltration is directly associated with the
basic properties of proteins and the synthetic membrane’s chemistry (Rodgers, 1999).
The membrane fouling and protein adsorption are strongly dependent on protein-
protein and protein-membrane interactions (Fane et al., 1983). Protein-protein
interactions affect the porosity of the cake layer on the membrane, while protein-
membrane interactions affect irreversible adsorption onto the membrane (Jones and
O’Melia, 2001). The interaction of charged membrane and proteins is strongly affected
by pH and ionic strength of buffer solution. Most of the experimental studies of
electrostatic interactions in membrane systems have been reported by obtaining data
for a single protein over a range of pH or ionic strength (Pujar and Zdyney, 1994; Yang
and Tong, 1997; Burns and Zydney, 1999).
According to Jones and O’Melia (2001), at higher pH values, where the protein
and membrane are negatively charged, the electrostatic repulsion created by protein-
membrane interactions had reduced fouling problem. Similar observation were
reported by Reis et al. (1999) and Nakao et al. (1988) that the protein rejection was
greatest under conditions where the membrane and protein had same charges due to
the strong electrostatic repulsion. It has been reported that the flux decline is more
pronounced at the IEP of the protein (Mukai et al., 1997; Ricq et al., 1999; Ohmori and
Glatz, 1999; Jones and O’Melia, 2001). At the IEP of protein, the protein solubility
tends to be lowest and the repulsive electrostatic interaction between protein
molecules and membrane surface is minimized (Nakamura and Matsumoto, 2006). The
interaction between BSA molecules and pore surface would be repulsive at pH above
the IEP of BSA, negligible at pH of the IEP and attractive in pH range below the IEP
(Nakamura and Matsumoto, 2006).


