Pedro Miguel de Sousa Santos Licenciado em Ciências de Engenharia Mecânica Development of FSW to manufacture tailor welded blanks for lightweight transport applications Dissertação para obtenção do Grau de Mestre em Mestrado Integrado em Engenharia Mecânica Orientador: Professora Doutora Rosa Maria Mendes Miranda, Professora Associada com Agregação, FCT-UNL Co-orientador: Doutor João Pedro Machado da Gandra, Senior Project Leader, TWI, Ltd. Setembro 2016
Transcript
Pedro Miguel de Sousa Santos
Licenciado em Ciências de Engenharia Mecânica
Development of FSW to manufacture tailor
welded blanks for lightweight transport
applications
Dissertação para obtenção do Grau de Mestre em
Mestrado Integrado em Engenharia Mecânica
Orientador: Professora Doutora Rosa Maria Mendes Miranda,
Professora Associada com Agregação, FCT-UNL
Co-orientador: Doutor João Pedro Machado da Gandra,
Senior Project Leader, TWI, Ltd.
Setembro 2016
Pedro Miguel de Sousa Santos
Licenciado em Ciências de Engenharia Mecânica
Development of FSW to manufacture tailor
welded blanks for lightweight transport
applications
Dissertação apresentada à Faculdade de Ciências e Tecnologia
da Universidade Nova de Lisboa para a obtenção do grau de
Mestre em Engenharia Mecânica
Orientador:
Professora Doutora Rosa Maria Mendes Miranda
Co-orientador:
Doutor João Pedro Machado da Gandra
Lisboa
2016
i
Development of FSW to manufacture tailor welded blanks for lightweight transport applications
A Faculdade de Ciências e Tecnologia e a Universidade Nova de Lisboa têm o direito, perpétuo e sem
limites geográficos, de arquivar e publicar esta dissertação através de exemplares impressos
reproduzidos em papel ou de forma digital, ou por qualquer outro meio conhecido ou que venha a ser
inventado, e de a divulgar através de repositórios científicos e de admitir a sua cópia e distribuição
com objetivos educacionais ou de investigação, não comerciais, desde que seja dado crédito ao autor
e editor.
iii
Dedico esta dissertação aos meus pais António e Susana, à minha irmã Margarida,
à minha Carolina e à minha querida Avó Nanda
v
Agradecimentos
Este trabalho conclui um dos mais desafiantes e gratificantes capítulos da minha vida académica até à
data. No entanto, não teria chegado a esta etapa sem a ajuda, apoio e confiança de pessoas
importantíssimas.
Em primeiro lugar, quero expressar a minha profunda gratidão à minha orientadora, Professora Rosa
Miranda, por me ter convidado para integrar um projeto tão interessante que me permitiu trabalhar com
um grupo de profissionais experientes numa instituição de prestígio. Agradeço em especial toda a
paciência, orientação e compromisso.
Ao meu co-orientador, Doutor João Gandra, agradeço os seus ensinamentos fundamentais, pelo seu
entusiasmo e pelo constante apoio e paciência durante o meu estágio no TWI, Ltd. Quero agradecer
também a sua amizade e os seus conselhos preciosos.
Esta tese foi realizada no âmbito de um projeto de investigação intitulado “LightBlank – make it lighter,
with less”. O autor reconhece a importância do financiamento concedido pela organização Innovate UK.
Gostaria de agradecer também ao Doutor Mike Russell por me ter aceitado no TWI, Ltd e por me ter
dado a oportunidade de aprofundar o conhecimento sobre FSW onde o processo foi criado. Agradeço
também a todos os trabalhadores da secção de Friction and Forge Processes por todo o apoio prestado
e por me terem recebido no seu grupo. Em particular, um especial agradecimento ao Chris Glazebrook
e ao Bertrand Flipo pela amizade e pelas conversas, ao Stuart Page pelas lições que me transmitiu, à
Helen Everson por todo o seu apoio e ao Doutor Steve Dodds por me convidar a participar noutros
projetos interessantes que me permitiram contactar com outras tecnologias. Gostaria de agradecer
também aos restantes trabalhadores do TWI, Ltd, com quem tive contacto durante o meu estágio e
pelas suas contribuições importantes para este trabalho e para uma incrível experiência.
É com grande gosto que expresso a minha eterna gratidão a toda a minha família, por me terem ajudado
a chegar onde estou hoje e por todo o apoio e carinho. Um agradecimento especial à minha mãe, ao
meu pai, à minha irmã, aos meus avós e aos meus tios que conseguiram arranjar tempo para me visitar
enquanto estive fora, à minha prima Mariana pelos bons tempos passados em Londres e à Amélia por,
agora mais do que nunca, ser um pilar para a família e pelo seu carinho desde a minha infância.
À minha namorada Carolina Ribeiro, quero agradecer-lhe pelo constante apoio, dedicação e amor ao
longo dos anos. Obrigado por sempre acreditares em mim, por fazeres de mim uma pessoa melhor e
mais feliz e por todos os bons momentos que vivemos e que estão para vir.
Aos meus melhores amigos, João Costa e Rita Valentim e aos amigos que fui fazendo ao longo dos
anos, agradeço a amizade, apoio e todos os momentos marcantes que partilhámos.
Quero agradecer à Ana Simões, pela grande amizade, pelo apoio prestado nas alturas mais difíceis do
curso e da vida e por todos os momentos divertidos qua passamos ao longo dos anos. Agradeço
também à sua família pela sua hospitalidade. Sem dúvida uma amiga para a vida.
Aos meus colegas e futuros mestres, agradeço por todo o apoio e pela amizade sempre dedicada.
Em memória e com homenagem à minha avó, Fernanda Gabriel Marques Duarte dos Santos, um
verdadeiro exemplo de vida, que sempre acreditou em mim e para quem estarei eternamente grato por
todo o amor, carinho e empenho que ela me dedicou ao longo da sua vida.
vii
Acknowledgements
This work concludes one of the most challenging and rewarding chapters in my academic life so far. However, I couldn’t have achieved this stage without the help, support and faith from crucial people.
First and foremost, I would like to express my deepest gratitude to my supervisor, Professor Rosa Miranda, for inviting me to join such an interesting project which gave me the opportunity to work with a group of experienced professionals in a remarkable institution. A special thanks for all the patience, guidance and commitment.
To my co-supervisor, Dr. João Gandra, to who I am thankful for his cornerstone teachings, for his enthusiasm and constant support and patience during my time at TWI, Ltd. I would also like to thank for his friendship and valuable advices.
This thesis was conducted in the framework of a research project entitled “LightBlank – make it lighter, with less”. The author acknowledges the importance of the granted funding by Innovate UK organisation.
I would also like to thank Dr. Mike Russell for accepting me at TWI, Ltd and for giving me the opportunity to get a better understanding about FSW where it all began. I sincerely acknowledge all the staff members of the Friction and Forge Processes section for their support and for welcoming me into their group. In particular, a special thanks to Chris Glazebrook and Bertrand Flipo for their close friendship and pep talks, Stuart Page for his teachings, Helen Everson for her support and Dr. Steve Dodds for inviting me to participate in other interesting projects that exposed me to different technologies. I would also like to thank all TWI, Ltd staff members, with whom I had contact during my internship and for their significant contributions for this work and for an incredible experience.
It is with great deal of appreciation that I express my indebtedness to my family, for helping me to arrive where I am today and for all their support and affection. Honest thanks to my mother, father, sister, grandparents and uncles for finding the time to visit me abroad, to my cousin Mariana for the good times spent in London and to Amélia for being a pillar for the family now more than ever and her affection since my early years.
To my girlfriend Carolina Ribeiro, I would like to express my sincere gratitude for her constant support, dedication and love throughout the years. Thank you for always believing in me, for making me a better and happier person and for the good times we had and that are yet to come.
A special thanks goes to my best friends João Costa and Rita Valentim and to the friends I’ve made throughout the years for their friendship, support and the remarkable moments we have shared.
I would like to thank Ana Simões, for her close friendship, for her support in the hard times throughout the course and in life and for all the good times. Also to her family, for their hospitality. Without any doubt a friend for life.
To my classmates and future MSc, I wish to thank you all for your support and friendship.
In loving memory of my grandmother - Fernanda Gabriel Marques Duarte dos Santos, a true life example, who always believed in me and to who I will be forever grateful for all the love, care and dedication she gave me throughout my life.
ix
Sumário
A redução do peso dos veículos constitui uma das soluções mais eficazes para a redução do consumo
de energia e das emissões de CO2 no sector dos transportes. Com os recentes avanços nas novas
tecnologias de fabrico, a produção de Tailor welded blanks (TWBs) em ligas de baixa densidade como
o alumínio tornou-se uma solução viável e económica.
O presente trabalho de investigação foi realizado no âmbito do projeto “LightBlank – make it lighter,
with less”, em curso no The Welding Institute (TWI), que tem como objetivo o desenvolvimento do
processo de soldadura por fricção linear (SFL) para a produção de TWBs em alumínio AA 6082-T6 de
espessuras dissimilares para a indústria automóvel, ferroviária e aeroespacial. Foram estudadas duas
combinações de espessuras: 3 com 5 mm e 2 com 2,5 mm.
Numa primeira fase, foram realizadas diversas soldaduras com combinações distintas de parâmetros
operatórios com o objetivo de identificar a janela de parâmetros mais adequada para cada ligação
dissimilar. Utilizando técnicas de análise metalográfica e ensaios mecânicos, foi possível caracterizar
a influência dos vários parâmetros nos cordões produzidos definindo assim a gama de parâmetros
operatórios que produziam cordões com maior resistência e velocidades de avanço maiores.
Para a combinação de espessuras de 3 com 5 mm, foi avaliada a influência na qualidade da soldadura
quando existe variação no alinhamento da ferramenta com a linha de soldadura e quando se coloca a
chapa mais espessa no lado em avanço, i.e. quando se altera a posição das chapas relativamente à
direção de avanço;
Os resultados obtidos demonstraram que para cada combinação de espessuras, existe um envelope
de parâmetros operatórios que permite a produção de soldaduras de qualidade retendo entre 65 e 85%
da resistência mecânica do material base.
xi
Abstract
Vehicle light-weighting has been identified as the most effective way of addressing the reduction of
energy consumption and CO2 emissions in the transportation industry. With recent advances in
manufacturing technologies, the production of tailor welded blanks (TWBs) from lightweight metal alloy
such as aluminium has become a viable and low cost solution.
The present research work was conducted in the framework of the ongoing project “LightBlank – make
it lighter, with less”, at The Welding Institute (TWI) aiming at the development of the friction stir welding
(FSW) process for the production of TWBs in aluminium AA 6082-T6 with dissimilar thickness for the
automotive, rail and aerospace industries. Two thickness combinations were addressed: 3 to 5 mm and
2 to 2.5 mm.
At first stage, multiple weld beads with different welding parameter combinations were produced in order
to determine the process window for each dissimilar joint. Using metallographic analysis techniques and
mechanical testing, the influence of the parameter combinations on the welded joints was characterized
which allowed to determine the parameter combination that produced the weld beads with the best
quality while maximizing the welding speed.
On the 3 to 5 mm thickness combination, extra tests were conducted to determine the influence in the
quality of the weld of a horizontal offset in the alignment of the tool with the joint line and the thicker
plate in the advancing side, i.e, a change in the plate positioning in relation to the welding direction.
The results have shown that for each thickness combination, there is a process parameter window which
allows the production welds with a suitable quality while retaining between 65 to 80 % of the base
Acknowledgements ................................................................................................................................... vii
Sumário ................................................................................................................................................... ix
Abstract.................................................................................................................................................... xi
Palavras-chave ...................................................................................................................................... xiii
Keywords ............................................................................................................................................... xiii
List of Contents ....................................................................................................................................... xv
List of Figures ....................................................................................................................................... xvii
List of Tables ......................................................................................................................................... xix
Abbreviations ......................................................................................................................................... xxi
Symbols ................................................................................................................................................. xxi
Figure 2.1 - Tailored Blanks schematic chart .......................................................................................... 5 Figure 2.2 - Automotive applications for TWBs [1] .................................................................................. 7 Figure 2.3 - Comparison between the conventional process and TWBs process for the production of
formed components ................................................................................................................................. 8 Figure 2.4 - Schematic representation FSW process phases. [22] ....................................................... 13 Figure 2.5 - Typical macrograph of a FSW joint [25]. ............................................................................ 14 Figure 2.6 - (a) Fixed pin, (b) Adjustable pin and (c) Bobbin tool types [32] ......................................... 17 Figure 2.7 - Shouder shapes and features [32] ..................................................................................... 18 Figure 2.8 - FSW tool pins [32] .............................................................................................................. 19 Figure 2.9 - (a) worlTM and (b) MX triflutetm tool [32].............................................................................. 20 Figure 2.10 - FSW deffects: A) Void; B) Joint line remnant; C) Root flaw; D) Surface grove; E) Excessive
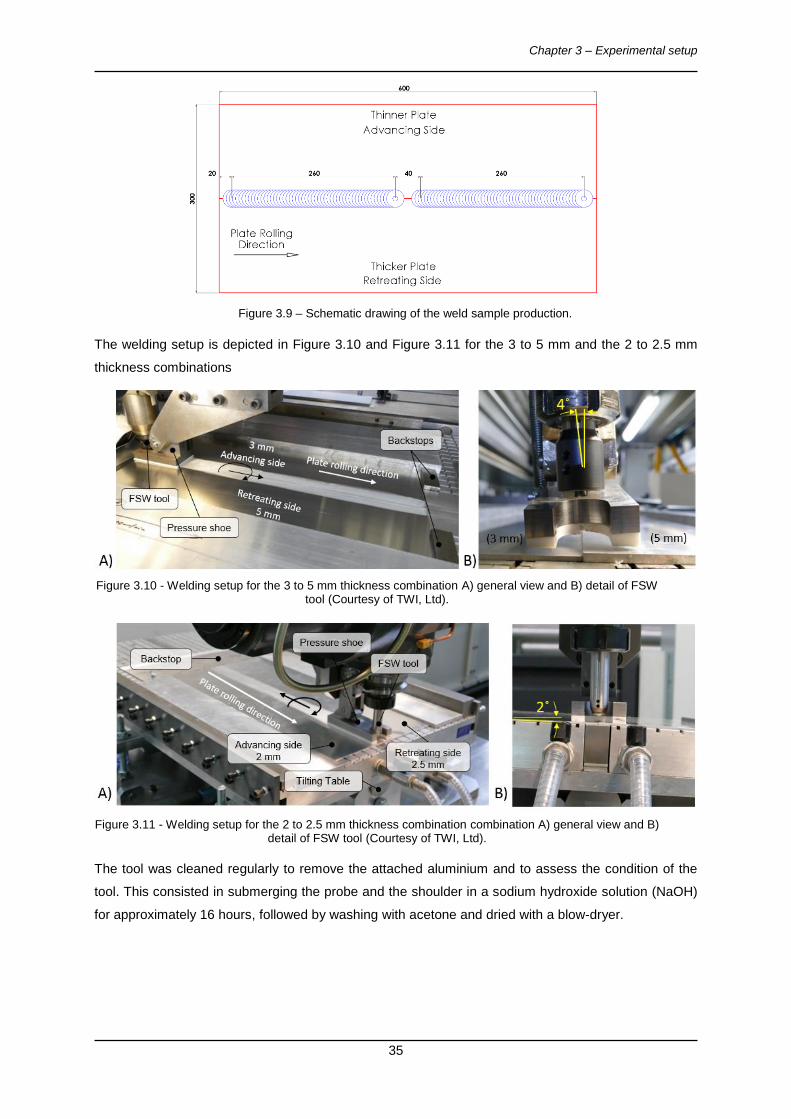
flash ....................................................................................................................................................... 22 Figure 3.1 - FW-28 ESAB SuperStirTM Friction Stir Welding machine. ................................................. 28 Figure 3.2 - FW-36 AWEA LP 4025Z Friction Stir Welding machine. ................................................... 29 Figure 3.3 - FSW Tools used for the 3 to 5 mm thickness combination. .............................................. 30 Figure 3.4 - FSW Tools used for the 2 to 2.5 mm thickness combination . .......................................... 30 Figure 3.5 - Fixturing system (Courtesy of TWI,Ltd). ............................................................................ 31 Figure 3.6 - Tilting system used on the FW-28 ESAB SuperStirTM . ..................................................... 32 Figure 3.7 - Tilting system developed for the FW-36 AWEA LP 4025Z . .............................................. 32 Figure 3.8 - Stages of the pre-weld procedure: ..................................................................................... 33 Figure 3.9 - Schematic drawing of the weld sample production............................................................ 35 Figure 3.10 - Welding setup for the 3 to 5 mm thickness combination. ................................................ 35 Figure 3.11 - Welding setup for the 2 to 2.5 mm thickness combination. ............................................. 35 Figure 3.12 - Sample extraction plan. ................................................................................................... 36 Figure 3.13 - Schematic drawing of the microhardness indentation lines for the 3 to 5 mm . .............. 37 Figure 3.14 - Schematic drawing of the microhardness indentation lines for the 2 to 2.5 mm . ........... 37 Figure 3.15 - Schematic drawing of a wrap-around guided bend test machine [Site TWI] ................... 38 Figure 4.1 - Base material macrograph perpendicular to the rolling direction: A) 5 mm and B) 3 mm. 43 Figure 4.2 - Cross section macrograph of sample W5 (𝑣 = 600 mm/min; 𝜔 = 1000 rev/min) with detailed
mapping regions . .................................................................................................................................. 47 Figure 4.12 - EBSD mapping from region A .......................................................................................... 48
xviii
Figure 4.13 - EBSD mapping from region B .......................................................................................... 48 Figure 4.14 - EBSD mapping from region C with respective IPF relative to the surface normal .......... 49 Figure 4.15 - Grain size and intergranular misorientation from posicion A. .......................................... 50 Figure 4.16 - Grain size and intergranular misorientation from posicion B. .......................................... 50 Figure 4.17 - Grain size and intergranular misorientation from posicion B. .......................................... 50 Figure 4.18 - Hardness profile of sample W5 (𝑣 = 600 mm/min; 𝜔 = 1000 rev/min). ........................... 51 Figure 4.19 - Hardness profile of sample W7 (𝑣 = 480 mm/min; 𝜔 = 800 rev/min). ............................. 51 Figure 4.20 - Hardness profile of sample W8 (𝑣 = 640 mm/min; 𝜔 = 800 rev/min). ............................. 51 Figure 4.21 - Hardness profile of sample W11 (𝑣 = 720 mm/min; 𝜔 = 1200 rev/min). ......................... 52 Figure 4.22 - Hardness profile of sample W14 (𝑣 = 700 mm/min; 𝜔 = 1000 rev/min). ......................... 52 Figure 4.23 - Hardness profile of sample W15 (𝑣 = 560 mm/min; 𝜔 = 800 rev/min). ........................... 52 Figure 4.24 - Hardness profile of sample W17 (𝑣 = 500 mm/min; 𝜔 = 1000 rev/min). ......................... 53 Figure 4.25 - Hardness profile of sample W18 (𝑣 = 600 mm/min; 𝜔 = 1200 rev/min). ......................... 53 Figure 4.26 - Hardness profile of sample W19 (𝑣 = 400 mm/min; 𝜔 = 800 rev/min). ........................... 53 Figure 4.27 - A) Fracture surface of sample W14 (𝑣 = 700 mm/min; 𝜔 = 1000 rev/min) and B)
magnification. ........................................................................................................................................ 57 Figure 4.28 - Full welded panel for X-Ray inspection .......................................................................... 58 Figure 4.29 - Radiograph of the beginning of the weld bead . .............................................................. 58 Figure 4.30 - Radiograph of the end of the weld bead . ........................................................................ 58 Figure 4.31 - Base material macrograph perpendicular to the rolling direction: A) 2.5 mm and B) 2 mm.
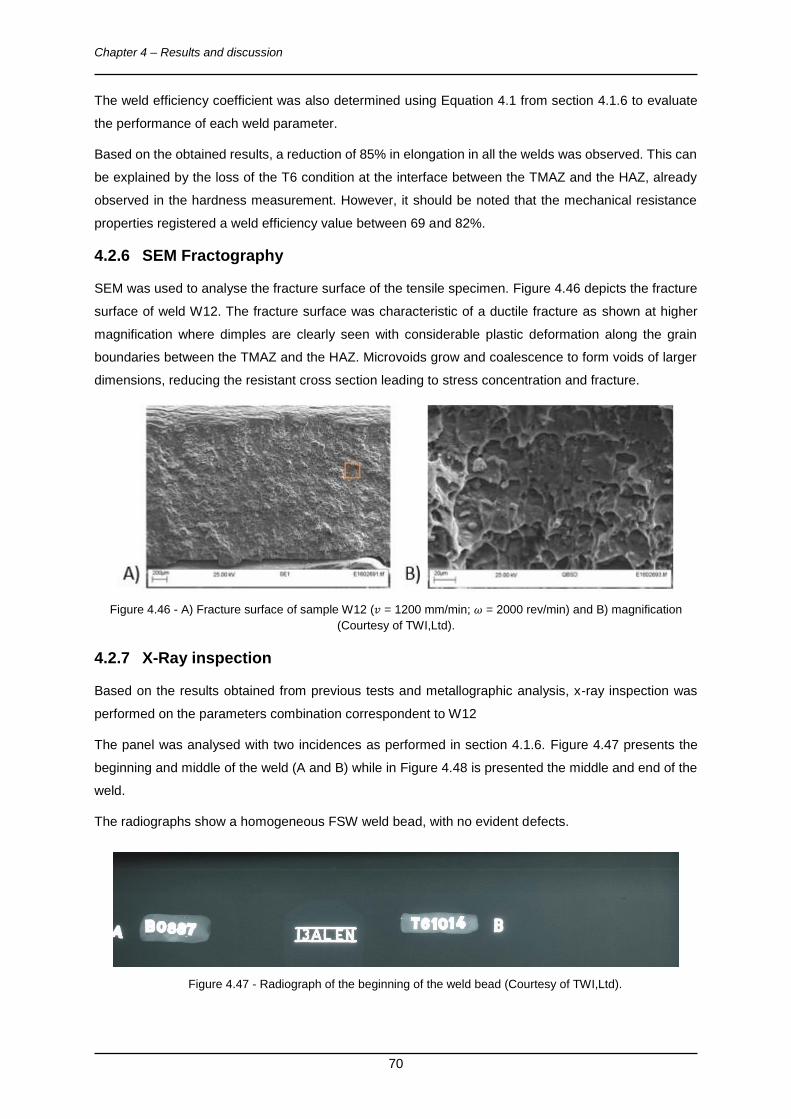
............................................................................................................................................................... 61 Figure 4.32 - Cross section macrograph of sample W12 (𝑣 = 1200 mm/min; 𝜔 = 2000 rev/min) with
magnification. ........................................................................................................................................ 70 Figure 4.47 - Radiograph of the beginning of the weld bead. ............................................................... 70 Figure 4.48 - Radiograph of the end of the weld bead. ......................................................................... 71 Figure 4.49 - Cross section macrographs of the welds with different alignments. ................................ 72 Figure 4.50 - Surface of the weld bead. ................................................................................................ 73 Figure 4.51 - Weld data from W14 (𝑣 = 700 mm/min; 𝜔 = 1000 rev/min) A) during parameter optimization
and B) during the inverted setup study .................................................................................................. 74 Figure 4.52 - Cross section macrograph of the weld bead produced during the inverted setup study . 75
xix
List of Tables
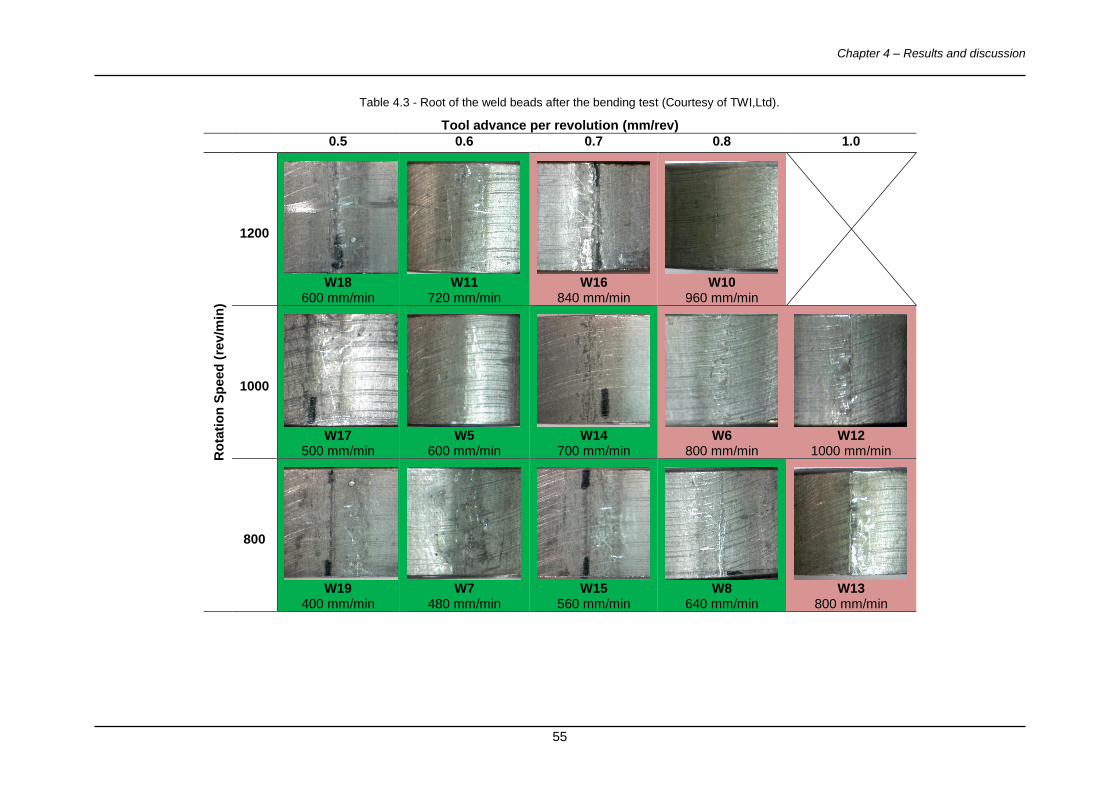
Table 2.1 - Key benefits of FSW [21, 23]. ............................................................................................. 13 Table 2.2 - FSW tools designed by TWI for butt joint [32] ..................................................................... 20 Table 2.3 - FSW tools designed by TWI for lap joint [32] ...................................................................... 20 Table 2.4 - FSW tool materials [35] ....................................................................................................... 21 Table 2.5 - Fuel and CO2 emissions saving by using FS-TWBs ........................................................... 25 Table 3.1 – Chemical composition of the base material. ...................................................................... 27 Table 3.2 – Mechanical properties of the base material. ...................................................................... 27 Table 3.3 – Base material hardness measurement for different sections. ............................................ 27 Table 3.4 – FSW Tool geometries for the adressed thickness combinations. ...................................... 30 Table 3.5 – Weld parameter matrix for the 3 to 5 mm thickness combination. ..................................... 34 Table 3.6 – Weld parameter matrix for the 2 to 2.5 mm thickness combination. .................................. 34 Table 3.7 – Constant welding parameters for the adressed thickness combinations. .......................... 34 Table 4.1 - Weld parameter matrix with weld designation. ................................................................... 41 Table 4.2 - Surface of the experimented weld beads (Courtesy of TWI,Ltd). ....................................... 42 Table 4.3 - Root of the weld beads after the bending test (Courtesy of TWI,Ltd). ................................ 55 Table 4.4 - Tensile test results (Courtesy of TWI,Ltd). .......................................................................... 56 Table 4.5 - Fractured tensile specimens (Courtesy of TWI,Ltd)............................................................ 56 Table 4.6 - Weld parameter matrix with weld designation. ................................................................... 59 Table 4.7 - Surface of the experimented weld beads (Courtesy of TWI,Ltd). ....................................... 60 Table 4.8 - Root of the weld beads after the bending test (Courtesy of TWI,Ltd). ................................ 68 Table 4.9 - Tensile test results (Courtesy of TWI,Ltd). .......................................................................... 69 Table 4.10 - Fractured tensile specimens (Courtesy of TWI,Ltd).......................................................... 69 Table 4.11 - Offset study parameters and alignments. ......................................................................... 71 Table 5.1 - FSW optimized parameters for each thickness combination. ............................................. 77
xxi
Abbreviations
AA - Aluminium alloy
APR - Tool advance per revolutions
AS - Advancing side
BIW - Body in white
BM - Base Material
CCW - Counterclockwise
CW - Clockwise
EBSD - Electron backscatter diffraction
FSW - Friction stir welding
HAZ - Heat affected zone
HFQ - Hot form quench
IPF - Inverse Pole Figure
IQI - Image quality indicator
MIG - Metal inert gas
RD - Rolling direction
RS - Retreating side
TEM - Transmission electron microscopy
TIG - Tungsten inert gas
TMAZ - Thermomechanically affected zone
TWBs - Tailor welded blanks
TWI - The welding institute
YAG - Yttrium aluminium garnet
Symbols
rev/min - Revolutions per minute
𝐹𝑟 - Tool feed per revolution [mm/rev]
𝑣 - Welding speed [mm/min]
𝜔 - Rotation speed [rev/min]
σ 0.2% - Yield tensile strength
σ UTS - Ultimate tensile Strength
N - Unit of force [Newton]
Chapter 1 – Introduction
1
Chapter 1 - Introduction
1.1 Motivation
Climate changes as a result of human activity might be the most important challenge for society in the
twenty-first century. These environmental concerns have forced governments to impose regulations to
try to revert the trend. In 2009, a new EU regulation on CO2 emission was issued which committed
European car manufacturers to cut the average CO2 emissions for new cars from 130 in 2015 to 95
g/km by 2020. This compelled the automotive manufacturers to research and develop new technologies
to reduce fuel consumption and CO2 emissions to meet new regulations while delivering improved fuel
economy for their customers. Vehicle light-weighting has been identified as one of the most effective
ways to address this challenge.
Tailor welded blanks (TWBs) are semi-finished parts typically produced by joining sheets with different
thicknesses that are subjected to forming processes like drawing or stamping. TWBs can also be
produced by joining dissimilar alloys or materials with different properties and surface coatings. Its use
in the automotive industry in the last decade has increased significantly as a method of minimizing part
weight without compromising the vehicle’s structural integrity and crashworthiness and also improving
its performance and functionality. Amongst the main advantages of using TWBs, manufacturers are
interested in the reduction of vehicle weight and gross raw material costs as well as the ability to tailor
the component to meet the functional requirements more efficiently. The use of structural aluminium
alloys for the production of TWBs is a good alternative to the conventional high strength steel alloys due
to higher strength to density ratio of aluminium and good corrosion resistance, increasing weight savings
per part.
Fusion welding of aluminium alloys can involve numerous challenges in some applications. Hot cracking,
porosity, loss of alloying elements, grain boundary melting in the HAZ and thermal distortions are some
of the main problems that make conventional fusion welding processes of aluminium an unattractive
solution. The inherent properties of aluminium like low melting temperature, surface oxide formation,
high reflectivity, high thermal conductivity and low surface tension when in a molten state also contribute
to other flaws. Laser welding has been developed as a potential solution but the cost of implementing
the technology often limits its application and does not solve the problems mentioned.
Friction stir welding (FSW), invented by Wayne Thomas at TWI in December 1991, is a solid state
process which produces high integrity joints in difficult to weld materials such as aluminium. Since its
invention and due to the intensive research on the process, it is fast becoming the technique of choice
for manufacturing lightweight boats, trains and aeroplanes.
Chapter 1 – Introduction
2
1.2 Objectives
The present thesis was developed within the framework of a 3 year project called “LightBlank – Make It
Lighter with Less” funded by the Innovate UK funding body. The aim of this project is to develop and
fully implement the manufacturing route for the next generation of lighter aluminium alloy sheet metal
panels by combining FSW with a novel forming technology called Heat treatment Forming and in-die
Quenching (HFQ). The “LightBlank” project envisages the development of the HFQ/FSW manufacturing
route mainly with a focus on the auto, rail and aerospace applications.
Within this broad topic, the present thesis focused on developing a FSW procedure to join TWBs made
from: AA 6082-T6, combining sheets with a thickness of 2 to 2.5 mm and 3 to 5 mm. The main objectives
of this study were:
1. To design and test FSW tools for the two case studies under consideration.
2. To design and manufacture panel fixturing systems that allow to demonstrate various approaches
and thicknesses.
3. To investigate the effect of process parameters on joint quality through metallographic analysis
and mechanical testing.
4. To determine the set of parameters for each addressed thickness combination that produced the
joint with the best mechanical properties.
Due to timeline constraints inherent to an MSc thesis, the present work focused only on the development
of FSW technology for the production of the aluminium TWBs. The subsequent forming developments
are outside of the scope of the present thesis and will be addressed as future work.
Chapter 1 – Introduction
3
1.3 Structure
The present thesis was structured as follows:
Chapter 2 provides an overview of the state of the art, summarizing the most relevant findings and
breakthroughs reported in literature as far as FSW is concerned. This chapter aims to establish both a
theoretical basis and a framework for result analysis and discussion throughout the present thesis.
Chapter 3 depicts the experimental methodology and characterization techniques adopted. A brief
description of the base materials is included, as well as, the characterization of the welding equipment,
tool design and clamping system developed. The tested range of process parameters is presented.
Finally, the techniques used to perform metallographic analysis and mechanical testing are described.
Chapter 4 reports discusses the results achieved. This chapter was divided into two main sections,
addressing the results obtained for each thickness combination separately.
Main conclusions are presented in Chapter 5.
Chapter 6 presents proposals for future work developments.
Chapter 2 – Literature review
5
Chapter 2 - Literature review
2.1 Tailor welded blanks
Tailored blanks are a collective of semi-finished sheet products that are optimized for the forming
process or the final application [1]. Based on their manufacturing process, tailored blanks are divided
into four subgroups as shown in Figure 2.1.
Figure 2.1 - Tailored Blanks schematic chart
Patchwork blanks works by reinforcing the main sheet by adding one or more blanks called “patch”. The
patch is joined to the main blank prior to forming in an overlap configuration, using welding processes
such as resistance spot welding and laser welding. The main disadvantage for this solution is associated
with the high stress concentration on the weld joints, during subsequent forming operations and in
service [1].
Tailor rolled blanks are produced by adjusting the rolling gap during the rolling process. This allows to
create a continuous transition between the thickness changes. The thickness transition can be
performed along the longitudinal direction by adjusting the gap between the rollers and along the
latitudinal direction by using thin discs to gradually reduce the thickness. Main advantages include better
surface quality and a wide range of possible thickness transitions [1].
The aim of tailored heat treated blanks is to improve the formability of the material by altering the
properties of the material locally along the sheet plane. This is an important topic nowadays since current
product designs rely on high drawing depths, sharp edges and small forming radii [1].
Chapter 2 – Literature review
6
Tailor welded blanks (TWBs) are semi-finished parts that consist of at least two single sheets which are
characterized by different thicknesses, materials, coatings or material properties. These sheets are
welded together prior to the forming process that brings the assembly to its final structural shape. Tailor
made blanks use the same principle as TWBs but uses other joining methods than welding, e.g.
adhesive bonding [1, 2]. This manufacturing solution allows engineers to make optimal use of the
different mechanical properties of the blank material by applying the suitable material at the location
where it is necessary and to develop more efficient component designs that reduce the weight of the
component and the raw material used for production [3, 4]. In industry sectors where weight saving is a
priority, such as automotive, rail and aerospace manufacturers, this solution has been adopted to reduce
the vehicle kerb weight, reducing its energy consumption without compromising its performance or
crashworthiness [5].
The concept of TWBs was patented in the USA in 1968 by the Budd Company, an automotive parts
manufacturer. In Europe, the first automotive application for TWBs was introduced by the Swedish
automotive manufacturer Volvo in 1979. TWBs were produced by resistance mash seam welding and
later by induction butt-welding process to enhance the design possibilities and the efficiency of
production [6]. In 1983, Thyssen Stahl partnered with Audi to produce an oversized galvanized floor
panels for the Audi 100 using laser welding. The first Japanese car manufacturer to use TWBs
technology in their designs was Toyota to produce sunroof pressings using laser welding in 1986. In the
USA, General motors was an early user and in 1993 acquired a line for producing four- and five piece
body sides. Since then, the use of TWBs in the automotive sector has increased significantly as a
solution to satisfy the demand for more efficient vehicles. In 1998, TWI started a study on aluminium
tailored welded blanks for door panels and demonstrated new concepts for FSW drive shafts and space
frames for BMW, Chrysler, EWI, Ford, General Motors Rover, Tower automotive and Volvo [7]. In 2000
the European market exceeded 50 million TWBs produced followed by the USA and Japanese market
with a production of 30 million TWBs [8]. Current production rates worldwide are estimated to be
between 200 and 250 million laser welded blanks per year [5].
2.1.1 Applications
Figure 2.2 shows several typical components where TWBs technology has been used in an automobile.
In the automotive industry, TWBs are mainly applied for the body in white (BIW) structures. The BIW
consists of the various components of the car body joined together, prior the assembly of moving parts
(e.g. doors) the motor, chassis sub-assemblies or trim (e.g. seats, electronics) have been added. The
BIW comprises up to 70% of the overall car weight, so using TWBs in this area has a significant effect
on the vehicle kerb weight [9]. It should be noted that, although only automotive applications are
demonstrated in this picture, other industries such as aerospace and rail incorporate TWBs in to their
designs. In the Airbus A318 and A380 the lower fuselage skin panels are joined with the stringers using
laser welding [10].
Chapter 2 – Literature review
7
Figure 2.2 - Automotive applications for TWBs [1].
2.1.2 Production processes:
TWBs production comprises of three major stages:
Blanking - In this stage, coiled sheet material is de-coiled, straightened and cut into shapes
suited for forming. This equipment can be integrated in the forming equipment into a continuous
process line.
Welding - The blanks are joined together using a fusion or friction welding process.
Forming - The joined blanks are then formed to the final configuration of the part.
The fundamental difference between the conventional process and the TWBs process for the production
of automotive structural elements is that components are joined prior to forming, as described
previously. This allows the reduction of the number of forming dies and forming operations, which leads
to a reduction of costs in die maintenance and storage [5, 11]. Also the welding process induces some
thermal distortions, leading to dimensional inaccuracies and mismatch in the final part geometry.
Figure 2.3 shows a schematic chart of the conventional and TWBs production process of structural
members.
Chapter 2 – Literature review
8
Figure 2.3 - Comparison between the conventional process and TWBs process for the production of formed
components [5].
2.1.3 Strengths and weaknesses of TWBs technology
The main advantage of using TWBs technology is the reduction of the component weight which will lead
to a reduction in the final assembly, in this case the vehicle. This is achieved by allocating the correct
amount of material where it is required, eliminating the need to over design and reinforce the component.
The Ultralight Steel Auto Body (ULSAB) was the first lightweight steel body project from 1994 to 1998
with the purpose of reducing the weight of midsized four-door sedans using new manufacturing methods
such as TWBs among others. A weight reduction of 25% compared with the benchmark cars was
achieved [12]. A significant cost saving by reducing the manufacturing costs and improve raw material
usage is also one of the advantages of TWBs technology, as mentioned in the previous section [5].
Improved crashworthiness and part stiffness can be obtained. By allocating the right amount of material
where is required, engineers can design each component to meet the required loading and resistance
standards without overdesigning the component. As was described in the previous section, the
dimensional accuracy and consistency is improved by welding the blanks together prior to the forming
stage [5].
As part of every solution there are trade-offs with several obstacles to overcome when implementing
TWBs.
The major disadvantage of joining multiple blanks is the decrease in formability of the joined blanks.
This phenomenon has been reported by other authors and is common in aluminium heat-treatable alloys
[5, 11, 13]. The decrease in formability in fusion welding processes is attributed to the vaporization of
the strengthening elements from the HAZ, overaging due to weld heat and solidification cracking.
Another concern of TWBs technology is the weld line movement. This phenomenon happens in the
Chapter 2 – Literature review
9
forming stage if the strain direction is transverse to the weld line, concentrating the material deformation
in the thinner/weaker material. This causes premature failure due to excessive strain and potential
elongation reductions in the HAZ. Weld line movement also limits the possibilities for the automotive
designer to position the material properties in the stamping where desired [5].
2.1.4 Joining processes
The structural integrity of the tailor welded blank is entirely dependent on the integrity of the joint between
the two materials. Nowadays, laser and electron beam welding are the most frequently used fusion
welding process for production of TWBs due to high welding speeds and small HAZ which contribute
for a smaller impact on the material properties. Due to the increasing demand for joining materials that
are not easily welded by fusion processes, FSW has become an attractive solution and one of the most
used processes for the production of TWBs. However other processes such as tungsten inert gas (TIG),
metal inert gas (MIG), resistance spot and mash seam welding have also been used for joining TWBs
[13]. Historically, European automakers seem to prefer solid state welding while the Japanese and
United States automakers use laser welding more frequently [5].
Mash seam welding was one of the first methods used for the production of TWBs, as described
previously, which is gradually becoming obsolete in the automotive industry due to the high productivity
and microstructural qualities of other processes. However, the joints from this process are made at lower
temperatures compared to laser which provides better formability to the blanks. Resistance spot welding
is widely applied in automotive industry and is a process with high productivity. This process is suitable
for joining automotive structural members and for production of TWBs by conventional production
methods as described in Figure 2.3 since it produces a non-continuous joint. However this is not a
suitable joint for subsequent forming and is a prone site for corrosion due to the coating removal during
weld. Arc welding processes, such as TIG and MIG, are quite popular in industry for being flexible
processes, readily available, easily adaptable to robotic automation and the production of low cost
welds. Yet this process is prone to catastrophically defects such as porosity, lack of fusion, undercutting
and material inclusions in the weld bead. [5, 14].
In laser welding, a laser beam is focused and irradiated on the specimen to generate heat. This fusion
welding process features keyhole penetration which delivers highly concentrated energy within a
restricted processing zone, resulting in rapid solidification of the weld metal and producing a high
welding quality-productivity combination. Due to high welding speeds, less heat is released to the base
material resulting in improved mechanical properties. CO2 laser has the highest power and is most
commonly used. YAG laser is also very popular for welding aluminium since the lower frequency
reduces energy loss by light reflection from the workpiece. Diode laser is a high power laser that has
received rapid development in recent years but due to less energy concentration, more heat will disperse
into the base material. Laser welding has been the most frequently used process for producing TWBs
due to the lower cost and greater flexibility compared to electron beam welding. However, laser welding
has some drawbacks such as the formation of intermetallic compounds as a result of high heat input
Chapter 2 – Literature review
10
which affects the formability of the TWBs. Common defects from fusion joining processes such as hot
cracking, porosity and grain boundary melting in the HAZ also arise from laser welding. [5, 14-16].
FSW is a solid state joining process that will be addressed later in this thesis.
2.1.5 Lightweight materials to produce TWBs:
In any product, the greatest weight reduction is achieved by a decrease in density of the used materials.
That said, the use of lightweight materials in the transport industry has increased due to government
regulations, consumer demand and environmental concerns. The term Lightweight materials has
traditionally been given to both aluminium and magnesium since they are frequently used to reduce the
weight of component and structures. Titanium and beryllium are also lightweight materials but its use is
limited to specific applications such as aerospace. These metals have a considerably lower density
compared to steel, which is still the predominantly used metal for the production of automotive body
parts and structural members [17, 18].
Besides the lower density, aluminium has interesting properties for the transport industry such as
superior corrosion resistance due to the presence of surface oxides (Al2O3), natural and chemical
inertness, flexibility both in design and machining, high fracture toughness and energy absorption
capacity. In addition to these properties, aluminium also has high thermal and electrical conductivity,
emissivity, cryogenic toughness and fatigue strength. Aluminium is also highly recyclable and the
remelting of scrap aluminium requires only 5% of the energy needed to extract the same weight of
primary metal from its ore bauxite. Aluminium alloys are widely present in our day-to-day life as thin
foils, beverage cans, structural members in public transport systems, aircraft parts among others [13,
18].
In the automotive sector, both wrought and cast aluminium alloys have been widely used. Cast alloys
are generally used to produce engine blocks and its components, wheels and suspension components
while wrought aluminium alloys are used to produce body structures and panels. The production of
TWBs using aluminium alloys for automotive applications results in a further weight reduction [1, 5, 19].
However, aluminium has a poor weldability by conventional fusion processes due to the presence of
surface oxides (Al2O3), its high reflectivity and thermal conductivity, low molten viscosity and low melting
temperature. This leads to defects like porosity, hot cracking in the fusion zone, loss of alloying elements
by vaporization, grain boundary melting in the HAZ and loss of strength. The current required to weld
aluminium by resistance spot welding is also greater than the one required for steel by a factor of 3. MIG
welding requires high heat transfer which increases the size of the HAZ and can induce thermal
distortions. The high reflectivity of aluminium reduces the efficiency of the laser welding process for
aluminium. To overcome this obstacles, laser absorption has been improved by increasing the power
density of the beam requiring more energy from the machine which produce a wider HAZ and induces
the formation of intermetallics. Intermetallics are most common in dissimilar joining between aluminium
and steel [1, 13, 19]
Chapter 2 – Literature review
11
Friction stir welding (FSW), as a solid-state process, generates less heat in the weld area than fusion
welding since there is no molten material. This allows to create a sound weld between similar or
dissimilar materials by limiting the formation of intermetallics and the loss of material properties in the
HAZ [13]. FSW and its applications will be addressed in greater detail bellow.
Chapter 2 – Literature review
12
2.2 Friction Stir Welding
Friction stir welding (FSW) is a solid-state joining process that was invented and patented at The
Welding Institute (TWI, Ltd) in 1991 by Wayne Thomas [20] and represents a significant breakthrough
in the metal joining technology by producing high integrity joints in materials that are difficult or even
deemed non-weldable by conventional fusion joining processes, particularly the 2XXX and 7XXX series
aluminium alloys. Since its invention and rapid adoption it is fast becoming the technique of choice for
manufacturing lightweight transport vehicles and other structures where high strength, low weight, good
toughness and excellent fatigue life are required [21].
The functioning principle of FSW consists of a non-consumable rotating tool, composed of a large
cylindrical body called shoulder and a profiled pin or probe that is plunged into the weld joint and
traversed at a constant rate along the joint between two clamped pieces of butted material. This process
includes four phases [22]:
1. The plunging phase, where the rotating tool is thrusted onto the workpiece material by a
constant axial force enabling the generation of heat by friction and adiabatic shear between the
tool and the work piece causing the workpiece material to soften, plasticize and lose its strength.
This phase ends with the contact of the rotating shoulder with the work material surface.
2. The dwelling phase, where the tool is allowed to dwell for a period of time so that additional heat
is generated in the workpiece to soften the material and induce severe material deformation
which will produce the amalgamated joint.
3. The welding phase, where the tool is traversed along the welding line, subjecting the soft
plasticized material to displacement, extrusion and shearing mechanisms under cyclic heat
generation along the welding line and finally consolidating welding nugget in the trailing side by
forging.
4. The exit phase, where the rotating tool is removed from the workpiece.
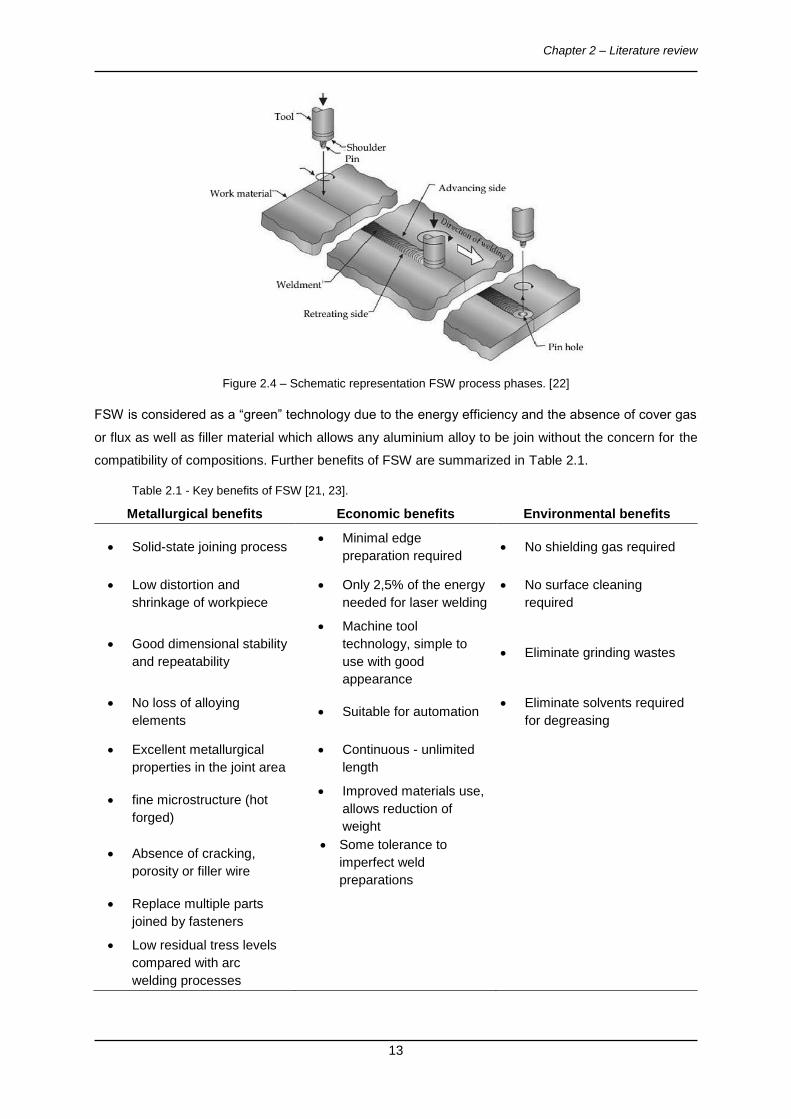
Figure 2.4 shows a schematic representation of the phases described earlier. The advancing side is the
designation given to the half-plate where the direction of rotation is the same as that of welding, with the
other side designated by retreating side. The severe plastic deformation at elevated temperatures,
produce a fine and equiaxed dynamically recrystallized grains in the stirred (nugget) zone which confers
good mechanical properties [21].
Chapter 2 – Literature review
13
Figure 2.4 – Schematic representation FSW process phases. [22]
FSW is considered as a “green” technology due to the energy efficiency and the absence of cover gas
or flux as well as filler material which allows any aluminium alloy to be join without the concern for the
compatibility of compositions. Further benefits of FSW are summarized in Table 2.1.