1 Development of HVDC Technology 1.1 Introduction The development of HVDC (High Voltage Direct Current) transmission system dates back to the 1930s when mercury arc rectifiers were invented. In 1941, the first HVDC transmission system contract for a commercial HVDC system was placed: 60 MW were to be supplied to the city of Berlin through an underground cable of 115 km in length. In 1945, this system was ready for operation. However, due to the end of World War II, the system was dismantled and never became operational. It was only in 1954 that the first HVDC (10 MW) transmission system was commissioned in Gotland. Since the 1960s, HVDC transmission system is now a mature technology and has played a vital part in both long distance transmission and in the interconnection of systems. HVDC transmission systems, when installed, often form the backbone of an electric power system. They combine high reliability with a long useful life. Their core component is the power converter, which serves as the interface to the AC transmission system. The conversion from AC to DC, and vice versa, is achieved by controllable electronic switches (valves) in a 3-phase bridge configuration. An HVDC link avoids some of the disadvantages and limitations of AC transmission and has the following advantages: . No technical limit to the length of a submarine cable connection. . No requirement that the linked systems run in synchronism. . No increase to the short circuit capacity imposed on AC switchgear. . Immunity from impedance, phase angle, frequency or voltage fluctuations. . Preserves independent management of frequency and generator control. . Improves both the AC system’s stability and, therefore, improves the internal power- carrying capacity, by modulation of power in response to frequency, power swing or line rating. HVDC Transmission Chan-Ki Kim, Vijay K. Sood, Gil-Soo Jang, Seong-Joo Lim, and Seok-Jin Lee Ó 2009 John Wiley & Sons (Asia) Pte Ltd
Transcript
1
Development of HVDCTechnology
1.1 Introduction
The development of HVDC (High Voltage Direct Current) transmission system dates back to
the 1930s when mercury arc rectifiers were invented. In 1941, the first HVDC transmission
system contract for a commercial HVDC systemwas placed: 60MWwere to be supplied to the
city of Berlin through an underground cable of 115 km in length. In 1945, this systemwas ready
for operation. However, due to the end of World War II, the system was dismantled and never
became operational. It was only in 1954 that the first HVDC (10MW) transmission systemwas
commissioned in Gotland. Since the 1960s, HVDC transmission system is now a mature
technology and has played a vital part in both long distance transmission and in the
interconnection of systems.
HVDC transmission systems, when installed, often form the backbone of an electric power
system. They combine high reliability with a long useful life. Their core component is the
power converter, which serves as the interface to the AC transmission system. The conversion
from AC to DC, and vice versa, is achieved by controllable electronic switches (valves) in a
3-phase bridge configuration.
AnHVDC link avoids some of the disadvantages and limitations of AC transmission and has
the following advantages:
. No technical limit to the length of a submarine cable connection.
. No requirement that the linked systems run in synchronism.
. No increase to the short circuit capacity imposed on AC switchgear.
. Immunity from impedance, phase angle, frequency or voltage fluctuations.
. Preserves independent management of frequency and generator control.
. Improves both the AC system’s stability and, therefore, improves the internal power-
carrying capacity, by modulation of power in response to frequency, power swing or line
rating.
HVDC Transmission Chan-Ki Kim, Vijay K. Sood, Gil-Soo Jang, Seong-Joo Lim, and Seok-Jin Lee� 2009 John Wiley & Sons (Asia) Pte Ltd
Figure 1.1 shows example applications ofHVDC transmission systems inwhich the labeling
is as follows:
1. Power transmission of bulk energy through long distance overhead line.
2. Power transmission of bulk energy through sea cable.
3. Fast and precise control of the flow of energy over an HVDC link to create a positive
damping of electromechanical oscillations and enhance the stability of the network by
modulation of the transmission power by using a Back-to-Back.
4. Since an HVDC link has no constraints with respect to frequency or to phase angle between
the two AC systems, it can be used to link systems with different frequencies using an
Asynchronous Back-to-Back.
5. When power is to be transmitted from a remote generation location across different
countries or different areas within one country, it may be strategically and politically
necessary to offer a connection to potential partners in the areas traversed by using a multi-
terminal DC link.
6. An HVDC transmission system can also be used to link renewable energy sources, such as
wind power, when it is located far away from the consumer.
7. VSC (Voltage-Source Converter) based HVDC technology is gaining more and more
attention. This new technology has become possible as a result of important advances in the
development of Insulated Gate Bipolar Transistors (IGBT). In this system, Pulse-Width
60Hz
60Hz
IslandingArea
Plant
50Hz
Plant
Island
Plant Complex
Wind Power
Wind Power
Figure 1.1 Various applications of an HVDC system.
2 HVDC Transmission
Modulation (PWM) can be used for the VSC as opposed to the thyristor based conventional
HVDC. This technology is well suited for wind power connection to the grid.
8. Since reactive power does not get transmitted over a DC link, two AC systems can be
connected through an HVDC link without increasing the short circuit power; this technique
can be useful in generator connections.
1.2 Advantages of HVDC Systems
The classical application of HVDC systems is the transmission of bulk power over long
distances because the overall cost for the transmission system is less and the losses are lower
than AC transmission. A significant advantage of the DC interconnection is that there is no
stability limit related to the amount of power or the transmission distance.
Long Distance Bulk Power Transmission.When large amounts of power are to be delivered
over long distances, DC transmission is always an alternative to be considered. AC transmis-
sion becomes limited by:
. Acceptable variation of voltage over the transmission distance and expected loading levels.
. Need to maintain stability, that is, synchronous operation across the transmission, after a
disturbance, both transiently and dynamically.. Economic effects of additions necessary to correct the above limitations.
The DC line, requiring as few as two conductors (one only for submarine with earth return)
compared to the AC line’s use of three, requires a smaller right of way and a less obtrusive
tower. Figure 1.2 shows schematically the tower configurations for 1200MW(two circuits AC,
Figure 1.2 Tower configurations for AC and DC transmission.
Development of HVDC Technology 3
bipolar DC) and 1500–2000MW transmission at EHVAC single circuit or monopolar DC by
alternative tower designs. (Note: a single circuit or a single pole above 1600MW capacity has
not been built to date (2008) because of the effect of the potential loss of such a high capacity
circuit on the system.)
As anAC line reaches either the limit imposed by system stability or its thermal capacity and
if adding a parallel line is impossible, it may be possible to convert it to DC. Applying DC up to
three times the AC capacity should be possible for transmission by altering the tower head
configuration, but not the foundations, tower size nor the right of way. Running AC and DC
lines on the same tower are also possible. At present, no example of these being put into effect
can be reported.
Interconnection by AC or HVDC. If two or more independent systems are to be inter-
connected by a synchronous AC link, the common rules concerning security, reliability,
frequency control, voltage control, primary and secondary control of reserve capacity and so on
need to be respected. When the basis for synchronism is established, it depend on the structure
and the strength of the power systems, the number of interconnecting lines, and whether or not
stability problems, for example, inter-area oscillations, may occur. In most cases, more than
one AC link is necessary for reliability; however, there are examples of single-circuit
interconnections for energy and reserve exchange, where limited reliability of the link is
accepted.
By contrast, interconnecting the systems with DC removes any constraints concerning
stability problems or control strategies. The common rules listed above concerning security
and so on can largely be left within the jurisdiction of the separate AC systems, remaining
independent of the agreement to link. The interconnection can bemade byHVDCback-to-back
stations along the border or by interconnecting load and generation centers within the systems
by long distance transmission.
For submarine interconnection, as distance increases, AC cables generate an increasingly
wide variation of voltage with power flow until the rating of the cable is fully taken up by its
charging current. Since intermediate, reactive compensation units cannot be installed, the
maximum practical distance was 50 km until recently. In recent years, the advent of the XLPE
cable (cross-linked polyethylene) for submarine use, with a lower shunt capacitance than
earlier types, has increased this limit to about 100 km. Beyond this distance, DC is the only
technically viable solution.AnHVDCconnection requires only positive and negative (pole and
return) conductors, or in some cases a single conductor with sea return and there is no practical
technical limit to length except cost.
HVDCMulti-Terminal Systems.When power is to be transmitted from a remote generation
location across different countries or different areaswithin one country, itmay be economically
and politically necessary to offer a connection to potential partners in the areas traversed.
Multi-terminal DC is a possibility for this type of application.
HVDCmulti-terminal systems allowmore participants. They have proved to be feasible, for
example, the SACOI 3-terminal cable system between Italy, Corsica (France), and Sardinia
(Italy) and the Quebec–New England 3-terminal overland system in Canada/USA. The Pacific
Intertie and the Nelson River DC links are examples of multi-terminal DC put to practical use.
These are examples of parallelmulti-terminal systems. Seriesmulti-terminal systems have also
been proposed but no practical applications exist at present.
A further example for interconnecting more systems via long distance HVDC links is the
planning of the East–West High Power Trans, connecting Russia, the Baltic States, Belarus,
4 HVDC Transmission
Poland and Germany, where a multi-terminal HVDC system is under consideration. The
advantages of interconnection can be exploited without establishing common rules (for
example, of frequency control) and AC systems can continue to operate and develop
independently. If, in the longer term, the requirements for AC interconnection are fulfilled
and it is agreed to synchronize, the HVDC transmission becomes a strong backbonewithin the
interconnected system and brings considerable stability advantages.
A control choice is available to operate multi-terminal systems with either a coordinated
master power controller, or with each terminal having its own power controller and the voltage-
controlling terminal supplies the balance of power. New control concepts may become
available to overcome the need for a master controller and to allow expansion with more
terminals, each convertor operating with locally available information.
Care has to be taken when weak systems have to be integrated into a multi-terminal
system, so that faults within them do not cause too widespread a disturbance. Furthermore,
if a multi-terminal system is to develop and grow independently, as AC systems can do, the
integration of a new converter station needs a review and re-coordination of the control
structure and parameters of all converters. However, smaller converters (with current rating
below or equal to the current margin, that is, about 10% of the existing system) may be
integrated at a later date.
AC System Support. An AC load flow depends on the difference in angle between voltage
vectors in different parts of the network. This angle cannot be influenced directly but depends
on the power balance. Secondly, a change in power generation or in the load demandwill cause
a change in system frequency that has to be restored by altering the generation. As this task has
to be fulfilled by the generator speed controllers, the frequency restoration is a slow action.
System stability also depends on there being sufficient flexibility to allow the automatic
adjustment of the voltage vectors.
If stability problems are encountered which can be solved by fast frequency control, HVDC
systems can fulfill this task by drawing the energy from the remote network. Due to the ability
to change the operating point virtually instantaneously, HVDC can feed (or reduce) active
power into the disturbed system to control the frequencymuch faster than a normally controlled
generator. If the feeding AC system is strong enough, the DC link can, within its rating, control
the frequency in the receiving system. A prerequisite for this kind of system support is only the
appropriate mode of control.
Take the case of an AC system containing relatively long transmission lines, where
electromechanical oscillations can be excited by system faults and are weakly damped.
Assume the addition of a DC link (point-to-point or back-to-back) from outside into this
system. Control features for power modulation, with the appropriate phase angle, can actively
introduce damping torque. In general, this valuable feature of an HVDC link is inherent and
requires no significant extra costs. Where the systems at each end of the DC have different
natural frequencies of oscillation, the damping torque can be applied to either/or both systems
simultaneously if necessary.
Two controls are available. Where a terminal’s AC network is part of a large system, the DC
controls can react to swings of power and attempt to mitigate their effect by damping power to
maintain synchronism.Where it is a separate system, applying a slope characteristic similar to
that of a generator can be used to apply frequency control.
Limitation of Faults. Faults causing depression of voltage on power swings do not transmit
across a DC barrier. They may emerge on the other side of a DC link simply as a reduction in
Development of HVDC Technology 5
power, but voltage will not affected. Constraining the influence of certain critical faults on AC
systems can be a valuable attribute of DC.
Limitation of Short Circuit Level.When new lines are built to extend AC systems, the short
circuit level of the system will unavoidably be increased. The switchgear apparatus must cope
with the short circuit requirements or an expensive refurbishment has to take place. Since
reactive power is not transmitted over a DC link, it provides ameans to extend the active power
exchanged without increasing the short circuit level.
Power Flow Control. An HVDC link operates at any condition of voltage and frequency of
the two AC systems. An independent control is therefore available to transmit power, leaving
each system’s existing load frequency control to act normally. A valuable strategy then is to
hold in reserve the system control features given above for occasionswhenvoltage or frequency
stray outside the normal bands of operation.
Where a link is contained within one AC system the same applies, but special stability
controls act when system oscillations exceed a certain band of, for example, the rate of change
of bus bar voltage angle.
Voltage Control.AnHVDC link can also be used for voltage control. The converter absorbs
reactive power depending on its control angle, which normally will be compensated for by
filters and/or capacitor banks. By extending the control angle operating range (to a lower
voltage) and additional capacitor banks (to raise voltage) togetherwith a fast acting transformer
tap-changer, the reactive power demand can be used for independent voltage control at both
connection points. This operation, outside the optimum (minimum) control angles, leads to
higher short-time operational losses and stress on components, but these are usually marginal
compared to the operational improvement. If it is to be used as a permanent feature, thismethod
of operation has to be taken into account in the design phase of the DC link.
It is important to realize that the normal constant power regime of a DC link can destabilize
anAC network under distress. A normal feature of theDC link is the voltage-dependent current
limit where DC power is limited when voltage drops below the normal range, so that the
reactive power is made available to the AC system. Under disturbed conditions, it is a good
principle to look after theACvoltage first, and then order the power flow accordingly. There are
substantial AC filters at the converter stations, which can be used to bolster AC voltage if
stability is threatened. The DC control drops DC power, so that the converters absorb less
reactive power and the reactive capacity of the filters is available to the network. Though the
loss of power flow is unwelcome, the boost to AC voltage maybe more valuable.
Self-commutatedVSCs are able to provide independent control of active and reactive power.
Reactive power generation or absorption is possible, within converter ratings, at anyDC power
transfer rate.
System Reserve. The maximum unit site of generation in the system is determined by the
maximum loss of power for which the system frequency can be maintained, within defined
limits. When a large amount of power is fed into an AC system by an HVDC long distance
transmission system, it can also be thought of as generation. The maximum power of one pole
of the HVDC link is in the same way limited by the system parameters.
The largest possible loss of power of an HVDC link, in case of a fault causing line outages,
depends on the DC line tower configuration and on the ability to transmit power via ground or
metallic return. Assuming that the current carrying capacity of a conductor is well above its
nominal current rating, there can be a short-time capacity of overload in the converter and line
on the remaining healthy equipment, to reduce the shock to the system as awhole in case of pole
6 HVDC Transmission
faults. Dimensioning the maximum sudden step-change resulting from a fault can therefore be
precise when DC is used.
Environmental Benefits. As well as the comparison of life cycle costs, the environmental
compatibility of a design alternative needs examination.AnACalternative constitutesAC lines
plus AC substations whilst a DC alternative has DC lines plus converter stations plus
corresponding AC substations. The environmental impacts of the two methods will not be
equal. A qualitative comparison between AC and DC lines with regard to impact on the
environment is as follows:
. Visual impact constitutes an environmental advantage for a DC line, since the tower size for
the same power is lower when compared to the tower size of an AC line.. Right-of-way width of a DC line compared to an AC line is considerably reduced. This
facilitates suitable routes in densely populated areas and in regions with difficult terrain.. Corona phenomenon has a substantially different nature in DC than in AC transmission.
Generally, for a bipolar DC transmission line and an AC transmission line with almost the
same rms conductor voltage to earth and equal transmitting capacity, annual mean Corona
Losses (CL) are more favorable for the DC than the AC case, particularly in poor weather
conditions.. Radio interference (RI) results from Corona discharges, which generate high frequency
currents in the conductors producing electromagnetic radiation, in the vicinity of the lines. RI
measurements have shown that radio noise from a DC line is considerably lower than from
AC lines of similar capacity.. Audible noise (AN) values resulting from comparable DC and AC lines during fair weather
are quite similar. However, during rain, the better performance and the lower interference
levels generated by DC compared to AC lines are considered an advantage.. With regard to magnetic fields, conditions for DC lines are quite different than AC lines.
Since a DC line has an unchanging electric field, it exerts effectively nomagnetic field on the
surroundings. The DC field of a monopolar line is comparable to the strength of the earth’s
magnetic field.. Regarding generation and emission by DC lines of positively charged ions, O3, N2 and free
electrons, research studies and investigations of possible consequences have shown, up to
now, no evidence of hazard from any operating DC line.
1.3 HVDC System Costs
It is verymuch cost effective for a long distanceDCpower transmission compared toACpower
transmission. In case of undersea cables where the intersections of the bold lines are located at a
relatively short distance as shown in Figure 1.3, the DC system is much more economical.
In Figure 1.3, (1) illustrates the initial cost for HVAC power transmission and (2) illustrates
the initial cost of HVDC power transmission with a bigger initial cost due to a higher valve cost
for HVDC transmission. In addition, (3) and (5) represent the cost for transmission line
construction inHVAC andHVDC power transmissions, respectively and they demonstrate that
HVDC power transmission has a lower cost for transmission line construction. In the case of
HVAC power transmission, a shunt capacitor must be installed typically at every 100 km or
200 km because of its electrostatic capacity. In other words, the increase in total cost for power
transmission lines is accompanied by additional costs due to shunt capacitors. In the same
Development of HVDC Technology 7
Figure 1.3, (6) and (7) illustrate losses of HVDC and HVAC systems during power transmis-
sion. It is shown that anHVDC system has a smaller loss if the same amount of electric power is
delivered. Therefore, HVAC transmission is favorable for distances less than about 450 km and
HVDC transmission is favorable for distances exceeding 450 km.
Table 1.1 represents the relationship between the capacity and the DC voltage of most
commonly used HVDC systems. The general DC voltage may not be determined by the
capacity of the HVDC system below 400MW but instead it should be solely determined by
the manufacturer or electric power company because of the economical trade-offs between the
insulation level and the losses in an HVDC system.
Cost
Total AC Cost(8)
Approx.450 km
ACLosses
(6)
Total DC Cost(9)
DCLosses
(7)
DC LineCost (5)
DC TerminalCost (2)
AC TerminalCost (1)
SC Distance
AC LineCost (3)
Shunt CapacityCost (4)
Figure 1.3 Transmission distance and investment costs for AC and DC power transmission lines.
Table 1.1 Relationships between the capacity and the voltage of HVDC systems.
Capacity (MW) AC voltage (kV) DC voltage (kV) (PTP) DC voltage (kV) (BTB)
200 115 — 2� 60
400 115–230 — 2� 80
500 230–345 �250 2� 100
1000 345–500 �400–500 2� 150
1500 345–500 �500 —
2000 500 �500–600 —
2500 500 �500–600 —
3000 500 �600 —
8 HVDC Transmission
The most unique characteristic of the data presented in Table 1.1 is the fact that since the
concept of earth return does not exist in a BTB connection, the negative voltage may not
exist accordingly and that the DC voltage could be lower than in a PTP connection since it
has no transmission line and no transmission line resistive loss needs to be considered. The
lower DC voltage in BTB connection implies that the number of serially connected
thyristors in the valve of the HVDC system and the insulation level of the peripheral
devices will be reduced. Therefore, the manufacturing cost for BTB–HVDC systems is less
than PTP–HVDC systems if the net cost excluding the cost for the transmission line at the
same capacity is considered. (According to some reports, the total manufacturing cost for
BTB is less than PTP by 20%.)
Station Costs. In any economic assessment of either overall project viability or comparison
of competing options, the base capital costs are invariably the most significant items and hence
the most important in terms of accuracy. Throughout this exercise, and indeed throughout the
process of defining a transmission project, the accuracy of a cost estimate will improve, as the
parameters (technical and commercial) become better known. In recent years, several reviews
have been done on the capital costs of HVDC equipment supply.
A cost breakdown analysis for recent DC stations is presented in Table 1.2. It obviouslymust
be treated with caution, as quoted costs of DC stations are subject – like anything else – to the
vagaries of the marketplace. Though they have recently been dropping, it cannot be predicted
whether such conditions will continue or reverse. In Table 1.2, the ‘total’ level gives typical
turnkey costs of the vendor’s HVDC supply and installation. These costs cover both terminals
(of a two-terminal scheme), and are based on some simplifying assumptions. They assume that
the DC bipole is made up of one valve group per pole and also that no special measures are
required for reactive power compensation and/or voltage control to incorporate a DC scheme
Table 1.2 HVDC turnkey cost division cost values given in year 2000US$/kW (both ends inclusive) for
one valve group per pole.
Back-to-BackMonopole
500 kV,
Bipole
�500 kV,
Bipole
�500 kV,
Bipole
�600 kV,
200
MW
(%)
500
MW
(%)
500MW
(%)
1000MW
(%)
2000MW
(%)
3000MW
(%)
Valve groups 19 19 21 21 22 22
Convertor
transformers
22.5 22.5 21 22 22 22
DC switchyard
and filtering
3 3 6 6 6 6
AC switchyard
and filtering
11 11 10 9.5 9 9
Control/prot./comm. 8.5 8.5 8 8 8 8
Civil/mech. works 13 13 14 14 13.5 13.5
Aux. power 2 2 2.5 2.5 2.5 2.5
Project eng.
and admin.
21 21 17.5 17 17 17
100 100 100 100 100 100
Total per kW $130 $90 $180 $170 $145 $150
Development of HVDC Technology 9
into a weak AC system. These costs also do not include any costs by the purchaser entity itself,
taxes, interest during construction or other money borrowing costs. In certain applications, the
purchaser’s costs can be substantial.
If �500 kV is selected in place of �600 kV for a 3000MW bipole, a station cost
approximately 5 to 10% lower applies. In view of market volatility, the above estimates
should be treated as having accuracy no better than �20%. These costs can be used to
explore development options but confirmatory figures obviously need to be obtained from
manufacturers. Each power system is different with respect to voltage, system strength,
harmonic and reactive power limits. Each HVDC scheme is therefore unique and caution is
needed when utilizing the turnkey costs and facility cost variations discussed above for
comparing options. Additional shunt capacitors cost about $10/kvar. More sophisticated
control devices, such as SVCs or STATCOMs, cost from about $30 to $50/kvar (total
installed cost). In the case of very weak systems where additional system strength in the
form of synchronous compensators is applied, larger costs from about $70/kvar to $90/kvar
may be implied.
Overhead Line Costs. Depending on the degree of system reliability required and the
sensitivity tolerated for transient and permanent line faults, various types of HVDC overhead
lines can be constructed with different remaining transmission capacity after line faults. An
increase in reliabilitymeans an increase of cost of transmission lines. The figures in parenthesis
in Table 1.3 assume that the two station poles can be switched to operate in parallel (at a small
increase in the station cost) and that the line conductors have the thermal capacity for twice the
current. Thismay be inherently available as conductor sizes are selected to satisfy design limits
for corona discharge.
Line designers were asked to calculate, for a typical situation familiar to them, the ratio of
costs per kmof eachDC line, using the correspondingAC line cost as 1.0 per unit per km length.
Suitable design parameters, including conductor sizes, with which they were familiar for each
case, could be used, assuming a simple bipolar tower without a metallic neutral return. The
results are given in Table 1.4. The intent was to compare the cost of towers, conductors and
construction only, without taking into account other parts of the system.
Stages in Expansion of HVDC Transmission. HVDC transmission can be fitted more
readily than AC to a gradual expansion plan for transfer of power. In this way, unnecessary
investments can be avoided or a delay of investments can be obtained. AC transmission
often has to be built from the start with a high capacity to maintain stability, but DC can be
tailored to discrete stages. The most common staging in DC transmission is first to build a
monopole and later a bipole. To develop further from this stage, a new bipole can be added
or the convertor stations can be upgraded in current and/or voltage by adding converters in
series or parallel. In many applications HVDC is chosen for large power transfers on a long-
term basis. The transfer may, however, be low in the initial stage and higher after a certain
period. Based on the build-up timing and having the investment costs for convertor stations
in mind, it is natural to evaluate different approaches of a stepwise implementation of the
total HVDC transmission scheme.
The major alternatives are:
1. Stage 1 Pole 1
Stage 2 Extension with Pole 2
10 HVDC Transmission
Table
1.3
HVDCoverheadlineconfigurations.
Variant
Tower
configuration
Rem
aining
transm
ission
capacity
Relative
cost(%
)
Loss
ofonepole
groundreturn
Permitted
Notpermitted
tower
breakage
Single
monopolarline
00
085
Single
bipolarline
50(100)
00
100
Double
bipolarline
100
100
0114
Twomonopolarlines
50(100)
050(100)
126
Twolines
(bipolarorhomopolar)
100
100
100
136
Development of HVDC Technology 11
Usually the two poles have equal power and voltage ratings. The transmission linemight be
designed as a bipolar line from the beginning and additional converters are added at both
ends.
2. Stage 1 Bipole 1 at reduced voltage
Stage 2 Upgrading by increasing the DC voltage
This requires additional converters in series.
3. Stage 1 Bipole 1
Stage 2 Upgrading by increasing the DC current
This requires additional converters in parallel. Both alternatives 2 and 3 should have the
transmission line designed for the higher voltage or current capacity from the beginning.
4. Stage 1 Bipole 1
Stage 2 Bipole 2
The two bipoles need not be equally rated, but additional security can be gained by
paralleling poles under line outage conditions. If the transmission includes submarine
cables, it is often economical to install the required rating and no more at each stage.
Environmental Aspects. Increasing environmental awareness throughout the world is
impacting both the implementation and the cost of transmission projects. Environmental
objections to projects can lead to lengthy delays in construction, and thus to increased cost.
Interconnection projects may span different jurisdictions, each with its own controls and
application procedures.More directly,measures tomitigate environmental impact lead directly
to cost increases. On the other hand, these cost increases have to be compared to the cost of
delay and especially to the income not received from a scheme that had proved to be
economical. The environmental issues which can give rise to increased costs include the
following:
. As with AC overhead transmission lines, there is increasing resistance to the construction of
newDC transmission lines. The objections are typically based onvisual impact and concerns
about electromagnetic fields. Objections to overhead lines led to a decision to underground
the land portions of the KONTEK scheme (Denmark–Germany) and to prolonged delays to
the Italy–Greece interconnection. These objections can affect associated AC connections
and system reinforcements as much as the DC transmission scheme itself. This has been the
Table 1.4 Cost ratios for DC and AC transmission line constructiona.
Case AC equivalent line Cost pu HVDC bipolar line ratings Range of costs pu
aNote these figures are not derived from a statistically significant sample, but fromonly three approximate
estimates by practitioners.
12 HVDC Transmission
case with the Moyle interconnection (N. Ireland–Scotland), where a description of the
necessary process has been published.. Many submarine HVDC schemes were conceived as monopolar schemes, thus minimizing
cable costs. However, the use of a sea/earth return path leads to questions of corrosion of
other metallic objects (pipelines, cable sheaths, etc.), production of chlorine gas and impact
on fish populations.. Monopolar submarine HVDC schemes cause magnetic compass deflections, depending
on cable orientations, water depth and current magnitude. In some jurisdictions there are
limits to magnetic compass deflections, which may require a return cable alongside the
pole cable, or the use of coaxial cable with integral current return, where ratings are
appropriate.. Burial of submarine cables may be necessary to minimize the risk of mechanical damage to
the cables by trawling or shipping. However, the disturbance of the seabed caused by
trenching and cable lying may have adverse impacts on marine life.. Stringent acoustic noise limitations may be placed on convertor station installations.
Measures to limit noise from reactors, valve cooling systems, filter banks and so on can
have an impact on the cost of the convertor station.. Direct voltage across line insulators tends to attract and polarize airborne dust particles. Anti-
fog insulators are usually needed and creepage distance requirements are greater than on an
AC line.. An objection to any higher-voltage transmission linemay be that it is difficult to supply small
loads to villages along the right-of-way.
1.4 Overview and Organization of HVDC Systems
HVDC transmission refers to that the AC power generated at a power plant is transformed
into DC power before its transmission. At the inverter (receiving side), it is then transformed
back into its original AC power and then supplied to each household. Such power
transmission method makes it possible to transmit electric power in an economic way
through up-conversion of voltage, which is an advantage in existing AC transmission
technology and to overcome many disadvantages associated with AC power transmission
as well. The overall structure of an HVDC system is as shown in Figure 1.4 and its basic
components are described below.
AC Breaker. This is used to isolate the HVDC system from the AC system when the HVDC
system is malfunctioning. This breaker must be rated to carry full load current, interrupt fault
current, and energize the usually large converter transformers. The purposes of this breaker are
for the interface between AC switch yards or between AC busbar and HVDC system
(Figure 1.5).
AC Filters and Capacitor Bank. The converter generates voltage and current harmonics at
both the AC and DC sides. Such harmonics overheat the generator and disturb the communi-
cation system. On the AC side, a double tuned AC filter is used to remove these two types of
harmonics. In addition, the reactive power sources such as a capacitor bank or synchronous
compensator are installed to provide the reactive power necessary for power conversion
(Figure 1.6).
Development of HVDC Technology 13
Current (i)
Zero crossing 60/s (60 Hz)
Time (t)
Figure 1.5 Blocking at the zero crossing of AC current.
ACACSystem2System1
ACFilter
Controls, Protection, Monitoring
DCFilter
DCFilter
321 654
Pole1
Pole2
To FromOtherTerminal
Figure 1.4 Basic structural diagram of a bipolar HVDC system.
Figure 1.6 Double tuned AC filter for the 11th and 13th harmonics (Reproduced by permission of
AREVA).
14 HVDC Transmission
Converter Transformer. This transforms the voltage from the AC system to be supplied to
theDC system. It also provides a separation between theACandDC system. Specifically, when
the two units of 6 pulse converters are serially connected to generate a 12 pulse output, a
3-winding converter transformer is used (Figure 1.7).
Thyristor Converter. A converter, which is an essential component of HVDC power
transmission, is developed using power electronics. It is one of many research areas dealing
with the transformation and control of power by switching devices in the power converter. It
performs the conversion from AC to DC or from DC to AC. It is mainly comprised of a valve
bridge and a transformer with a tap converter. Figure 1.8 shows the thyristor converter installed
and operating in Cheju Island. Its thyristor stack is configured with 6-pulses or 12-pulses and it
is connected to the voltage valve (Figure 1.9).
Smoothing Reactors andDCFilters.The smoothing reactor reduces theDC ripple current to
prevent it from becoming discontinuous at low power levels. Also, the smoothing reactor forms
an integral component, together with the DC filter, to protect the converter valve during a
commutation failure by limiting the rapid rise of current flowing into the converter.
HVDC Controller Structure. Figure 1.10 shows the basic control diagram of an HVDC
system. An HVDC system can be divided into several levels. Master control determines the
power order or frequency order and calculates the current order for both poles. Then, the current
order that was received from master control is modified by control functions and limits in pole
control. Valve group control consists of a converter control and a valve firing control. The
converter control includes the current controller. The valve firing control distributes the firing
signal to all thyristors.
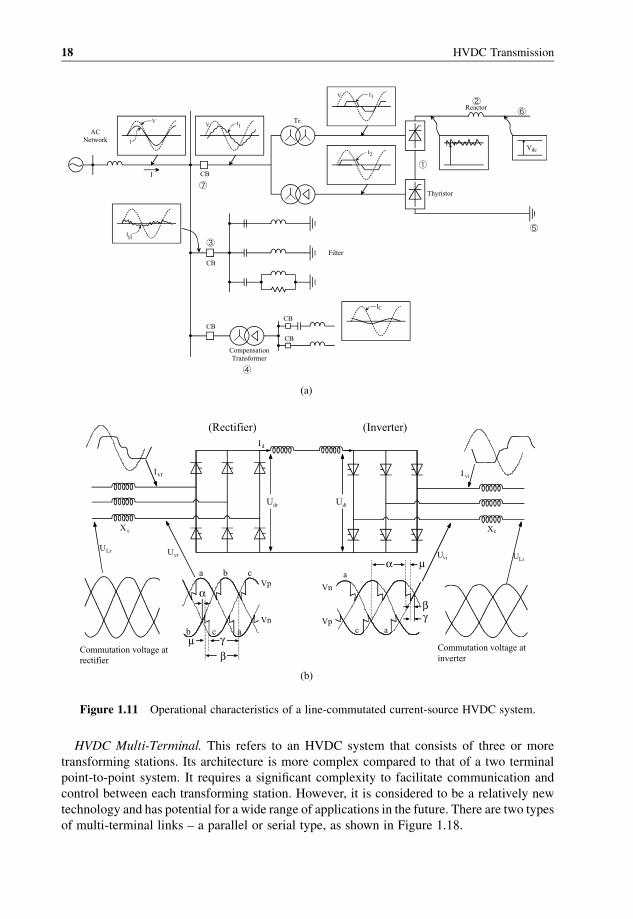
Line Commutated Current Source Converter and Voltage Source Converter. Line Com-
mutated Current Source Converter (LCC), as shown in Figure 1.11, consists of a 12-pulse
converter, AC filter and synchronous compensator. LCC depends on the AC system voltage for
its proper operation. LCC operates at a lagging power factor, because the firing of the converter
has to be delayed relative to the voltage crossing to control the DC voltage.
Figure 1.7 Three-winding converter transformer (Reproduced by permission of AREVA).
Development of HVDC Technology 15
Figure 1.12 shows the concepts of Voltage Source Converter (VSC). VSC is based on forced
commutated devices that is, IGBTs or GTOs, which allows converter operation in all four
quadrants of the P–Q plane. Since commutation can be achieved quickly and independently of
theAC system voltage, an entirely different type of operation compared to the LCC converter is
possible.
Figure 1.9 Thyristor stack (Reproduced by permission of AREVA).
Figure 1.8 Thyristor converter (Reproduced by permission of AREVA).
16 HVDC Transmission
Point to Point System. Most HVDC systems fall under this category. It consists of either
cable or overhead lines or a combination of these two. This type of system has one of the forms
shown in Figure 1.13, depending on the number of overhead lines and the polarity.
Monopolar HVDC. This type of HVDC link consists of a single conductor and a return path
either through the ground or sea. This method is mostly used for power transmission using
cables. Use of this type of system is dictated by the costs of installing the cable. A metallic
return path is preferred instead of through the ground when the ground resistance is too high or
the underground/undersea metallic components may cause some interference (Figure 1.14).
Bipolar HVDC. It consists of two poles, one positive polarity and the other negative polarity,
and with their neutral points grounded. In steady state operation, the current flowing in each
pole is the same and hence no current flows in the grounded return. The two poles may be
operated separately. If either polemalfunctions, then the other pole can transmit power by itself
with ground return. In a bipole the amount of power transmission is increased by a factor of two
compared to the monopolar case. This creates fewer harmonics in normal operation as
compared to the monopolar case. Reverse power flow can be controlled by converting the
polarities of the two poles (Figures 1.15 and 1.16).
Back-to-Back System. In this type of system, the rectifier and the inverter are located in the same
station. Ingeneral, it isusedforprovidinganasynchronousinterconnectionfor twoACsystems.The
2. Harmonic Filter: consisting of inductors, capacitors, resistors, CTs, isolators, AC breakers,
and so on.
A reliability study model of a complete system is built up by relating together all the
subsystemswhich it contains in terms of the effect of their failures on the other subsystems. For
example, failure of a pump in a thyristors valvewater cooling system could affect the reliability
of the converter in which the valve is situated. The relationship between affected subsystems is
termed ‘dependency’.
Types of Dependency. The dependency relationship between two or more components is
usually expressed in two ways:
1. Series Dependency. In this case, the concept used is analogous to that of series-connected
fuses in an electrical circuit where circuit continuity is dependent on the health of each and
every individual fuse. Failure of one ormore fuses results in a failure of the circuit to conduct
current. In the same way, in terms of reliability, the failure of one or more series dependent
components results in complete failure of the equipment (or subsystem) to operate as
designed. For example, failure of either a convertor transformer or a thyristors valve in one
pole will result in shut-down of the complete pole. The transformer and valve are thus
considered to be in series dependency.
2. Parallel Dependency. In this case, the concept used is that of parallel-connected fuses in an
electrical circuit. Failure of one fusewill not result in failure of the circuit to conduct current
although the circuit’s current carrying capacity may be reduced. Similarly, in terms of
reliability, the failure of one or more parallel-dependent components may not result in
equipment failure but may limit the equipment’s rated capacity or functionality. For
example, if a scheme contains two harmonic filters, the failure of one filter may not result
in converter shut-down since the converter may be able to function with only one filter in
circuit (although, in some situations, at a reduced rating). The filters could thus be
considered to be in parallel dependency.
3. Redundancy. This is a version of parallel dependency but in this case a greater number of
components are provided than the minimum necessary to achieve the required equipment
rating. Hence, one or more components are able to fail without causing a reduction of the
rated capability of the equipment.
Example of MTTF. To check the reliability of an HVDC system, assume that the ratio of
occurrence of failure in themain components such as valves, converters, controllers, protection
circuit and filters are given by Table 1.5.
The relationship between the ratio of occurrence of failure (l) and the reliability can be givenas Figure 1.19(a) where Ri(t) denotes the reliability. For convenience, assume that l1¼ l4¼l5¼ l6 and l2¼ l3, the following equation can be derived:
Rsys1 ¼ exp½ � ð4l1 þ 2l2Þt� ð1:1Þ
24 HVDC Transmission
In this case, the MTTF can be expressed as in the following equation:
MTTF ¼ 1
4l1 þ 2l2ð1:2Þ
If one assumes that the relationship between l1 and l2 is described by (l2/l11)k1, one shouldsimply decrease l2 in order to increase the MTTF. If one considers a system, Rsys consisting of
two modules l1, l2 in parallel to each other in order to draw a explanatory comparison of the
concept of multiplexing, then the MTTF can be expressed as follows:
RsysðtÞ ¼ expð� l1tÞ � expð� l2tÞ ð1:3Þ
Table 1.5 Components of an HVDC system and the ratio
Assumes that l1¼ 2.1831� 10�5 (failure of unit/hr), l2¼ 1.0� 10�6 (failure of unit/hr), then
the equation becomes:
RsysðtÞ ¼ expð� 2:2831� 10� 5tÞ ð1:7Þand the MTTF is given as:
MTTFsys ¼ 43800½hr� ¼ 5½years� ð1:8ÞCalculating Reliability/Availability [3]. There are several ways in which reliability and
availability can be evaluated. One of the more popular methods is the ‘Monte Carlo’ method of
random sampling. The drawback to this method is that when failure rates are very low, a finite
quantity of random samples may result in zero failure occurrences being found. Hence
components with very low failure rates cannot be represented accurately. The reliability
software which is used is based on the ‘Continuous Markov’ method. This considers all
components to be in continuous transition between ‘working’ and ‘failed’ states. Because all
the transitions between states are not time-dependent, they can be expressed as linear
simultaneous equations which can then be solved by matrix arithmetic.
Case Study:A 100MWHVDC power link is required to connect a power station to a major
load center. The power station and local center are separated by a body of water. As this power
link will be supporting critical load the following design targets have been set for the convertor
stations:
(i) Energy availability of the two convertor stations (excluding the cable): 99.5%.
(ii) Number of forced outages in 5 years: 1.
It will be permitted to use the body of water as the neutral DC connection. A cost
optimization exercise has been carried out and it has been found that the most economic
interconnection voltage would be 100 kV DC. It will be permitted to close down the link on a
schedule basis once every year, for repair and maintenance activities to be undertaken.
Stage 1: Monopole. If one first considers a basic scheme which is only designed to meet
the power transfer requirements stated above, one arrives at the design shown in
26 HVDC Transmission
Figure 1.20. Each end of the basic design consists of:
1. A 12-pulse convertor where each valve contains 14 ‘active’ thyristors in series.
Associated control and auxiliary equipment is lumped into this subsystem.
2. One AC harmonic filter connected to the AC bus.
3. One set of DC yard equipment including; the smoothing reactor, the DC
measuring equipment, and so on.
The system can be represented by the simplified dependency diagram shown in
Figure 1.20 (note that the HVDC cable has been ignored). By evaluating this
equipment dependency using the standard software the results shown in Table 1.6
and Table 1.7 are obtained.
It can be seen that this design is inadequate as over a five year period this scheme
could be expected to trip (that is, suddenly stop transmitting power) over twenty six
times. It is therefore necessary to increase the redundancy in the scheme.
Stage 2: Redundant Filter. Considering the stage 2 results it can be seen that the biggest
contribution to Forced Outage and Energy Availability is the one AC harmonic filter
on each AC bus. The addition of a parallel filter would mean that the failure of one
filter would not require the HVDC scheme to be tripped. A further advantage of
F
Single Line Diagram
F
Dependency Diagram
AC Filter AC FilterConvertor ConvertorDC Yard DC Yard
Figure 1.20 HVDC system composed of a monopole.
Table 1.6 Calculated FOR and energy availability.
Stage Number of forced
outages in 5 yr
Energy
availability (%)
Capital
cost (%)
1: Monopole 26 98.26 100
2: Redundant filter 8 99.64 104
3: 100% rated bipole 1 99.38 156
Development of HVDC Technology 27
connecting a second filter in parallel during normal operation is that theACharmonic
filter losses (I2R losses) will be a quarter. From Table 1.8 it can be seen that the AC
harmonic filters, once duplicated make only a very small contribution to the forced
outages and energy unavailability (Figure 1.21).
Stage 3: 100% Rated Bipole. In order to gain any further real improvements, it is necessary to
duplicate the link itself. The single line diagram and dependency diagram for this
arrangement is given in Figure 1.22. Consider two poles, each rated at 50% (50MW),
connected in series to form a bipole. The Forced Outage of one pole will reduce the
transmitted power to 50% not 0% as previously. Considering the results in Table 1.9,
duplication of the poles can be seen to havemade a dramatic effect on the FOR. which
is now better than one expected failure in five years. However, the EnergyAvailability
target has still not been achieved (Table 1.9).
Case Study Conclusion.By constructing this scheme from two poles each rated at 100% it is
possible, in this simple example, to achieve the design target of:
. Energy availability of: 99.5%.
. Number of forced outages in 5 years: 1.
From the results it can be seen that the calculations have a significant economic effect. The
customermay, for example, choose to relax the target energy availability figure by 0.12%. Such
a change would mean that the scheme design proposed in stage 3 could be utilized, thereby
reducing the capital cost of the convertor station.
Table 1.8 HVDC system composed of one pole and filters considering redundancya.
Forced outage rate Energy unavailability Energy availability
Duplicated filter 0.010 798 0.004 098 99.9959
Convertor 0.731 940 0.138 605 99.8614
DC yard 0.067 643 0.038 882 99.9611
DC yard 0.067 643 0.038 882 99.9611
Convertor 0.731 940 0.138 605 99.8614
Duplicated filter 0.010 798 0.004 098 99.9959
One pole 1.620 764 0.362 717 99.6373
aTrips in 5 years: 8.
Table 1.7 HVDC system composed as a monopolea.
Forced outage rate Energy unavailability Energy availability
AC filter 0.848 800 0.640 173 99.3598
Convertor 1.730 681 0.196 532 99.8035
DC yard 0.067 643 0.038 882 99.9611
DC yard 0.067 643 0.038 882 99.9611
Convertor 1.730 681 0.196 532 99.8035
AC filter 0.848 800 0.640 173 99.3598
One pole 5.294 249 1.740 369 98.2596
aTrips in 5 years: 26.
28 HVDC Transmission
F
Single Line Diagram
F
Dependency Diagram
F F
50%
50%
CommonEquipments
DuplicateFilters
DC YardSame as
Other End
DC YardConvertor
Convertor
Figure 1.22 HVDC system composed of a bipole.
F F
Dependency Diagram
DuplicatedFilters Convertor ConvertorDC Yard DC Yard
DuplicatedFilters
F F
Single Line Diagram
Figure 1.21 HVDC system composed of one pole and two filters considering redundancy.
Development of HVDC Technology 29
Table 1.6 compares the calculated F.O.R. and energy availability of the various cases
considered with a percentage capital cost, where the simplest scheme discussed in stage 1 is
taken as having a capital cost of 100%. By generating such a table for a particular scheme, the
user can optimize the scheme design based on the capital cost of the equipment versus the
charges the user would incur due to the loss of the HVDC scheme.
Evaluation of the Reliability in an HVDC System
Case 1.The entire system is composed as amono pole. In this case, it is reported that the system
is tripped 26 times in 5 years.
Case 2. The HVDC system is composed of one pole and two filters considering redundancy. In
this case, it is reported that the system is tripped 8 times in 5 years.
Case 3. HVDC system is composed of a bipole. In this case, it is reported that the system is
tripped one time in 5 years.
1.6 HVDC Characteristics and Economic Aspects
The Benefits of Interconnection. By way of a review, the principal benefits from interconnect-
ing two, or more, power systems are set out below:
. Economies of Scale. In general, large generation units are more efficient than small.
However, too large a unit size runs the risk of a major disturbance if it develops a fault.
The larger the interconnected system, the easier it is to withstand the loss of a large unit.. Fuel Economy. The dispatch of generating plant aims to use efficient plant for continuous
load and less efficient for meeting peaks. Wider fuel choices from interconnected systems
offer opportunities to optimize dispatch on a larger system, where more plant options are
likely to be available, and thus to reduce supply costs.. Reduction in Reserve Capacity. A margin of reserve capacity has to be maintained in
operating generation of any system to cater for plant maintenance and/or breakdown. The
interconnection of two or more separate systems enables their standby determined reserve
requirement. Additions of generation plant to meet rising predicted demand can be deferred
by interconnecting, or some of the reserve is freed to supply demand.
Table 1.9 HVDC system composed of a bipolea.
Forced outage rate Energy unavailability Energy Availability
Duplicated filter 0.010 798 0.004 098 99.9959
Convertor 0.731 940 0.138 605 99.8614
DC yard 0.067 643 0.038 882 99.9611
DC yard 0.067 643 0.038 882 99.9611
Convertor 0.731 940 0.138 605 99.8614
Duplicated filter 0.010 798 0.004 098 99.9959
One pole 1.599 167 0.354 550 99.6454
Common equipment 0.169 400 0.262 838 99.7372
Two poles 0.202 297 0.624 602 99.3754
aTrips in 5 years: 1.
30 HVDC Transmission
. Diversity in Demand. Different types of consumer mix, East/West time zone shift, North/
South seasonal shift and even different religious observance (Moslem Friday, Christian
Sunday and different festivals) can all result in non-coincident system peaks, such that the
interconnected system’s maximum demand is considerably less than the sum of demands on
the separate systems.. Fuel Source Diversity. Different types of generating plant have differing operating pre-
ferences. Large coal-fired, combined-cycle gas and nuclear plant are efficientwhen operating
continuously. Hydro and gas turbines can bemore suitable for peaking and reserve duties. If a
system with a high proportion of the former can be interconnected with one with a high
proportion of the latter, higher load factors can be achievedon thermal plant by interchanging
energy. Surplus hydro energy in flood periods can be put to good use, saving fuel in the
thermal system. There may also be strategic advantages in a system having access to the
alternative fuel sources of a neighboring system.. Reliability and Security of Supply. The security and reliability of existing networks will be
increased by an interconnection making available the additional variety of generation type
and standby capacity from outside.. Environmental Benefits. Many of the above factors have consequential environmental
benefits. Improved efficiency of energy delivery is the most obvious. A particular benefit
associated with hydro is the realization of integrated operation that can permit some
reduction of carbon dioxide releases into the atmosphere from fossil sources in addition
to the saving in fuel. Furthermore, the cooperative operation of run-of-river and storage
hydro plants via interconnection enables significantly more energy to be produced from
a given hydrological scenario. This can apply within and/or between river systems, and
be coupled with opportunities of conserving water for other uses or in drought
conditions. It follows that interconnection also provides opportunities to reduce the
scale of new storage hydro projects, and thereby limit the inundation of land and
destruction of habitat.. Financial Participation.The owners of interconnected systems are able to share both the cost
and the benefits of large projects, for example, hydro, which may otherwise not be
economically justified.. Technology Exchange. Shared systems tend to encourage standardization of designs,
operational practices and information exchange.. Pooling Opportunities. In 1997 there were some pooling agreements or directives linking
utilities in theword, from the formal to the informal, to realize the benefits of interconnection.
Most used a traditional central-planning style as the mechanism for gaining the benefits.
However, there is now the alternative of thewholesale competitivemarket, giving third-party
access via a transmission system for bidding energy resources to determine the system
marginal price for dispatch.Aswell as energy, there aremarkets developing in power reserve,
frequency control, black-start capability and voltage control. These will call for a more
precise ability to control the operation of the power systemand the advantages ofDCoverAC
in this respect will be a consideration for planners and developers. Unconstrained access,
under the transmission operators control will be vital in this world.
These benefits apply across the whole system, as long as they meet the objectives that load
demand is reliably served at minimum total system cost. However, they can often only be
obtainedwithin the framework of a power pool that coordinates planning and operations so that
Development of HVDC Technology 31
economies of scale, increases in reliability, and other ‘system’ benefits are achieved to the
extent practicable.
Technical Considerations. When independent, asynchronous systems are to be intercon-
nected, there are some configurations for which DC is the only solution or at least an interesting
alternative, for example, sea-cable interconnection. Normally with bulk power transmission,
whether an interconnection or not, there is a choice betweenAC andDC, and the determination
may in some cases be a matter of economics. In the case of DC a large investment is required in
terminal equipment for conversion, and this is mostly independent of the length of transmis-
sion. However, DC overhead lines are cheaper than AC lines for the same power transfer and
DC line losses are less than those for AC lines. Recent trends suggest that overhead line costs
are increasing at a higher rate than the costs of terminal equipment. This means that break-even
distances might reduce, that is the distance at which the overall cost (including losses) of AC
and DC alternatives are equal. However, there are twomore significant effects that increase the
break-even distance. One is that series compensation can reduce the effective length of a line
for stability and FACTS controllers (power electronics applied to the control of voltage and
power flow) can extend the range or capacity of AC systems. The other is the compact AC line,
which draws the phases closer together to lower the reactance and increase the shunt
capacitance and therefore improve the AC system’s capacity.
The break-even points of transmission cost between AC and DC taking into account the
investment and the operational losses depend strongly on the basis of the loss evaluation. From
the technical point of view neither the transmission distance nor the amount of power to be
transmitted is practically limited with DC.
The advantages of DC power transmission over ACpower transmission can be characterized
as follows.
Lower Insulation Class of the Line, so more Economical.Amaximum of DC voltage is only
1=ffiffiffi
2p
of maximum of AC voltage with the same RMS (Root Mean Square) value. So, it has a
significant advantage in terms of insulation. The number of supporting insulators andwires can
be significantly reduced and even the height of iron tower can be lowered, so that the overall
economical benefit is quite significant (Figure 1.23).
In the case of DC, the power factor is always 1 pu. It has great power transmission efficiency
(Figure 1.24).
DC power does not have an alternating imaginary part (Reactive Part) like AC power. So, no
reactive power is generated by the reactance. Since DC power transmission has more of real
power, which is used for the actual power consumption than AC power transmission, it has a
higher power transmission efficiency.
EmPeak
AC
DCtime
Em2
Figure 1.23 Comparison of maximum voltage for AC and DC.
32 HVDC Transmission
DC Power Transmission can use the earth as a conductor. This is more economical
compared to AC power transmission, which requires at least two wires or more. Thus, if it is
feasible to transmit power to the earth return path, then onemay omit the return path conductor.
Consequently, it is more useful in the region which requires a ROW (Right OfWay; iron tower
passage) (Figure 1.25).
Power Interchagers. BTB or PTP HVDC system have found application for power
interchange between AC systems which operate at different frequencies. An example is the
50 Hz/60 Hz Frequency converter at Sakuma, Japan. And an isolated generation configuration
arises when a generation complex are asynchronously connected to the receiving AC system
via an HVDC system. Also, if the generation complex is dispersed in an isolated generation
area, it is common to provide an power collection system to feed the HVDC system
(Figure 1.26).
krowteN zH05krowteN zH06
Figure 1.26 DC interconnection between systems with two different frequencies.
Cos θ
Apparent Power
Active Power
Reactive Power
(a)
No Apparent Power
Active Power
(b)
Power Angle (Cos θ) =1
0
Figure 1.24 Comparison of power factor for DC and AC.
Conductor/Cable/Earth/Sea Return
Figure 1.25 Mono-polar system using a single-line return path.
Development of HVDC Technology 33
Effects of separating AC systems by DC interconnection. Since DC power transmission
provides real power but not reactive power for the opposite system, the current inflow from the
neighboring system does not increase when the AC system breaks down. Consequently, it
creates a virtual effect of separating the two systems. So, by partitioning the existingAC system
into adequate sizes andmaking an interconnectionwith aDC system, then it may be possible to
effectively suppress the short-circuit current and to smoothly operate the entire system
(Figure 1.27).
Improvement of stability. Since it is possible to promptly control the power flow by
controlling the converter, the transient stability may be improved. The transient stability
refers to a degree of capability to maintain its stable condition and to continue a good power
transmission despite the sudden external impacts, such as open and short-circuit of transmis-
sion lines or ground-fault when the AC power system is being operated in a stable condition.
References
[1] HVDC Systems and their Planning, Siemens (1999).
[2] Economic Assessment of HVDC links, ELT_196_4, ELECTRA.