Page 1
Page 1 of 286
Development of in vitro
procedures that can better
predict the safety of
therapeutic monoclonal
antibodies
A thesis submitted by
Lucy Findlay
For the degree of Doctor of
Philosophy from University
College London
Eastman Dental Institute
Page 2
Page 2 of 286
I, Lucy Findlay confirm that the work presented in this thesis is my own. Where information has
been derived from other sources, I confirm that this has been indicated in the thesis. Some of
these other sources are joint publications with colleagues at NIBSC, copies of which are on the
enclosed CD. Information from this thesis constitutes most of the information presented in the
publications Findlay et al. (2010) and Findlay et al. (2011a). However, for the publications
Stebbings et al. (2007), Eastwood et al. (2010) and Findlay et al. (2011b), information from this
thesis constitutes only part of the information presented. In the text of this thesis, references are
made to these joint publications in cases where the information stated is not entirely my own
work and is presented in the joint publication.
Page 3
Page 3 of 286
Abstract
Pre-clinical safety testing (in vivo and in vitro) of the therapeutic monoclonal antibody
(mAb) TGN1412 (developed for the treatment of autoimmune diseases) failed to predict the life
threatening adverse events that occurred during its Phase I Clinical Trial. The treatment of
disease using mAb therapy is becoming increasingly common, so, to ensure the safety of mAbs,
pre-clinical safety tests that can better predict the toxicity of immunomodulatory mAbs, such as
TGN1412, are required. The aim of this study was to investigate the hypothesis that cytokine-
driven adverse effects of therapeutic monoclonal antibodies and the mechanisms involved can
be better predicted with novel in vitro procedures using human cells, given the failure of animal
models to predict the toxicity of TGN1412. Consistent with the results from pre-clinical testing,
aqueous phase TGN1412 incubated with human peripheral blood mononuclear cells (PBMC)
failed to stimulate the “cytokine storm” suffered by the six recipients of TGN1412. In contrast,
TGN1412 immobilised onto polypropylene microtitre plates by “air-drying” stimulated cytokine
release from PBMC. This technique was superior to other mAb immobilisation techniques,
investigated in terms of predicting cytokine release. Immobilisation of TGN1412 may mimic
the immunological synapse formed between this mAb and target cells in vivo. In a more
physiologically relevant procedure, TGN1412 incubated in aqueous phase with PBMC over a
monolayer of human endothelial cells stimulated cytokine release. Endothelial cell to PBMC
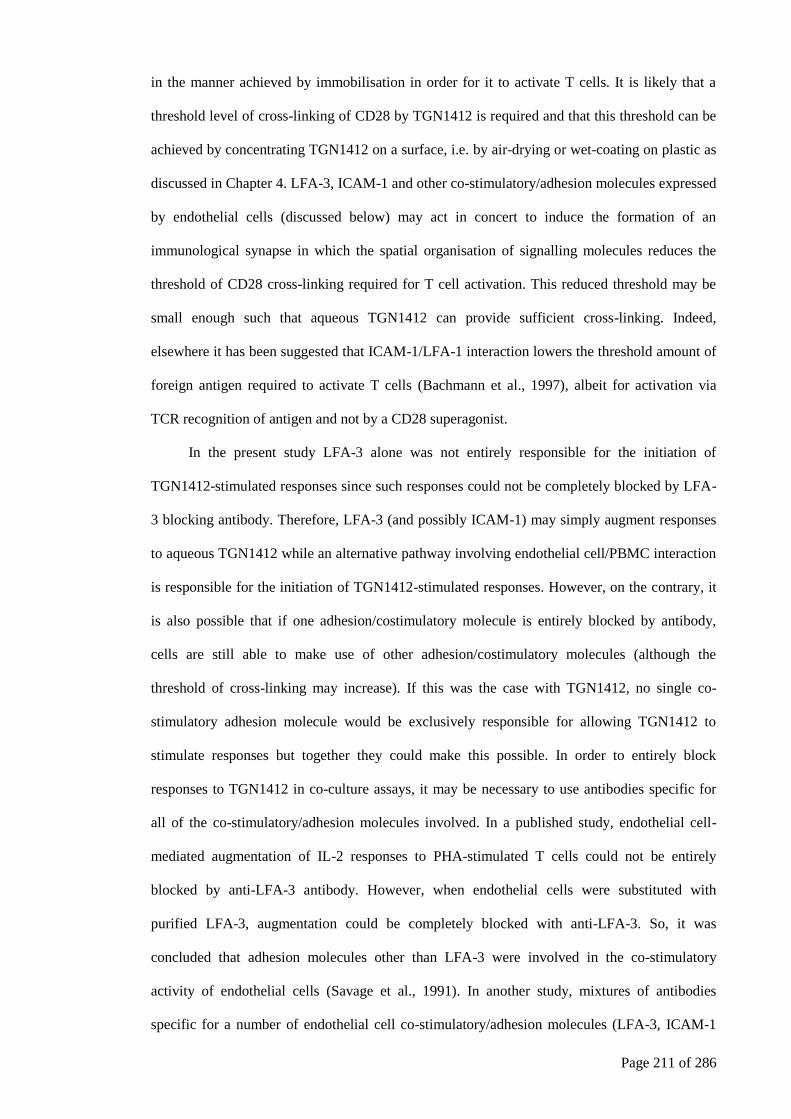
contact was crucial to these responses. Furthermore, interactions between lymphocyte function-
associated antigen-3 (LFA-3) and intercellular adhesion molecule-1 (ICAM-1) expressed by
endothelial cells with their counterstructures CD2 and LFA-1, respectively, expressed by T
cells, mediated these TGN1412-stimulated responses. Both procedures developed in this study
were capable of distinguishing therapeutic mAbs not associated with a significant incidence of
cytokine-driven clinical infusion reactions from mAbs frequently associated with clinical
infusion reactions.
Page 4
Page 4 of 286
Acknowledgements
I would like to thank my supervisors Dr Stephen Poole and Professor Brian Henderson
for their advice, support, encouragement and never-failing optimism throughout this project's
development. I would also like to thank both supervisors and Dr Robin Thorpe and Dr Susan
Thorpe for their critical reading of this thesis.
I would further like to acknowledge the support of the National Institute for Biological
Standards and Control (NIBSC) for the funding of this project and the following people from
NIBSC: Dr Jane Robinson for her continued advice on culturing endothelial cells and for
providing HUVECjr2, Dr Chris Burns for his help with RT-PCR, Chris Ball for her continued
advice in the lab, Chris Bird and Paula Dilger for their support with cell-proliferation
experiments, David Eastwood for his help with flow cytometry, Alan Heath for his advice on
statistics, Dr Susan Thorpe, Chris Ball and John Hogwood for their help with obtaining
umbilical cords, my colleagues at NIBSC who kindly donated blood for this study and the
NIBSC phlebotomists. I would also like to thank the following people for their helpful friendly
discussions: Dr Susan Thorpe, Dr Robin Thorpe, Dr Richard Stebbings, Chris Ball, Giles Sharp,
Bernard Fox, Yogesh Mistry, David Eastwood and Dr Meenu Wadhwa.
External to NIBSC, I would like to thank the umbilical cord donors and the staff at QEII
Hospital, Welwyn Garden City and at Rochdale Infirmary involved in collecting the cords and
Professor Andrew George (Imperial College, London) for making it possible for us to conduct
experiments using fresh saphenous vein endothelial cells.
On a personal note, I would like to thank my friends for their patience with me being
rudely anti-social. Finally I would like to thank my husband Jeff for his continued patience and
support throughout the duration of this study, my daughter Ella for keeping my mind in the real
world and for her never-failing ability to make me smile and my family and in-laws for their
support and optimism.
Page 5
Page 5 of 286
Contents
Abstract .......................................................................................................................................... 3
Acknowledgements ........................................................................................................................ 4
Contents ......................................................................................................................................... 5
List of Figures .............................................................................................................................. 11
List of Tables ............................................................................................................................... 17
Abbreviations ............................................................................................................................... 19
CHAPTER 1: General introduction ............................................................................................. 24
1.1 Brief ................................................................................................................................ 24
1.2 Therapeutic mAbs ........................................................................................................... 25
1.2.1 Structure of therapeutic mAbs ................................................................................. 25
1.2.2 Modes of action of therapeutic mAbs ..................................................................... 27
1.2.3 Clinical infusion reactions caused by therapeutic mAbs ......................................... 29
1.3 Therapeutic mAb TGN1412 ........................................................................................... 35
1.4 Review of T cell activation ............................................................................................. 36
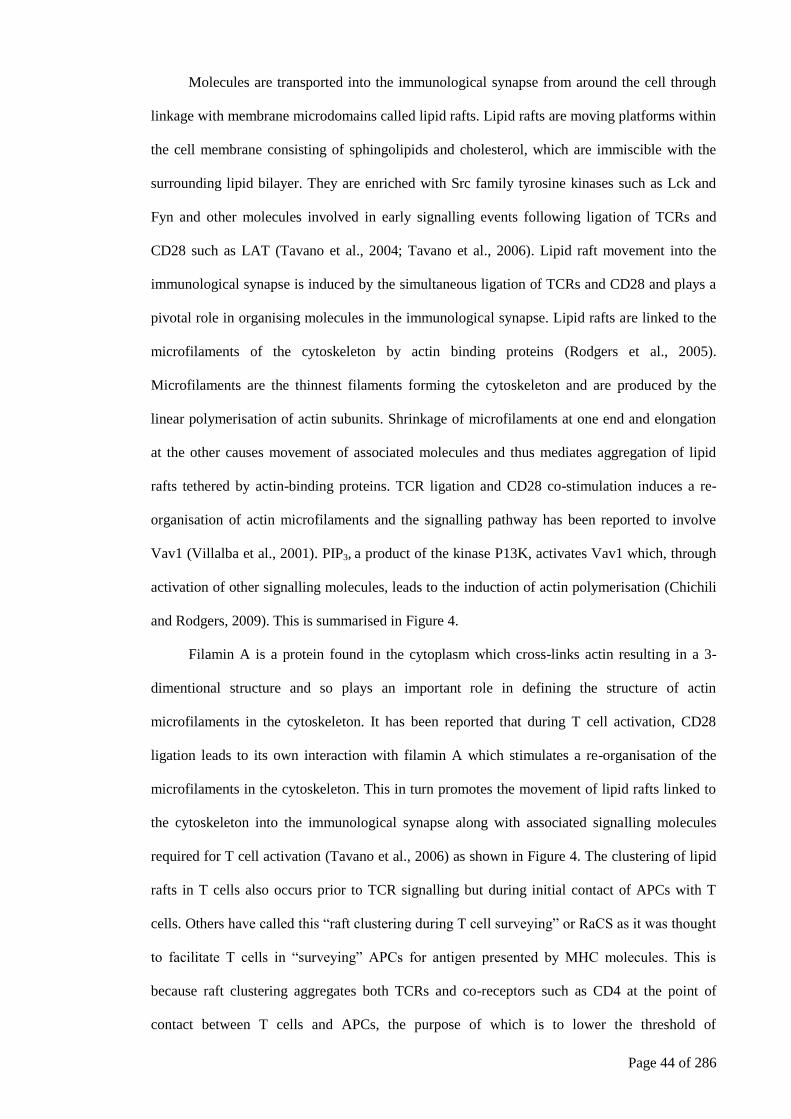
1.4.1 Conventional T cell activation involving the co-stimulatory receptor CD28 .......... 36
1.4.2 Signalling events during CD28 co-stimulation ....................................................... 37
1.4.3 The immunological synapse .................................................................................... 41
1.5 Summary of T cell responses following activation ......................................................... 45
1.6 Superagonistic anti-CD28 antibodies.............................................................................. 47
1.6.1 Mode of action at the membrane surface................................................................. 47
1.6.2 Signalling events following CD28 superagonist activation .................................... 50
1.7 Intended therapeutic use of TGN1412 ............................................................................ 51
1.8 Pre-clinical testing to predict TGN1412 toxicity ............................................................ 56
1.9 Phase I clinical trial of TGN1412 ................................................................................... 59
1.10 Events following the TGN1412 clinical trial .................................................................. 62
1.11 Aims of study .................................................................................................................. 63
CHAPTER 2: General methods ................................................................................................... 68
Page 6
Page 6 of 286
2.1 General information ........................................................................................................ 68
2.2 Blood donation and isolation of PBMC .......................................................................... 68
2.3 Cell counts ...................................................................................................................... 70
2.4 Measurement of TNF , IL-6, IL-8, IL-2 and IFNγ by Enzyme Linked
Immunosorbent Assay (ELISA) ..................................................................................... 71
2.5 Measurement of cell proliferation by 3H-thymidine incorporation ................................ 73
2.6 Monoclonal antibodies .................................................................................................... 73
CHAPTER 3: Conventional in vitro procedures are not predictive of the clinical effects of
TGN1412 ..................................................................................................................................... 76
3.1 Introduction ..................................................................................................................... 76
3.2 Methods .......................................................................................................................... 77
3.2.1 Rationale for TGN1412 Doses Tested .................................................................... 77
3.2.2 Cytokine release assay using PBMC ....................................................................... 78
3.2.3 Cytokine release assay using whole blood .............................................................. 78
3.3 Results ............................................................................................................................. 78
3.4 Discussion ....................................................................................................................... 81
CHAPTER 4: Development of antibody immobilisation techniques to predict the clinical
effects of TGN1412 and other therapeutic mAbs ........................................................................ 85
4.1 Introduction ..................................................................................................................... 85
4.2 Methods .......................................................................................................................... 87
4.2.1 Comparison of cytokine responses of PBMC and diluted whole blood to
TGN1412 added as an aqueous solution or immobilised by air-drying or wet-
coating onto polypropylene and polystyrene culture plates .................................... 87
4.2.2 Comparison of cytokine responses of PBMC to TGN1412 immobilised by
air-drying and warm-air drying ............................................................................... 88
4.2.3 Effect of different coating methods on the total amount of TGN1412
immobilised onto plates ........................................................................................... 89
Page 7
Page 7 of 286
4.2.4 Effect of different coating methods on the quantity of TGN1412
immobilised onto plates and (correctly) orientated such that it was able to
bind a CD28 fusion protein ..................................................................................... 89
4.2.5 Interference by aqueous TGN1412 of cytokine responses of PBMC to
immobilised TGN1412 ............................................................................................ 90
4.2.6 Detection of early cytokine responses to immobilised TGN1412 using
quantitative reverse-transcription polymerase chain reaction (RT-PCR) and
by ELISA ................................................................................................................. 91
4.2.7 Comparison of cytokine responses of PBMC to mAbs other than TGN1412
added as aqueous solutions or immobilised by air-drying or wet-coating onto
polypropylene and polystyrene culture plates ......................................................... 98
4.3 Results ............................................................................................................................. 98
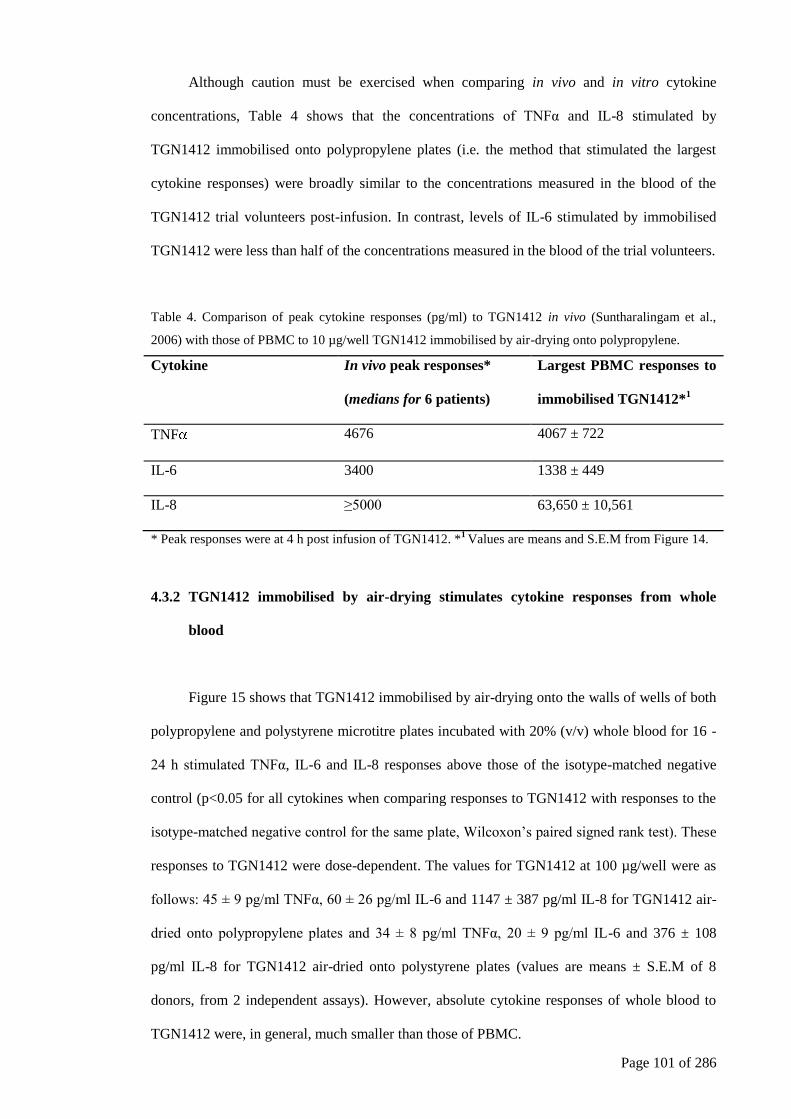
4.3.1 TGN1412 immobilised by air-drying stimulates the largest cytokine
responses from PBMC ............................................................................................. 98
4.3.2 TGN1412 immobilised by air-drying stimulates cytokine responses from
whole blood ........................................................................................................... 101
4.3.3 Two different methods for air-drying TGN1412 onto polypropylene
microtitre plates give very similar cytokine responses .......................................... 103
4.3.4 Different coating methods, using different types of microtitre plate, affect
the quantity and quality of TGN1412 that remains immobilised .......................... 104
4.3.5 Aqueous TGN1412 inhibits cytokine responses of PBMC to immobilised
TGN1412 ............................................................................................................... 107
4.3.6 Early TNF , IL-6 and IL-8 gene expression and cytokine responses of
PBMC to immobilised TGN1412 measured by quantitative RT-PCR and by
ELISA respectively ............................................................................................... 109
4.3.7 TNFα responses of PBMC to immobilised mAbs in addition to TGN1412 ......... 112
4.4 Discussion ..................................................................................................................... 115
CHAPTER 5: The development of a method that can predict the clinical effects of
TGN1412 in aqueous phase ....................................................................................................... 123
Page 8
Page 8 of 286
5.1 Introduction ................................................................................................................... 123
5.2 Methods ........................................................................................................................ 124
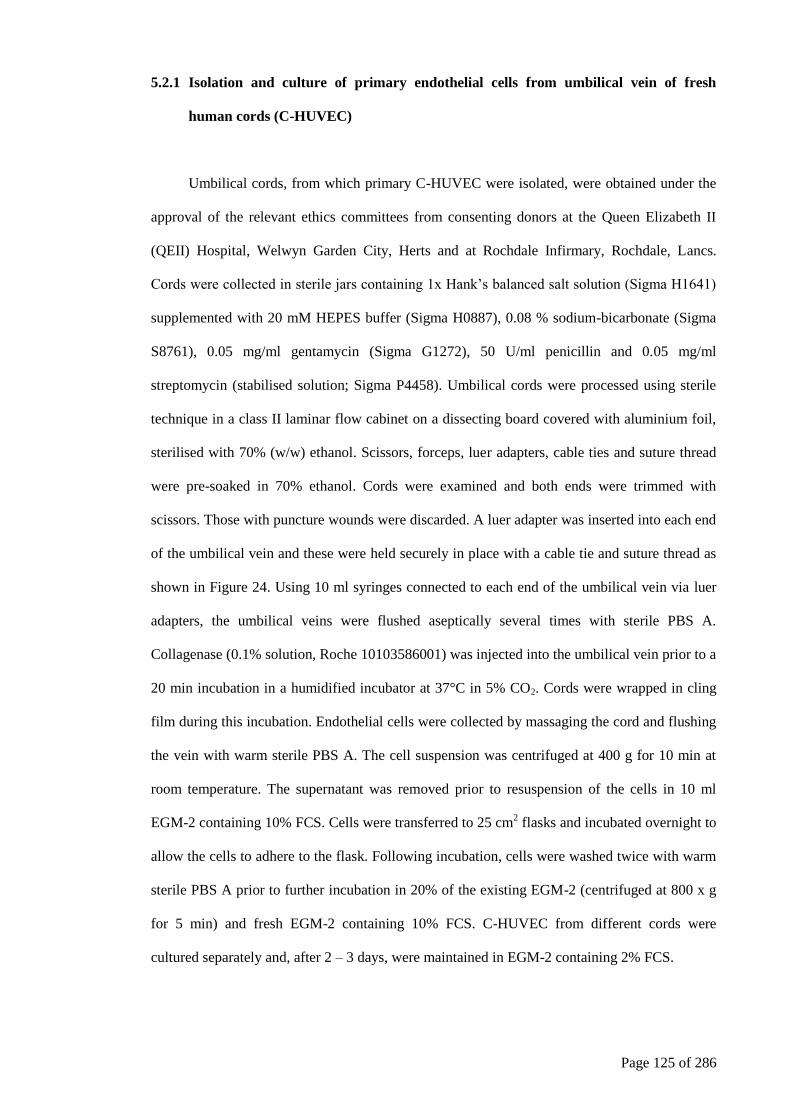
5.2.1 Isolation and culture of primary endothelial cells from umbilical vein of
fresh human cords (C-HUVEC) ............................................................................ 125
5.2.2 Culture of human umbilical vein endothelium derived cells - HUVECjr2 and
HUVECyn ............................................................................................................. 126
5.2.3 Culture of human saphenous vein endothelial cells (HSVEC) .............................. 127
5.2.4 Co-culture assays (endothelial cells and PBMC) .................................................. 128
5.2.5 Co-culture assays (endothelial cells and diluted whole blood) ............................. 130
5.2.6 Statistical analyses ................................................................................................. 130
5.3 Results ........................................................................................................................... 130
5.3.1 The effect of co-culturing PBMC over a monolayer of C-HUVEC on TNF ,
IL-2, IL-6, IL-8 and cell proliferative responses to TGN1412 .............................. 130
5.3.2 The effect of co-culturing PBMC over a monolayer of HUVECyn on TNF ,
IL-6 and IL-8 responses to TGN1412 ................................................................... 131
5.3.3 Comparison of the capability of primary endothelial cells (C-HUVEC) with
endothelium derived cells (HUVECjr2) to mediate TGN1412-induced
cytokine and cell proliferative responses in co-culture assays with PBMC. ......... 132
5.3.4 The effect of co-culturing human whole blood over a monolayer of
HUVECjr2 on TNF , IL-6 and IL-8 responses to TGN1412 ............................... 136
5.3.5 The effect of different serum/plasma supplements on cytokine and cell
proliferative responses to TGN1412 in co-culture assays ..................................... 136
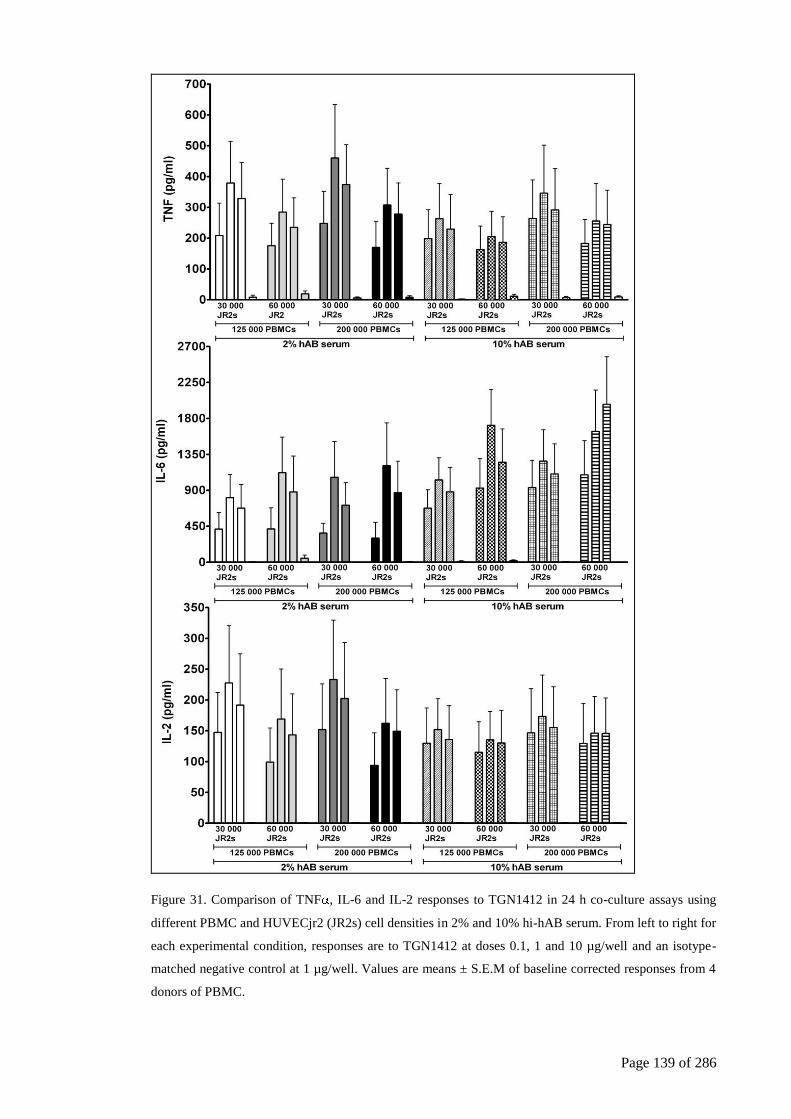
5.3.6 The effect of cell density on cytokine responses to TGN1412 in co-culture
assays ..................................................................................................................... 138
5.3.7 The effect of human AB serum concentration on cytokine responses to
TGN1412 in co-culture experiments ..................................................................... 140
5.3.8 The effect of co-culturing PBMC over a monolayer of Human Saphenous
Vein Endothelial Cells (HSVECs) on TNF , IL-6 and IL-8 responses to
TGN1412 ............................................................................................................... 141
Page 9
Page 9 of 286
5.4 Discussion ..................................................................................................................... 142
CHAPTER 6: Investigation of the mechanisms underlying responses to TGN1412 in co-
culture assays ............................................................................................................................. 153
6.1 Introduction ................................................................................................................... 153
6.2 Methods ........................................................................................................................ 162
6.2.1 Transwell experiments .......................................................................................... 163
6.2.2 Co-culture assays involving conventional CD28 agonistic antibody .................... 166
6.2.3 Co-culture assays to investigate TGN1412-immobilisation by HUVECjr2 .......... 166
6.2.4 Flow cytometric analysis of LFA-3 expression by HUVECjr2 and PBMC .......... 166
6.2.5 Co-cultures involving blocking antibodies ............................................................ 168
6.2.6 Antibody immobilisation assays involving blocking antibodies ........................... 170
6.2.7 Fibroblast culture ................................................................................................... 171
6.2.8 Co-culture assays involving PBMC and fibroblasts as the monolayer.................. 171
6.2.9 Stimulation by TNF of IL-6 release from HUVEC ............................................ 172
6.2.10 Statistical analyses ................................................................................................. 172
6.3 Results ........................................................................................................................... 173
6.3.1 Effects of endothelial cell to PBMC contact on IL-6 responses stimulated by
TGN1412 ............................................................................................................... 173
6.3.2 Effect of endothelial cell to PBMC contact on TNF and IL-2 responses to
TGN1412 in co-culture assays .............................................................................. 179
6.3.3 Comparison of cytokine and cell proliferative responses to superagonistic
and agonistic anti-CD28 mAbs in co-cultures of PBMC and C-HUVEC ............. 180
6.3.4 Cytokine and cell proliferative responses to TGN1412 pulsed with
endothelial cells prior to the addition of PBMC in co-culture assays ................... 182
6.3.5 Inhibitory affects of LFA-3 blocking antibody on responses to TGN1412........... 183
6.3.6 Inhibitory affects of ICAM-1 blocking antibody on cell proliferative
responses to TGN1412. ......................................................................................... 190
6.3.7 Inhibitory effects of 4 integrin blocking antibody (Tysabri) on responses to
a TGN1412 analogue in co-culture assays ............................................................ 192
Page 10
Page 10 of 286
6.3.8 Inhibitory effects of an anti-human IL-2 antibody on cell proliferative
responses to TGN1412 in co-culture assays .......................................................... 194
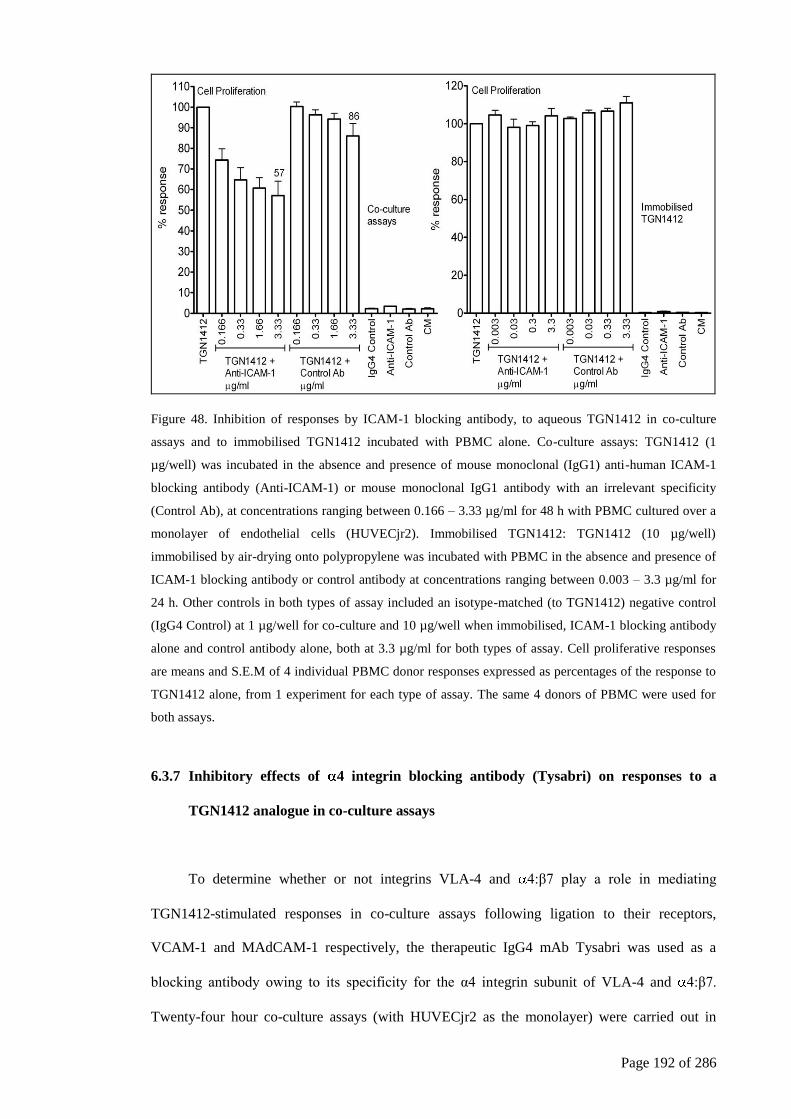
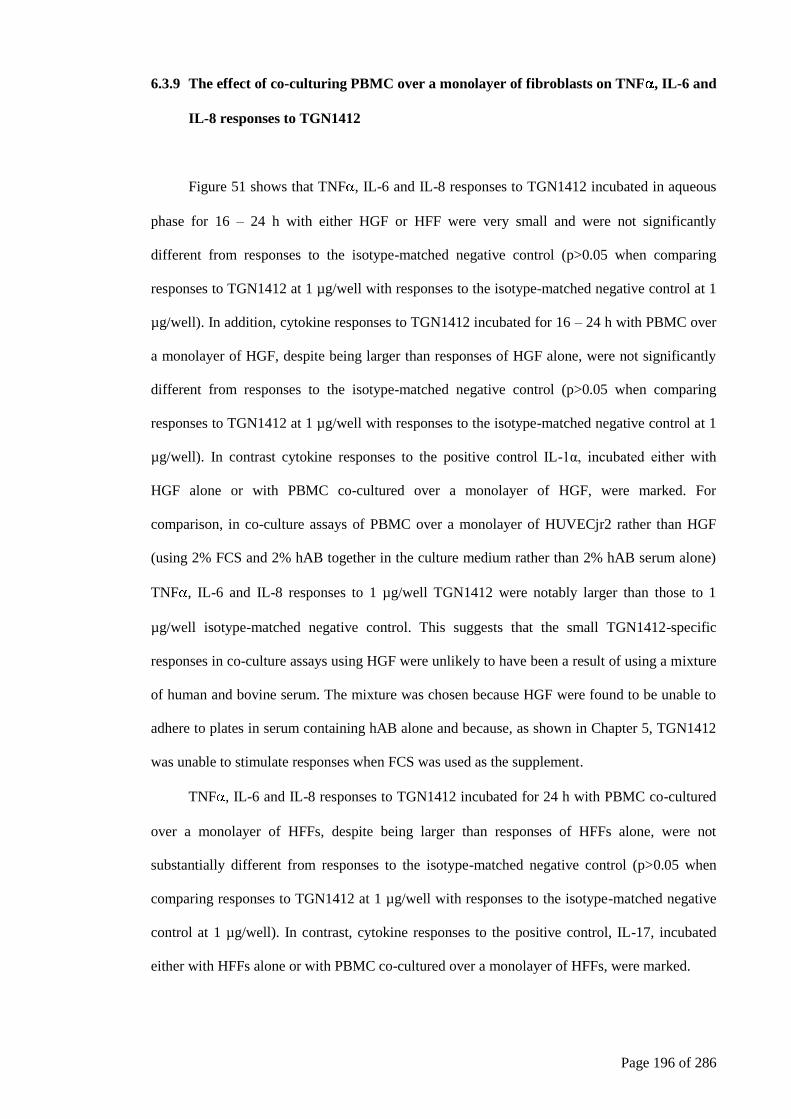
6.3.9 The effect of co-culturing PBMC over a monolayer of fibroblasts on TNF ,
IL-6 and IL-8 responses to TGN1412 ................................................................... 196
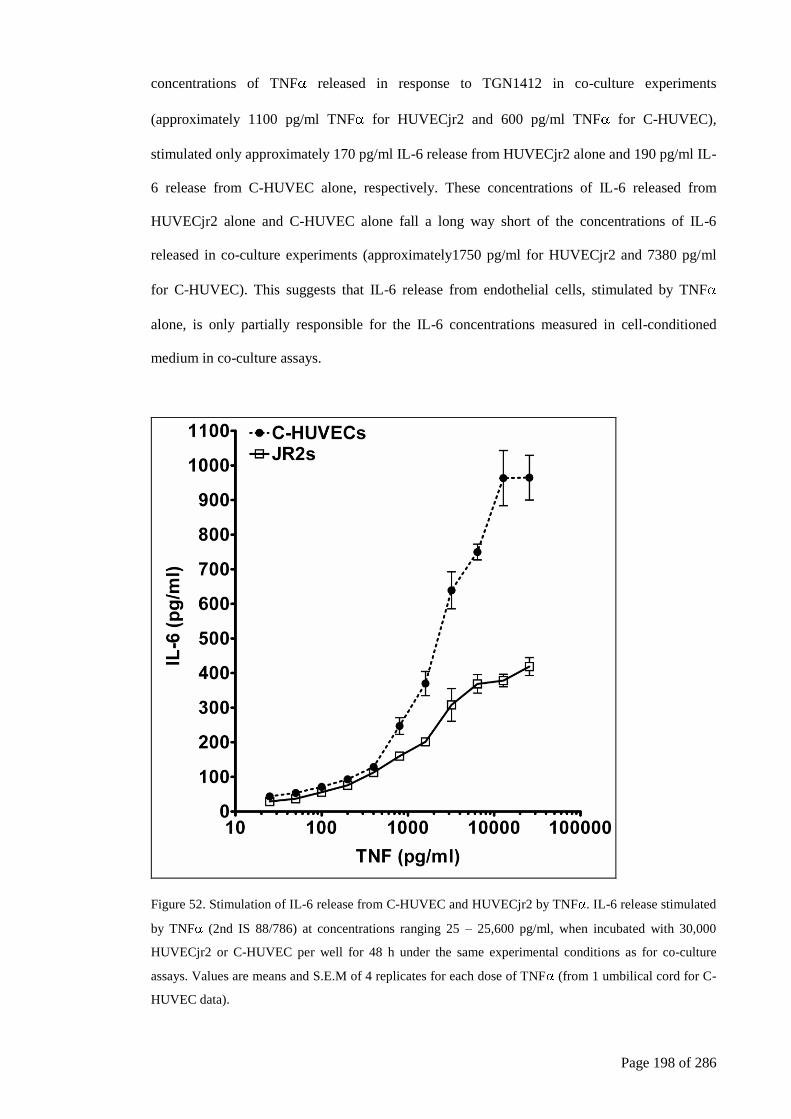
6.3.10 Stimulation by TNF of IL-6 release from human umbilical vein endothelial
cells. ....................................................................................................................... 197
6.4 Discussion ..................................................................................................................... 199
6.4.1 The role of PBMC to endothelial cell contact in mediating TGN1412-
stimulated responses .............................................................................................. 199
6.4.2 The role of allogeneic MHC Class II antigens expressed by endothelial cells
in mediating TGN1412-stimulated responses ....................................................... 200
6.4.3 The role of TGN1412 immobilisation by endothelial cells in mediating
TGN1412-stimulated responses ............................................................................ 202
6.4.4 The role of adhesion molecules in mediating TGN1412-stimulated responses .... 203
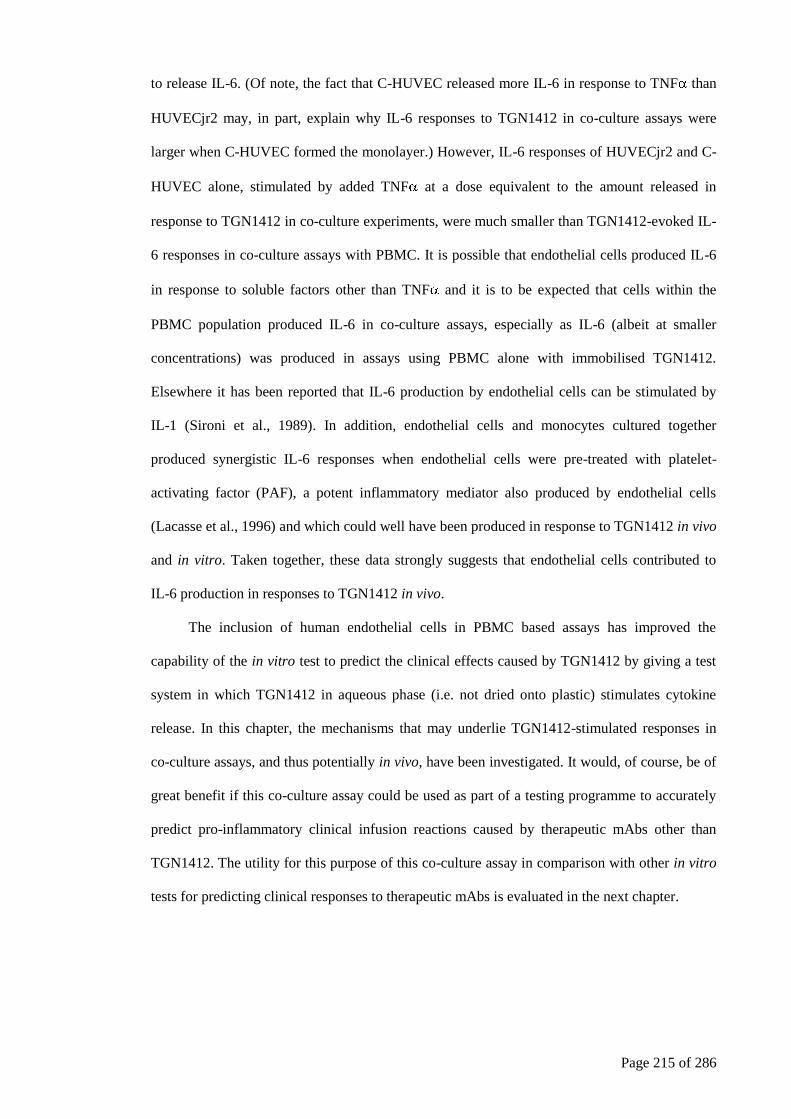
6.4.5 TGN1412-stimulated IL-6 release in co-culture assays is, at least in part,
from HUVEC ........................................................................................................ 214
CHAPTER 7: Comparison of novel methods for predicting the risk of pro-inflammatory
clinical infusion reactions during mAb therapy ......................................................................... 217
7.1 Introduction ................................................................................................................... 217
7.2 Methods ........................................................................................................................ 218
7.2.1 Monoclonal antibodies .......................................................................................... 218
7.2.2 General procedures ................................................................................................ 218
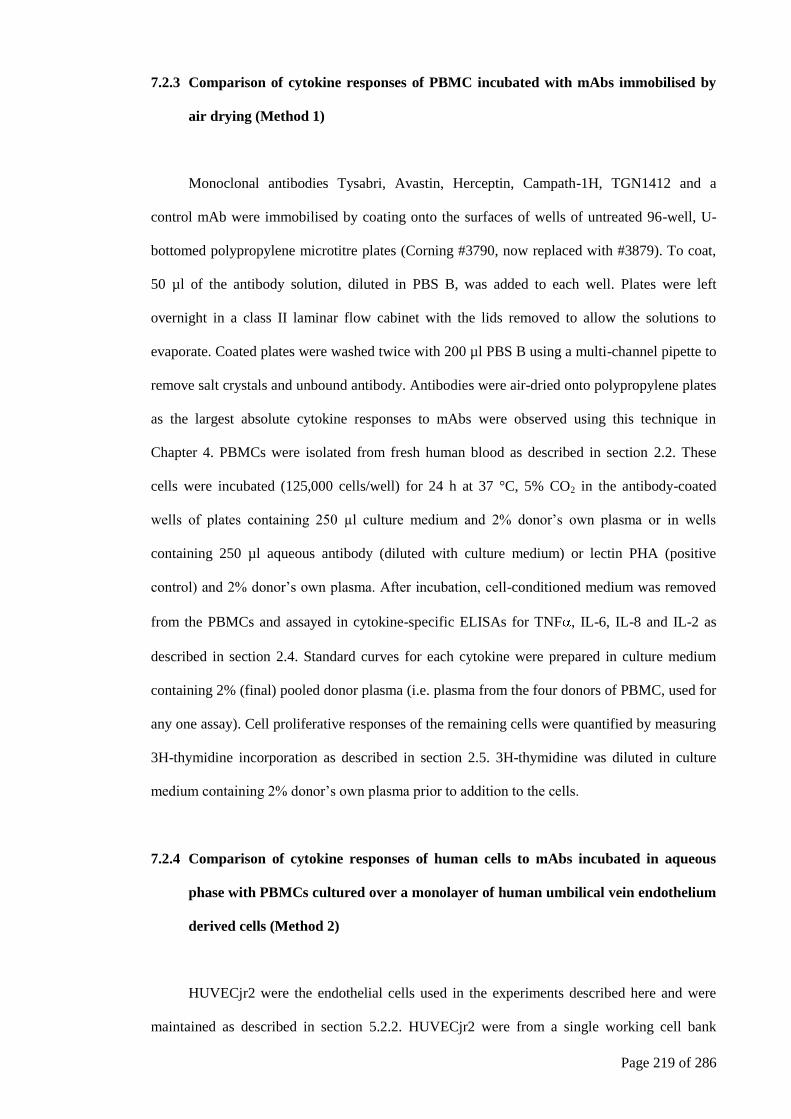
7.2.3 Comparison of cytokine responses of PBMC incubated with mAbs
immobilised by air drying (Method 1) .................................................................. 219
7.2.4 Comparison of cytokine responses of human cells to mAbs incubated in
aqueous phase with PBMCs cultured over a monolayer of human umbilical
vein endothelium derived cells (Method 2) ........................................................... 219
7.3 Results ........................................................................................................................... 220
Page 11
Page 11 of 286
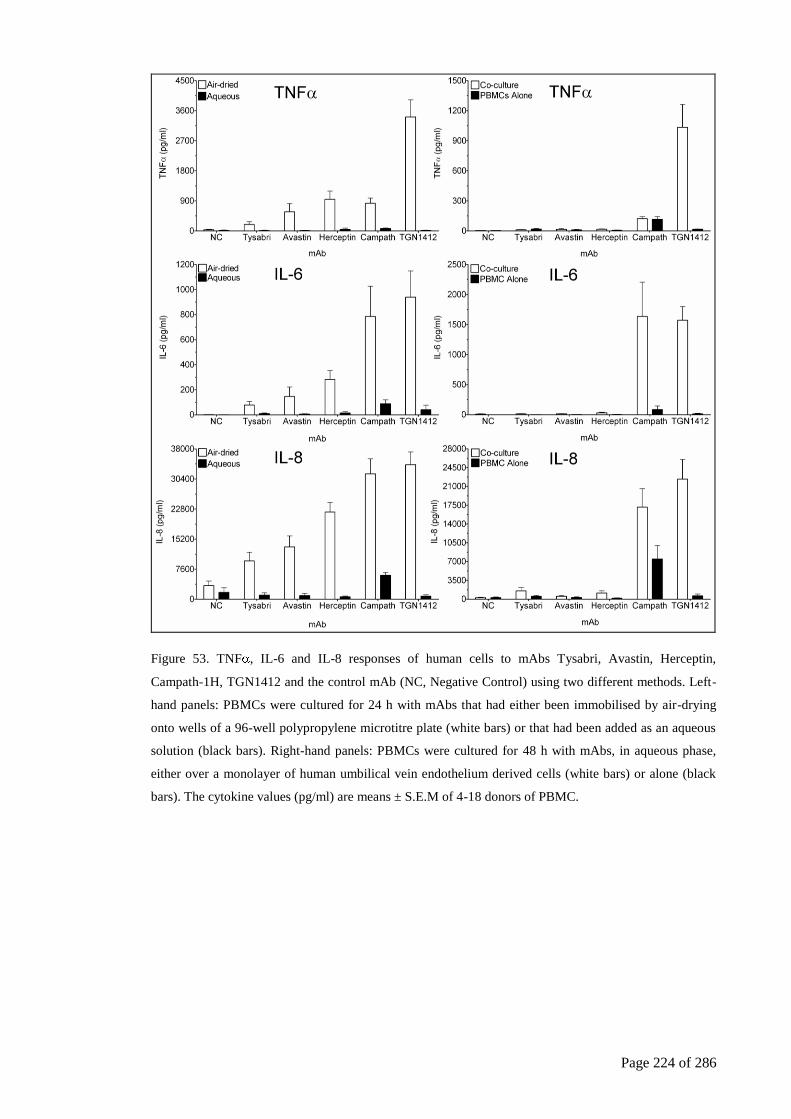
7.3.1 TNF , IL-6 and IL-8 responses for Method 1: antibody immobilisation by
air-drying ............................................................................................................... 221
7.3.2 TNF , IL-6 and IL-8 responses for Method 2: co-culture of PBMCs over a
monolayer of human umbilical vein endothelium-derived cells ........................... 222
7.3.3 IL-2 and cell proliferative responses to mAbs for Methods 1 (antibody
immobilisation) and 2 (co-culture) ........................................................................ 225
7.4 Discussion ..................................................................................................................... 226
CHAPTER 8: General discussion and conclusions ................................................................... 231
8.1 Failure of pre-clinical tests to predict the clinical effects of TGN1412 ........................ 231
8.2 Monoclonal antibody immobilisation ........................................................................... 232
8.3 The co-culture method .................................................................................................. 236
8.4 Other studies involving TGN1412 following its clinical trial ...................................... 243
8.5 Conclusions ................................................................................................................... 248
8.6 Summary of key findings from the present study ......................................................... 251
8.6.1 Antibody immobilisation experiments .................................................................. 251
8.6.2 Co-culture experiments ......................................................................................... 251
8.7 Future studies ................................................................................................................ 253
References .................................................................................................................................. 255
Appendix I ................................................................................................................................. 282
Appendix II ................................................................................................................................ 286
Publications on CD enclosed
Page 12
Page 12 of 286
List of Figures
Figure 1. TGN1412 clinical trial disaster reported by the BBC ................................................. 24
Figure 2. Structure of a mAb (IgG) ............................................................................................. 26
Figure 3. Structure of the TCR-CD3 complex ............................................................................ 38
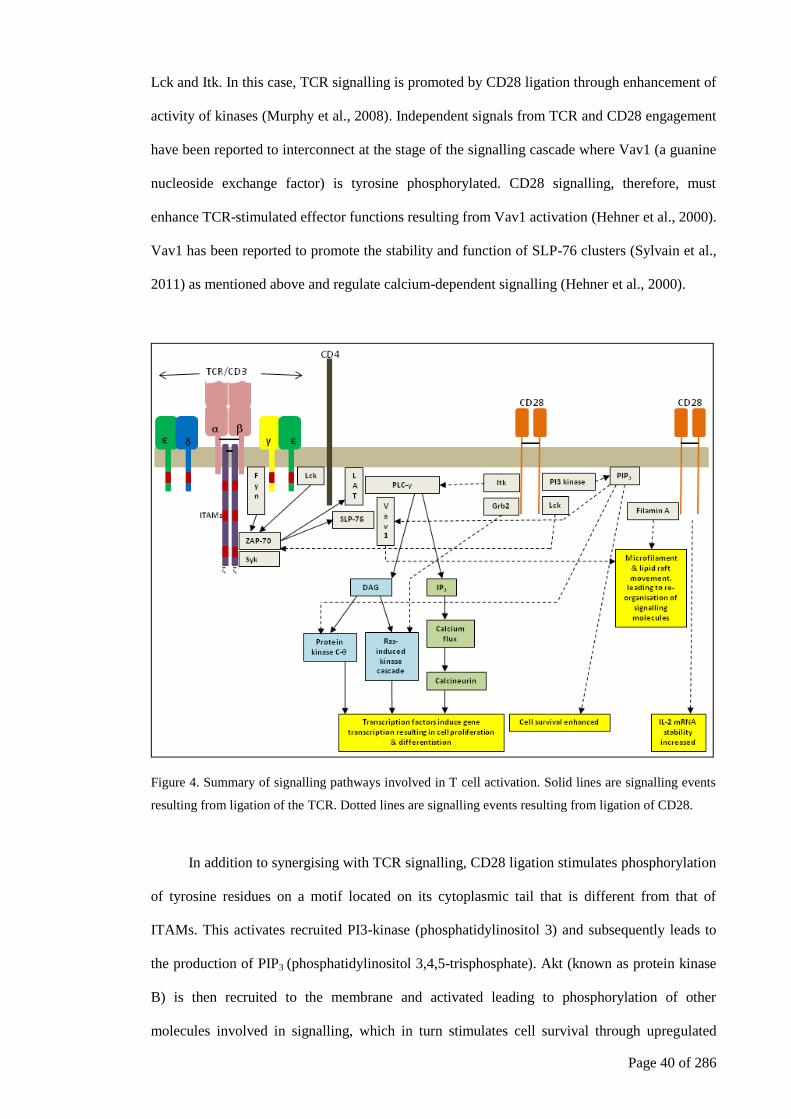
Figure 4. Summary of signalling pathways involved in T cell activation. .................................. 40
Figure 5. Simplified illustration of an immunological synapse. ................................................. 42
Figure 6. T cell activation by conventional and superagonistic anti-CD28 mAbs. .................... 48
Figure 7. Linear complex formation by superagonistic anti-CD28 mAbs .................................. 49
Figure 8. Anti-CD28 superagonist therapy restores a balance between regulatory T cell
and self reactive T cell number and function in autoimmunity. ................................................. 54
Figure 9. Clinical effect of TGN1412: tissue necrosis in fingers of the most seriously
affected TGN1412 clinical trial volunteer as a result of disseminated intravascular
coagulation .................................................................................................................................. 60
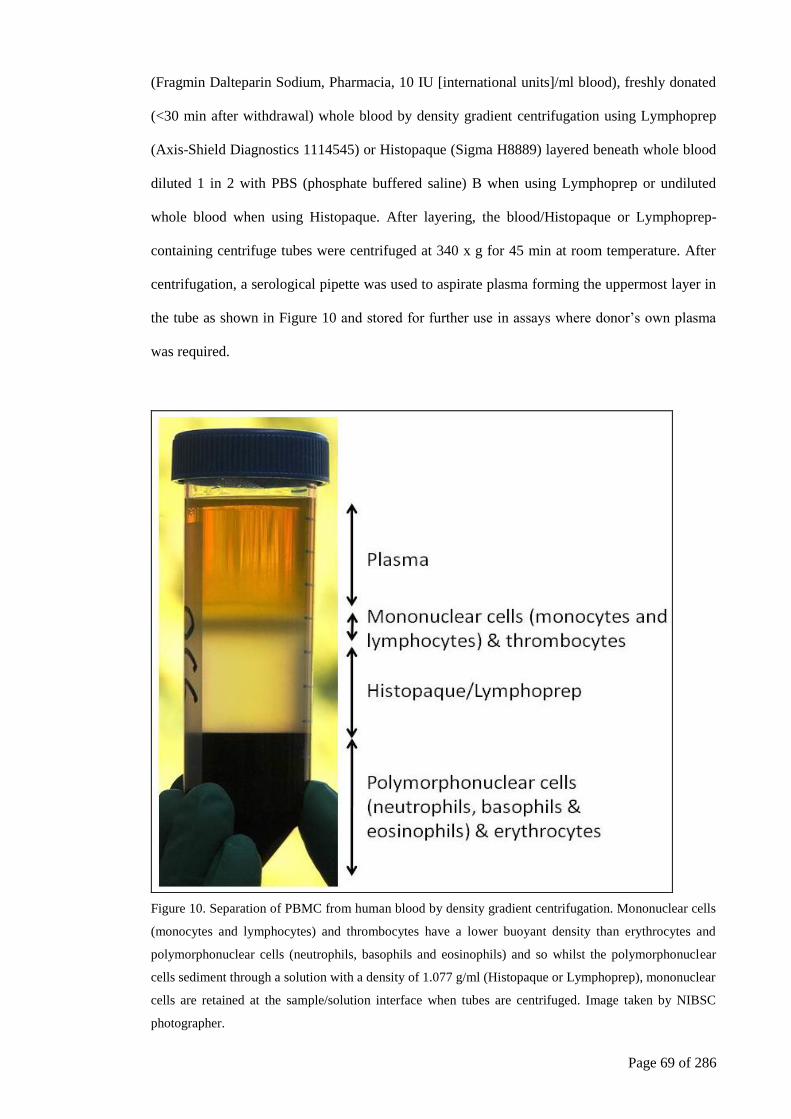
Figure 10. Separation of PBMC from human blood by density gradient centrifugation ............ 69
Figure 11. Cytokine responses (pg/ml) of PBMC and whole blood (20% v/v) from human
donors to aqueous TGN1412. ..................................................................................................... 80
Figure 12. Effect of TGN1412 in the detection of cytokines by cytokine-specific ELISAs ...... 81
Figure 13. Interaction of immobilised and aqueous phase (soluble) TGN1412 with T
cells. ............................................................................................................................................ 85
Figure 14. Cytokine responses of PBMC to TGN1412 either immobilised onto wells of
microtitre plates or added as an aqueous solution ..................................................................... 100
Page 13
Page 13 of 286
Figure 15. Cytokine responses of 20% (v/v) human whole blood to TGN1412
immobilised by coating using the air-drying method onto either polypropylene or
polystyrene microtitre plates ..................................................................................................... 102
Figure 16. Cytokine responses of PBMC to TGN1412 air-dried onto walls of wells of
microtitre plates by two different methods ............................................................................... 104
Figure 17. The effects of different coating methods on the amount and orientation of
TGN1412 bound to wells of 96-well microtitre plates ............................................................. 106
Figure 18. Inhibition of cytokine responses of PBMC to immobilised TGN1412, caused
by aqueous TGN1412. .............................................................................................................. 108
Figure 19. Early TNF , IL-6 and IL-8 gene expression by PBMC (panel A) and cytokine
responses (panel B) to immobilised TGN1412 ......................................................................... 111
Figure 20. Typical TNF , IL-6, IL-8 and GAPDH PCR product melting profiles from
melt curve analyses ................................................................................................................... 112
Figure 21. TNFα responses of PBMC to mAbs either immobilised onto wells of
microtitre plates or added as an aqueous solution ..................................................................... 113
Figure 22. TNFα responses of PBMC to mAbs either immobilised onto wells of
microtitre plates or added as an aqueous solution. .................................................................... 114
Figure 23. Co-culture: PBMC over a monolayer of endothelial cells. ...................................... 124
Figure 24. Isolation of endothelial cells from human umbilical vein. ...................................... 126
Figure 25. The effect of co-culturing PBMC over a monolayer of C-HUVEC on TNF ,
IL-6, IL-8, IL-2 and cell proliferative responses to TGN1412 ................................................. 131
Figure 26. The effect of co-culturing PBMC over a monolayer of human umbilical vein
endothelial cells (HUVECyn) on TNF , IL-6 and IL-8 responses to TGN1412 ..................... 132
Page 14
Page 14 of 286
Figure 27. Comparison of human umbilical vein endothelial cells of different origins on
their capability to interact with PBMCs to support cytokine and cell proliferative
responses to aqueous TGN1412 when incubated with human PBMC...................................... 134
Figure 28. Typical appearance of C-HUVEC and HUVECjr2 cultured in 75 cm2 flasks in
EGM-2 culture medium containing 2% FCS ............................................................................ 135
Figure 29. Comparison of cytokine responses to TGN1412 in co-culture assays using
either hi-FCS or hi-hAB serum as the supplement. .................................................................. 137
Figure 30. Effects of different types of sera on the detection of TNFα, IL-6 and IL-2 by
ELISA. ...................................................................................................................................... 138
Figure 31. Comparison of TNF , IL-6 and IL-2 responses to TGN1412 in 24 h co-culture
assays using different PBMC and HUVECjr2 (JR2s) cell densities in 2% and 10% hi-
hAB serum. ............................................................................................................................... 139
Figure 32. Comparison of TNF , IL-6 and IL-2 responses to TGN1412 in co-culture
assays using different concentrations hi-hAB serum.. .............................................................. 140
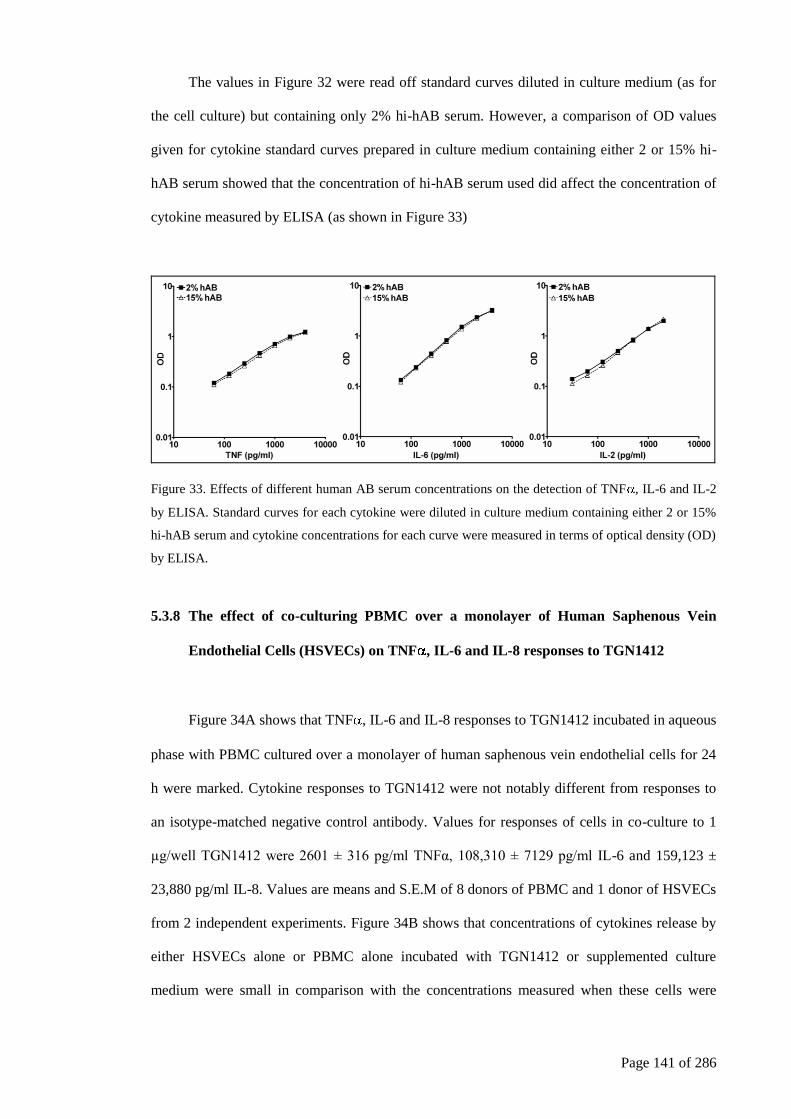
Figure 33. Effects of different human AB serum concentrations on the detection of
TNF , IL-6 and IL-2 by ELISA. .............................................................................................. 141
Figure 34. The effect of co-culturing PBMC over a monolayer of human saphenous vein
endothelial cells (HSVECs) on TNF , IL-6 and IL-8 responses to TGN1412......................... 142
Figure 35. Illustration of three possible roles of endothelial cells in mediating aqueous
TGN1412-stimulated T cell responses in co-culture assays ..................................................... 161
Figure 36. Simplified illustration of a Corning Transwell system ............................................ 163
Figure 37. Effect of endothelial cell (EC) to PBMC contact on IL-6 responses to
TGN1412 in 24 h co-culture assays. ......................................................................................... 174
Page 15
Page 15 of 286
Figure 38. Capability of IL-6 to pass through the porous membrane in a transwell plate in
the presence of PBMC and endothelial cells above and below the membrane respectively ..... 176
Figure 39. Effect of mixing (to achieve a homogenous environment within the well) on
IL-6 responses to TGN1412 in 24 h co-culture assays in the absence and presence of
endothelial cell (EC) to PBMC contact. .................................................................................... 178
Figure 40. Effect of endothelial cell (EC) to PBMC contact on TNF (left panel) and IL-2
(right panel) responses to TGN1412 in 24 h co-culture assays. ............................................... 180
Figure 41. TNF , IL-6, IL-2 and cell proliferative responses to superagonistic
(TGN1412) and agonistic anti-CD28 mAbs and a negative control mAb (NC, 1 µg/well)
in 48 h co-cultures of PBMC and C-HUVEC ........................................................................... 182
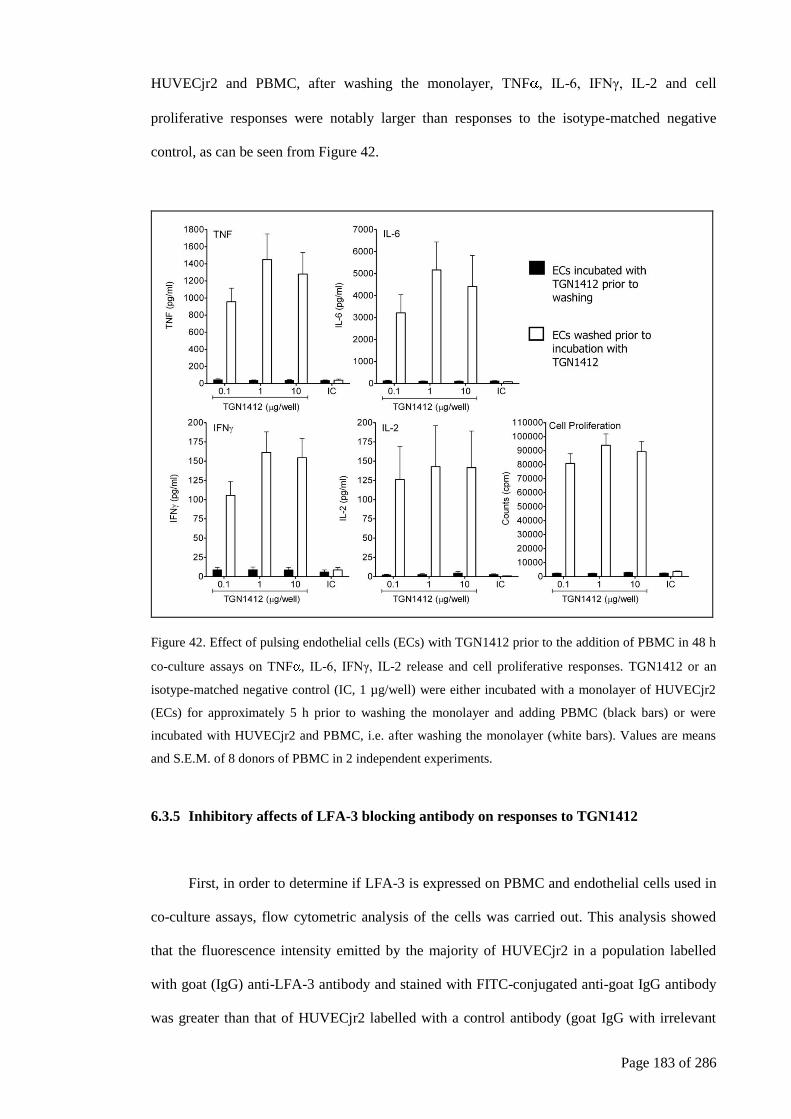
Figure 42. Effect of pulsing endothelial cells (ECs) with TGN1412 prior to the addition of
PBMC in 48 h co-culture assays on TNF , IL-6, IFNγ, IL-2 release and cell proliferative
responses ................................................................................................................................... 183
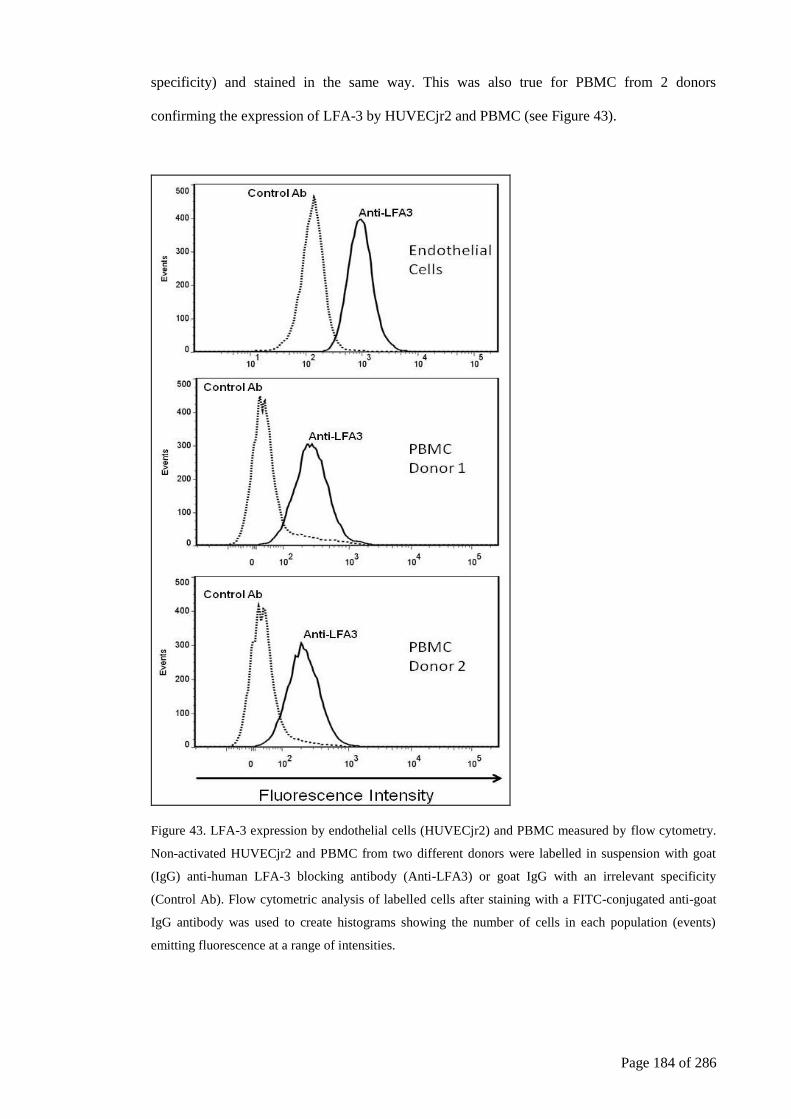
Figure 43. LFA-3 expression by endothelial cells (HUVECjr2) and PBMC measured by
flow cytometry .......................................................................................................................... 184
Figure 44. Inhibition of TGN1412-stimulated responses by LFA-3 blocking antibody in
co-culture assays. ...................................................................................................................... 186
Figure 45. Effect of LFA-3 blocking antibody over a 3-log dose range on responses to
TGN1412 in co-culture assays .................................................................................................. 187
Figure 46. Effect of LFA-3 blocking antibody and control antibody on the detection of
cytokines by cytokine-specific ELISAs .................................................................................... 188
Figure 47. Effects of LFA-3 blocking antibody on PBMC responses to immobilised
TGN1412 .................................................................................................................................. 189
Page 16
Page 16 of 286
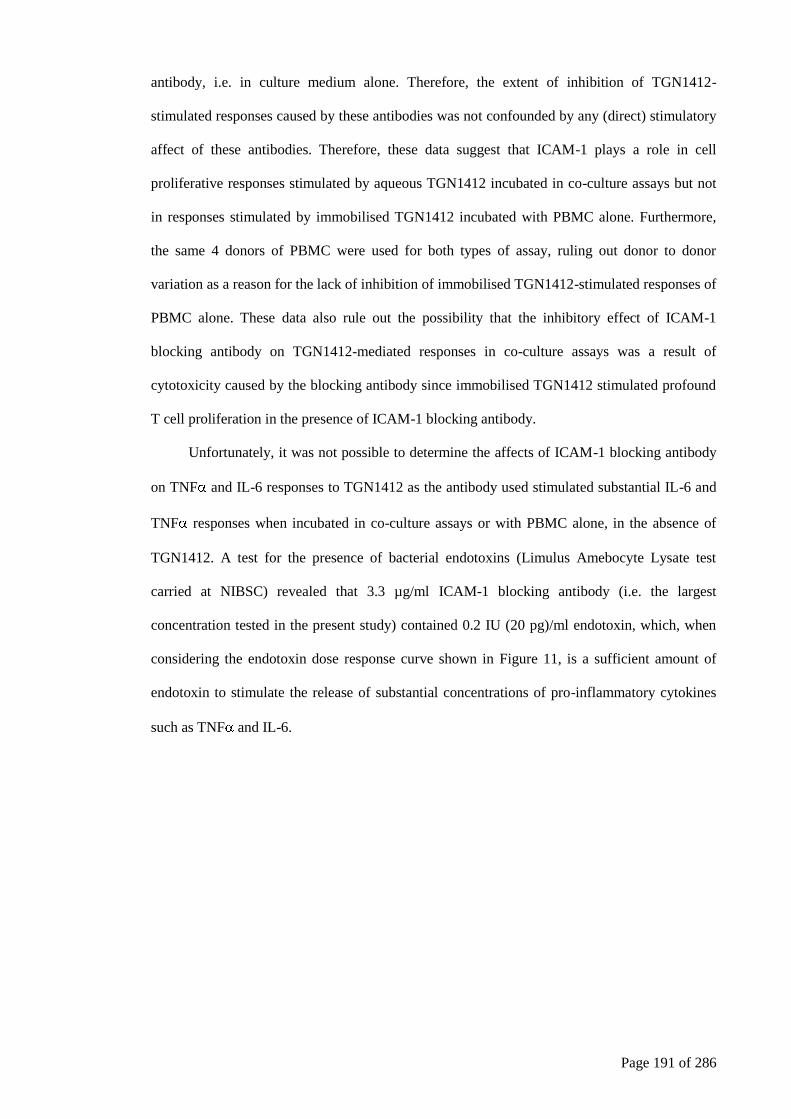
Figure 48. Inhibition of responses by ICAM-1 blocking antibody, to aqueous TGN1412
in co-culture assays and to immobilised TGN1412 incubated with PBMC alone .................... 192
Figure 49. Effects of an 4 integrin subunit blocking antibody on responses to a
TGN1412 analogue ................................................................................................................... 194
Figure 50. Effect of anti-IL-2 antibody on TGN1412-stimulated cell proliferative
responses in co-culture assays .................................................................................................. 195
Figure 51. The effect of co-culturing PBMC over a monolayer of HGFs (top) or HFFs
(bottom) on TNF , IL-6 and IL-8 responses to TGN1412 ....................................................... 197
Figure 52. Stimulation of IL-6 release from C-HUVEC and HUVECjr2 by TNF ................. 198
Figure 53. TNF , IL-6 and IL-8 responses of human cells to mAbs Tysabri, Avastin,
Herceptin, Campath-1H, TGN1412 and the control mAb (NC, Negative Control) using
two different methods ............................................................................................................... 224
Figure 54. IL-2 and cell proliferative responses of human cells to mAbs Tysabri, Avastin,
Herceptin, Campath-1H, TGN1412 and the control mAb (NC, Negative Control) using
two different methods. .............................................................................................................. 226
Figure 55. Effect of the presence of mAbs TGN1412, Tysabri, Isotype Control, Avastin,
Herceptin and Campath-1H on the detection of cytokines TNFα, IL-6, IL-8, IL-2 and
IFNγ by ELISA ......................................................................................................................... 286
Page 17
Page 17 of 286
List of Tables
Table 1. Reverse transcription master mix ................................................................................... 94
Table 2. RT-PCR primer sequences, product sizes and annealing temperatures ......................... 96
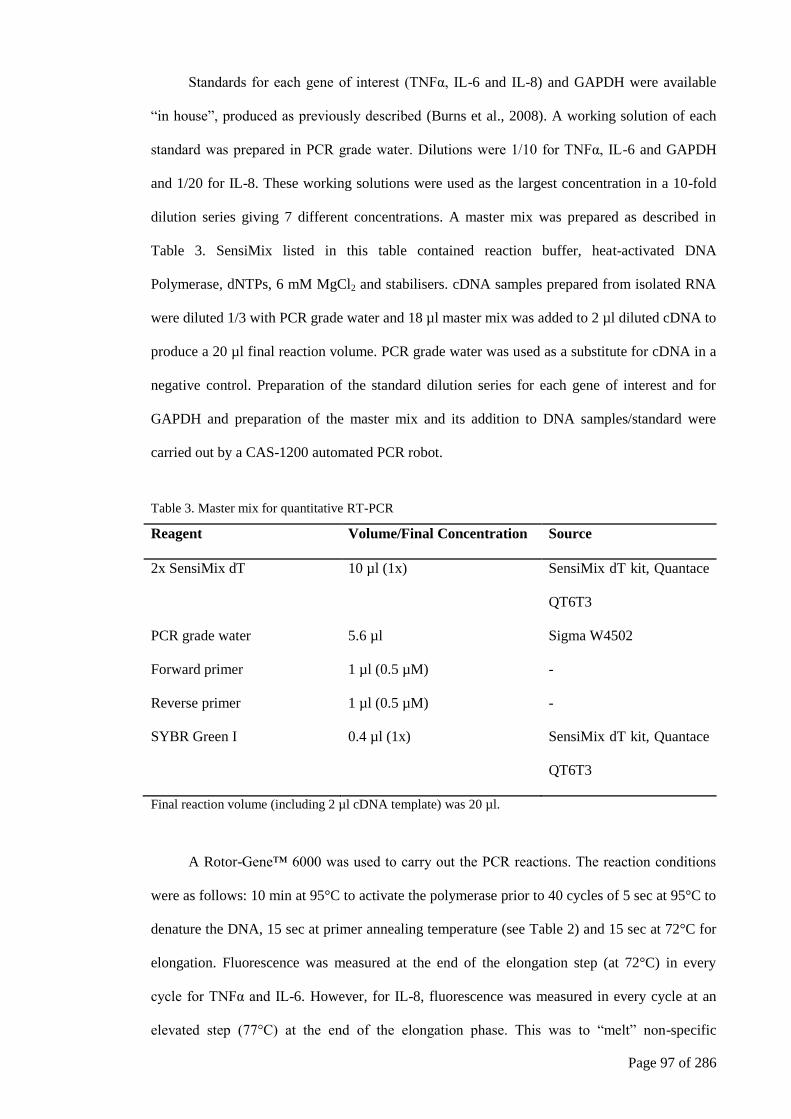
Table 3. Master mix for quantitative RT-PCR ............................................................................. 97
Table 4. Comparison of peak cytokine responses (pg/ml) to TGN1412 in vivo with those
of PBMC to 10 µg/well TGN1412 immobilised by air-drying .................................................. 101
Table 5. Components of HSVEC culture medium (500 ml total volume) ................................. 128
Table 6. Comparison of peak cytokine responses (pg/ml) to TGN1412 in vivo and of cells
in co-culture assays .................................................................................................................... 136
Table 7. Blocking and control antibodies used.. ........................................................................ 170
Table 8. IL-6 responses measured in cell-conditioned medium from above or below a
membrane separating PBMC and endothelial cells (HUVECjr2) in wells of a transwell
system ........................................................................................................................................ 175
Table 9. Cytokine/cell proliferative responses of PBMCs to mAbs and PHA (10 µg/ml)
incubated in aqueous phase and mAbs immobilised by air-drying. ........................................... 225
Table 10. Cytokine/cell proliferative responses of PBMCs alone or PBMCs and human
umbilical vein endothelium derived cells in co-culture to mAbs and PHA incubated in
aqueous phase. ........................................................................................................................... 225
Table 11. Phosphate Buffered Saline (PBS) A (sterile and non-sterile) .................................... 282
Table 12. PBS B (sterile) ........................................................................................................... 282
Table 13. Coating Buffer A ....................................................................................................... 282
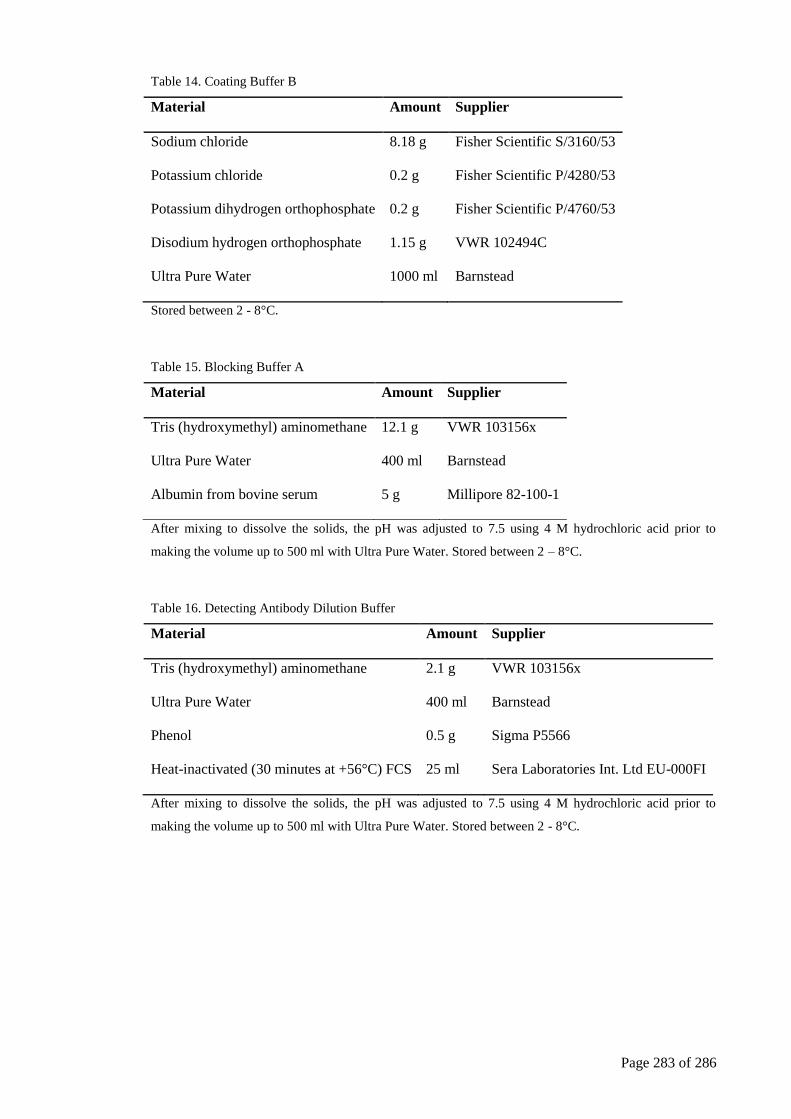
Table 14. Coating Buffer B ........................................................................................................ 283
Page 18
Page 18 of 286
Table 15. Blocking Buffer A...................................................................................................... 283
Table 16. Detecting Antibody Dilution Buffer .......................................................................... 283
Table 17. Substrate Buffer A ..................................................................................................... 284
Table 18. TMB Substrate Solution ............................................................................................ 284
Table 19. Substrate Buffer B...................................................................................................... 284
Table 20. Stop Solution .............................................................................................................. 284
Table 21. Wash Dilution Buffer ................................................................................................. 285
Table 22. Tris Buffered Saline (TBS) 10x stock ....................................................................... 285
Table 23. FACS Fix Solution ..................................................................................................... 285
Page 19
Page 19 of 286
Abbreviations
3H-thymidine tritiated thymidine
Ab antibody
ADCC antibody-dependent cell-mediated cytotoxicity
Akt protein kinase B
ANOVA analysis of variance
AP-1 activator protein-1
APC antigen presenting cells
B-CLL B cell chronic lymphocytic leukemia
bp base pairs
BSA bovine serum albumin
CDC complement-dependent cytotoxicity
cDNA complementary deoxyribonucleic acid
CDR complementarity-determining regions
CH constant heavy chain
C-HUVEC primary endothelial cells from umbilical vein of fresh human cords
CL constant light chain
CM culture medium
cSMAC central supramolecular activation complex
Ct number of PCR cycles to reach threshold fluorescence
CTLA-4 cytotoxic T-lymphocyte antigen-4
DAG diacylglycerol
DNA deoxyribonucleic acid
dNTPs deoxyribonucleotidetriphosphates
dSMAC distal supramolecular activation complex
DTT dithiothreitol
EBM endothelial cell basal medium
ECGS endothelial cell growth supplement
ECs endothelial cells
EDTA ethylenediaminetetraacetic acid
EGM-2 endothelial growth medium-2
ELC endotoxin limit concentration
ELISA enzyme-linked immunosorbent assay
ET endotoxin
EU endotoxin units
Page 20
Page 20 of 286
FACS fluorescence-activated cell sorting
FcR Fc receptor
FCS foetal calf serum
FITC fluorescein isothiocyanate
Fyn proto-oncogene protein tyrosine kinase
GAPDH glyceraldehyde 3-phosphate dehydrogenase
Grb2 growth factor receptor bound protein
hAB human AB
HFF human foreskin fibroblasts
HGF human gingival fibroblasts
hi heat inactivated
HSVEC human saphenous vein endothelial cells
HuMAC Human Materials Advisory Committee
HUVEC human umbilical vein endothelial cells
IC isotype-matched negative control
ICAM-1 intercellular adhesion molecule-1
ICOS inducible T-cell costimulator
IFN interferon
IFNGR interferon gamma receptor
Ig immunoglobulin
IL- interleukin
IL-2R IL-2 receptor
IP3 inositol 1,4,5-triphosphate
IS international standard
ITAMs immunoreceptor tyrosine-based activation motifs
Itk IL2-inducible T-cell kinase
IU international units
KDa Kilo Daltons
KLH keyhole limpet hemocyanin
LAK linker of activated T cells
LAL Limulus amebocyte lysate
LBP lipid binding protein
Lck lymphocyte-specific protein tyrosine kinase
LFA-1 lymphocyte function-associated antigen-1
LFA-3 lymphocyte function-associated antigen-3
LICOS ligand for inducible co-stimulator
LPS lipopolysaccharide
Page 21
Page 21 of 286
mAb monoclonal antibody
MABEL minimum anticipated biological effect level
MAdCAM-1 mucosal vascular addressin cell adhesion molecule-1
MAT monocyte activation test
MHC major histocompatibility complex
MHRA Medicines and Healthcare Regulatory Authority
MMLV-RT Moloney murine leukemia virus-reverse transcriptase
mRNA messenger ribonucleic acid
MTOC microtubule-organising centre
NF nuclear factor
NFAT nuclear factor of activated T cells
NHS National Health Service
NIBSC National Institute for Biological Standards and Control
NK cells natural killer cells
NOEL no observed adverse effect level
OD optical density
OMCL Official Medicines Control Laboratory
OPD o-phenylenediamine dihydrochloride
PAF platelet-activating factor
PAMPs pathogen associated molecular patterns
PBMC peripheral blood mononuclear cells
PBS phosphate-buffered saline
PCR polymerase chain reaction
PHA phytohaemagglutinin
PI3 phosphatidylinositol 3
PIP2 phosphatidylinositol 4,5-bisphosphate
PIP3 phosphatidylinositol 3,4,5-trisphosphate
PLC-γ phospholipase C
PP polypropylene
PS polystyrene
PSA penicillin, streptomycin, amphotericin B
pSMAC peripheral supramolecular activation complex
QEII Queen Elizabeth II
RaCS raft clustering during T cell surveying
RNA ribonucleic acid
RT-PCR reverse-transcription polymerase chain reaction
S.E.M standard error of the mean
Page 22
Page 22 of 286
SLP-76 lymphocyte cytosolic protein
Syk spleen tyrosine kinase
TBS tris-buffered saline
TCR T cell receptor
TGF transforming growth factor
Th T helper
TLR toll-like receptor
Tm melting temperature
TMB 3,3',5,5'Tetramethylbenzidine
TNF tumour necrosis factor
TNFRI TNF receptor I
TNFRII TNF receptor II
Treg regulatory T cells
Tris tris (hydroxymethyl) aminomethane
Tween 20 polyoxyethylene-sorbitan monolaurate
Vav1 guanine nucleoside exchange factor
VCAM-1 vascular cell adhesion molecule-1
VEGF vascular endothelial growth factor
VH variable heavy chain
VL variable light chain
VLA-4 very late activation marker-4
vWF von Willebrand factor
WHO World Health Organisation
ZAP-70 zeta-chain-associated protein kinase
Page 23
Page 23 of 286
Chapter 1:
General introduction
Page 24
Page 24 of 286
CHAPTER 1: General introduction
1.1 Brief
Infused or injected biological medicines (parenterals) can cause unwanted side effects as
a result of an inherent property of the drug itself or as a result of contamination of the medicine
with, for example, pyrogenic (fever-causing) substances such as endotoxin (Probey and Pittman,
1945; Steere et al., 1978). The potency and safety of parenteral medicines are predicted, as far
as is practically possible, through in vitro tests or using animal models before their ‘first time in
man’ clinical trial or before the release of a new batch of a biological medicine onto the market.
Unfortunately, rare incidences can occur where the pre-clinical testing of a medicine does not
predict unwanted in vivo effects. One of the best-known cases (because of the extensive press
coverage) was the disastrous, life-threatening, first clinical trial of the immunomodulatory
superagonistic anti-CD28 therapeutic monoclonal antibody (mAb) TGN1412 (Figure 1)
Figure 1. TGN1412 clinical trial disaster reported by the BBC. Taken from the BBC website, March
2006.
Page 25
Page 25 of 286
Monoclonal antibody (mAb) therapy for the treatment of disease is becoming
increasingly popular since mAbs can be produced with high specific avidity for many
therapeutic targets in, for example, cancer, autoimmune diseases and neurologic disorders (von
Mehren et al., 2003; Novak et al., 2008; Shah and Mayer, 2010). This, taken together with the
fact that pre-clinical tests failed to predict the toxicity of TGN1412, highlights the need for
methods that can better predict adverse effects of therapeutic mAbs in the clinic if these
medicines are to be used successfully for the treatment of disease.
1.2 Therapeutic mAbs
Therapy with mAbs is offering new ways to treat a variety of diseases and currently there
are over 20 products that have been approved by the Food and Drug Administration (US) or the
European Medicines Agency for therapeutic use (Kubota et al., 2009). A majority of these are
intended for the treatment of cancer or inflammatory/autoimmune diseases. They therefore have
the potential to modulate aspects of the immune system (i.e. innate, cell-mediated or humoral
immunity) and so are “immunomodulatory”.
1.2.1 Structure of therapeutic mAbs
Therapeutic mAbs are usually immunoglobulin class gamma (IgG) and their basic
structure, as shown in Figure 2A, is a heterodimer containing two light chains (which can be
either κ or λ) and two γ heavy chains connected by disulphide bonds within the flexible hinge
region. The heterodimer can be divided into three independent regions: the Fc domain and two
Fab domains, as shown in Figure 2B. Each light and heavy chain has a region in which the
amino acid sequence varies from one mAb to the next, giving rise to its target specificity. These
variable regions are shown in Figure 2 as VL and VH. Amino acid sequence variability is
concentrated in hypervariable regions (3 on each chain) called complementarity-determining
regions (CDRs) within VL and VH. The remaining regions of VL and VH are much less variable
and are known as framework regions. The combined structure of all CDRs forms a site which
Page 26
Page 26 of 286
binds to target antigen. The VL and VH regions form the two Fab portions of the antibody. The
remainder of the antibody molecule is known as the constant region and consists of a constant
light domain (CL) as it constitutes the light chain and a constant heavy domain (CH). The latter is
divided into CH1, a hinge region, CH2 and CH3 and is responsible for the biological function of
the molecule (Kuby, 1997).
Figure 2. Structure of a mAb (IgG). VL: variable light chain; VH: variable heavy chain; CL: constant light
chain; CH: constant heavy chain. Adapted from Kuby, 1997.
Therapeutic mAbs have progressed from being entirely murine to chimeric mAbs in
which murine variable regions (including framework regions) are connected to human constant
regions, and then to humanized mAbs in which the constant and framework regions are human
but the CDRs are murine in origin, and now to fully human mAbs (Hansel et al., 2010). Fully
human mAbs of course are likely to be tolerated better by humans.
Page 27
Page 27 of 286
1.2.2 Modes of action of therapeutic mAbs
Therapeutic mAbs exert their effects by several different mechanisms. Through binding
of the CDRs to target receptors, mAbs can activate signalling pathways, as is the case for
TGN1412 (see below). Alternatively, CDRs can bind target ligands or receptors to block
activation (by other molecules) of signalling pathways as is the case for Tysabri, an anti- 4
integrin therapeutic mAb for the treatment of multiple sclerosis and Avastin, an anti-vascular
endothelial growth factor (VEGF) for the treatment of various cancers. Other mAbs exert their
effects through binding of the Fc portion of target bound antibody to Fc receptors leading to
antibody-dependent cell-mediated cytotoxicity (ADCC). In vivo, ADCC is initiated when
antibodies produced by B lymphocytes during a humoral response bind to a pathogen-infected
target cell labelling it for destruction. Binding of the antibody Fab region to its target exposes
the Fc portion to Fc receptors expressed by effector cells; primarily but not exclusively natural
killer cells (cytotoxic lymphocytes), which stimulates the release of pro-inflammatory cytokines
and cytotoxic granules containing granzymes (serine proteases) and perforin from these cells.
These granules are internalised by target cells and ultimately trigger programmed cell death,
otherwise known as apoptosis (Buzza and Bird, 2006). Therapeutic mAbs can use this
physiological immune effector function to destroy target cells and so when a therapeutic mAb
binds to target receptors on cells it can label them for destruction through ADCC (von Mehren
et al., 2003).
Complement-dependent cytotoxicity (CDC) is another effector function controlled by the
Fc portion of mAbs. In vivo, in the classical complement activation pathway, antibodies
produced in a humoral response bind to pathogens via their variable region rendering the Fc
portion free to bind C1q, a component of a complex called C1 which contains two other
proteins, C1r and C1s. This binding activates a cascade of reactions involving other complement
proteins, ultimately leading to several effector functions. Some complement proteins act as
opsonins, i.e. they bind to the immune complex (antigen expressed by pathogen:antibody)
labelling it as a target for destruction. Phagocytic cells expressing complement receptors (such
as macrophages and neutrophils) are attracted to the immune complex by release of small
Page 28
Page 28 of 286
complement peptides such as C3a and C5a which posses chemotactic and pro-inflammatory
activity. The phagocytic cells internalise the opsonised pathogen (by phagocytosis) where it is
destroyed by lysosomal enzymes. Furthermore, complement can form a membrane attack
complex which also destroys bacteria. Therefore, not surprisingly, when therapeutic mAbs bind
to target receptors on cells, this can also label them for destruction through CDC (von Mehren et
al., 2003; Bugelski et al., 2009). Different IgG subclasses activate complement to different
extents. CDC induction by IgG antibody occurs when one Clq molecule is bound to the Fc
portions of multiple IgG molecules held in close proximity to each other as a result of their
binding to antigen (Murphy et al., 2008). For this reason, the density of target antigen for which
the antibody is specific is likely to affect the capability of the antibody to induce CDC. Cell
destruction by ADCC and/or CDC is a common mechanism of mAbs used for the treatment of
cancer, such as Campath-1H (lymphocyte neoplasms) and Herceptin (breast cancer). In addition
to CDC and ADCC, mAbs can induce antibody-dependent cellular phagocytosis in which mAb-
targeted cells are phagocytosed by cells such as macrophages expressing Fc receptors which
bind the Fc portion of the therapeutic mAb (Awan et al., 2010).
The constant region of the gamma heavy chains of IgG antibodies can be one of four
subclasses, i.e.: IgG1, IgG2, IgG3 or IgG4. The size of the hinge region and the position and
number of disulfide bonds between the two heavy chains predominantly define the subclass of
the antibody. Small amino acid differences between the subclasses dramatically affects the
effector function of the molecule. Therapeutic mAbs with ADCC effector mechanisms are
commonly of the subclass IgG1 as this has a high affinity for Fc gamma receptor III expressed
by natural killer cells. However, if ADCC or CDC is not a requirement, mAbs may be of the
subclass IgG4 as the Fc portion has a low affinity in general for Fc receptors and for Clq.
Furthermore, modification such as glycosylation of a specific area within the heavy chain
constant region can improve effector functions of mAbs (Kubota et al., 2009; Kaneko and Niwa,
2011). Unlike all other IgG subclasses, IgG4 molecules are capable of dissociating under
reducing conditions and undergoing “Fab arm exchange” with other IgG4 molecules, that is, a
heavy-light chain pair (half-molecule) can exchange with a half-molecule from another IgG4
antibody. This results in transient bi-specific antibodies incapable of cross-linking antigens and
Page 29
Page 29 of 286
this has been reported to have anti-inflammatory effects (van der Neut Kolfschoten et al., 2007).
However the contribution of Fab arm exchange to therapeutic IgG4 mAbs is still largely
unknown.
1.2.3 Clinical infusion reactions caused by therapeutic mAbs
The specificity and high affinity of therapeutic mAbs for their target reduces the
likelihood of activation of non-target pathways. Moreover, as proteins, therapeutic mAbs are
catabolised into their constituent natural amino acids and so do not form reactive or toxic
intermediates (Brennan et al., 2010). However, despite these facts, therapeutic mAbs are
associated with side effects, a significant number of which are ‘clinical infusion reactions’.
Depending on the antibody, the reactions may occur in a large proportion of patients and may be
severe enough to constitute what has been termed ‘cytokine release syndrome’ (Breslin, 2007;
Chung, 2008; Wing, 2008; Hansel et al., 2010).
Cytokines are potent mediators of immune responses (as described below) and thus play a
pivotal role in fighting infection. Many cytokines are pro-inflammatory, i.e. they promote the
accumulation of leukocytes (as immune effector cells), plasma proteins and fluid in tissues.
Although this accumulation is critical in order to combat infection, many of these (activated)
immune cells/proteins can cause extensive tissue damage. The production and effects of
cytokine release during an immune response are usually regulated by physiological control
mechanisms which keeps their tissue-damaging effects (described below) under control and
localised to infected/damaged tissue. However, therapy with mAbs can stimulate a widespread
and dysregulated overproduction of cytokines (cytokine release syndrome), usually in the
absence of infection, leading to widespread tissue-damaging effects. This mAb-induced
response is often very similar to that induced by an infection of systemic tissue (e.g. blood and
lungs), leading to a systemic inflammatory response and septic shock.
Usually the exact mechanism for cytokine release stimulated by therapeutic mAbs is not
known. It is possible that during the manufacturing process, mAbs (as with all medicines) may
become contaminated with a pyrogenic (fever-causing) substance such as endotoxin, which can
Page 30
Page 30 of 286
stimulate the release of pro-inflammatory cytokines. However, in most cases, pyrogenic
contamination is controlled using pre-clinical tests such as the rabbit pyrogen test or the
bacterial endotoxins test. Usually, cytokine release syndrome is caused by the intrinsic nature of
the mAb itself. This can be through an Fc-mediated mechanism such as ADCC; for example,
first dose cytokine release syndrome stimulated by Campath-1H (IgG1) is a consequence of Fc
ligation of target-bound (to CD52) antibody to FcγIII receptors (CD16) on natural killer cells
(Wing et al., 1995; Wing et al., 1996). Cytokines release may also be a result of the Fab portion
of the mAb binding to target receptors leading to stimulation of cells (as was the case with
TGN1412). The mechanism underlying cytokine release can be the same as that required for the
therapeutic effect of the mAb. Cytokine release syndrome is made worse when the mAb-
targeted ligands are expressed on cells other than those essential for the therapeutic effect. For
example, a mAb for cancer therapy that targets antigens not exclusive to tumour cells is likely to
stimulate larger cytokine responses than a mAb targeted for a tumour cell-specific antigen.
When this is the case, the effects can become systemic depending on the distribution of the cells
expressing the target antigen (Brennan et al., 2010).
If the onset, nature and severity of cytokine release stimulated by therapeutic mAbs can
be predicted through pre-clinical testing, the predicted effects may be controlled by medical
intervention prior to/during therapy. This would result in a situation where the benefits of mAb
therapy (such as treating cancer patients) far outweigh the risks. The use of good clinical
management (use of corticosteroids) has enabled therapeutic mAbs Campath-1H and Rituximab
to be marketed and used as successful treatments for lymphoma (Wing, 2008). This highlights
the importance of pre-clinical testing procedures that can predict cytokine release syndrome
stimulated by therapeutic mAbs.
Depending on the therapeutic mAb, elevated levels of a range of cytokines are often
reported during cytokine release syndrome. It is the sustained production of large quantities of
cytokine(s) that causes toxicity in man. The cytokines tumour necrosis factor alpha, TNF ,
interferon gamma, IFNγ and interleukin-6, IL-6 are often associated with cytokine release
syndrome (Wing, 2008) although others are involved. A brief summary of the roles of cytokines
that are potential contributors to cytokine release syndrome is given below.
Page 31
Page 31 of 286
TNF
TNF is a 51 KDa homotrimer and is produced by a range of cell types including
lymphoid cells (i.e. lymphocytes and monocytes), mast cells, endothelial cells, cardiac
myocytes, adipose tissue, fibroblasts, neuronal tissue and some epithelial cells (Walsh et al.,
1991). It is able to transduce its cellular effects through binding to two distinct TNF receptors;
type I (TNFRI), expressed on all cell types or type II (TNFRII), expressed by cells of the
immune system and endothelial cells (Aggarwal, 2000). There are many inducers of TNFα
release from cells. A well-known inducer of TNF release (and of IL-1β, IL-6 and IL-8 release)
from monocytes and macrophages is bacterial endotoxin, a pyrogenic component of the cell
wall of Gram negative bacteria. Other non-endotoxin pyrogens (which may contaminate
biological medicines) are also capable of stimulating TNF release from monocytes and
macrophages, e.g. peptidoglycan (Nakagawa et al., 2002) and flagellin (Wyant et al., 1999).
Pyrogen-stimulated cytokine release is through the interaction of the pyrogen with Toll-like
receptors (TLRs) expressed by monocytes and macrophages. For example, the endotoxin
lipopolysaccharide (LPS), binds to lipid binding protein (LBP) in the host’s blood and,
subsequently, to CD14 and TLR4 ligands which leads to cell-activation and the release of
cytokines such as TNF , required for an inflammatory response to combat infection (O'Neill
and Dinarello, 2000). Monocyte activation by mycobacterium involves TLR2 (Le Bert et al.,
2011). TNF causes a rise in body temperature and so is described as an endogenous pyrogen
(fever-causing agent), along with IL-1β and IL-6. The physiological function of this rise in body
temperature is to create a less favourable environment for pathogens during infection.
TNF (along with IL-1β and IL-6) stimulates the synthesis of acute phase proteins by the
liver during an inflammatory response. C-reactive protein and mannose binding lectin are
examples of acute phase proteins and they bind to pathogens and act as opsonins and activate
complement-mediated effector functions as described above. TNF also stimulates the release
of IL-8 and IL-6 from monocytes and macrophages and can cause tissue necrosis through the
activation of signalling pathways leading to apoptosis (Li and Beg, 2000). In addition, TNF
acts on vascular endothelial cells (which form microvessels and the lining of large blood
Page 32
Page 32 of 286
vessels) in several ways. It induces them to synthesise colony stimulating factors which
themselves induce haematopoiesis, leading to an increased production of leukocytes for
combating infections (Kuby, 1997). TNF release also leads to vasodilation to increase blood
flow and an increase in vascular permeability to proteins, cells and fluid.
TNF upregulates endothelial cell surface expression of a number of cell adhesion
molecules such as ICAM-1, vascular cell adhesion molecule-1 (VCAM-1) and the selectins E-
selectin and P-selectin. E-selectin and P-selectin bind to specific carbohydrates on glycoproteins
expressed at the surface of certain leukocytes. ICAM-1 and VCAM-1 bind, respectively, to the
integrins lymphocyte function-associated antigen-1 (LFA-1) and very late activation marker-4
(VLA-4) expressed by lymphocytes. The interaction of adhesion molecules with their ligands
expressed by immune effector cells results in their adhesion and migration across endothelial
barriers, into damaged/infected tissues (Muller, 2002; Murphy et al., 2008; Mazza et al., 2010).
IL-6
IL-6 is a 26 KDa protein released by many cell types including lymphocytes, monocytes,
fibroblasts, endothelial cells, mesangial cells and keratinocytes. It is able to transduce its effects
through binding to a cell surface receptor complex which has two chains, IL-6Rα (which can
actually be soluble or membrane bound), and gp130. The latter is always membrane bound and
is the signal transducing component of the IL-6 receptor complex (Mire-Sluis and Thorpe,
1998). Like TNF and IL-1β, IL-6 is generally regarded as a pro-inflammatory cytokine. Its
release from monocytes and macrophages is stimulated by micro-organism derived pyrogens
(amongst other factors) and it too causes fever. However, IL-6 can also be anti-inflammatory as
in vitro, IL-6 inhibited the release of TNF and IL-1 from peripheral blood mononuclear cells
or PBMC (Schindler et al., 1990). IL-6 is also an inducer of the synthesis of acute phase
proteins by the liver (as described for TNF ). It has a regulatory role in haematopoiesis and T
cell proliferation and differentiation. In addition, it promotes terminal differentiation of B cells
into plasma cells and antibody secretion from these cells and also promotes the production of
platelets (Kuby, 1997; Mire-Sluis and Thorpe, 1998; Naka et al., 2002).
Page 33
Page 33 of 286
IL-8 (CXCL8)
IL-8 is an 8 KDa protein released by many cell types including monocytes, macrophages,
T cells, endothelial cells, fibroblasts and neutrophils. It is a chemokine (chemoattractant) that
binds to the extracellular matrix and the surface of endothelial cells and provides a chemical
gradient in order to direct the migration of leukocytes, in particular neutrophils (phagocytes),
towards the site of infection . IL-8 also activates conformational changes in integrins, adhesion
molecules expressed by leukocytes. These conformational changes promote leukocyte adhesion
to endothelial cells and their extravasation across endothelial barriers towards sites of infection
(Murphy et al., 2008). IL-8 therefore elicits pro-inflammatory effects by facilitating the
recruitment of immune effector cells, which also have tissue-damaging effects, to sites of
infection.
IFNγ
IFNγ is a 17 KDa protein released by several cell types including T lymphocytes, natural
killer cells (Langer et al., 1994) and macrophages (Robinson et al., 2010). It is able to transduce
its effects through binding to interferon gamma receptor (IFNGR) comprising two ligand
binding chains; IFNGR1 and two signal transducing chains; IFNGR2. IFNγ possesses a broad
range of functions. In general, it promotes immune responses of the Th (T helper) 1 phenotype
which include the activation of macrophages and activation and cell-mediated immunity (as part
of the adaptive immune response) as described below. Activation of macrophages by IFNγ
promotes several effector functions of these cells, e.g. upregulation of lysosomal enzymes
which mediate the destruction of phagocytosed micro-organisms. IFNγ also induces the
synthesis of reactive oxygen species and reactive nitrogen intermediates by macrophages
(Schroder et al., 2004) which, when released, are toxic to host cells as well as pathogens.
Consequently, activated macrophages can cause extensive tissue damage (Murphy et al., 2008).
IFNγ also activates similar mechanisms in neutrophils (Boehm et al., 1997). Furthermore, the
proliferation of macrophages and cell survival is promoted by IFNγ (Schroder et al., 2004).
As part of the adaptive immune response, peptides from phagocytosed pathogens are
expressed on the surface of dedicated APCs such as dendritic cells, in the context of self-
Page 34
Page 34 of 286
molecules major histocompatibility class I (MHC Class I) or MHC Class II. As described in
more detail later in this chapter, it is only in this context that such peptides can activate T
lymphocytes. IFNγ upregulates the expression of MHC Class I and II molecules to increase the
quantity and diversity of peptides presented to T lymphocytes by APCs, enhancing T cell-
mediated effector functions. It is believed that the release of IFNγ by APCs and natural killer
plays a pivotal role in early immune responses to infection; however, when the adaptive
immune response develops, T lymphocytes are activated by APCs (or, alternatively; therapeutic
mAbs) and are responsible for releasing most of the IFNγ (Schroder et al., 2004). Furthermore,
the expression of Fc gamma receptor I (FcγR1) by monocytes is upregulated by IFNγ promoting
ADCC (Erbe et al., 1990). In addition, IFNγ can increase the secretion of complement proteins
and upregulate the expression of receptors for complement proteins, promoting cell destruction
through CDC (Strunk et al., 1985). As with TNF , IFNγ upregulates the expression of
endothelial adhesion molecules, promoting the adhesion and migration of circulating immune
cells across endothelial barriers. IFNγ also has anti-viral properties as it induces a number of
proteins which inhibit viral protein synthesis and replication (Mire-Sluis and Thorpe, 1998).
IL-2
IL-2 is a 15 KDa protein released by T lymphocytes (Savage et al., 1993). It is able to
transduce its effects by binding to the IL-2 receptor complex as described later in this chapter.
The primary functions of IL-2 include activation of T cell proliferation and differentiation into
immune effector cells and the development of memory T cells, which, upon re-encounter with
their cognitive antigen, are capable of undergoing expansion leading to antigen specific immune
effector functions (Bachmann and Oxenius, 2007). IL-2 is also a growth factor for B cells and
natural killer cells (Oppenheim, 2007). The role of IL-2 is described in more detail later in this
chapter.
Given the role that cytokines play during an immunological response (as summarised
above), it is easy to see how a dysregulated and widespread production of these cytokines, e.g.
as can be induced by mAb therapy, could send the immune system in to a state of turmoil.
Page 35
Page 35 of 286
Common symptoms of cytokine release syndrome include fever, chills, nausea, hypotension,
tachycardia, asthenia, headaches and myalgia. However, in more severe cases, cytokine release
syndrome can lead to life-threatening complications (Breslin, 2007). For example, when TNF
is released by cells in systemic sites such as the pancreas and liver, it causes widespread
vasodilation, and it increases adhesiveness of vascular endothelial cells for leukocytes and
platelets and increases systemic vascular permeability to proteins, cells and fluids. The resulting
loss of blood pressure and plasma volume leads to shock. High levels of systemic TNF can
also induce disseminated intravascular coagulation in which the generation of blood clots leads
to an unsustainable consumption and consequent depletion of clotting proteins, causing
individuals to lose their ability to form further blood clots leading to bleeding and multiple
organ failure (Murphy et al., 2008).
Perhaps the most recently publicised incident of a therapeutic mAb-induced clinical
infusion reaction was the “cytokine storm” stimulated by TGN1412. This resulted in devastating
clinical consequences during its “first time in man” phase I clinical trial, clinical effects which
were in no way predicted during pre-clinical testing of this molecule.
1.3 Therapeutic mAb TGN1412
TGN1412 was generated by TeGenero AG and subsequently manufactured by
Boeringher Ingelheim Pharma GmbH & Co. It is a 148 kDa mAb of the IgG4 subclass and has a
kappa light chain (IgG4κ). The antibody is humanised and so the CDRs from mouse mAb
5.11A1 (Luhder et al., 2003) heavy and light chain variable regions, specific for human CD28,
were transferred into a human framework of light and heavy chain variable regions. These were
then combined with IgG4 heavy chain and human kappa light chain. Humanisation of the
antibody was important to reduce immunogenicity and to improve the half-life of the molecule
as a therapeutic medicine. The engineered antibody was produced by expression in Chinese
Hamster Ovary cells (TeGenero AG, 2005a; TeGenero AG, 2005b).
TGN1412 belongs to a group of antibodies called CD28 superagonists. CD28, the target
receptor for TGN1412 is expressed by T cells and plays a pivotal role in T cell activation. In
Page 36
Page 36 of 286
order to understand the mechanism of action of CD28 superagonists (addressed later in this
chapter), T cell activation and the immunological responses which may follow are first
reviewed.
1.4 Review of T cell activation
1.4.1 Conventional T cell activation involving the co-stimulatory receptor CD28
T cells are leukocytes that belong to the sub-group lymphocytes (along with B cells and
natural killer cells) and play an important role in humoral and cell-mediated immunity.
Following their maturation in the thymus, T cells migrate around the body in the blood and the
lymph and reside in the lymph nodes. T cells are distinguishable from other lymphocytes by the
fact that they have a receptor on their surface known as the T cell receptor, or TCR. The
activation of T cells as mediators of the immune response normally requires two signals, both of
which are usually provided by APCs such as dendritic cells, macrophages and B cells (Sharpe
and Abbas, 2006). Pathogens (amongst other things) activate APCs residing in tissue through
the interaction of pathogen associated molecular patterns (PAMPs) with Toll-like receptors
expressed by the APCs. Activated APCs engulf and destroy the pathogen through phagocytosis.
Processed peptide from the pathogen is then expressed on the APC surface as antigen in the
context of self MHC molecules. Activated APCs also migrate from the infected tissue to the
lymph nodes. A large population of naive T cells (i.e. T cells that have never encountered their
specific antigen within the periphery) reside in the lymph nodes and it is here that they are
activated by mature APCs.
The TCR expressed by a T cell is antigen specific. Peptide derived from this antigen is
required to be complexed with self-MHC molecules expressed by APCs for antigen recognition
to occur by the T cell. CD4+ T cells recognise peptide in the context of self MHC class II
molecules and CD8+ T cells recognise peptide in the context of MHC class I molecules
(Murphy et al., 2008). Recognition of the MHC/peptide complex by specific TCRs is the first
signal required for T cell activation and provides specificity to the response which may follow.
Page 37
Page 37 of 286
The second signal, known as the co-stimulatory signal, is provided by molecules CD80 and
CD86 (otherwise known as B7-1 and B7-2 respectively), the expression of which on the surface
of APCs is enhanced by cytokines produced in response to microbes (Sharpe and Abbas, 2006).
CD80 and CD86 interact with the membrane-bound receptor CD28, a 44 KDa homodimer
consisting of extracellular, transmembrane and cytoplasmic domains, the latter being rich in
motifs involved in signalling (Sharpe and Freeman, 2002). CD28 is constitutively expressed on
the surface of 50% of human CD8+ T cells and on 90% of human CD4+ T cells (Peggs and
Allison, 2005). Usually, it is only when T cells receive both signals (via CD28 and the TCR)
that T cell activation occurs. This is followed by cytokine production and proliferation and
differentiation into effector and memory T cells. Effector cells then migrate from the lymph
nodes to carry-out their immune effector functions. In the absence of CD28 co-stimulation, T
cells recognising foreign peptide in the context of MHC, through TCR ligation, either enter a
state of anergy (Jenkins, 1994) in which proliferation and effector functions are inhibited
(Schwartz, 2003) or they undergo apoptosis.
1.4.2 Signalling events during CD28 co-stimulation
The TCR at the cell surface is composed of two subunits known as the α and β proteins.
Also associated with the TCR is CD3 which consists of heterodimers εδ and γε, and a
homodimer ζζ. One of the functions of CD3 is to mediate cell surface expression of the αβ
heterodimer. The arrangement of these peptides to form the TCR-CD3 complex is shown in
Figure 3. The αβ heterodimer is specific for foreign peptide expressed in the context of MHC by
APCs but, after ligation, the TCR alone cannot transduce signals (Kuhns et al., 2006).
Page 38
Page 38 of 286
Figure 3. Structure of the TCR-CD3 complex. Adapted from Murphy et al., 2008.
Signalling events following TCR and CD28 ligation are shown in Figure 4. An early
event following TCR ligation is phosphorylation of tyrosine residues located in conserved
sequences called immunoreceptor tyrosine-based activation motifs (ITAMs) on the cytoplasmic
tails of ε, δ, γ and ζ. Phosphorylation of ITAMS is by Src family tyrosine kinases, Lck
(lymphocyte-specific protein tyrosine kinase) and Fyn (proto-oncogene protein tyrosine kinase)
which are constitutively associated with receptors CD4 or CD8 and cytoplasmic domains of ε,
δ, γ and ζ. Ligation of CD4 or CD8 receptors by MHC class I or II molecules presenting foreign
peptide, and which are expressed by APCs, co-localises the TCR with its co-receptor since the
TCR ligates to the foreign peptide, bringing together Lck tyrosine kinases associated with the
co-receptor and ITAMs of the cytoplasmic region of the TCR-CD3 complex. Phosphorylated
Page 39
Page 39 of 286
ITAMs provide binding sites for ZAP-70 (zeta-chain-associated protein kinase) and Syk (spleen
tyrosine kinase) which themselves become enzymatically active after phosphorylation. This
leads to a cascade of events (Isakov and Biesinger, 2000) including ZAP-70 phosphorylation of
adaptor proteins LAK (linker of activated T cells) and SLP-76 (lymphocyte cytosolic protein),
which in turn stimulates the recruitment of PLC-γ (phospholipase C), which is subsequently
phosphorylated and activated by Tec kinases such as Itk (IL2-inducible T-cell kinase). PLC-γ
activation leads to generation of IP3 (inositol 1,4,5-triphosphate) and DAG (diacylglycerol);
breakdown products of PIP2 (phosphatidylinositol 4,5-bisphosphate), a membrane lipid.
Receptor binding of IP3 stimulates the release of stored calcium (within the cell) into the
cytoplasm and the opening of calcium channels that permit the flow of more calcium into the
cell. This calcium flux and DAG are able to activate different pathways which lead to the
activation of transcription factors NFκB (nuclear factor κB), NFAT (nuclear factor of activated
T cells) and AP-1 (activator protein) in the nucleus. These transcription factors regulate the
expression of genes involved in T cell differentiation, proliferation and T cell effector functions.
One of these pathways involves a Ras (GTPase) induced kinase cascade which stimulates AP-1
production. Another involves the activation of NFκB by protein kinase-Cθ and the final
pathway involves activation of calcineurin, a phosphatase which activates NFAT (Murphy et al.,
2008).
Signalling stimulated by ligation of CD28 by CD80 and CD86 is believed to synergise
with TCR-CD3 signalling which ultimately stimulates T cell effector function (Collins et al.,
2002). At the molecular level, CD28 ligation results in phosphorylation of a non-ITAM motif
leading to the recruitment of Grb2 (growth factor receptor bound protein), an adaptor protein,
which can result in Ras activation. As described above, Ras activation leads to the induction of
the kinase cascade, a result of which is the production of AP-1. Therefore, in this pathway,
CD28 ligation enhances AP-1 activation stimulated by engagement of the TCR. In addition, it
has been proposed that CD28 co-stimulation can activate the NFκB pathway involving protein
kinase-Cθ (Dennehy et al., 2003). CD28 has a motif on its cytoplasmic domain that is proline-
rich and which binds to kinase activity-inhibiting domains of Lck and Tec kinase, Itk. Binding
of these domains to this proline-rich domain reverses the inhibitory action leading to activated
Page 40
Page 40 of 286
Lck and Itk. In this case, TCR signalling is promoted by CD28 ligation through enhancement of
activity of kinases (Murphy et al., 2008). Independent signals from TCR and CD28 engagement
have been reported to interconnect at the stage of the signalling cascade where Vav1 (a guanine
nucleoside exchange factor) is tyrosine phosphorylated. CD28 signalling, therefore, must
enhance TCR-stimulated effector functions resulting from Vav1 activation (Hehner et al., 2000).
Vav1 has been reported to promote the stability and function of SLP-76 clusters (Sylvain et al.,
2011) as mentioned above and regulate calcium-dependent signalling (Hehner et al., 2000).
Figure 4. Summary of signalling pathways involved in T cell activation. Solid lines are signalling events
resulting from ligation of the TCR. Dotted lines are signalling events resulting from ligation of CD28.
In addition to synergising with TCR signalling, CD28 ligation stimulates phosphorylation
of tyrosine residues on a motif located on its cytoplasmic tail that is different from that of
ITAMs. This activates recruited PI3-kinase (phosphatidylinositol 3) and subsequently leads to
the production of PIP3 (phosphatidylinositol 3,4,5-trisphosphate). Akt (known as protein kinase
B) is then recruited to the membrane and activated leading to phosphorylation of other
molecules involved in signalling, which in turn stimulates cell survival through upregulated
Page 41
Page 41 of 286
expression of antiapoptotic protein Bcl-xL (Boise et al., 1995; Murphy et al., 2008). T cell
survival promoted by CD28 ligation may also involve a PI3-kinase independent mechanism
(Collette et al., 1997).
1.4.3 The immunological synapse
The term “immunological synapse” was first coined by Norcross (Norcross, 1984) to
describe the region where the APC membrane and T cell membrane interface which seems
logical since “synapse” is derived from the Greek word sunapsis which means “together” or
“joining” (Oxford English Dictionary). The immunological synapse is a highly organised array
of proteins associated with the interfacing membranes and consists of three supramolecular
activation complexes or SMACs which are 3-dimensional, spatially segregated distinct areas
comprising many proteins, as shown in Figure 5. The central supramolecular activation complex
(cSMAC) forms the inner circle and contains most of the signalling molecules important for T
cell activation (Murphy et al., 2008). The cSMAC has been reported to be enriched in TCRs,
protein kinase-Cθ and Src family kinases Lck and Fyn (Monks et al., 1998) as well as CD4 and
CD8 co-receptors, CD28, and cell adhesion molecule CD2 (Dustin et al., 2010), the ligand for
lymphocyte function-associated antigen-3 (LFA-3) expressed by APCs. Surrounding the
cSMAC is the peripheral supramolecular activation complex (pSMAC) reported to be enriched
with LFA-1 which promotes cell to cell adhesion. Also enriched in the pSMAC is talin, a
ubiquitous protein in the cytosol involved in linking proteins such as integrin LFA-1 to the
cytoskeleton, allowing their movement within the cell (Burn et al., 1988; Monks et al., 1998).
The outermost region, called the distal supramolecular activation complex (dSMAC), is not
fully characterised. One theory is that it contains molecules that have not specifically been
recruited to the other two SMACs (Dustin et al., 2010).
Page 42
Page 42 of 286
Figure 5. Simplified illustration of an immunological synapse. The immunological synapse has 3
supramolecular activation complexes (SMACs); central (cSMAC), peripheral (pSMAC) and distal
(dSMAC). Adapted from Janeway’s Immunobiology (Murphy et al., 2008).
The specific functions of the SMACs within the immunological synapse are still not fully
understood. The initial adhesion of T cells to their target cells is through the weak interaction of
LFA-1 expressed by T cells and intercellular adhesion molecules 1 (ICAM-1) expressed by the
target cell. Subsequent ligation of TCRs formed in microclusters with CD28 on the membrane,
with peptide in the context of MHC molecules on target cells, i.e. APCs, increases the affinity
of LFA-1 for ICAM-1, strengthening adhesion between the two molecules. TCRs, associated
co-receptors (CD4 or CD8) and other molecules with co-stimulatory effects such as CD2 (which
binds to LFA-3 on APCs) aggregate at the point of contact between the two cells, forming the
immunological synapse. The high affinity interaction of LFA-1 and ICAM-1 enriched in the
pSMAC forms a tight seal around cSMAC, stabilising the immunological synapse.
The formation of the immunological synapse mediates effector functions in two ways. It
provides a highly organised array of proteins including surface receptors, kinases and adaptor
proteins that favours the promotion of signalling events which ultimately lead to the expression
of genes involved in regulating T cell responses, such as cytokine release. It also mediates the
induction of polarisation of the Golgi apparatus (i.e. the Golgi apparatus moves within the cell
to the immunological synapse), an important organelle for the processing and packaging of
proteins, especially of those for secretion such as cytotoxins and cytokines. Polarisation of the
Golgi apparatus is caused by the re-orientation of the microtubule-organising centre (MTOC).
Page 43
Page 43 of 286
The MTOC produces and organises microtubules which form the structural network
(cytoskeleton) within the cell’s cytoplasm responsible for structural support and the movement
of molecules within the cell, owing to the microtubules’ ability to grow and shrink through
polymerisation of a major constituent; tubulin. The mechanism by which MTOC is re-orientated
involves DAG. Polarisation of the Golgi apparatus towards the immunological synapse allows
the concentration of effector molecules owing to the small area within the immunological
synapse, and the targeted release of such molecules to the cell presenting antigen, to which the
TCR is ligated (Huppa and Davis, 2003; Murphy et al., 2008; Yokosuka et al., 2008; Dustin et
al., 2010). For example, cytokine release by T cells is stimulated by ligation of the TCR by
antigen presented by an APC. Polarisation of the T cell allows cytokine secretion to be targeted
at and confined to the target APC at the immunological synapse. Incidentally, effector
molecules are not specific, i.e. they themselves do not target cells presenting antigen with a
specific sequence of amino acids. This accentuates the importance of the TCR in recognising
cells for which T cell effector functions are intended, i.e. through ligation of the TCR with
antigen possessing a specific amino acid sequence. Without target specificity for T cell effector
functions, effector molecules released by activated T cells could affect any cell within the
vicinity of the activated T cell.
The exact role of CD28 in the immunological synapse is poorly understood. It has been
reported that CD28 is involved in keeping protein kinase-Cθ within a sub-region of the cSMAC,
prolonging signals required for T cell effector functions through the NFκB pathway (Yokosuka
et al., 2008). In the absence of CD28 co-stimulation, protein kinase-Cθ is distributed throughout
the immunological synapse and is not concentrated in the cSMAC (Huang et al., 2002). It has
been suggested that the recruitment of PI3-kinase to the cytoplasmic tail of CD28 and
subsequent activation of this kinase results in the production of PIP3 in the immunological
synapse which leads to protein kinase-Cθ localisation and activation (Sanchez-Lockhart and
Miller, 2006) as shown in Figure 4. Sanchez-Lockhart and Miller also reported that CD28
engagement outside of the immunological synapse, i.e. away from the point of TCR/antigen
ligation, enhances T cell activation by increasing the stability of IL-2 mRNA rather than
through protein kinase-Cθ/NFκB-mediated IL-2 transcription (also shown in Figure 4).
Page 44
Page 44 of 286
Molecules are transported into the immunological synapse from around the cell through
linkage with membrane microdomains called lipid rafts. Lipid rafts are moving platforms within
the cell membrane consisting of sphingolipids and cholesterol, which are immiscible with the
surrounding lipid bilayer. They are enriched with Src family tyrosine kinases such as Lck and
Fyn and other molecules involved in early signalling events following ligation of TCRs and
CD28 such as LAT (Tavano et al., 2004; Tavano et al., 2006). Lipid raft movement into the
immunological synapse is induced by the simultaneous ligation of TCRs and CD28 and plays a
pivotal role in organising molecules in the immunological synapse. Lipid rafts are linked to the
microfilaments of the cytoskeleton by actin binding proteins (Rodgers et al., 2005).
Microfilaments are the thinnest filaments forming the cytoskeleton and are produced by the
linear polymerisation of actin subunits. Shrinkage of microfilaments at one end and elongation
at the other causes movement of associated molecules and thus mediates aggregation of lipid
rafts tethered by actin-binding proteins. TCR ligation and CD28 co-stimulation induces a re-
organisation of actin microfilaments and the signalling pathway has been reported to involve
Vav1 (Villalba et al., 2001). PIP3, a product of the kinase P13K, activates Vav1 which, through
activation of other signalling molecules, leads to the induction of actin polymerisation (Chichili
and Rodgers, 2009). This is summarised in Figure 4.
Filamin A is a protein found in the cytoplasm which cross-links actin resulting in a 3-
dimentional structure and so plays an important role in defining the structure of actin
microfilaments in the cytoskeleton. It has been reported that during T cell activation, CD28
ligation leads to its own interaction with filamin A which stimulates a re-organisation of the
microfilaments in the cytoskeleton. This in turn promotes the movement of lipid rafts linked to
the cytoskeleton into the immunological synapse along with associated signalling molecules
required for T cell activation (Tavano et al., 2006) as shown in Figure 4. The clustering of lipid
rafts in T cells also occurs prior to TCR signalling but during initial contact of APCs with T
cells. Others have called this “raft clustering during T cell surveying” or RaCS as it was thought
to facilitate T cells in “surveying” APCs for antigen presented by MHC molecules. This is
because raft clustering aggregates both TCRs and co-receptors such as CD4 at the point of
contact between T cells and APCs, the purpose of which is to lower the threshold of
Page 45
Page 45 of 286
antigen/MHC molecules required for activation. The role of CD28 and other co-stimulatory
molecules in RaCS formation is not yet clear however it has been reported to be PI3K and actin
dependent (van Komen et al., 2007; Chichili and Rodgers, 2009).
1.5 Summary of T cell responses following activation
Activation of naive T cells in the lymph nodes induces the cells’ entry into the first stage
of the cell cycle. In addition, it stimulates the production of IL-2 and induces the synthesis of
the chain (CD25 or IL-2Rα) of the IL-2 receptor. Resting T cells only express the β and γ
chains of the IL-2 receptor which can only bind to IL-2 with a moderate affinity which means
that resting T cells can only respond to relatively high levels of IL-2. However, when the
chain associates with the cell surface β and γ chains (IL-2Rβ and IL-2Rγ), the resulting IL-2
receptor complex has a very high affinity for IL-2 which means that activated T cells can
respond to relatively low levels of IL-2. When IL-2 (initially at low levels) binds to the high
affinity receptor, it induces signalling and further progression through the cell cycle. Only IL-2-
bound IL-2Rβγ or IL-2Rαβγ are capable of transducing signals. IL-2Rα alone cannot transduce
signals as it does not have a signalling domain. Cell division continues, resulting in clonal
expansion which creates a population of cells all with the same target antigen specificity.
Activated T cells are able to synthesise IL-2 as a result of the activation of the transcription
factors NFAT, AP-1 and NFκB which bind to the IL-2 gene promoter, inducing transcription of
the IL-2 gene. Since CD28 co-stimulation leads to activation of AP-1 and NFκB and stabilises
IL-2 mRNA (discussed previously), CD28 co-stimulation clearly plays an important role in IL-2
synthesis and cell proliferation (Appleman et al., 2000; Bachmann and Oxenius, 2007; Murphy
et al., 2008).
The progeny of proliferating T cells in the lymph nodes differentiate into effector T cells
which lose their ability to re-circulate through lymph nodes and migrate from the lymph nodes
to the infected tissue. Effector T cells have a variety of functions. Cytotoxic T cells (expressing
CD8) kill virus-infected cells through recognition of antigen associated with MHC class I
molecules which is followed by the induction of apoptosis. Effector T cells expressing CD4 can
Page 46
Page 46 of 286
be T helper 1 (Th1), Th2, Th17 or regulatory T cells (Tregs). A principle function of Th1 cells
is to promote macrophage activation and the subsequent killing of pathogens. Th1 and Th2 cells
both co-ordinate B cell activation and antibody production and so promote the humoral
response. Th17 cells enhance the recruitment of neutrophils to sites of infection and so promote
the acute inflammatory response. Tregs, however, serve to limit immune responses because they
produce inhibitory cytokines and suppress self-reactive T cells (illustrated in Figure 8).
The effector T cell subset that the progeny of proliferating T cells differentiate into is
dependent on the nature of cytokines produced during the innate immune response. For
example, in the presence of IL-12, expression of the transcription factor T-bet is promoted
which commits cells to the Th1 type, characterised by their production of IFNγ and IL-12, but
not IL-4 or IL-17. However, in the presence of IL-4, expression of the transcription factor
GATA is promoted, committing cells to the Th2 type, characterised by their production of IL-4
and IL-15 but not IFNγ (Murphy and Reiner, 2002; Murphy et al., 2008; Pepper and Jenkins,
2011).
The differentiation process also alters the expression of specific homing receptors. Such
receptors bind specific adhesion molecules on endothelial cells (for example LFA-1 to ICAM-1
or integrin α4:β7 to mucosal vascular addressin cell adhesion molecule-1 [MAdCAM-1] in the
gut) and also chemokines. The differential expression of adhesion molecules by cytokine
activated endothelial cells (e.g. by TNFα released by tissue macrophages) directs effector T cell
subsets to sites of inflammation (along with chemokines). It is here where these cells produce
specific cytokines and promote the clearance of antigens, for which the effector T cell subset is
specific. Following this, approximately 90% of effector T cells die and 10% become CD45RO+
memory T cells which are quiescent in the absence of their cognitive antigen and long lived.
The activation of memory T cells upon again encountering cognitive antigen leads to an
enhanced and rapid recall response to antigen. Memory T cells, like naive T cells, express CD28
on their surface which suggests that they are also susceptible to CD28 co-stimulation. Memory
T cells can be effector memory cells or central memory cells. Effector memory T cells migrate
to sites of inflammation in nonlymphoid tissue and can be found in large numbers in the lungs
and the gastrointestinal mucosa (lining of the intestine) but do not re-circulate through lymph
Page 47
Page 47 of 286
nodes. Their migration route is facilitated by the expression of homing receptors. Once activated
upon re-encounter with cognitive antigen, they produce microbicidal cytokines IFNγ, IL-4 and
IL-5. The current theory is that Th1 effector cells become Th1 committed effector memory T
cells, however, the role of Th2 and Th17 effector T cells in memory T cell formation is less
clear. In contrast to effector memory T cells, central memory T cells are thought to migrate
through lymph nodes owing to their expression of chemokine receptor CCR7 and L-selectin. It
is here where they are thought to undergo a secondary response upon re-encounter with antigen.
Initially, after activation, they produce IL-2 and proliferate. Only later do they acquire the
function of effector memory T cells and lose their expression of CCR7, resulting in their
migration to non-lymphoid tissue. As a result, central memory T cell-mediated responses are
likely to be slower (Campbell et al., 2001; Sallusto et al., 2004; Lanzavecchia and Sallusto,
2005; Pease and Williams, 2006; Murphy et al., 2008; Eastwood et al., 2010; Pepper and
Jenkins, 2011).
1.6 Superagonistic anti-CD28 antibodies
1.6.1 Mode of action at the membrane surface
Conventional agonistic anti-CD28 mAbs used in conjunction with antibodies which
stimulate via the TCR-CD3 complex (for example anti-CD3 antibodies) are able to activate T
cell proliferation but alone will not stimulate T cell responses (Acuto and Michel, 2003).
However, ‘superagonistic’ anti-CD28 antibodies activate T cell proliferation and differentiation
without concomitant stimulation via engagement of the TCR (Beyersdorf et al., 2005; Hunig
and Dennehy, 2005). This is illustrated in Figure 6.
Page 48
Page 48 of 286
Figure 6. T cell activation by conventional and superagonistic anti-CD28 mAbs. Only the superagonistic
mAbs are able to activate and stimulate T cell proliferation and cytokine production in the absence of a
signal via the TCR. Adapted from Beyersdorf et al. (2010).
The mechanism by which superagonistic anti-CD28 antibodies are able to stimulate T cell
responses without TCR/CD3 stimulation is unclear, however a number of theories, based on
comparisons made between superagonistic and conventional antibodies, have been made. CD28
superagonists bind to a lateral, membrane-proximal extracellular region of the CD28 receptor
termed the C’’D loop (amino acid residues 43 – 70). It is thought that because superagonistic
anti-CD28 antibodies can bind to this membrane-proximal region, they can bind bivalently to
contiguous CD28 molecules, thus allowing them to cross-link CD28 receptors on the cell
surface. This cross-linking leads to the formation of a complex of CD28 receptors, linked in a
linear fashion by the antibody: this ‘linear complex formation’ is illustrated in Figure 7
Page 49
Page 49 of 286
(Beyersdorf et al., 2005). Conventional, i.e. not superagonist, anti-CD28 antibodies are unable
to produce this linear complex because they bind to a membrane-distal region of the receptor
where the natural ligands CD80 and CD86 bind, which only allows these antibodies to bind
monovalently to CD28 molecules. Linear complex formation may lead to the aggregation of
signalling molecules which favours the interaction of essential components required for
subsequent T cell activation. This aggregation of signalling molecules may only occur upon
stimulation of the TCR when conventional anti-CD28 antibodies are used (Luhder et al., 2003;
Beyersdorf et al., 2005; Evans et al., 2005; Hunig and Dennehy, 2005).
Figure 7. Linear complex formation by superagonistic anti-CD28 mAbs. The capability of superagonistic
anti-CD28 mAbs to bivalently attach to lateral membrane-proximal C’’D loop regions of CD28 allows
the formation of a linear complex, which may cause aggregation of other components involved in the
signalling processes required for T cell activation. Adapted from Beyersdorf et al., 2005.
CD28 is monovalent for its natural ligands, i.e. in vivo, despite its existence as a
homodimer, it has only one binding site for CD80 and CD86. This may be a mechanism to
prevent activation of T cells without prior antigen recognition through the TCR since ligation of
CD28 monovalent constructs only induced T cell responses if the TCR was engaged; in
contrast, ligation of bivalent constructs did not require TCR engagement in order to stimulate
responses (Dennehy et al., 2006).
Another theory on the mode of action of CD28 superagonists is that their capability to
cross-link CD28 at close proximity to the membrane (compared with conventional CD28
agonists) due to the position of the epitope (C’’D loop) favours formation of an immunological
Page 50
Page 50 of 286
synapse in which larger molecules such as phosphatases (which dephosphorylate molecules and
thus are essentially antagonists of kinases) are excluded. This would allow domination by
smaller molecules such as kinases which would favour the initiation of subsequent signalling
events (Hunig and Dennehy, 2005). The close proximity of CD28 cross-linking to the
membrane by superagonists may also influence the proximity of intracellular signalling
molecules associated with the cytoplasmic tails of CD28, in a favourable manner for T cell
activation. It has also been suggested that superagonistic antibodies preferentially bind CD28
molecules that have pre-aggregated on the membrane. Clustering of such molecules may render
them competent in signalling due to a richness of signalling molecules such as kinases.
Preferential ligation of pre-clustered molecules by superagonists may be due to the fact that only
the epitope containing the C’’D loop is accessible, eliminating the potential for conventional
CD28 antibodies to bind. Another possibility is that superagonsists stimulate a conformational
change which activates downstream signalling processes in a manner that conventional
antibodies alone cannot stimulate (Luhder et al., 2003).
1.6.2 Signalling events following CD28 superagonist activation
Signalling pathways activated by strong signals elicited through the bivalent ligation of
CD28 superagonists are not fully understood and are still being elucidated. Experiments using T
cell hybridomas revealed that the presence of the TCR, ZAP-70 and LAT are required for CD28
superagonistic activation, despite the fact that ligation of the TCR is not required. It was
suggested that superagonistic CD28 activation was reliant on low level constitutive
“background” signals emanating from TCR (Hunig and Dennehy, 2005). The physiological
function of these background signals is to regulate development of T cells and maintain T cell
identity and such signals have been found to involve LAT and SLP76 (Roose et al., 2003).
Further experiments aimed at identifying signalling targets undergoing tyrosine phosphorylation
revealed that the point at which “background” signals emanating from unligated TCR merged
with signals emanating from CD28 superagonistic activation was at the stage where signalling
molecules SLP76/Vav1/Itk interact (Hunig and Dennehy, 2005). Interestingly, this is at the
Page 51
Page 51 of 286
same point where signals from conventional CD28 co-stimulation, including TCR ligation, have
been shown to merge as described above. It is possible that signalling induced by either CD28
ligation by its natural ligand (in which CD28 is monovalent for the ligand) or CD28 ligation by
conventional antibodies (in which the antibodies may be monovalent for CD28) is insufficient
to enhance “background” signals emanating from unligated TCRs. However, stronger signalling
from bivalent CD28 superagonist activation is sufficient to heighten “background” signals from
the TCR. Other studies have shown that CD28 superagonist stimulation, as with conventional
TCR/CD28 co-stimulation, leads to translocation of transcription factors NFκB and NFAT
without phosphorylation of ZAP70 and TCRζ above “background” levels (Siefken et al., 1998;
Bischof et al., 2000).
1.7 Intended therapeutic use of TGN1412
T cells undergoing development in the thymus are called thymocytes. During this
development thymocytes undergo a process called positive selection which essentially only
allows thymocytes that can recognise self antigen associated with self MHC molecules,
expressed by other cells in the thymus, to undergo further development. The purpose is to select
for thymocytes that, when mature, will only interact with antigen expressed in the context of
self MHC molecules. The fact that thymocytes recognise self antigen associated with MHC at
this stage is not important. Selected thymocytes continue to develop and become either CD4+ or
CD8+ depending on their ability to interact with either self MHC class II molecules or self
MHC class I molecules respectively. Thymocytes also undergo a process called negative
selection in which cells that have the potential to recognise and strongly bind self antigens
(through their antigen specific TCR), presented by thymic epithelial cells and bone marrow
derived APCs such as dendritic cells, present in the thymus, are eliminated. This prevents the
development of mature T cells capable of mediating immune responses against self-antigens
(self-reactive T cells) expressed by healthy tissues. Negative selection has been termed central
tolerance. However, some T cells are able to avoid negative selection in the thymus if they do
not strongly bind self antigen during development. This may happen if the self antigen for
Page 52
Page 52 of 286
which the TCR is specific is not expressed by cells such as thymic epithelial cells during the
process of negative selection.
T cells that have escaped negative selection in the thymus are kept in check by a number
of peripheral tolerance mechanisms which operate outside of the thymus. Mature lymphocytes
can be made tolerant to self antigen if such self antigens are expressed by all cells in the body or
when expressed in high numbers by connective tissue and thus give strong and constant signals
to TCRs. In addition, as previously discussed, T cell activation requires co-stimulatory signals
in addition to antigen recognition via TCRs, thus self-reactive T cells recognising self antigens
on APCs not expressing co-stimulatory ligands such as CD80 and CD86 are inactivated and
enter a state of anergy or undergo apoptosis. Another peripheral tolerance mechanism is that
imposed by CD4+ Tregs which result from positive selection in the thymus, but which are
thought to have avoided negative selection and so weakly bind self antigens and so are self-
reactive. However, in contrast to other CD4+ or CD8+ T cells, interaction of Tregs with self
antigen does not activate their differentiation into effector cells that can damage tissues
expressing the self antigen but, instead, activates their differentiation into suppressor cells of
other self-reactive T cells (Walker and Abbas, 2002; Murphy et al., 2008). The mechanism by
which Tregs suppress self-reactive T cells is yet to be elucidated but cell to cell contact between
Tregs and self reactive T cells is thought to be required along with the production of anti-
inflammatory cytokines such as IL-10 and transforming growth factor-β (TGF-β).
Despite the fact that central and peripheral tolerance mechanisms are in place to avoid the
detrimental effects that can be caused by self-reactive T cells, i.e. T cells with TCRs specific for
self antigens expressed by healthy tissue, such events still occur resulting in autoimmune
diseases such as rheumatoid arthritis. Defects in the genes involved in promoting central and
peripheral tolerance mechanisms are thought to lead to autoimmune diseases. In addition,
foreign antigens from pathogens can stimulate immune responses that are specific for the
foreign antigen but, occasionally, cross-reactivity of immune responses occurs when a foreign
antigen is similar to a self antigen. Several experimental studies suggested that CD28
superagonists showed potential as therapeutic antibodies for the treatment of autoimmune
disease. Thus, it has been shown that CD28 superagonists were able to expand purified human
Page 53
Page 53 of 286
and rat Tregs in vitro and that these possessed enhanced suppressive activity compared with
Tregs that had been freshly isolated and not stimulated with CD28 superagonists. The enhanced
suppressive activity was exclusive to Tregs as other T cells were not suppressive when
stimulated with CD28 superagonists (Beyersdorf et al., 2005).
Other in vitro proliferation assays were conducted involving the culture of TGN1412 (in
solution) with either PBMC, purified T cells or T cell subsets including CD4+ and CD8+ T
cells, and naïve (CD4+CD45RA+), memory (CD4+CD45R0+) and regulatory (CD4+CD25+) T
cells from healthy donors. These assays showed that this CD28 superagonist was capable of
stimulating activation and proliferation of T cell subsets including CD4+ cells, CD8+ cells,
naive and memory T cells and, most notably, Tregs, unlike conventional CD28 mAb (TeGenero
AG, 2005a). In vivo experiments revealed that CD28 superagonists administered to rats not only
increased the number of Tregs, but activated these cells and led to an increase in their
suppressive activity (Beyersdorf et al., 2005). Consistent with this finding, an anti-rat CD28
mAb; JJ316, inhibited the process of inflammation in adjuvant-induced arthritis, a model of
autoimmunity, in rats (Rodriguez-Palmero et al., 2006). This inhibitory effect was associated
with increased levels of Th2 cytokines such as the anti-inflammatory cytokine IL-10 and the
expansion of Tregs (Rodriguez-Palmero et al., 2006). In addition, animal models of
autoimmune encephalomyelitis (used to represent the autoimmune disease multiple sclerosis)
showed that administered CD28 superagonists were able to greatly mitigate symptoms
(Beyersdorf et al., 2005). Furthermore, CD28 superagonists were effective in a rat model of
autoimmune neuritis (Schmidt et al., 2003) and arthritis in non-human primate models
(TeGenero AG, 2005a).
It is not fully understood why CD28 superagonists preferentially expanded Tregs rather
than other T cell subsets in pre-clinical studies although several theories have been proposed.
The ability of Tregs to weakly bind self antigen may provide constitutive TCR signalling. The
presence of this first signal could render the Tregs more sensitive to CD28 superagonist
stimulation but not conventional anti-CD28 stimulation (Beyersdorf et al., 2005). Treg-imposed
mechanisms have been found to be dependent on the interaction of CD28 expressed by Tregs
with its natural ligand B7 (Tang et al., 2003). It is likely therefore that CD28 superagonists
Page 54
Page 54 of 286
“boost” pre-existing signals resulting from a physiological mechanism evolved to mediate Treg
self tolerance mechanisms. An imbalance in the number and function of self-reactive T cells and
Tregs leads to autoimmunity. CD28 superagonists are believed to resolve the imbalance by
stimulating Treg differentiation and activation, as shown in Figure 8, and so have the potential
to reinstate peripheral tolerance (Beyersdorf et al., 2005). Human rheumatoid arthritis is an
autoimmune disease and so is mediated by self reactive immune responses and has been
correlated with a deficiency in Treg cell numbers and/or function (Ehrenstein et al., 2004).
Therefore, TGN1412 as a CD28 superagonist with the potential capability to preferentially
expand Tregs was proposed for the treatment of this disease.
Figure 8. Anti-CD28 superagonist therapy restores a balance between regulatory T cell and self reactive T
cell number and function in autoimmunity. Autoimmunity can occur when self reactive T cells are not
suppressed due to a deficit in Treg number and function. Treatment with superagonistic anti-CD28 mAbs
induces preferential expansion and activation of Tregs which suppress self reactive T cells and restore
peripheral tolerance. Adapted from Beyersdorf et al., 2005.
Page 55
Page 55 of 286
Besides the treatment of rheumatoid arthritis, it was proposed that TGN1412 could be
developed for the treatment of B cell chronic lymphocytic leukemia (B-CLL), a disease in
which there is an accumulation of malignant B lymphocytes (or B-CLL cells) with an impaired
ability to express MHC class II molecules and co-stimulatory ligands CD80 and CD86. This
reduced expression of such molecules hinders their capability to function as APCs and to
stimulate T cell responses. TGN1412 cultured as a solution with human PBMC from B-CLL
patients up-regulated the expression of these molecules on the surface of B-CLL cells (Lin et
al., 2004) arguing for its potential for treating B-CLL by restoring the antigen presentation
properties of B-CLL cells, leading to improved T cell responses for combating infections and
destroying the malignant B cells. In addition, CD28 superagonist treatment of rats in a model of
T cell lymphopenia stimulated the expansion of T cells resulting in a re-population of T cells in
which phenotypic diversity and function was maintained (Elflein et al., 2003); of course this
would be an additional advantage to patients deficient in functional T cells, another clinical
symptom of B-CLL (Cantwell et al., 1997).
The capability of TGN1412 to preferentially expand Tregs, justifying its potential for the
treatment of rheumatoid arthritis, was originally thought to be dependent on its capability to
induce the expansion of other T cell subsets (i.e. its justification for the treatment of
lymphopenia). It was proposed that CD28 superagonist activation of T cells leads to IL-2
production which stimulates proliferation of these activated T cells and Tregs, which have also
been activated by the CD28 superagonist. Activated and expanded Tregs may then suppress
other activated T cells resulting in a “loop” that allows T cell tolerance to be maintained in the
presence of functionally active T cells. Therefore, the two putative mechanisms of TGN1412
are not mutually exclusive (TeGenero AG, 2005a). In fact, it was thought that the
overexpansion of Tregs by CD28 superagonists and their capability to induce anti-inflammatory
cytokines gave these mAbs an advantage as a therapeutic means to reconstitute T cell
repertoires in lymphopenia over other drugs that expand T cell populations through stimulation
of the TCR-CD3 complex as these have resulted in toxic pro-inflammatory cytokine release in
the absence of high Treg numbers to promote T cell tolerance (Elflein et al., 2003; TeGenero
AG, 2005a).
Page 56
Page 56 of 286
1.8 Pre-clinical testing to predict TGN1412 toxicity
Findings from the experimental studies described above using CD28 superagonists were
the basis for the proposed therapeutic applications of TGN1412. Other studies were conducted
to evaluate the therapeutic potential of TGN1412 itself and to predict the clinical safety of the
mAb to allow it to progress to a “first time in man” phase I clinical trial.
The specificity of TGN1412 itself for human CD28 was confirmed in various assay
systems including Biacore analysis and flow cytometric analysis and the molecule did not cross-
react with the receptors inducible T-cell costimulator (ICOS) or cytotoxic T-lymphocyte antigen
4 (CTLA-4) which are closely related to CD28.
As discussed earlier, therapeutic mAbs can elicit responses termed Fc effector functions,
mediated through ligation of their Fc moiety as opposed to interaction of their variable region
with target antigen. Such effector functions include ADCC and CDC. For some therapeutic
antibodies, these effects are desirable/crucial to the treatment of the disease for which the
antibody is intended. For other mAbs, these are undesirable side effects. The proliferation and
expansion of functional T cell repertoires stimulated by TGN1412 was considered crucial to its
capability to function as a treatment for rheumatoid arthritis and B-CLL, whereas destruction of
these cells by TGN1412 Fc-mediated ADCC would reverse the effect. Of course, the
destruction of all CD28 expressing cells through ADCC mediated by TGN1412 could also have
devastating clinical effects. Due to the fact that TGN1412 is an IgG4 mAb, it was unlikely that
ADCC events would occur but, to confirm this, several different in vitro assays were conducted.
TGN1412 was incubated with modified human Jurkat cells and although the exact experimental
details are not given, no evidence of ADCC activity was observed. In contrast, TGN1112, the
IgG1 variant of TGN1412 (a subclass that is commonly associated with ADCC), did mediate
ADCC against all CD28+ Jurkat cell lines tested along with Campath-1H, an IgG1 therapeutic
mAb used for the treatment of cancer (TeGenero AG, 2005a; TeGenero AG, 2005b; Expert
Group on Phase One Clinical Trials, 2006) owing to its capability to induce ADCC-mediated
destruction of malignant cells expressing Campath-1H’s target receptor; CD52 (Waldmann and
Hale, 2005). In addition, pre-clinical tests were conducted to determine the capability of
Page 57
Page 57 of 286
TGN1412 to induce CDC. Although details on exactly how this was determined are not given,
the incubation of TGN1412 and TGN1112 in solution with human PBMC showed no evidence
to suggest that CDC was induced by these mAbs (TeGenero AG, 2005b).
In order to identify a suitable species for in vivo toxicology and safety studies, TGN1412
was incubated in solution with T cells isolated from humans, rodents and non-human primates,
including rhesus and cynomolgus macaques and marmosets, expressing CD28. TGN1412 was
able to bind to T cells from humans, cynomolgus and rhesus macaques but not with rodent or
marmoset T cells. Furthermore, sequence analysis of the extracellular binding domain of
TGN1412; the C’’D loop, in different species revealed exact sequence homology between
humans and cynomolgus macaques, which differed from rhesus macaques by one amino acid
and marmosets by two amino acids out of a total of 6. For this reason, cynomolgus macaques
were chosen for further in vivo studies. A 28-day repeat-dose pharmacological safety study was
conducted in 16 cynomolgus macaques (8 male and 8 female) to assess the effects of TGN1412,
at doses of 5 and 50 mg/kg, given 4 times, on the cardiovascular system, the respiratory system
and the central nervous system. TGN1412 did not cause any significant changes in
measurements such as heart rate or any histological abnormalities of cardiovascular tissue. No
clinical symptoms were found that would suggest an adverse effect of TGN1412 on the
respiratory system, although it was found that it did bind to lymphocytes in human and
cynomolgus macaque lung tissue, which is not surprising given the distribution of the target
receptor. Although TGN1412 did bind to brain, spinal cord and pituitary gland tissue, from both
human and cynomolgus macaque donors, this was considered a low risk effect since the 28-day
toxicology study in macaques showed no clinical adverse effects on the central nervous system.
Furthermore, as an IgG mAb, in man it was not likely to pass the blood brain barrier. Taken
together, these data suggested that TGN1412 was not likely to cause adverse affects in man on
the cardiovascular system, the respiratory system or the central nervous system (TeGenero AG,
2005a).
Other toxicological studies in cynomolgus macaques revealed that TGN1412 was well
tolerated and no adverse effects were observed at doses up to and including 50 mg/kg/week over
a period of 4 weeks. TGN1412 administered to cynomolgus macaques did cause an increase in
Page 58
Page 58 of 286
the number of CD4+ and CD8+ T cells 13 – 17 days post infusion. This was considered an
expected effect given the mode of action of CD28 superagonists and so further validated the use
of cynomolgus macaques as an animal model for predicting the clinical effects of TGN1412. In
addition, the serum levels of IL-2, and Th2 cytokines IL-5 and IL-6 were moderately elevated
but pro-inflammatory cytokines TNF and IFNγ remained unchanged following treatment, and
there was certainly no evidence to suggest that TGN1412 would cause a “cytokine storm”. In
addition, intravenous administration of TGN1412 in rabbits did not indicate any clinically
significant effects.
The starting dose of TGN1412 to be administered to the volunteers in the trial was based
on the findings from in vivo experiments with Cynomolgus macaques. The No Observed
Adverse Effect Level or NOEL is a method that has often been used to identify a safe starting
dose in humans (US Food and Drug Administration: Center for Biological Evaluation and
Research, 2005) and it is the highest dose at which no statistically significant and/or biologically
relevant adverse event is observed (Stebbings et al., 2009). The maximum dose of TGN1412
infused into Cynomolgus macaques was 50 mg/kg and this did not cause any clinical symptoms,
therefore 50 mg/kg was considered as the NOEL. The human equivalent of the non-human
primate NOEL was 16 mg/kg, calculated by applying a correction factor of 3.1 which corrected
for the difference in body surface area between the two species. The default safety factor of 10
was applied and an additional safety factor was included leading to a starting dose in humans of
0.1 mg/kg which actually allowed a 160-fold safety margin on the NOEL (TeGenero AG,
2005a).
In summary, pre-clinical testing of TGN1412 involved experiments conducted using
TGN1412 and TGN1412 orthologues such as the mouse anti-rat CD28 mAb JJ316 (Tacke et al.,
1997), the mouse anti-human CD28 mAb 5.11A1 (Luhder et al., 2003) and the IgG1 variant of
TGN1412 with an identical variable domain; TGN1112 (TeGenero AG, 2005a). These studies
involved the use of either animal models (rodents and macaques) or in vitro experiments using
PBMC, purified T cells and T cell subsets in which the CD28 superagonists were incubated in
solution and showed no evidence to suggest that TGN1412 could cause any clinical effects if
Page 59
Page 59 of 286
used in human therapy, despite its capability to induce T cell proliferation and the production of
anti-inflammatory cytokines.
1.9 Phase I clinical trial of TGN1412
In the UK, regulatory approval was granted by the Medicines and Healthcare Products
Regulatory Agency (MHRA) for a clinical grade batch of TGN1412 to progress to a Phase I
“first time in man” clinical trial after pre-clinical tests showed no evidence to suggest that this
mAb would cause any toxic effects in humans. The Paul Ehrlich Institute also granted
regulatory approval for TGN1412 to enter a Phase I trial in Germany, scheduled to take place
soon after the UK trial (Expert Group on Phase One Clinical Trials, 2006). Phase I trials are
usually conducted early in the development of a drug and are carried out to identify a safe
starting dose for subsequent studies and to assess the toxic side-effects, action, metabolism,
distribution within the body and excretion of a drug. The UK trial took place on March 6th 2006
and was carried out by the contract research organisation Parexel on behalf of TeGenero, in
leased space at Northwick Park Hospital. The aim of the study was to assess the effect of single
doses of TGN1412 administered to human healthy males intravenously on cytokine release, T
cell subsets and the generation of anti-TGN1412 antibodies. Females were not included in the
trial since effects on reproduction had not been established in pre-clinical testing. Healthy
subjects were used as opposed to patients suffering from B-CLL or rheumatoid arthritis, i.e. the
two diseases for which TGN1412 was intended as a therapy. Healthy subjects were also used
because pre-clinical tests were conducted in healthy animals which showed no adverse effects
and this may not have been the case if subjects were not healthy. Moreover, the level of CD28
expression was comparable between human subjects and those suffering from B-CLL and
rheumatoid arthritis thus pharmacokinetic behaviour was likely to have been comparable in
patients with these diseases. In addition, TGN1412 activity was unlikely to have been affected
by other medications in healthy subjects. The starting dose was 0.1 mg/kg body weight and it
was intended that doses of 0.5, 2 and 5 mg/kg would follow, i.e. a dose escalation study was
intended. Eight consenting males were enrolled in the study, six receiving the starting dose of
Page 60
Page 60 of 286
TGN1412, and two receiving a placebo. The mAb or placebo was infused into the volunteers at
10 minute intervals (Expert Group on Phase One Clinical Trials, 2006).
Within 60 - 120 minutes of infusion, all six volunteers given the TGN1412 suffered a
number of clinical symptoms including severe headaches, lumbar myalgia, nausea, vomiting,
diarrhoea, amnesia, severe pyrexia and restlessness. A systemic inflammatory response, which
included peripheral vasodilation and erythema, was observed in all patients. After 240 minutes,
all patients had tachycardia, hypotension and elevated body temperatures ranging from 39.5 to
40°C. Volunteers given TGN1412 were initially treated within the clinical trials unit and
showed signs of recovery. However all volunteers were transferred to the nearby NHS Intensive
Care Unit within 16 hours of infusion due to concerns that they might all develop respiratory
distress after this had occurred in one of the volunteers. Indeed, the condition of all 6 patients
worsened and all showed symptoms of respiratory distress. Other clinical effects suffered were
disseminated intravascular coagulation leading to necrosis of the fingers of both hands and of all
toes in one patient; (see Figure 9) and multiple organ failure in all patients. All six individuals
survived but suffered subsequent clinical effects such as muscle weakness, myalgia, headaches,
difficulties with concentration, peripheral numbness (Suntharalingam et al., 2006), loss of
fingers and toes (one patient) and, not surprisingly, psychological effects.
Figure 9. Clinical effect of TGN1412: tissue necrosis in fingers of the most seriously affected TGN1412
clinical trial volunteer as a result of disseminated intravascular coagulation (BBC, 2006).
Page 61
Page 61 of 286
The adverse effects of TGN1412 were mediated by a rapid and dramatic increase in
cytokine concentrations: TNF concentrations in the serum of the volunteers increased within
an hour after TGN1412 infusion. This was followed by increases in Th1 and Th2 and T
regulatory cell cytokines including IL-2, IL-6, IL-8, IL-1β, IL-10, IL-4 and IFNγ within 4 hours
post-infusion. Concentrations returned to normal within 2 days (which was likely to have been a
result of medical intervention) except for the two patients who suffered the worst effects, whose
elevated IL-4 and IL-6 serum concentrations were prolonged by a further 1 to 2 days. The term
“cytokine storm” was coined to describe the cascade of pro-inflammatory cytokine release
which evoked fever, pain and multiple organ failure in the trial volunteers (Suntharalingam et
al., 2006).
In addition to the cytokine storm, a reduction in the number of lymphocytes and
monocytes in the blood of the volunteers within 8 hours post-infusion was observed resulting in
severe lymphopenia and monocytopenia. It is not clear whether this was a result of cell death or
the migration of the cells from blood across endothelium to other tissues such as the lymph
nodes. Despite the overlap with the cytokine storm, it is not known if this depletion of cells was
a response to the infusion of the T cell agonist or a response to the cytokine storm alone.
Following lymphopenia, the numbers of CD3+, CD4+ and CD8+ T cells measured in peripheral
blood increased and peaked at day 5 and again at day 15 after infusion. The cytokines produced
in the reaction were those associated with various T cell subsets (e.g. Th1, Th2 and Treg cells)
and not just those of Treg cells, as predicted by the pre-clinical tests.
In summary, clinical events following infusion of TGN1412 were separated into four
phases. The rapid increase in serum cytokine concentrations and lymphopenia and
monocytopenia occurred in phase 1, which began approximately 60 minutes post-infusion. This
lasted between 2 to 3 days depending on the volunteer. Phase 2 was considered as the reactive
phase during which volunteers developed multiple organ failure including renal and respiratory
failure. This occurred from day 1 through to day 8 but varied amongst the volunteers. Phase 3
was considered the recovery phase during which patients recovered from multiple organ failure,
lymphopenia and monocytopenia and occurred between days 3 and 15, depending on the
Page 62
Page 62 of 286
volunteer. Phase 4 was considered as the steady-state phase during which measured responses
returned to normal. This occurred from day 15 to 20, again depending on the volunteer.
Phase I clinical trials are usually conducted with the aim to confirm the findings from pre-
clinical testing (Bhogal and Combes, 2006). Clearly the TGN1412 trial did not confirm the
findings of pre-clinical testing as such tests did not predict that TGN1412 would induce a
cytokine storm or any other serious adverse events.
1.10 Events following the TGN1412 clinical trial
Following the clinical trial, at the request of the MHRA, TGN1412 used in the clinical
trial was subject to a broad range of analytical techniques conducted at the National Institute for
Biological Standards and Control (NIBSC). The results of these tests confirmed that the batch
infused into the trial volunteers complied with its specification, was of clinical grade and that no
errors had been made during its quality control testing (Expert Group on Phase One Clinical
Trials, 2006; Stebbings et al., 2007). Included in this range of confirmatory tests was a bacterial
endotoxins test, also known as a Limulus amebocyte lysate or LAL test (Mascoli and Weary,
1979a; Mascoli and Weary, 1979b) and a rabbit pyrogen test, which can detect endotoxin and
non-endotoxin pyrogenic (fever-inducing) contaminants (Probey and Pittman, 1945). These
tests were carried out since the initial pro-inflammatory cytokine storm suffered by the
volunteers was characteristic of a response to endotoxin or other pyrogenic contaminants of
medicines. Nevertheless, the material inside the syringes intended for use in the trial passed the
rabbit pyrogen test and the bacterial endotoxins test, as well as a test for abnormal toxicity using
mice and guinea pigs. The results of these tests were not consistent with the notion that
TGN1412 was contaminated with a pro-inflammatory/pyrogenic agent such as endotoxin or a
non-endotoxin pyrogen to which rabbits are sensitive.
Page 63
Page 63 of 286
1.11 Aims of study
The disastrous events of the TGN1412 clinical trial clearly reflect the limited capability
of testing procedures available at present to predict the toxic effects of novel biological
medicines such as mAbs. It is essential, however, that the development of new therapeutics for
the treatment of disease continues. To allow this to happen, pharmaceutical companies and
regulatory authorities require better testing procedures capable of predicting toxic effects of
therapeutic mAbs to be confident that such medicines are safe prior to their being given in man.
The use of animal models for testing therapeutic mAbs has been questioned from an ethical
point of view, especially as it cannot be certain that the chosen species will lead to accurate
predictions about the toxicity of the medicine, as was the case for TGN1412. It is an opinion
shared by many that more emphasis should be placed on developing alternatives to testing on
animals (Bhogal and Combes, 2007; Liebsch et al., 2011), highlighted by the fact that some
governments now endorse the “3Rs” principle of Replacement, Refinement and Reduction of
tests involving animals, originally proposed by Russell and Burch in 1959 (Flecknell, 2002). In
vitro, the use of human tissue itself is likely to be the most physiologically relevant means for
predicting human responses to infused medicines though currently it is limited by the lack of
methods available that can reliably predict the clinical effects of therapeutic mAbs. Therefore,
the hypothesis of this study is as follows:
Cytokine-driven adverse effects of therapeutic monoclonal antibodies and the mechanisms
involved can be better predicted with novel in vitro procedures using human cells.
The hypothesis of this study is tested by pursuing the following three experimental objectives:
1. To develop in vitro procedures using human cells capable of predicting the clinical effects of
TGN1412
The basic format of cytokine release assays often successfully used to evaluate the
capability of medicines to stimulate cytokine release (Taktak et al., 1991; Wing et al., 1995;
Page 64
Page 64 of 286
Gaines Das et al., 2004) can be summarised as follows. First, human white blood cells are
incubated with a range of doses of the medicine under investigation in microtitre plates in a
medium containing human or bovine plasma/serum. During the incubation, cells accumulate at
the bottom of the wells of the microtitre plate under gravity permitting the isolation of the “cell-
conditioned medium” from the cells using a multi-channel pipette. The term cell-conditioned
medium is used to describe the cell-free culture medium that may contain cytokines (or other
soluble factors) released by cells in response to the medicine. The incubation period is sufficient
to allow for the accumulation of cytokines. Second, cytokine responses are measured by
assaying the cell-conditioned medium in cytokine-specific enzyme linked immunosorbent
assays (ELISAs). This basic format described will be used as a starting point for the
development of in vitro procedures that can predict clinical responses to TGN1412. In the first
instance, methods which result in a “solid phase” presentation of TGN1412 to human white
blood cells during the incubation period will be investigated and compared with the
conventional method of presenting the mAb in “aqueous phase”. The term “solid phase” is used
to describe a mAb that is immobilised by a solid support and is discussed in more detail in the
Introduction of Chapter 4. In the second instance, the notion that TGN1412 activated target
blood cells in the presence of endothelial cells in the trial volunteers is considered. This is
highly likely given that endothelial cells form microvessels (including the high endothelial
venules which facilitate the movement of lymphocytes from the blood into lymph nodes) and
the lining of large vascular blood vessels. Furthermore, endothelial cells play a fundamental role
during an immunological response (Pober and Sessa, 2007) as discussed in more detail in
Chapters 5 and 6. Therefore, a method in which a monolayer of human endothelial cells is co-
cultured with human white blood cells in the presence of TGN1412 (aqueous phase) is also
investigated.
A number of different experimental conditions will be explored for both of the
adaptations (i.e. the “solid phase” presentation method and the endothelial/blood cell co-culture
method) of the basic format for cytokine release assays mentioned in the paragraph above.
These are discussed in more detail in the relevant chapters. Fresh whole blood/PBMC isolated
from donors at NIBSC will be used so that the cells are in their natural state as far as is
Page 65
Page 65 of 286
practicable. Cryogenic storage was not considered an option since it can often lead to altered
phenotypes and cell damage (Tollerud et al., 1991).
To evaluate whether or not the procedures developed are capable of predicting the clinical
effects of TGN1412, several responses or “readouts” will be measured which are representative
of the responses stimulated by TGN1412 in the clinical trial volunteers. This includes the
cytokines TNFα, IL-6, IL-8, IFNγ and IL-2 which, in most instances, will be measured in the
cell-conditioned medium by cytokine specific ELISAs. Indeed, these cytokines were all
elevated in the blood of the TGN1412 recipients (Suntharalingam et al., 2006). In addition,
given that TGN1412 stimulated T cell proliferation during pre-clinical testing (TeGenero AG,
2005a) and in the trial volunteers (Suntharalingam et al., 2006), the proliferative response of
cells remaining in the wells following the removal of cell-conditioned medium will also be
measured.
2. To use these procedures to gain a better understanding of the mechanism of action of
TGN1412.
After optimising the methods developed under the first objective, these procedures will be
used to explore potential mechanisms for TGN1412-stimulated cytokine release in the trial
volunteers. The mechanisms to be explored are described in the relevant chapters. Most notably,
the role of PBMC in endothelial cell contact in TGN1412-stimulated responses is investigated
together with the role of endothelial cell/PBMC adhesion molecule interactions.
3. To validate the use of the procedures developed for predicting cytokine release syndrome
caused by therapeutic antibodies other than TGN1412 that are associated with a significant
incidence of clinical infusion reactions.
A selected panel of therapeutic mAbs which are/are not associated with a significant
incidence of clinical infusion reactions resulting in cytokine release (according to the literature)
will be tested using the procedures developed in this study. The pattern of in vitro cytokine
release stimulated by the panel of mAbs will be compared with their reported associated
Page 66
Page 66 of 286
incidence of pro-inflammatory clinical infusion reactions in order to evaluate the predictive
value of the novel methods that are developed.
Page 67
Page 67 of 286
Chapter 2:
General methods
Page 68
Page 68 of 286
CHAPTER 2: General methods
This chapter describes the general methods used during the course of this study.
Procedures developed as part of the aim of a practical chapter or that are specific to one chapter
are described in the Methods section for the relevant chapter.
2.1 General information
Aseptic technique and materials that were sterile and free from detectable pyrogens were
used for all procedures involving cell culture. Buffers/solutions referred to in the text were
prepared as described in Appendix I unless otherwise stated. Bovine serum albumin (BSA) and
ovalbumin used were from Sigma (A7888 and A5503 respectively). All concentrations of
samples and controls were tested in quadruplicate in each assay unless otherwise stated in the
specific Methods section for each chapter. In all cases, each value in a data set for a given
treatment is the mean of 4 replicates. The number of independent assays carried out as
repetitions of a particular experiment and the total number of donors providing cells for each
experiment are given in the legends to each of the figures in the Results section for each chapter.
Methods used for statistical analyses are also described in each chapter. Differences were
considered significant where p<0.05.
2.2 Blood donation and isolation of PBMC
The use of donated blood for this project was approved by NIBSC Human Materials
Advisory Committee (HuMAC). Human whole blood was donated by consenting employees of
NIBSC and was taken by a qualified Phlebotomist. Donors were healthy males or females self-
diagnosed to be free of symptomatic viral and bacterial infections who had not taken steroidal
anti-inflammatory medicines during the 7 days prior to giving blood or non-steroidal anti-
inflammatory medicines during the 3 days prior to giving blood or any other drug known to
influence immunological responses. PBMC and donor plasma were isolated from heparinised
Page 69
Page 69 of 286
(Fragmin Dalteparin Sodium, Pharmacia, 10 IU [international units]/ml blood), freshly donated
(<30 min after withdrawal) whole blood by density gradient centrifugation using Lymphoprep
(Axis-Shield Diagnostics 1114545) or Histopaque (Sigma H8889) layered beneath whole blood
diluted 1 in 2 with PBS (phosphate buffered saline) B when using Lymphoprep or undiluted
whole blood when using Histopaque. After layering, the blood/Histopaque or Lymphoprep-
containing centrifuge tubes were centrifuged at 340 x g for 45 min at room temperature. After
centrifugation, a serological pipette was used to aspirate plasma forming the uppermost layer in
the tube as shown in Figure 10 and stored for further use in assays where donor’s own plasma
was required.
Figure 10. Separation of PBMC from human blood by density gradient centrifugation. Mononuclear cells
(monocytes and lymphocytes) and thrombocytes have a lower buoyant density than erythrocytes and
polymorphonuclear cells (neutrophils, basophils and eosinophils) and so whilst the polymorphonuclear
cells sediment through a solution with a density of 1.077 g/ml (Histopaque or Lymphoprep), mononuclear
cells are retained at the sample/solution interface when tubes are centrifuged. Image taken by NIBSC
photographer.
Page 70
Page 70 of 286
PBMC forming the next layer (as shown in Figure 10) were aspirated and stored in a
separate centrifuge tube. Tubes containing PBMC were filled with PBS B (50 ml final volume)
and centrifuged at 340 x g for 10 -15 min at room temperature. After discarding the supernatant,
PBMC were washed 1-2 more times prior to re-suspension in culture medium (as described in
the Methods for each chapter of this study). PBMC were stored in a humidified incubator at
37°C, 5% CO2, and were used in experiments within 4 h of blood collection. If used, donors’
own plasma was stored at room temperature until required, i.e. also within 4 h of blood
collection.
2.3 Cell counts
A sample of the cell suspension for which the cell concentration was to be determined
was diluted 1 in 2 with culture medium and 95 μl of cell suspension was mixed with 5 µl trypan
blue (0.4% w/v solution, Sigma T8154). Cell counts were conducted using an Improved
Neubauer haemocytometer. The coverslip was fitted such that coloured concentric rings
(Newton’s rings) could be seen at the coverslip/counting chamber interface prior to loading the
sample until the counting chamber was full but not overflowing. Cells were visualised under
phase contrast using a microscope (200x magnification). Viable cells (i.e. those not stained blue
due to their capability to exclude trypan blue) were counted in 1 square containing 16 smaller
squares. This was repeated in different squares (each containing 16 smaller squares) to obtain 4
counts, a mean of which was calculated and multiplied by 1 x 10⁴
and sample dilution factor
(when diluted) to give a concentration in cells/ml. Counts were repeated using a fresh 95 µl
aliquot of cells on the very rare occasions when the number of dead cells (stained blue) was
greater than 5%.
Page 71
Page 71 of 286
2.4 Measurement of TNF , IL-6, IL-8, IL-2 and IFNγ by Enzyme Linked
Immunosorbent Assay (ELISA)
Antibodies for the detection of TNF , IL-6 and IL-8 were generated within NIBSC
except for clone 16 anti-human IL-6 mAb which was a generous gift from Dr. L. Aarden,
Sanquin Research, The Netherlands. Monoclonal anti-human IL-2 capture antibody (MAB602)
and biotinylated polyclonal anti-human IL-2 detection antibody (BAF202) were from R & D
Systems. Monoclonal anti-human IFNγ capture antibody (551221) and biotinylated anti-human
IFNγ detection antibody (554550) were from BD Biosciences. Capture antibodies (clone 16
anti-human IL-6 mAb, clone 101-4 anti-human TNF mAb, anti-human IL-8 polyclonal
antibody S333, clone 5355 anti-human IL-2 mAb and clone NIB42 anti-human IFNγ mAb)
were coated in either Coating Buffer A (IL-6 capture mAb) or Coating Buffer B (all other
capture antibodies), onto walls of wells of 96-well microtitre plates (Immuno MaxiSorp,
NUNC) at 2.5 µg/ml (200 μl/well) for anti-IL-6, 2 µg/ml (100 µl/well) for anti-TNF and 0.5 -
1 µg/ml (100 µl/well) for anti-IL-8, 1 µg/ml (100 µl/well) for anti-IL-2 and 2 µg/ml (100
µl/well) for anti-IFNγ. The anti-IL-6 coated plates were covered and left for 16 – 24 h at room
temperature. The anti-TNF , anti-IL-8, anti-IL-2 and anti-IFNγ coated plates were covered and
left for 16 – 24 h at 4°C. Anti-IL-6 antibody coated plates were washed 3 times in demineralised
water. Anti-TNF , anti-IL-8, anti-IL-2 and anti-IFNγ coated plates were washed 3 times with
Wash Dilution Buffer. Plates coated with IL-6 capture mAb were blocked with 200 µl of
Blocking Buffer A. All other capture antibody-coated plates were blocked with Coating Buffer
B containing 0.5 – 1% ovalbumin or BSA. All plates were washed 3 times with Wash Dilution
Buffer and once with demineralised water prior to the addition of samples.
The following World Health Organisation (WHO) international standards (IS) were used
as calibrants for the cytokine ELISAs: WHO IS 89/548 for IL-6, WHO IS 89/520 for IL-8,
WHO IS 88/786 for TNFα, WHO IS 88/606 for IFNγ and preparation 86/564 for IL-2, all from
NIBSC. The standards were prepared in cell culture medium (specific for the experiment)
supplemented with plasma or serum as specified in the individual Methods section for each
Page 72
Page 72 of 286
chapter. For all ELISAs, 50 µl cell-conditioned medium or each concentration of cytokine
standard was assayed in wells coated with the capture antibodies. Culture medium alone
(specific for the assay) was used to give a reading for 0 pg/ml cytokine. Concentrations of
standard and culture medium alone were added to every ELISA plate in duplicate wells. For the
IL-6 ELISA, 200 µl sheep anti-human IL-6 polyclonal antibody S2446 conjugated to
horseradish peroxidise (HRP) diluted 1 in 800 with Detecting Antibody Dilution Buffer was
added to each well and plates were incubated for 2 – 3 h at room temperature. Plates were
washed 3 times with Wash Dilution Buffer and once with demineralised water, prior to the
addition of 200 µl substrate solution (0.5 ml TMB Substrate Solution in 10 ml Substrate Buffer
A) and, 5 – 10 min later; 50 µl Stop Solution. The absorbance values were calculated by
subtracting the OD (optical density) values measured using a corrective filter (540nm) from the
OD values measured using a 450nm filter, using a spectrophotometer (Molecular Devices) and
SoftmaxPro software. For the TNF , IL-8 IL-2 and IFNγ ELISAs, after the addition of the cell-
conditioned medium/cytokine standards, 50 µl sheep anti-human TNF polyclonal (H91)
biotinylated antibody (diluted 1 in 4000) or sheep anti-human IL-8 polyclonal (S333)
biotinylated antibody (diluted 1 in 2000) in Wash Dilution Buffer containing 1% normal sheep
serum (NIBSC) or 50 µl goat anti-human IL-2 polyclonal biotinylated antibody (diluted 1 in
1000) in PBS A containing 1% BSA or 50 µl clone 4S.B3 biotinylated anti-human IFNγ mAb
(diluted 1 in 250) in PBS A containing 0.5% BSA was added and the covered plates incubated
overnight at 4°C. Plates were washed 3 times in Wash Dilution Buffer prior to the addition of
100 µl avidin-HRP (Dako P347) or streptavidin-HRP (Jackson ImmunoResearch S7973-97A) in
Wash Dilution Buffer; plates were incubated for 15 min at room temperature and then washed 3
times in Wash Dilution Buffer and once in demineralised water. For the TNF and IL-8
ELISAs, the addition of 100 µl substrate solution (o-phenylenediamine dihydrochloride, OPD
[Sigma P-7288], dissolved in Substrate Buffer B containing 30% hydrogen peroxide [Sigma H-
1009]) was followed by the addition of 50 µl Stop Solution after a 5 – 15 min incubation.
Absorbance was measured at 490nm using a spectrophotometer (Molecular Devices) and
SoftmaxPro software. For the IL-2 and IFNγ ELISA, 100 µl substrate solution (as for the IL-6
ELISA) was added and, 5 – 10 min later; 50 µl Stop Solution. The absorbance values were
Page 73
Page 73 of 286
calculated as described for IL-6. For all ELISAs, a 4-parameter fit was assigned to the cytokine
standard curve given by each ELISA plate and cytokine concentrations in the cell-conditioned
media were calculated from this curve.
2.5 Measurement of cell proliferation by 3H-thymidine incorporation
Cell proliferative responses were quantified by measuring the amount of radioactively-
labelled thymidine incorporated into “new” strands of DNA in proliferating cells. After removal
of the majority of the cell-conditioned medium, cells remained in 50 µl of cell-conditioned
medium in the wells of the microtitre plates. 3H-thymidine (Amersham Bioscience TRK300)
was added to each well (0.5 µCi/well in 50 µl fresh culture medium supplemented with plasma
or serum as specified in the Methods section of each individual chapter) to give a final
concentration of 5 µCi/ml. Cells were incubated with 3H-thymidine for 18-19 h in a humidified
incubator at 37 °C, 5% CO2. Using a Micro 96 harvester (Molecular Devices), cells were
harvested onto filtermats (Perkin Elmer 1405-421) which were dried and sealed in clear plastic
bags with scintillant (Perkin Elmer 1205-440). The amount of 3H-thymidine incorporated into
DNA was quantified (in counts per minute, cpm) using a 1450 Microbeta Trilux (Perkin Elmer)
radioactivity counter. Counts per minute are directly proportional to the amount of cell
proliferation.
2.6 Monoclonal antibodies
The mAbs used in this study were all of clinical grade. TGN1412 was originally from
TeGenero AG, Würzburg, Germany. Avastin (Bevacizumab, Roche) is a humanized IgG1 anti-
VEGF for the treatment of cancer; Herceptin (Trastuzumab, Roche) is a humanized IgG1 anti-
Her2, used for the treatment of breast cancer and Campath-1H (Alemtuzumab, Genzyme), is a
humanized IgG1 anti-CD52 for the treatment of lymphocyte neoplasms, transplant rejection and
autoimmune diseases. The isotype-matched (to TGN1412) negative control antibody used in
experiments was either Tysabri (Natalizumab, Biogen IDEC), a humanized IgG4κ anti- 4
Page 74
Page 74 of 286
integrin used for the treatment of multiple sclerosis or a humanised IgG4κ antibody of clinical
grade with an irrelevant (to this study) specificity. This antibody had failed its phase III clinical
trial on grounds relating to its efficacy and was provided as a gift for use as a control provided
that details regarding its manufacturer and specificity are not disclosed. (For those wishing to
repeat any of the work carried out as part of this study Tysabri was shown to be an adequate
negative control as can be seen from the data presented below.)
An unavoidable consequence of incubating therapeutic mAbs in aqueous phase with
human cells (as is the case for some of the methods investigated in this thesis) is that the mAbs
are transferred in the cell-conditioned medium to the cytokine specific antibody-coated ELISA
plates. Therefore, all of the therapeutic mAbs used in this study were evaluated for their
capability to interfere with the detection of cytokine in each of the cytokine-specific ELISAs
described above. A dilution series (3 concentrations minimum) of each cytokine standard was
assayed in the absence and presence of each of the therapeutic mAbs, by ELISA. Each cytokine
standard was diluted in supplemented culture medium typically used for cell-based assays
(RPMI 1640 [Sigma R0883] supplemented with 2 mM L-glutamine [Sigma G7513], 100
units/ml penicillin, 0.1 mg/ml streptomycin [Sigma P0781] and non-essential amino acids
[Gibco 11140]) containing 2% donor plasma. The final concentration of mAb added to each
concentration of cytokine standard tested was 1000 µg/ml for TGN1412, 40 µg/ml for the
isotype-matched (to TGN1412) control and 400 – 500 µg/ml for Tysabri, Avastin, Herceptin
and Campath-1H for cytokines TNFα, IL-6, IL-8, IL-2 and IFNγ. These concentrations reflect
the highest doses incubated with cells in the methods investigated in this study, i.e. the
maximum doses transferred to ELISA plates. Concentrations of cytokine standard tested in the
presence and absence of mAbs spanned the range of the concentrations used for ELISA standard
curves in assays to quantify the amount of cytokine in cell-conditioned medium (typically 31.25
pg/ml – 4000 pg/ml). The cytokine standard curves were tested in ELISAs as described in
section 2.4 above. A comparison of the optical density values given for each cytokine standard
curve tested in the absence and presence of each therapeutic mAb was made. The results of
these comparisons are shown in Appendix II and in Figure 12. It was concluded that none of the
therapeutic mAbs interfered with the detection of any of the cytokines by ELISA.
Page 75
Page 75 of 286
Chapter 3:
Conventional in vitro
procedures are not
predictive of the clinical
effects of TGN1412
Page 76
Page 76 of 286
CHAPTER 3: Conventional in vitro procedures are not predictive of the clinical effects of
TGN1412
3.1 Introduction
The rapid increase in pro-inflammatory cytokines (TNFα, IL-6, IL-8 and IL-1β) in the
blood of the TGN1412 trial volunteers following infusion of this mAb is characteristic of the
response induced by pyrogenic contaminants of medicines (Poole et al., 1988; Nakagawa et al.,
2002). It was conceivable that the cytokine storm suffered by the volunteers was caused by a
non-endotoxin pyrogen or contaminant that was not detected in either the bacterial endotoxins
test or in the rabbit pyrogen test but which was very potent in man. Over a number of years,
NIBSC, Novartis and Baxter Healthcare have developed a cell-based in vitro test system
(Taktak et al., 1991; Gaines Das et al., 2004) that is better able to detect non-endotoxin
pyrogenic contaminants of medicines as described in US patent 7736863B2. The test system has
been termed a ‘monocyte activation test’ (MAT) and is compliant with the method described in
the European Pharmacopoeia (published April 2010). It is more accurately described as a
‘cytokine release test’ since cells other than monocytes can play a part in responses to
contaminants. The test involves the culture of the medicine (in aqueous phase) with either
human PBMC or cells of a monocytic cell line (e.g. Monomac 6 or THP-1) or with human
whole human blood. Usually after 16–24 h of cell culture, pro-inflammatory cytokines in the
cell-conditioned medium are quantified by cytokine specific enzyme-linked immunosorbent
assays (ELISAs). Although cell-based tests completed by TeGenero during the pre-clinical
evaluation of TGN1412 provided no evidence that the antibody might be capable of evoking a
cytokine storm, the test systems applied were not optimised for detecting pyrogenic
contamination. It was therefore a suitable starting point to use the cytokine release test for
contaminants developed at NIBSC to investigate whether or not the cytokine storm was caused
by a pyrogenic contaminant of TGN1412 that was undetected in the bacterial endotoxins test
and in the rabbit pyrogen test. Failure of TGN1412 to stimulate cytokine release in this assay
would suggest an absence of pyrogenic contamination of this mAb and would suggest that it
Page 77
Page 77 of 286
was TGN1412 itself which was responsible for the cytokine storm in the trial volunteers. The
cytokine readouts chosen were TNFα, IL-6 and IL-8 because elevated concentrations of these
pro-inflammatory cytokines were measured in the blood of the trial volunteers’ post-infusion of
TGN1412. IL-1β is also a pro-inflammatory cytokine that is produced in response to pyrogens
and was elevated in the blood of the trial volunteers. Its biological functions are similar to those
of TNFα and together these cytokines can have synergistic effects. However, it is produced in
relatively small amounts by PBMC compared with TNFα, IL-6 and IL-8 making it a poor
marker for measuring the pro-inflammatory effects of medicines in vitro. It is for these reasons
that IL-1β was excluded as a readout in this study.
3.2 Methods
3.2.1 Rationale for TGN1412 Doses Tested
At its clinical trial, TGN1412 was injected into volunteers at 0.1 mg/kg (Suntharalingam
et al., 2006). An average human male weighs 70 kg, and has approximately 5 litres of blood.
TGN1412 dissolves in the plasma which is approximately 60% of the total blood volume and so
the effective dilution volume is 3 litres. Therefore, 0.1 mg/kg (human dose) x 70 kg = 7 mg
TGN1412 per 3 litres plasma, which is approximately 2 µg TGN1412/ml plasma. It should be
noted that 2 µg/ml is the maximum in vitro concentration equivalent to 0.1 mg/kg and does not
take into account antibody half-life and preferential distribution in one body compartment rather
than another (Stebbings et al., 2007). The maximum dose given to macaques was 50 mg/kg, i.e.
500x more than that given in man (Expert Group on Phase One Clinical Trials, 2006). This
larger dose is approximately equivalent to 1000 µg/ml in an in vitro test system. So, in the
experiments described in this chapter, aqueous phase TGN1412 was tested in vitro at
concentrations between 2 and 1000 μg/ml. TGN1412 formulation buffer (alone) was tested at 4
dilutions that corresponded to the volumes of buffer contained in the 4 largest concentrations of
TGN1412 tested.
Page 78
Page 78 of 286
3.2.2 Cytokine release assay using PBMC
PBMC were isolated from fresh blood as described in section 2.2. Media used with
PBMC was RPMI 1640 (Sigma R0883) supplemented with 2 mM L-glutamine (Gibco 25030),
100 U/ml penicillin and 0.1 mg/ml streptomycin (Gibco 15140) and non-essential amino acids
(Gibco 11140-035) and is termed culture medium in this chapter. Aqueous phase TGN1412, at a
range of concentrations, endotoxin IS (94/580, NIBSC) as a positive control, TGN1412
formulation buffer and culture medium alone (as a negative control), were incubated with
50,000 – 200,000 PBMC/well in 250 µl culture medium and the donor’s own plasma (2%), in
wells of 96-well, round-bottom, polypropylene plates (Corning 3790). Cultures were incubated
for 16 – 18 h in a humidified incubator at 37°C, 5% CO2. Cell-conditioned medium was
withdrawn from the PBMC cultures and concentrations of TNF , IL-6 and IL-8 were measured
by ELISA as described in section 2.4. Cytokine standards for ELISAs were diluted in culture
medium containing 2% pooled donors’ plasma (i.e. plasma from the donors of PBMC used in
the assay). Cell-conditioned medium was diluted accordingly with culture medium containing
2% donor’s own plasma.
3.2.3 Cytokine release assay using whole blood
The cytokine responses of whole blood to TGN1412, its formulation buffer and endotoxin
were measured as for PBMC described in section 3.2.2, except that 20% (v/v) blood (diluted
with sterile, pyrogen-free saline from Fresenius-Kabi 31-58-736) was substituted for PBMC.
Samples were diluted with saline and cytokine standards used for ELISAs were diluted in saline
containing 1% BSA.
3.3 Results
Figure 11 shows that TGN1412 (2.0–1000 μg/ml) and its formulation buffer alone
(diluted 1 in 10, 1 in 20, 1 in 40 and 1 in 80), added as an aqueous solution and cultured for 16 –
Page 79
Page 79 of 286
18 h with human PBMC (50,000–200,000 PBMC/well) or human whole blood (20% v/v final
concentration), stimulated the release of TNF , IL-6 and IL-8 to concentrations barely above
basal values. In contrast, endotoxin positive control stimulated the dose-dependent release of all
cytokines measured. The endotoxin limit concentration (ELC) for TGN1412, i.e. the permitted
maximum concentration of endotoxin in order for this product to comply with its specification,
was 0.5 IU (= EU [endotoxin units])/ml for 10 mg/ml TGN1412. For a 1000 µg/ml solution of
TGN1412, the ELC would be 0.05 IU (5 pg)/ml. All responses to 1000 µg/ml TGN1412 and its
formulation buffer diluted 1 in 10 were below the cytokine concentrations released in response
to endotoxin at 0.05 IU (5 pg)/ml. This shows that TGN1412 and its formulation buffer did not
contain concentrations of pyrogenic contaminants that could have given rise to the profound
pro-inflammatory responses that occurred in the volunteers in the clinical trial.
When TGN1412 (1000 µg/ml) was “spiked” with 0.075 IU (7.5 pg)/ml endotoxin, IL-6
responses of PBMC were similar to those stimulated by 0.075 IU (7.5 pg)/ml endotoxin in the
absence of TGN412. IL-6 values were 12,730 ± 2667 pg/ml for TGN1412 spiked with
endotoxin and 10,953 ± 2115 pg/ml for endotoxin alone (values are means ± S.E.M [standard
error of the mean] of 4 donors of PBMC). This shows that TGN1412 did not inhibit the
detection of endotoxin in the assay. In a separate experiment, TNF , IL-6 and IL-8 ELISAs
were carried out on serial dilutions of recombinant cytokine standard in the presence and
absence of 1000 µg/ml TGN1412. There was no detectable difference between the absorbance
values for the dilution series with and without TGN1412 for TNF and IL-6, indicating that the
presence of TGN1412 in these ELISAs did not interfere with the detection of these cytokines.
TGN1412, at the largest dose tested perhaps enhanced the detection of IL-8 since absorbance
values were higher for the dilution series prepared in the presence of TGN1412. This result is
shown in Figure 12. Therefore, the absence of cytokine responses to TGN1412 shown in Figure
11 could not have been the result of inhibition by TGN1412 of the cytokine detection methods.
Page 80
Page 80 of 286
Figure 11. Cytokine responses (pg/ml) of PBMC and whole blood (20% v/v) from human donors to
aqueous TGN1412. PBMC (left) or whole blood (right) were incubated with TGN1412 at the doses
shown for 16 - 18 h and with endotoxin (positive control) at doses ranging 0.025 IU (2.5 pg)/ml to 0.15
IU (150 pg)/ml for PBMC and 0.05 IU (5 pg)/ml to 0.8 IU (80 pg)/ml for whole blood and TGN1412
formulation buffer. Values for TNF , IL-6 and IL-8 are means ± S.E.M of 4 donors.
Page 81
Page 81 of 286
Figure 12. Effect of TGN1412 in the detection of cytokines by cytokine-specific ELISAs. Dilution series
of TNF (left), IL-6 (middle) or IL-8 (right) recombinant cytokine standard were prepared in the presence
and absence of 1000 µg/ml TGN1412. Cytokine specific ELISAs were carried out in each of the dilution
series prepared. Values are means ± S.E.M of 4 replicates for each concentration of cytokine tested with
or without TGN1412, in one assay.
3.4 Discussion
The pro-inflammatory cytokines TNF , IL-6 and IL-8 were elevated in the serum of all
six volunteers in the TGN1412 clinical trial within 4 h of infusion of a clinical grade batch of
the drug (Suntharalingam et al., 2006). As noted above, it was conceivable that the “cytokine
storm” suffered by the volunteers was caused by a non-endotoxin pyrogen (not detected in the
bacterial endotoxins test) to which rabbits were insensitive at the dose that caused such
profound effects in man. However, the absence of TNF , IL-6 and IL-8 cytokine responses of
human PBMC to aqueous phase TGN1412 after a 16 – 18 h culture (in a test system optimised
for the detection of pyrogens), suggests that this was not the case. The absence of cytokine
responses of whole blood to aqueous TGN1412 confirms that the absence of cytokine responses
to PBMC was not due to the removal of essential blood components such as neutrophils,
eosinophils and basophils, excluded during the PBMC isolation process. It was therefore
concluded that the pro-inflammatory effects of the mAb were likely to be due to the intrinsic
activity of the molecule itself. Only negligible amounts of TNF , IL-6 and IL-8 were released
in vitro in response to 2 µg/ml TGN1412 (i.e. a dose approximately equivalent to the serum
Page 82
Page 82 of 286
concentration of TGN1412 in the volunteers) and to concentrations up to 500x this dose, i.e.
1000 µg/ml. These negligible amounts in no way mimic the magnitude of TNF , IL-6 and IL-8
responses to TGN1412 in the trial volunteers (Suntharalingam et al., 2006). Therefore, these
conventional cell-based assays using PBMC or whole blood, in which the product is incubated
as an aqueous solution, despite being suitable for the detection of pyrogenic contamination,
were unable to predict the intrinsic activity of TGN1412. This was surprising, especially as
TGN1412 was administered to the trial volunteers in aqueous phase and because CD28 is
expressed by T cells, which are present in PBMC.
Following the clinical trial of TGN1412, the Secretary of State for Health set up an
Expert Scientific Group which was chaired by Professor Gordon Duff (now Professor Sir
Gordon Duff). The Group’s aim was to identify what could be learned from the TGN1412 trial
and to make recommendations to improve the safety of future clinical trials in man. The data in
Figure 11 above showing that TGN1412 incubated with PBMC/whole blood did not stimulate
cytokine responses was reported in the Expert Scientific Group Final Report otherwise known
as the Duff Report (Expert Group on Phase One Clinical Trials, 2006). It was difficult to
compare this data with that generated in pre-clinical tests using PBMC since such data was not
reported in the TGN1412 Investigational Medicinal Product Dossier (TeGenero AG, 2005a) or
in the Investigators Brochure (TeGenero AG, 2005b). In fact, during the investigation of the
clinical trial, TeGenero were criticised for not reporting the results of these assays in the
Investigator’s Brochure (Kenter and Cohen, 2006). It was confirmed in a report (Hanke, 2006)
written by the Chief Scientific Officer of TeGenero that such assays had been conducted and the
results were in accordance with those reported by the Expert Scientific Group (Expert Group on
Phase One Clinical Trials, 2006), i.e. the data presented here.
It was conceivable that if the dose-response curve for TGN1412 was bell-shaped, the
dose of TGN1412 given to Cynomolgus macaques during the pre-clinical tests, i.e. at 50x and
500x the dose subsequently given in man, was too large to elicit a cytokine storm, whereas the
dose given in man was closer to the maximum immuno-stimulatory dose. If this were the case,
it could have explained why the human volunteers showed adverse reactions that were absent in
the Cynomolgus macaques and this was why, first of all, a broadly equivalent dose range was
Page 83
Page 83 of 286
tested using aqueous TGN1412 in vitro. However, the inability of TGN1412 to evoke any
responses by PBMC or whole blood meant that this hypothesis could not be tested in this study.
Subsequently it was shown that Cynomolgus macaques infused with a wide range of doses of
TGN1412, including the 0.1 mg/kg dose that proved to be so harmful in man, suffered no
adverse reactions, thus Cynomolgus macaques were, with hindsight, a poor animal model for
predicting the clinical safety of TGN1412 (Stebbings et al., 2007).
The inability of the PBMC or whole blood-based assays to predict the intrinsic activity of
TGN1412 in aqueous phase (but in tests/assays optimised for the detection of pyrogenic
contaminants) was the driver to develop novel in vitro methods that were capable of doing so.
This is addressed in the following chapters.
Page 84
Page 84 of 286
Chapter 4:
Development of antibody
immobilisation techniques to
predict the clinical effects of
TGN1412 and other
monoclonal antibodies
Page 85
Page 85 of 286
CHAPTER 4: Development of antibody immobilisation techniques to predict the clinical
effects of TGN1412 and other therapeutic mAbs
4.1 Introduction
As discussed previously, the failure of animal models and conventional cell-based
methods to predict the pro-inflammatory intrinsic nature of TGN1412 signalled the need for
better predictive assays. Antibody immobilisation (i.e. the binding of antibody to a solid
support) has been reported to be a requirement for full T cell activation using mAbs which
target the TCR-CD3 complex (Luhder et al., 2003). Immobilisation of anti-CD3 mAbs by a
solid support is thought to mimic the binding of these mAbs to Fc receptors expressed by
monocytes (van Lier et al., 1989). The possibility that immobilised TGN1412 could stimulate
cytokine responses from PBMC was first proposed by Dr Richard Stebbings. Indeed this was
found to be the case and is described in Stebbings et al. (2007). Immobilisation of an antibody is
likely to change the manner in which it is presented to cells relative to its addition as an aqueous
solution. This is illustrated in Figure 13 below.
Figure 13. Interaction of immobilised and aqueous phase (soluble) TGN1412 with T cells.
The exact mechanism by which CD28 superagonists interact with their target to stimulate
T cell responses without prior engagement of the TCR is not known although a number of
models are discussed in section 1.6. What is known is that superagonists bind to an epitope on
Page 86
Page 86 of 286
the extracellular domain of CD28 which is proximal to the cell membrane, unlike conventional
agonistic CD28 antibodies which bind to a membrane-distal epitope as shown in Figure 7
above. Antibody immobilisation may present TGN1412 to CD28 in a manner that facilitates
binding of the membrane-proximal epitope and formation of a linear complex as illustrated in
Figure 7 above. This may achieve a level of CD28 cross-linking above a threshold required for
T cell activation. The main objective of the experiments described in this chapter was to further
develop the in vitro antibody immobilisation test proposed by Dr Richard Stebbings.
Other studies have suggested that the type of microtitre plate on which the cells are
incubated can influence cellular responses to certain stimuli (Poole and Patel, 2010). The
surface properties of different microtitre plates (usually polypropylene or polystyrene plates)
may affect the manner in which TGN1412 is immobilised and presented to cells. Several
antibody immobilisation techniques on different types of microtitre plates are evaluated in this
chapter for their value in predicting the clinical effects of TGN1412 and other therapeutic
mAbs. These other mAbs include Herceptin and Campath-1H which are associated with a
significant incidence of pro-inflammatory clinical infusion reactions and Tysabri and Avastin,
which are not associated with a significant incidence of clinical infusion reactions (Dillman,
1999; Chung, 2008; Hellwig et al., 2008; Hansel et al., 2010).
In addition to developing the antibody immobilisation method in this chapter, the reason
why aqueous TGN1412 did not stimulate cytokine responses from PBMC is also investigated.
Furthermore, the kinetics of cytokine responses to immobilised TGN1412 are compared with
the kinetics of TGN1412-stimulated cytokine responses by the trial volunteers. Reverse
transcription (RT)-PCR is used to investigate whether or not TGN1412 could have stimulated
de novo cytokine synthesis in the trial volunteers within one hour post-infusion. This is because
the rapid cytokine responses to TGN1412 by the trial volunteers suggested that the cytokines
may have been pre-formed and released from intracellular stores following TGN1412 infusion
(Suntharalingam et al., 2006). The release of pre-formed intracellular stores of pro-
inflammatory cytokines resulting in a cytokine storm, indeed has been reported elsewhere
(McILwain et al., 2010).
Page 87
Page 87 of 286
4.2 Methods
In the experiments described in this chapter, culture medium was RPMI 1640 (Sigma
R0883) supplemented with 2mM L-glutamine (Sigma G7513), 100 U/ml penicillin, 0.1 mg/ml
streptomycin (Sigma P0781) and non-essential amino acids (Gibco 11140).
4.2.1 Comparison of cytokine responses of PBMC and diluted whole blood to TGN1412
added as an aqueous solution or immobilised by air-drying or wet-coating onto
polypropylene and polystyrene culture plates
TGN1412 and an isotype-matched negative control, with an irrelevant specificity, were
immobilised by coating onto the walls of wells of untreated 96-well, U-bottomed polypropylene
microtitre plates (Corning 3790) and tissue culture treated 96-well, U-bottomed polystyrene
microtitre plates (Falcon 353077) by different methods: air-drying and wet-coating. To coat by
air-drying, 50 µl of the antibody solution, diluted to the relevant concentration in PBS B
(sterile), was added to each well. Plates were left overnight in a class II laminar flow cabinet
with the lids removed to allow the solutions to slowly evaporate. To coat using the wet-coating
method, 50 µl of the diluted antibody solutions was added to each well and plates were then
covered (to prevent evaporation of the solutions) and left overnight in the class II laminar flow
cabinet. Antibody solutions were removed from the wet-coated wells with a multi-channel
pipette and the wells of all coated plates were washed twice with 200 µl PBS B using a multi-
channel pipette to remove the salt crystals (from the air-dried plates) and unbound antibody.
PBMC (125,000 cells/well) were incubated for 16 - 24 h at 37°C, 5% CO2, either in the coated
wells of the polypropylene and polystyrene plates containing 250 µl culture medium and 2%
donor’s own plasma or in wells containing 250 µl aqueous antibody (TGN1412 or the isotype-
matched negative control diluted to the required concentration with culture medium) and 2%
donors own plasma.
Human whole blood was heparinised as described in section 2.2 and was incubated for 16
- 24 h at 37°C, 5% CO2, at a final concentration of 20% v/v (diluted with PBS B), with
Page 88
Page 88 of 286
TGN1412 and the isotype-matched negative control coated at the relevant concentrations by air-
drying onto the walls of wells of either polypropylene or polystyrene plates. Antibodies were
air-dried using the same procedure as described for PBMC.
After incubation, cell-conditioned medium was removed from the PBMC or whole blood
(for both cell sources the cells had settled to the bottom of wells by the end of the incubations)
and assayed in cytokine-specific ELISAs as described in section 2.4. Standard curves for each
cytokine (TNFα, IL-6 and IL-8) were prepared in culture medium containing 2% (final) pooled
donor plasma (i.e. plasma from the four donors of PBMC, used for any one assay) for the
PBMC assays and PBS B containing 1% BSA for whole blood assays.
4.2.2 Comparison of cytokine responses of PBMC to TGN1412 immobilised by air-drying
and warm-air drying
TGN1412 and an isotype-matched negative control were immobilised by coating onto the
walls of wells of polypropylene plates (Corning 3790) by two different methods: air-drying and
warm air-drying. The air-drying method was carried out as described in section 4.2.1. The
method for warm air-drying was similar except that a hair-dryer was used to blow warm air (40
- 50°C) across the wells of the plates inside a laminar flow cabinet, to evaporate the antibody
solutions from the wells (approximately 15 – 20 min/plate). The wells of all coated plates were
washed twice with 200 µl PBS B to remove the salt crystals and unbound antibody. PBMC
(125,000 cells/well) were incubated for 16 - 24 h at 37°C, 5% CO2, in the coated wells of the
plates containing 250 µl culture medium and 2% donor’s own plasma. After incubation, cell-
conditioned medium was removed and assayed for cytokines by ELISA as described in section
4.2.1.
Page 89
Page 89 of 286
4.2.3 Effect of different coating methods on the total amount of TGN1412 immobilised
onto plates
TGN1412 or an isotype-matched negative control and the blank (PBS B) were coated by
either air-drying, warm air-drying or wet-coating onto polypropylene (Corning 3790) or
polystyrene (Falcon 353077) plates as described in sections 4.2.1 and 4.2.2. The solutions were
removed from the wet-coated plates and all coated plates were washed twice with 200 µl PBS
B, using a multi-channel pipette. (The same PBS was used here as for the experiments where
cell responses were measured.) The wells of all plates were incubated with 50 µl PBS B
containing 1% ovalbumin for 1 h at 37°C to diminish non-specific binding of the detecting
antibodies. The wells of all plates were washed three times with PBS B as before. The wells of
all plates were incubated with 50 µl rabbit anti-human IgG (gamma chain specific) antibody
conjugated to horseradish peroxidase (Dako P0214) diluted 1 in 3000 with PBS B containing
0.5% BSA, for 2.5 h at room temperature. The wells of all plates were washed four times with
PBS B as before. The wells of all plates were incubated with 50 µl substrate solution (OPD
tablets, Biotstat 5204530, dissolved in water containing hydrogen peroxide, as described in the
manufacturer’s instructions). The colour was left to develop for 5 – 10 min at room temperature
and the reaction was stopped with 50 µl Stop Solution. After mixing with a multi-channel
pipette, the solutions in each of the wells from all plates were transferred to flat bottomed,
polystyrene, 96-well plates (Falcon 3530720) and the absorbance was read at 490nm. All
absorbance values were baseline corrected by subtracting the mean absorbance for the blank for
the corresponding coating method.
4.2.4 Effect of different coating methods on the quantity of TGN1412 immobilised onto
plates and (correctly) orientated such that it was able to bind a CD28 fusion protein
TGN1412 and an isotype-matched negative control were coated by either air-drying,
warm air-drying or wet-coating onto polypropylene (Corning 3790) or polystyrene (Falcon
353077) plates as described in sections 4.2.1 and 4.2.2. The solutions were removed from the
Page 90
Page 90 of 286
wet-coated plates and all coated plates were washed twice with 200 µl PBS B using a multi-
channel pipette. The walls of wells of all plates were incubated with 50 µl PBS B containing 1%
ovalbumin for 1 h at 37°C to diminish non-specific binding of the detecting antibodies. The
wells of all plates were washed three times with PBS B as before prior to incubation with 50 µl
of CD28 fusion protein from R and D Systems, 342-CD (human recombinant CD28 conjugated
to human IgG1 Fc to form a homodimeric molecule) diluted to 1 µg/ml with PBS B containing
0.1% BSA, for 90 min at room temperature. The wells were washed three times with PBS B as
before prior to incubation with 50 µl biotinylated mouse anti-human IgG1 Fc antibody (Stratech
Scientific Ltd, 6069B) diluted 1 in 2000 with PBS B containing 1% BSA for 2 h at room
temperature. The wells were washed four times with tris-buffered saline (TBS) as before prior
to incubation with 50 µl extravidin-alkaline phosphatase (Sigma E2636) diluted 1 in 2000 with
TBS containing 1% BSA for 30 min at room temperature. Wells were washed four times with
TBS as before. The wells of all plates were incubated with 50 µl substrate solution (p-
nitrophenyl phosphate tablets, Sigma N2770, dissolved in water as described in the
manufacturer’s instructions). The colour was left to develop for 5 – 10 min at room temperature
and the reaction was stopped with 50 µl 3M sodium hydroxide. After mixing with a multi-
channel pipette, the solution in each of the wells from all plates was transferred to flat-
bottomed, polystyrene, 96-well plates (Falcon 3530720) and the absorbance was read at 405nm.
The wells for the blanks in this method contained all reagents as for the experimental wells
(including coated TGN1412 or the isotype-matched negative control) but the CD28 fusion
protein was omitted. All values for absorbance from the experimental wells were baseline
corrected by subtracting the mean absorbance for the blank for the corresponding TGN1412 or
isotype-matched negative control concentration for the corresponding coating method.
4.2.5 Interference by aqueous TGN1412 of cytokine responses of PBMC to immobilised
TGN1412
TGN1412 (50 µl/well) was immobilised by air-drying onto polypropylene plates
(Corning 3790) using the method described in section 4.2.1. PBMC (125,000 cells/well) were
Page 91
Page 91 of 286
incubated with immobilised TGN1412 in the absence and presence of either aqueous TGN1412
at a range of concentrations or the isotype-matched negative control at a range of
concentrations. PBMC were incubated in 250 µl culture medium and 2% final donor’s own
plasma, for 16 - 24 h at 37°C, 5% CO2. After incubation, cell-conditioned medium was removed
and assayed for cytokines as described in section 4.2.1.
4.2.6 Detection of early cytokine responses to immobilised TGN1412 using quantitative
reverse-transcription polymerase chain reaction (RT-PCR) and by ELISA
Cytokine gene expression in PBMC stimulated with immobilised TGN1412 (for 30, 60
and 90 min) was measured using quantitative RT-PCR analysis. Cytokine release by TGN1412-
stimulated cells (for 30, 60 and 90 min) was also measured by ELISA.
4.2.6.1 Stimulation of cells with air-dried TGN1412
TGN1412 (50 µl/well) and an isotype-matched negative control were immobilised by air-
drying onto wells of polypropylene plates (Corning 3790) using the method described in section
4.2.1. After the washing step, 125 µl culture medium was added to wells. PBMC (125,000
cells/well) were incubated with immobilised antibody in a final volume of 250 µl culture
medium containing 2% donor’s own plasma, with 125 µl cells added to wells at different time
points using a multichannel pipette. For example, for 90 minute incubations with antibody,
PBMC were added to the relevant wells of the first plate at T (time) = 0 min, after which the
timer was started. At T = 30 min, PBMC were added to the relevant wells of a second plate (for
60 min incubation with antibody). At T = 60 min, PBMC were added to the relevant wells of a
third plate (for 30 min incubation with antibody). At T = 90 min, all plates were centrifuged at
340 x g for 10 min at room temperature. Cell conditioned medium was aspirated from the cell
pellets and stored in 96-well plates at -20°C.
Page 92
Page 92 of 286
4.2.6.2 Measurement of early cytokine responses by ELISA
Cell conditioned medium aspirated from TGN1412-stimulated cells was thawed at room
temperature prior to assay of TNFα, IL-6 and IL-8 in cytokine-specific ELISAs as described in
section 4.2.1.
4.2.6.3 Measurement of early gene expression by quantitative RT-PCR.
Activation of gene transcription leads to the production of mRNA which is subsequently
translated into protein. Therefore, gene expression can be measured using methods that quantify
the amount of mRNA produced by cells. The method described here was as described
previously (Burns et al., 2008). In the first instance, total RNA is extracted from cells using an
RNeasy spin column and stable cDNA is produced from single-stranded mRNA. The cDNA is
then used as a template in quantitative RT-PCR involving SYBR Green I dye to quantify the
amount of mRNA produced by transcription of the gene of interest by TGN1412-stimulated
cells.
4.2.6.3.1 RNA extraction
In order to extract total RNA from stimulated cells, 200 µl PBS B was added to 2 of the 4
replicate wells for each sample (i.e. TGN1412 or isotype control), cells were resuspended and
duplicates pooled into Eppendorf tubes prior to microfuging at 4000 x g. Supernatants were
removed and from this point forward, total RNA was extracted from cells using the RNeasy Kit
(Qiagen 74106) following the manufacturer’s instructions. Briefly, 350 µl of a denaturing lysis
buffer was added to lyse the cells and denature RNases such that stable intact RNA was
isolated. An equal volume of 70% ethanol was added to optimise binding of RNA to the silica-
gel membrane in the spin columns. Lysates were loaded into spin columns placed in collection
tubes prior to centrifugation of the spin columns at 8000 x g for 1 min at room temperature.
Flow-through in the collection tubes was discarded and 350 μl Buffer RW1 was added to each
Page 93
Page 93 of 286
column prior to centrifuging at 8000 x g for 1 min. Flow-through was discarded. In order to
digest any contaminating genomic DNA in the samples, DNase digestion was performed using
the RNase-free DNase Set (Qiagen 79254). A working solution of DNase I was prepared as
described in the kit instructions and 80 μl was added directly to each spin column membrane
prior to 15 min incubation at room temperature. Buffer RW1 (350 µl) was added to each column
prior to centrifuging at 8000 x g for 1 min and discarding the flow-through. The bound RNA
was further washed to remove contaminants to allow elution of pure RNA. Columns were
transferred to new collection tubes and 500 µl Buffer RPE was added to each column prior to
centrifuging at 8000 x g for 1 min and discarding the flow-through. A further 500 μl Buffer RPE
was added to the columns, prior to centrifuging again at 8000 x g for 2 min and discarding the
flow-through. The columns were centrifuged dry at 8000 x g for 1 min and then placed in an
RNase- and DNase-free 1.5 ml tube. RNA was eluted from the membranes using a low salt
concentration, i.e. RNase- and DNase-free water (30 µl), which was added directly to each
membrane. Columns were incubated for 1 min at room temperature prior to centrifuging at 8000
x g for 1 min to elute the RNA. The eluate was re-applied to the column membrane prior to
centrifuging again at 8000 x g for 1 min to maximise RNA concentration. Isolated RNA was
stored at -80 C.
4.2.6.3.2 Production of cDNA
To carry out quantitative RT-PCR, isolated RNA from PBMC must be reverse transcribed
into stable cDNA as the enzyme used in quantitative RT-PCR is a DNA polymerase. cDNA
synthesis is carried out using the enzyme Moloney Murine Leukemia Virus-Reverse
Transcriptase (MMLV-RT).
Following elution from the spin column, 9.5 μl isolated total RNA was incubated with 1
μl Oligo (dT)18 primers (Promega C1101) and 1 μl random primers (Promega C1181) at 70ºC in
0.5 ml PCR tubes for 5 min to melt secondary structure creating a linear RNA template. The
tube was immediately cooled on ice for 5 min to avoid denaturing the MMLV-RT added at the
next step. Random primers bind to random sequences in the RNA and also help prevent
Page 94
Page 94 of 286
secondary structure formation, while oligonucleotide (dT)15 primers bind to the polyA tail of the
mRNA within the total RNA. A master mix was prepared as described in Table 1 and 8.5 µl was
added to the PCR tube prior to incubation in a PCR machine (Eppendorf Mastercycler) for 50
min at 42°C followed by 15 min at 70°C. The former was to activate the MMLV-RT enzyme
and allow the synthesis of cDNA and the latter to subsequently inactivate the enzyme. The 20 µl
cDNA samples were stored at -20°C.
Table 1. Reverse transcription master mix
Reagent Reaction volume (1x) Supplier
5x Reaction buffer 4 μl Promega M170B
10 mM dNTPs 1 μl Promega U151B
40 U/μl RNAsin 2 μl Promega N2511
400 mM DTT 0.5 μl Promega V3151
MMLV-RT 1 μl Promega M170B
dNTPs; deoxyribonucleotidetriphosphates, RNAsin; RNase inhibitor, DTT; dithiothreitol, MMLV-RT;
Moloney Murine Leukemia Virus Reverse Transcriptase.
4.2.6.3.3 Quantitative RT-PCR – method overview
PCR amplifies DNA sequences and permits the detection of sequences when present in
low amounts. cDNA samples used as templates for PCR were generated from mRNAs
expressed by the TGN1412- or control-stimulated cells. Primers (oligonucleotides)
complementary to the nucleic acid sequences of the cytokine of interest were used in PCR
reactions to provide specificity to the response measured. PCR was initiated by a heating step to
activate the DNA polymerase, prior to cooling to a temperature to allow specific primers to
anneal to their complementary DNA sequences. Primer extension by DNA Polymerase was
carried out using cDNA as a template. Repeated cycles of DNA denaturation, primer annealing
and primer extension led to amplification of specific nucleic acid sequences.
The use of a fluorescent dye during the amplification process allows quantification of the
amount of cytokine cDNA present in a sample. SYBR (Synergy Brands) Green I is a dye that
Page 95
Page 95 of 286
only fluoresces when intercalated within the minor groove of double-stranded DNA. Unbound
dye exhibits very little fluorescence. During PCR, DNA is single-stranded after the initial
denaturing step, and so SYBR Green I does not bind and low levels of fluorescence are
detected. During the elongation step, new double-stranded DNA is synthesised leading to an
increase in the amount of fluorescent dye that is bound. To monitor the increasing amount of
amplified DNA, fluorescence was measured at the end of each elongation step in every PCR
cycle.
Samples containing more cDNA for the cytokine of interest require fewer PCR cycles to
reach an assigned threshold amount of fluorescence, compared with samples containing less
cDNA. A dilution series of a purified PCR product, amplified by PCR specific for the target
cytokine, is subject to quantitative PCR simultaneously with unknown cDNA samples. The
amplification of these “standards” allows the generation of a standard curve showing the
relationship between the assigned (arbitrary) value of the standards and the number of cycles to
reach threshold fluorescence. Using the number of PCR cycles to reach threshold fluorescence
(Ct) for each unknown sample, a value can be assigned to these unknown samples using the
standard curve. The relative expression of mRNA for the cytokine of interest in unknown
samples is normalised by dividing by the value for mRNA for a “house-keeping” gene, i.e. a
gene constitutively and stably expressed at high levels (in most tissues) which can be used as an
endogenous control. The “house-keeping” gene used in this study was glyceraldehyde 3-
phosphate dehydrogenase (GAPDH), an enzyme involved in cell metabolism, more specifically;
glycolysis. GAPDH expression in unknown samples is determined from a GAPDH standard
curve as described above. Data are presented as normalised gene of interest expression for
TGN1412-stimulated cells relative to that of the isotype-matched negative control-stimulated
cells.
Page 96
Page 96 of 286
4.2.6.3.4 Confirmation of PCR specificity using melt curve analysis
SYBR Green I binds to double-stranded DNA non-specifically and so confirmation that
the measured fluorescence is from a PCR product specific for the target cytokine is achieved by
DNA melting curve analysis. PCR products are slowly heated above the elongation temperature
(typically 72°C) to 95°C after the final cycle of PCR and fluorescence is measured at 1°C
increments. The fluorescence of SYBR Green I dye suddenly plummets as PCR product is
denatured or “melted” by the increased temperature. When the rate of change of fluorescence is
plotted against temperature (x-axis), the observed “melting peak” allows confirmation that a
single specific nucleic acid sequence has been amplified. The melting temperature (Tm) of the
amplified product is the temperature at which 50% of the DNA becomes single-stranded.
4.2.6.3.5 Quantitative RT-PCR – procedure
Primers specific for each gene of interest were available “in house”. The sequence and
annealing temperature for each primer used and the size of the target cytokine PCR product are
described in Table 2. Lyophilised primers were reconstituted to a 100 μM stock concentration
and were subsequently diluted to a 10 μM working concentration in PCR grade water (Sigma
W4502).
Table 2. RT-PCR primer sequences, product sizes and annealing temperatures
Gene Forward primer
(5’ to 3’)
Reverse primer
(5’ to 3’)
Product
size (bp)
Annealing
temp. (°C)
TNF CAGCCTCTTCTCCTTCCTGAT GCCAGAGGGCTGATTAGAGA 123 56
IL-6 AGGAGACTTGCCTGGTGAAA CAGGGGTGGTTATTGCATCT 196 55
IL-8 GTGCAGTTTTGCCAAGGAGT CTCTGCACCCAGTTTTCCTT 180 55
GAPDH GTCAGTGGTGGACCTGACCT CCCTGTTGCTGTAGCCAAAT 251 55 - 56
Page 97
Page 97 of 286
Standards for each gene of interest (TNFα, IL-6 and IL-8) and GAPDH were available
“in house”, produced as previously described (Burns et al., 2008). A working solution of each
standard was prepared in PCR grade water. Dilutions were 1/10 for TNFα, IL-6 and GAPDH
and 1/20 for IL-8. These working solutions were used as the largest concentration in a 10-fold
dilution series giving 7 different concentrations. A master mix was prepared as described in
Table 3. SensiMix listed in this table contained reaction buffer, heat-activated DNA
Polymerase, dNTPs, 6 mM MgCl2 and stabilisers. cDNA samples prepared from isolated RNA
were diluted 1/3 with PCR grade water and 18 µl master mix was added to 2 µl diluted cDNA to
produce a 20 µl final reaction volume. PCR grade water was used as a substitute for cDNA in a
negative control. Preparation of the standard dilution series for each gene of interest and for
GAPDH and preparation of the master mix and its addition to DNA samples/standard were
carried out by a CAS-1200 automated PCR robot.
Table 3. Master mix for quantitative RT-PCR
Reagent Volume/Final Concentration Source
2x SensiMix dT 10 µl (1x) SensiMix dT kit, Quantace
QT6T3
PCR grade water 5.6 µl Sigma W4502
Forward primer 1 µl (0.5 µM) -
Reverse primer 1 µl (0.5 µM) -
SYBR Green I 0.4 µl (1x) SensiMix dT kit, Quantace
QT6T3
Final reaction volume (including 2 µl cDNA template) was 20 µl.
A Rotor-Gene™ 6000 was used to carry out the PCR reactions. The reaction conditions
were as follows: 10 min at 95°C to activate the polymerase prior to 40 cycles of 5 sec at 95°C to
denature the DNA, 15 sec at primer annealing temperature (see Table 2) and 15 sec at 72°C for
elongation. Fluorescence was measured at the end of the elongation step (at 72°C) in every
cycle for TNFα and IL-6. However, for IL-8, fluorescence was measured in every cycle at an
elevated step (77°C) at the end of the elongation phase. This was to “melt” non-specific
Page 98
Page 98 of 286
amplified DNA so that fluorescence measurements were from specific amplification of the gene
of interest. These conditions were optimised in previous studies (Burns et al., 2008). Data
acquisition and analyses were carried out using Rotor-Gene™ 6000 software version 1.7.
4.2.7 Comparison of cytokine responses of PBMC to mAbs other than TGN1412 added as
aqueous solutions or immobilised by air-drying or wet-coating onto polypropylene
and polystyrene culture plates
Clinical grade mAbs Tysabri, Avastin, Herceptin, Campath-1H and an IgG4κ negative
control (described in section 2.6) were compared for their capabilities to stimulate the release of
TNFα using protocols described in section 4.2.1 for TGN1412.
4.3 Results
4.3.1 TGN1412 immobilised by air-drying stimulates the largest cytokine responses from
PBMC
Figure 14 shows a comparison of 6 different methods of applying TGN1412 on its
capability to stimulate TNFα, IL-6 and IL-8 responses from PBMC when cultured with these
cells for 16 - 24 h. The methods were: immobilising TGN1412 by air-drying onto
polypropylene, untreated 96-well U-bottomed microtitre plates and polystyrene, tissue culture
treated, 96-well U-bottomed microtitre plates, immobilising TGN1412 by wet-coating onto
polypropylene and polystyrene plates and adding TGN1412 as an aqueous solution to
polypropylene and polystyrene plates.
TNFα, IL-6 and IL-8 responses of PBMC to TGN1412 added in aqueous phase to
polypropylene and polystyrene plates were very small, with little difference from responses to
the isotype-matched negative control added in the same manner. As a consequence of
transferring cell-conditioned medium to the ELISA plates for assay of cytokines, aqueous
TGN1412 (unlike immobilised TGN1412) would also have been transferred. However, there
Page 99
Page 99 of 286
was no detectable difference between the values for absorbance for TNFα, IL-6 and IL-8
cytokine standard curves prepared in the absence and presence of aqueous TGN1412 (1000
µg/ml, data not shown). This showed that aqueous TGN1412 was not inhibiting the detection of
cytokines by ELISA.
TGN1412 immobilised by air-drying onto the walls of wells of both polypropylene and
polystyrene microtitre plates stimulated the release of TNFα, IL-6 and IL-8 to concentrations
significantly above those evoked by the isotype-matched negative control (p<0.01 for all three
cytokines when comparing responses to TGN1412 with responses to the isotype-matched
negative control on the same plate, Wilcoxon’s paired signed rank test). Absolute values for the
three cytokines were substantial for TGN1412 air-dried onto polypropylene and polystyrene
plates with the exception of small IL-6 responses to TGN1412 immobilised by air-drying onto
polystyrene plates. Cytokine responses to air-dried TGN1412 showed a bell-shaped dose-
response curve with 10 µg/well TGN1412 giving the largest response: 4067 ± 722 pg/ml TNFα,
1338 ± 449 pg/ml IL-6 and 63,650 ± 10,561 pg/ml IL-8 for TGN1412 air-dried onto
polypropylene plates and 1671 ± 343 pg/ml TNFα, 109 ± 22 pg/ml IL-6 and 30,040 ± 7178
pg/ml IL-8 when TGN1412 was air-dried onto polystyrene plates, values are means ± S.E.M of
10 donors, from 3 independent assays.
Absolute TNFα, IL-6 and IL-8 responses were much smaller to TGN1412 wet-coated
onto polypropylene plates compared with responses to TGN1412 air-dried onto polypropylene
plates (p<0.05 when comparing responses for TNFα, IL-6 and IL-8, where TGN1412 = 10
µg/well, paired t test). Responses were also smaller to TGN1412 wet-coated onto polystyrene
plates compared with responses to TGN1412 air-dried onto polystyrene plates (p<0.05 when
comparing responses for TNFα, IL-6 and IL-8, where TGN1412 = 10 µg/well, paired t test).
The values were as follows: 1576 ± 349 pg/ml TNFα, 286 ± 121 pg/ml IL-6 and 29,346 ± 4452
pg/ml IL-8 for TGN1412 wet-coated onto polypropylene plates at 10 µg/well and 343 ± 160
pg/ml TNFα, 38 ± 16 pg/ml IL-6 and 6254 ± 2322 pg/ml IL-8 for TGN1412 wet-coated onto
polystyrene plates at 10 µg/well. Values are means ± S.E.M of 10 donors, from 3 independent
assays. Absolute values for all three cytokines were smallest when TGN1412 was immobilised
by wet-coating onto polystyrene plates.
Page 100
Page 100 of 286
Figure 14. Cytokine responses of PBMC to TGN1412 either immobilised onto wells of microtitre plates
or added as an aqueous solution. PBMC were cultured for 16 – 24 h with TGN1412 or the isotype-
matched negative control (IC), which had either been immobilised by air-drying or wet-coating, at the
doses shown, onto wells of polystyrene (PS) or polypropylene (PP) 96-well microtitre plates or that had
been added as an aqueous solution. The values (pg/ml) for TNFα, IL-6 and IL-8 are means ± S.E.M of 6 -
10 donors of PBMC from 3 independent assays.
Page 101
Page 101 of 286
Although caution must be exercised when comparing in vivo and in vitro cytokine
concentrations, Table 4 shows that the concentrations of TNFα and IL-8 stimulated by
TGN1412 immobilised onto polypropylene plates (i.e. the method that stimulated the largest
cytokine responses) were broadly similar to the concentrations measured in the blood of the
TGN1412 trial volunteers post-infusion. In contrast, levels of IL-6 stimulated by immobilised
TGN1412 were less than half of the concentrations measured in the blood of the trial volunteers.
Table 4. Comparison of peak cytokine responses (pg/ml) to TGN1412 in vivo (Suntharalingam et al.,
2006) with those of PBMC to 10 µg/well TGN1412 immobilised by air-drying onto polypropylene.
Cytokine In vivo peak responses*
(medians for 6 patients)
Largest PBMC responses to
immobilised TGN1412*1
TNF 4676 4067 ± 722
IL-6 3400 1338 ± 449
IL-8 ≥5000 63,650 ± 10,561
* Peak responses were at 4 h post infusion of TGN1412. *1 Values are means and S.E.M from Figure 14.
4.3.2 TGN1412 immobilised by air-drying stimulates cytokine responses from whole
blood
Figure 15 shows that TGN1412 immobilised by air-drying onto the walls of wells of both
polypropylene and polystyrene microtitre plates incubated with 20% (v/v) whole blood for 16 -
24 h stimulated TNFα, IL-6 and IL-8 responses above those of the isotype-matched negative
control (p<0.05 for all cytokines when comparing responses to TGN1412 with responses to the
isotype-matched negative control for the same plate, Wilcoxon’s paired signed rank test). These
responses to TGN1412 were dose-dependent. The values for TGN1412 at 100 µg/well were as
follows: 45 ± 9 pg/ml TNFα, 60 ± 26 pg/ml IL-6 and 1147 ± 387 pg/ml IL-8 for TGN1412 air-
dried onto polypropylene plates and 34 ± 8 pg/ml TNFα, 20 ± 9 pg/ml IL-6 and 376 ± 108
pg/ml IL-8 for TGN1412 air-dried onto polystyrene plates (values are means ± S.E.M of 8
donors, from 2 independent assays). However, absolute cytokine responses of whole blood to
TGN1412 were, in general, much smaller than those of PBMC.
Page 102
Page 102 of 286
Figure 15. Cytokine responses of 20% (v/v) human whole blood to TGN1412 immobilised by coating
using the air-drying method onto either polypropylene or polystyrene microtitre plates. Diluted whole
blood was incubated for 16 – 24 h with TGN1412 or the isotype-matched negative control (IC) that had
been coated by air-drying onto wells of either polystyrene or polypropylene 96-well microtitre plates. The
values (pg/ml) for TNFα, IL-6 and IL-8 are means ± S.E.M of 8 donors of blood from 2 independent
assays.
Page 103
Page 103 of 286
4.3.3 Two different methods for air-drying TGN1412 onto polypropylene microtitre
plates give very similar cytokine responses
Two methods of air-drying TGN1412 and isotype-matched negative control onto the
walls of wells of polypropylene plates were compared. The first was to leave the TGN1412
solution in the wells of microtitre plates overnight in a laminar flow cabinet to allow the
solution of antibody to evaporate slowly. The second was to use a hair-dryer to rapidly
evaporate the solution. TGN1412 immobilised by either of these methods at 1, 10 and 100
µg/well stimulated both TNFα and IL-8 cytokine responses from PBMC above those to the
isotype-matched negative control when cells were cultured with TGN1412 for 24 h a shown in
Figure 16. Very little difference was found between the cytokine responses for the two methods
(4360 ± 565 pg/ml TNFα and 44,531 ± 5756 pg/ml IL-8 for TGN1412 air-dried at 10 µg/well,
overnight in a laminar flow cabinet versus 4427 ± 466 pg/ml TNFα and 45,113 ± 2193 pg/ml
IL-8 for TGN1412 air-dried at 10 µg/well with the use of a hair-dryer, values are means and
S.E.M of 4 donors, one experiment).
Page 104
Page 104 of 286
Figure 16. Cytokine responses of PBMC to TGN1412 air-dried onto walls of wells of microtitre plates by
two different methods. TGN1412 and the IC were immobilised by coating onto the walls of wells of
polypropylene 96-well microtitre plates either by blowing warm air across the wells (warm air-dried) or
by leaving the solution to evaporate at room temperature (air-dried). PBMC were cultured for 16 – 24 h
with the immobilised TGN1412 or the isotype-matched negative control (IC) at the doses shown.
Endotoxin was used as a positive control and was added as an aqueous solution. The values (pg/ml) for
TNF (A) and IL-8 (B) are means ± S.E.M of 4 donors of PBMC, from 1 assay.
4.3.4 Different coating methods, using different types of microtitre plate, affect the
quantity and quality of TGN1412 that remains immobilised
The total amount of TGN1412 immobilised onto polypropylene and polystyrene plates
after coating using the wet-coating or air-drying methods (as described above) was measured by
ELISA using an anti-human IgG antibody (gamma chain specific) conjugated to horseradish
peroxidase. Figure 17A shows small differences between the resulting values for absorbance
Page 105
Page 105 of 286
when 10 µg/well TGN1412 (chosen because this was the optimum dose to stimulate the largest
cytokine release from PBMC for a majority of the methods) was coated by air-drying or warm
air-drying onto polypropylene and polystyrene plates and by wet-coating onto polypropylene
plates. However, Figure 17A also shows much smaller resulting values for absorbance when
TGN1412 was immobilised by wet-coating onto polystyrene plates compared with the other
methods. These data suggest a 60% reduction in the total amount of immobilised TGN1412
when wet-coated onto polystyrene plates compared with the total amount immobilised when
wet-coated onto polypropylene plates (p<0.01, t test).
To determine the effect of different coating methods on the quantity of TGN1412
immobilised and orientated so as to bind to CD28 via the variable region, i.e. “usefully bound”,
TGN1412 (10 µg/well) was coated onto the walls of wells of polypropylene and polystyrene
plates using the various coating methods described in Figure 17. After washing, the bound
TGN1412 was incubated with a CD28/IgG1 fusion protein. The quantity of plate-bound
TGN1412 that was in turn able to bind CD28 was measured using a biotinylated anti-human
IgG1 Fc specific antibody. Figure 17B shows little difference between the resulting values for
absorbance when TGN1412 was coated by air-drying or warm air-drying onto polypropylene
and polystyrene plates and by wet-coating onto polypropylene plates. In contrast, Figure 17B
shows a much smaller resulting value for absorbance when TGN1412 was immobilised by wet-
coating onto polystyrene plates. These data suggest a 90% reduction in the amount of “usefully
bound” TGN1412 when wet-coated onto the wells of polystyrene plates compared with the
amount “usefully bound” when wet-coated onto polypropylene plates (p<0.01, t test).
Page 106
Page 106 of 286
Figure 17. The effects of different coating methods on the amount and orientation of TGN1412 bound to
wells of 96-well microtitre plates. TGN1412 was immobilised by coating at 10 µg/well either by air-
drying, warm air-drying or wet-coating onto wells of polypropylene (PP) or polystyrene (PS) plates.
Panel A shows the total amount of plate-bound TGN1412 for the different methods after washing,
quantified using a horseradish peroxidase labelled anti-human IgG antibody (gamma chain specific).
Panel B shows the amount of plate-bound TGN1412 (after washing), orientated such that CD28
(conjugated to IgG1 Fc) was able to bind. The amount of plate-bound TGN1412, which was able to bind
the CD28 fusion protein was determined using a biotinylated anti-human IgG1 Fc antibody. Values are
means ± S.E.M of 4 replicates from 1 assay and are representative of 2 independent assays. All values
were baseline corrected as described in the Methods section.
The increase in the percentage reduction for wet-coating onto polystyrene from 60% for
total TGN1412 bound to 90% for the amount “usefully bound” suggests that the reduction
found in the “usefully bound” TGN1412 was not entirely the result of less total TGN1412 being
bound but because wet-coating onto polystyrene did not favour the binding of TGN1412 in a
Page 107
Page 107 of 286
“useful” orientation. (The above percentages were calculated from the means of 4 replicates,
shown in Figure 17, the values being representative of two independent experiments).
Experiments were carried out to determine the optimum concentrations of reagents used
in the binding experiments described above. Using these optimised concentrations, it was
possible to detect ten-fold dilutions of immobilised TGN1412 (air-dried onto polypropylene
plates) ranging from 0.1 – 10 µg/well for both types of ELISA, suggesting that the lack of
difference in the values for absorbance for the different coating methods was not due to the
reagents being a limiting factor. The isotype-matched (to TGN1412) negative control was also
coated onto plates at 1 µg/well, using the methods employed to coat TGN1412. Values for
absorbance for the isotype-matched negative control were comparable to those for TGN1412
when using an anti-human IgG antibody specific for the gamma chain to quantify the total
amount of antibody bound to the plates, suggesting that the control antibody had been
immobilised. Therefore, the lack of responses of PBMC and whole blood to the isotype-
matched negative control, as shown in Figure 14 and Figure 15 were not a consequence of this
control antibody not binding to the plates. However, when the coated isotype-matched negative
control was incubated with the CD28 fusion protein, the values for absorbance were not above
baseline values for all coating methods, suggesting that the CD28 fusion protein bound only to
the variable region of TGN1412 and not to the regions constant of all IgG4 antibodies.
Consequently, only plate-bound TGN1412 orientated such that the CD28 fusion protein was
able to bind to it, i.e. “usefully bound”, was detected in such ELISAs.
4.3.5 Aqueous TGN1412 inhibits cytokine responses of PBMC to immobilised TGN1412
The TNFα response of PBMC incubated with TGN1412 immobilised by air-drying onto
polypropylene plates at 10 µg/well for 24 h was reduced upon the addition of TGN1412 in
aqueous phase as shown in Figure 18. The extent of inhibition of the response increased in a
dose-dependent manner as the concentration of aqueous TGN1412 added increased (values
ranged from 8070 ± 867 pg/ml TNFα where no aqueous TGN1412 was added, to 3542 ± 281
pg/ml where 100 µg/well aqueous TGN1412 was added, values are means and S.E.M of 8
Page 108
Page 108 of 286
donors of PBMC, from 2 independent experiments). All responses to immobilised TGN1412
were larger (including those where aqueous TGN1412 had been added) than responses to the
isotype-matched negative control (p<0.01, Wilcoxon’s signed rank test). The TNFα responses
of PBMC incubated with TGN1412 immobilised by air-drying onto polypropylene plates at 10
µg/well for 24 h was not reduced upon the addition of an isotype-matched negative control in
aqueous phase at the same concentrations used for the aqueous TGN1412 (values ranged from
2977 ± 613 pg/ml TNFα where no aqueous isotype-matched control was added to 3311 ± 1093
pg/ml TNFα where 100 µg/well aqueous isotype-matched control was added, values are means
and S.E.M of 7 donors from 2 independent experiments).
Figure 18. Inhibition of cytokine responses of PBMC to immobilised TGN1412, caused by aqueous
TGN1412. PBMC were cultured for 16 – 24 h with TGN1412 (10 µg/well), immobilised by coating
(using the air-drying method), onto wells of polypropylene plates on its own or in the presence of a range
of concentrations (as shown) of aqueous TGN1412. PBMC were also cultured with an isotype-matched
negative control (IC) immobilised as for TGN1412 but at 1 µg/well, in the absence of aqueous TGN1412.
The values (pg/ml) for TNFα are means ± S.E.M of 8 donors of PBMC, from 2 independent assays.
Page 109
Page 109 of 286
4.3.6 Early TNF , IL-6 and IL-8 gene expression and cytokine responses of PBMC to
immobilised TGN1412 measured by quantitative RT-PCR and by ELISA
respectively
The purpose for measuring early cytokine responses to immobilised TGN1412 was to
investigate the kinetics of cytokine release stimulated by immobilised TGN1412 and to
determine whether or not TGN1412 could have stimulated de novo cytokine synthesis within
one hour post-infusion. PBMC were incubated with immobilised (using the air-drying method)
TGN1412 or an isotype-matched negative control antibody at 1 µg/well in wells of
polypropylene plates for either 30, 60 or 90 min.
4.3.6.1 Early TNF , IL-6 and IL-8 gene expression
TNF , IL-6 and IL-8 gene expression in PBMC was measured by quantitative RT-PCR
analysis, the results of which are shown in Figure 19A. Gene expression was measured in terms
of the ratio between normalised mRNA levels synthesised in response to TGN1412 and those to
the isotype-matched negative control and values are means ± S.E.M of 6 donors of PBMC from
3 independent experiments. TNF gene expression by PBMC was elevated after just 30 min
incubation with immobilised TGN1412. Levels were approximately 2.5x higher than those
measured in response to the isotype-matched negative control. After 60 min, TNF gene
expression stimulated by TGN1412 further increased and was approximately 5.5x higher than
that stimulated by the isotype-matched control. The elevated level of mRNA production was
sustained at 90 min but no further increase was detected. In contrast to TNF , TGN1412-
stimulated IL-6 and IL-8 gene expression by PBMC did not increase above that stimulated by
the isotype control at 30, 60 and 90 min incubations.
Cytokine-specific primers were used in PCR reactions, however melt curve analyses were
carried out on all quantitative PCR amplified products to confirm amplification of a single gene
product within a reaction. Figure 20 shows typical melting profiles for TNF - IL-6-, IL-8- or
Page 110
Page 110 of 286
GAPDH specific primers. The PCR product amplified using TNF -specific primers in samples
from TGN1412-stimulated cells and from the isotype-matched negative control-stimulated cells
had the same melting profiles as the product amplified by the same primers in a sample
containing TNF standard suggesting that the PCR products amplified were all identical and
that the product was TNF . This was also the case in PCR reactions using IL-6-, IL-8- and
GAPDH-specific primers and standards. A “no template” (H2O) control was included for each
primer pair (i.e. specific for TNF , IL-6-, IL-8- or GAPDH) to demonstrate the absence of
contamination in the samples. Figure 20 shows peaks in the melting profile for the “no
template” control, in particular for TNF and IL-6. However these profiles are different from
those of the test samples suggesting that the amplified product (which amplified at very high
cycle numbers) in the negative control was not the same as that in test samples and is likely to
have been the product resulting from primer sets binding to each other in the absence of
template.
4.3.6.2 Early TNF , IL-6 and IL-8 cytokine production
Cell-conditioned medium from the PBMC used for quantitative RT-PCR (described
above) was assayed for TNF , IL-6 and IL-8 in cytokine-specific ELISAs to determine
cytokine concentrations produced by PBMCs in response to TGN1412, the results of which are
shown in Figure 19B. Cytokine responses are expressed in terms of the ratio between cytokine
concentrations produced in response to TGN1412 and those to the isotype-matched negative
control and values are means ± S.E.M of 6 donors of PBMC from 3 independent experiments.
The pattern of cytokine responses of PBMC stimulated with TGN1412 was broadly similar to
the pattern of gene expression by PBMC stimulated with TGN1412. However, in contrast to
gene expression, elevated concentrations of TNF could not be detected in the cell-conditioned
medium after a 30 min incubation of PBMC with TGN1412. Although mRNA synthesis
precedes protein production, the TNFα ELISA may not have been sensitive enough to detect
any small amounts of TNFα protein. Elevated concentrations of this cytokine, however, were
Page 111
Page 111 of 286
detected by ELISA after 60 min incubation with TGN1412, and TGN1412-stimulated responses
were approximately 3x larger than those to the isotype-matched negative control. In contrast to
TNF gene expression, TNF protein concentrations further increased after 90 min incubation
and were approximately 5 times larger than responses to the isotype-control. IL-6 and IL-8
cytokine responses of PBMC stimulated by TGN1412, as with IL-6 and IL-8 gene expression,
were not elevated above responses to the isotype control at 30, 60 or 90 minutes.
Figure 19. Early TNF , IL-6 and IL-8 gene expression by PBMC (panel A) and cytokine responses
(panel B) to immobilised TGN1412. PBMC were cultured for 30, 60 and 90 min with TGN1412 or an
isotype-matched negative control at 1 µg/well, immobilised by coating (using the air-drying method),
onto wells of polypropylene plates. Gene expression by PBMC was quantified by RT-PCR analysis and
cytokine release into cell-conditioned media was measured by ELISA. Gene expression (panel A) is
represented as the ratio of normalised mRNA levels synthesised in response to TGN1412 to those in
response to the isotype-control. Cytokine responses are expressed in terms of the ratio of cytokine
concentrations stimulated by TGN1412 to those stimulated by the isotype-matched negative control.
Values plotted are means ± S.E.M of 6 donors from 3 independent experiments.
Page 112
Page 112 of 286
Figure 20. Typical TNF , IL-6, IL-8 and GAPDH PCR product melting profiles from melt curve
analyses. Green line: no template (negative) control; Red line: TNF , IL-6, IL-8 and GAPDH standard;
Black line: TGN1412-stimulated cells; Blue line: isotype-matched negative control-stimulated cells.
4.3.7 TNFα responses of PBMC to immobilised mAbs in addition to TGN1412
Figure 21 shows TNFα responses of PBMC when cultured for 24 h with therapeutic
mAbs Tysabri, Herceptin, Campath-1H, TGN1412 and a negative control immobilised by either
wet-coating or air-drying onto wells of polypropylene and polystyrene 96-well U-bottomed
plates or added as an aqueous solution to wells of polypropylene and polystyrene 96-well U-
bottomed plates. TNFα responses of PBMC to all mAbs added in aqueous phase to
polypropylene and polystyrene plates were very small. As discussed in section 2.6 (see also
Appendix II), none of the therapeutic mAbs tested inhibited the detection of TNFα by ELISA.
As with TGN1412, TNFα responses of PBMC to Herceptin and Campath-1H immobilised by
air-drying or wet-coating onto wells of polypropylene and polystyrene plates were larger when
Page 113
Page 113 of 286
compared with responses to these antibodies when they were added in aqueous phase. For the
methods air-drying onto polypropylene and polystyrene and wet-coating onto polypropylene,
TNFα responses of PBMC were largest for TGN1412 and smallest for Tysabri. The TNFα
responses to Herceptin and Campath-1H, using these methods, were similar and were of a
magnitude intermediate between responses to Tysabri and TGN1412.
Figure 21. TNFα responses of PBMC to mAbs either immobilised onto wells of microtitre plates or added
as an aqueous solution. PBMC were cultured for 24 h with mAbs Tysabri (TYS), Herceptin (HER),
Campath-1H (CAM), TGN1412 (TGN) and a negative control (NC) that had either been immobilised by
air-drying or wet-coating, at three or four different doses (1=0.1, 2=1.0, 3=10 and 4=100 µg/well) onto
wells of polystyrene or polypropylene 96-well microtitre plates or that had been added as an aqueous
solution. The values (pg/ml) for TNFα are means ± S.E.M of 8 donors of PBMC from 2 independent
experiments.
Page 114
Page 114 of 286
Figure 22 shows TNFα responses of PBMC when cultured for 24 h with therapeutic
mAbs Avastin, Herceptin, Campath-1H, TGN1412 and the negative control either immobilised
by air-drying onto wells of polypropylene 96-well U-bottomed plates or added as an aqueous
solution to wells of polypropylene 96-well U-bottomed plates. Responses were smallest for all
four therapeutic mAbs when they were added in aqueous phase. Responses were increased when
the therapeutic mAbs were air-dried onto plates. TNFα responses were the smallest to Avastin
(114 ± 37 pg/ml) and the largest to TGN1412 (2929 ± 667 pg/ml). The TNFα responses to
Herceptin and Campath-1H were similar (663 ± 301 pg/ml for Herceptin and 594 ± 176 pg/ml
for Campath-1H) and were of a magnitude intermediate between responses to TGN1412 and
Avastin. The values are means ± S.E.M of 4 donors of PBMC, values used to calculate the mean
responses were from the doses of antibodies that gave the largest responses for each donor (10 –
100 µg/well).
Figure 22. TNFα responses of PBMC to mAbs either immobilised onto wells of microtitre plates or added
as an aqueous solution. PBMC were cultured for 24 h with mAbs Avastin, Herceptin, Campath-1H,
TGN1412 and a negative control (NC) that had either been immobilised by air-drying onto wells of
polypropylene 96-well microtitre plates or that had been added as an aqueous solution. The TNFα values
used (pg/ml) to calculate the means in the figure were from the dose of antibody which gave the largest
response for each donor of PBMC (10 – 100 µg/well). Values shown are means ± S.E.M of 4 donors of
PBMC.
Page 115
Page 115 of 286
4.4 Discussion
The failure of pre-clinical testing to predict the adverse pro-inflammatory effects of
TGN1412 emphasised the need for methods to better predict the clinical safety of such
therapeutic antibodies. In this chapter, six different methods of applying TGN1412 to 96-well
microtitre plates were investigated to determine the capability of these in vitro methods to
predict the observed in vivo cytokine-releasing activity of TGN1412.
Cytokine responses of PBMC to TGN1412 added in aqueous phase to polypropylene and
polystyrene plates were very small, being much the same as responses to the isotype-matched
negative control added in the same manner (results consistent with published data from
(Stebbings et al., 2007). In contrast, immobilised TGN1412 stimulated cytokine responses
above those induced by the isotype-matched negative control. Cytokine responses stimulated by
TGN1412 immobilised by air-drying onto polypropylene and polystyrene plates were much
larger than responses to TGN1412 wet-coated onto polypropylene and polystyrene plates,
respectively. The immobilisation method which gave the smallest absolute cytokine values in
response to TGN1412 was when TGN1412 was immobilised by wet-coating onto polystyrene
plates. PBMC were found to be more sensitive to TGN1412 than whole blood and elicited
larger cytokine responses. This may have been because the isolation procedure somehow
primed the PBMC or removed a negative influence or influences from the whole blood, or both.
Alternatively, it may simply be because the immobilised TGN1412 is rapidly covered with the
large excess of red blood cells in diluted whole blood rather than with the lymphocytes that
express the CD28 receptor.
It is not known why, in vitro, aqueous TGN1412 failed to stimulate cytokine responses
from PBMC but was able to do so when immobilised by coating onto the walls of wells of
microtitre plates. What is clear, however, is that the immobilisation allowed TGN1412 to
stimulate cytokine responses from PBMC similar to those observed in vivo in man
(Suntharalingam et al., 2006). Through binding of the Fc portions of mAbs, Fc receptors
expressed by, for example, monocytes can promote the clustering of target-bound mAbs leading
to the activation of the target cell (Bugelski et al., 2009). It is possible that, in vivo, TGN1412
Page 116
Page 116 of 286
bound to CD28 receptors on T cells via its variable region and was then cross-linked in some
manner, for example by Fc receptors. Such cross-linking of TGN1412 may have “presented”
this antibody in a specific conformation that allowed linear complex formation with CD28 (as
described in Figure 7) and subsequent superagonistic activation of T cells. It is possible that, in
vitro, immobilising TGN1412, potentially with its Fc region bound to a plastic surface, cross-
linked TGN1412 itself, allowing it to be presented to CD28 receptors in a manner that was,
perhaps, analogous to the in vivo situation. However, one could ask why aqueous TGN1412 did
not stimulate cytokine release by PBMC as Fc receptors are expressed by cells such as
monocytes in the PBMC fraction. One explanation could be that immobilisation of TGN1412
onto microtitre plates may have presented this antibody to T cells such that it was able to bind to
CD28 receptors within a concentrated area of the cell surface (i.e. polarised) and so cross-link
CD28 above threshold levels required for T cell activation. Further support for this theory of
polarised CD28 cross-linking came from the finding that the TNFα responses of PBMC to
TGN1412 immobilised by air-drying onto polypropylene plates was inhibited in a dose-
dependent manner by the addition of aqueous TGN1412. It is possible that the aqueous
TGN1412 bound at random to CD28 receptors distributed over the entire T cell surface and so
was effectively an antagonist of the plate-bound TGN1412. In such a situation the disruption of
(polarised) binding and cross-linking of CD28 receptors by TGN1412 would have prevented the
subsequent interaction of the relevant downstream signalling molecules in specific regions of
the cell surface. Further evidence for the notion of polarised CD28 cross-linking came from the
finding that when anti-human IgG4 Fc specific antibodies were incubated in solution with
aqueous TGN1412 and PBMC, T cell activation did not occur but when the anti-human IgG4
Fc-specific antibodies were immobilised by air-drying and used to capture (and hence
immobilise) aqueous TGN1412, profound T cell activation was evident, measured in terms of
IL-2 production (Stebbings et al., 2007). What cannot be explained is exactly how this polarised
cross-linking of CD28 receptors would have been achieved in vivo. It is possible that TGN1412
was immobilised in some manner by molecules on the surface of other cells such as endothelial
cells (i.e. cells not found within a PBMC fraction).
Page 117
Page 117 of 286
It is not obvious why air-dried TGN1412 stimulated larger cytokine responses than wet-
coated TGN1412 or why responses to TGN1412 immobilised by wet-coating onto polystyrene
were smaller. A reasonable hypothesis is that the different methods affected either the quality or
quantity, or both, of immobilised TGN1412. In this context, quality means orientated with the
CD28-binding domain more readily available to bind CD28 expressed on T cells. No
differences were found in the total amount of TGN1412 bound to the plates when coated by air-
drying or warm air-drying onto polypropylene and polystyrene plates or by wet-coating onto
polypropylene plates; nor was it found that these different methods affected the orientation of
TGN1412 bound to the plates. What was found, however, was that less TGN1412 remained
bound to polystyrene plates when immobilised by wet-coating, compared with the other
methods. In addition, wet-coating to polystyrene favoured TGN1412 being immobilised with an
orientation such that the CD28-specific variable region was less available to bind to the CD28
fusion protein used in these experiments. This finding may be responsible for the smaller
cytokine responses of PBMC to TGN1412 immobilised by wet-coating onto polystyrene plates.
During the TGN1412 clinical trial, volunteers presented with pain approximately 1 h
post-infusion. TNF was the first pro-inflammatory cytokine to be elevated in the serum
approximately 1 h post-infusion and this was followed by IL-8 and IL-6 within 4 h post-infusion
(Suntharalingam et al., 2006). To compare the kinetics of cytokine responses of PBMC to
immobilised TGN1412 with the kinetics of responses observed in the TGN1412 trial volunteers,
RT-PCR was used to measure gene expression by PBMC incubated with TGN1412 for 30, 60
or 90 minutes. Elevated levels of TNF gene expression could be measured after a 30 min
stimulation, and these increased further after 60 min. This was consistent with the in vivo
situation although measurements of serum cytokine concentrations were not carried out 30 min
post-infusion. Furthermore, TNF concentrations measured by ELISA in the cell-conditioned
medium from TGN1412-stimulated cells were also elevated after a 60 min incubation. These
data seem to suggest that the kinetics for TNF responses were similar in vivo and in vitro.
Elevated IL-8 and IL-6 responses of PBMC to immobilised TGN1412 could not be measured in
terms of gene expression (by RT-PCR) or protein production (by ELISA) at 30, 60 or 90 min
post stimulation with TGN1412. This is consistent with the in vivo situation in that IL-8 and IL-
Page 118
Page 118 of 286
6 responses followed TNF responses but the literature states “within 4 h post-infusion”, thus
longer in vitro incubations would have been required to further investigate the in vitro model. It
is conceivable from these data that cells bearing CD28 receptors and which are directly
stimulated by TGN1412 produce TNF which subsequently stimulates other cells bearing
TNF receptors (CD120-positive cells), such as monocytes, to release IL-6 and IL-8.
Measurement of gene expression by RT-PCR was also used to determine whether or not TNF
in the serum of the volunteers was likely to have been pre-formed prior to its (TGN1412-
stimulated) release from cells as opposed to TGN1412 activating TNF gene expression and
synthesis, since elevated concentrations of TNF occurred so soon (within 60 min) after
infusion of TGN1412 (Suntharalingam et al., 2006). The finding in this study that TNF gene
expression was elevated in TGN1412-stimulated cells suggests that serum concentrations of this
cytokine in the trial volunteers derived, at least in part, from TNF synthesised de novo rather
than from pre-formed intracellular stores.
Although in vitro and in vivo comparisons should be made with caution, the
concentrations of TNF and IL-8 stimulated by TGN1412 immobilised onto polypropylene
plates were broadly similar to the concentrations measured in the blood of the trial volunteers.
This further validates this assay as an in vitro model for predicting in vivo responses to
TGN1412. However, the concentrations of IL-6 stimulated by immobilised TGN1412 were
much lower than concentrations measured in the blood of the trial volunteers. It is conceivable
that, in vivo, cells not included in the PBMC fraction of blood were responsible, at least in part,
for TGN1412-stimulated (directly or indirectly) IL-6 production, for example, endothelial cells.
In view of the success of the new procedures with TGN1412, the next step was to
determine whether or not any of the procedures used to immobilise TGN1412 were better than
simply adding aqueous mAb at predicting unwanted pro-inflammatory activities of mAbs other
than TGN1412. The mAbs Herceptin, an IgG1 anti-Her2, and Campath-1H, an IgG1 anti-CD52,
were tested because they are antibodies that are frequently associated with pro-inflammatory
clinical infusion reactions (Chung, 2008). Tysabri, an IgG4κ anti- 4 integrin was also tested
because it is an antibody only rarely associated with clinical infusion reactions. TNFα responses
Page 119
Page 119 of 286
of PBMC to these antibodies were very small when the mAbs were added in aqueous phase as
was observed with TGN1412. However, larger responses were evoked when these antibodies
were immobilised. When air-dried onto polypropylene and polystyrene and wet-coated onto
polypropylene, the capability of the mAbs to stimulate TNFα responses of PBMC could be
ranked as follows: Tysabri < Herceptin = Campath-1H < TGN1412 (based on absolute values of
TNFα released by PBMC). Thus, it was only when the antibodies were air-dried onto
polypropylene or polystyrene or wet-coated onto polypropylene (but not when wet-coated onto
polystyrene), that all three antibodies associated with clinical infusion reactions, stimulated
TNFα responses. The mAb Tysabri, which is only rarely associated with clinical infusion
reactions, stimulated small TNFα responses in the above experiments. Like Tysabri, the mAb
Avastin (an IgG1 anti-VEGF) is rarely associated with clinical infusion reactions (Chung,
2008). Avastin stimulated smaller TNFα responses when air-dried onto polypropylene than the
mAbs more frequently associated with clinical infusion reactions: Herceptin, Campath-1H and
TGN1412. The results from the above experiments with air-drying therefore broadly mirrored
reported clinical infusion reactions to these mAbs.
The present study suggests that antibody immobilisation by air-drying onto plastic
increases the likelihood of predicting whether or not antibodies other than TGN1412 are likely
to cause clinical infusion reactions, suggesting that this technique is applicable to antibodies
which target receptors other than CD28. It was conceivable that this method may be specific for
IgG4 mAbs and that IgG1 molecules may elicit cytokine responses when immobilised regardless
of their capability to cause clinical infusion reactions, as a result of their being more biologically
active than IgG4κ molecules. This study does not support this notion since the IgG1 mAb
Avastin, only rarely associated with clinical infusion reactions, stimulated only small TNFα
responses of PBMC. Consequently, the larger responses stimulated by the immobilised IgG1
molecules Herceptin and Campath-1H (which are frequently associated with clinical infusion
reactions) are unlikely to have resulted only from these mAbs being of the IgG1 subclass.
Of course, caution must be exercised when drawing conclusions from investigations with
just five therapeutic mAbs. Firstly, it may not be necessary to immobilise an antibody in order
for it to stimulate cytokine responses. Campath-1H was able to stimulate small TNFα responses
Page 120
Page 120 of 286
when incubated in aqueous phase in this study. This is consistent with the findings of Wing et
al. (1995) who incubated Campath-1H in aqueous phase with ex-vivo human whole blood
cultures (Wing et al., 1995). Campath-1H was able to stimulate TNFα responses when
incubated in aqueous phase with ex-vivo human whole blood cultures (Wing et al., 1995).
Secondly, it should not be assumed that an antibody immobilised by air-drying that stimulates
pro-inflammatory cytokine responses of PBMC would automatically do so in man. In contrast,
an antibody that fails to stimulate pro-inflammatory cytokine responses of PBMC – even when
it is immobilised by air-drying – would appear to be unlikely to do so in vivo in man.
Nonetheless, all antibodies should continue to be considered on a case by case basis with the
testing of immobilised antibody now considered as well as the usual testing in aqueous phase.
Caution must also be exercised when drawing conclusions from comparisons of just one type of
polystyrene plate from a single vendor versus just one type of polypropylene plate from a single
vendor. It is possible that the plate properties may vary from one vendor to another and from
one batch to another which again could influence the outcome of an experiment. Indeed the dose
of TGN1412 which stimulated the largest cytokine responses in this study shifted from 10
µg/well (Figure 14) to 100 µg/well (Figure 21) which may be a result of the use of different
plate batches. Polystyrene plates used in the above experiments, unlike the polypropylene
plates, were “tissue culture treated” and so exposed to vacuum gas plasma treatment which
leads to the incorporation of anionic functional groups and a hydrophilic surface. These
properties promote cell adhesion and for this reason most “cell-culture grade” polystyrene plates
are “tissue culture treated”. A supplier of non-treated U bottom polystyrene plates certified as
sterile and pyrogen-free (which was essential in this study because pyrogens stimulate the
release of pro-inflammatory cytokines) could not be identified. It is therefore conceivable that
the lack of binding of TGN1412 to polystyrene plates used in this study could have been a result
of the tissue culture treatment that they had received and not due to the fact that they were made
of polystyrene. This chapter is not intended to be an exhaustive survey of the many different
brands of 96-well plates on the market or, indeed, of all immunomodulatory therapeutic mAbs.
Rather, it is a study with the objective of developing/improving in vitro methods to allow better
detection and quantification of unwanted pro-inflammatory activities of mAbs. That said,
Page 121
Page 121 of 286
immobilisation of mAb onto plastic using the methods described in this chapter bears little
resemblance of the in vivo situation, i.e. plastic surfaces are not physiological and TGN1412 and
other mAbs are infused in aqueous phase. A more physiological method capable of predicting
the pro-inflammatory effects of therapeutic antibodies in man may give a better insight to the
underlying physiological mechanisms that mediate such responses in vivo.
Page 122
Page 122 of 286
CHAPTER 5:
The development of a
method that can predict the
clinical effects of TGN1412
in aqueous phase
Page 123
Page 123 of 286
CHAPTER 5: The development of a method that can predict the clinical effects of
TGN1412 in aqueous phase
5.1 Introduction
The aim of the work described in this chapter was to develop a procedure that was able to
predict the clinical effects of TGN1412 in aqueous phase, i.e. a procedure that was more
physiologically relevant than immobilising the antibody onto plastic. It has been shown so far in
this study that aqueous TGN1412 does not stimulate profound cytokine release (as it did in vivo)
when incubated with PBMC alone. This is not so surprising when one considers that many
different cell types are involved in mediating immunological responses in vivo. Although it
would be impossible to create an in vitro environment truly representative of the in vivo
situation, the inclusion of at least one more relevant cell type (in addition to those of PBMC)
into an in vitro test to create a co-culture was considered to be logical and practicable.
TGN1412 infused into the blood of the trial volunteers could have activated target T cells
in the blood, within the lymph nodes (where large populations of T cells reside) and within
tissues. Not only do endothelial cells form the lining of large vascular blood vessels, they also
form microvessels such as arterioles and venules, the main site of leukocyte migration from
blood into tissues. They also form the high endothelial venules which facilitate the movement of
lymphocytes from the blood into lymph nodes. It is therefore almost certain that TGN1412
would have activated T cells in the presence of endothelial cells. Endothelial cells play a pivotal
role in mediating inflammatory responses (Pober and Sessa, 2007), and the responses of the
clinical trial volunteers to TGN1412 could certainly be described as inflammatory. More
specifically, endothelial cells express adhesion molecules on their surface which interact with
ligands expressed by migrating leukocytes, resulting in their selective movement across the
endothelial barrier into tissue (Muller, 2002). In fact, adhesion molecules expressed by
endothelial cells regulate the circulation of lymphocytes through tissues by acting as tissue
specific “homing receptors” on endothelial cells to which specific lymphocyte subsets adhere
(Hamann et al., 1994). Since lymphopenia in the peripheral blood of the trial volunteers
Page 124
Page 124 of 286
followed soon after TGN1412 was infused (Suntharalingam et al., 2006), it was assumed that
lymphocytes would have migrated across endothelium (although it is not certain whether or not
lymphocytes migrated into tissues or to peripheral lymphoid organs). Therefore it was
conceivable that lymphocyte/endothelial cell interaction may have contributed to the
inflammatory responses to TGN1412. In this chapter, the hypothesis that PBMC co-cultured
over a monolayer of endothelial cells (illustrated in Figure 23) in a cytokine release assay
provides a means of detecting the toxic effects of TGN1412 in aqueous phase is tested. After
establishing “proof of principle”, efforts were made to optimise the method. The mechanisms
underlying the contribution of endothelial cells to the inflammatory responses to TGN1412 are
addressed in the following chapter (Chapter 6).
Figure 23. Co-culture: PBMC over a monolayer of endothelial cells.
5.2 Methods
Trypsin-EDTA was from Sigma (T4049) or Clonetics, Lonza (CC-5012). Human AB
(hAB) serum was from Biosera (4190-100) and was pooled from a number of donors. Foetal
calf serum (FCS) was either from Sera Laboratories International Ltd (EU-000FI) or was used
from the endothelial growth medium kit (EGM-2; Clonetics Lonza CC-3162) described below.
Heat inactivation of FCS (hi-FCS) or hAB serum (hi-hAB) at NIBSC was carried out by heating
stocks to 56°C for 25 min. Heat-inactivation of hAB serum and FCS was to inactivate
complement to eliminate any cytotoxic effects caused by these proteins. All cell incubations
were in a humidified incubator at 37°C in 5% CO2.
Page 125
Page 125 of 286
5.2.1 Isolation and culture of primary endothelial cells from umbilical vein of fresh
human cords (C-HUVEC)
Umbilical cords, from which primary C-HUVEC were isolated, were obtained under the
approval of the relevant ethics committees from consenting donors at the Queen Elizabeth II
(QEII) Hospital, Welwyn Garden City, Herts and at Rochdale Infirmary, Rochdale, Lancs.
Cords were collected in sterile jars containing 1x Hank’s balanced salt solution (Sigma H1641)
supplemented with 20 mM HEPES buffer (Sigma H0887), 0.08 % sodium-bicarbonate (Sigma
S8761), 0.05 mg/ml gentamycin (Sigma G1272), 50 U/ml penicillin and 0.05 mg/ml
streptomycin (stabilised solution; Sigma P4458). Umbilical cords were processed using sterile
technique in a class II laminar flow cabinet on a dissecting board covered with aluminium foil,
sterilised with 70% (w/w) ethanol. Scissors, forceps, luer adapters, cable ties and suture thread
were pre-soaked in 70% ethanol. Cords were examined and both ends were trimmed with
scissors. Those with puncture wounds were discarded. A luer adapter was inserted into each end
of the umbilical vein and these were held securely in place with a cable tie and suture thread as
shown in Figure 24. Using 10 ml syringes connected to each end of the umbilical vein via luer
adapters, the umbilical veins were flushed aseptically several times with sterile PBS A.
Collagenase (0.1% solution, Roche 10103586001) was injected into the umbilical vein prior to a
20 min incubation in a humidified incubator at 37°C in 5% CO2. Cords were wrapped in cling
film during this incubation. Endothelial cells were collected by massaging the cord and flushing
the vein with warm sterile PBS A. The cell suspension was centrifuged at 400 g for 10 min at
room temperature. The supernatant was removed prior to resuspension of the cells in 10 ml
EGM-2 containing 10% FCS. Cells were transferred to 25 cm2 flasks and incubated overnight to
allow the cells to adhere to the flask. Following incubation, cells were washed twice with warm
sterile PBS A prior to further incubation in 20% of the existing EGM-2 (centrifuged at 800 x g
for 5 min) and fresh EGM-2 containing 10% FCS. C-HUVEC from different cords were
cultured separately and, after 2 – 3 days, were maintained in EGM-2 containing 2% FCS.
Page 126
Page 126 of 286
Figure 24. Isolation of endothelial cells from human umbilical vein. Image from NIBSC photo library.
To passage, cells were rinsed with 5 ml HEPES-buffered saline solution (Clonetics CC-
5024, Lonza), prior to the addition of 5 ml trypsin-EDTA. Cells were examined under phase
contrast at 100x magnification. When cells appeared “rounded” but still remained attached to
the flasks, trypsin-EDTA was removed to leave 0.5 ml of fluid remaining and flasks were
tapped on a hard surface several times to dislodge cells. Cells were resuspended in 10 ml EGM-
2 containing 2% FCS and transferred to a separate tube. Cell counts were carried out and C-
HUVEC were seeded at 0.8 x 10⁶ cells per 75 cm
2 flask in 25 ml culture medium. C-HUVEC
were used between passage 2 and passage 8 in the experiments described below.
5.2.2 Culture of human umbilical vein endothelium derived cells - HUVECjr2 and
HUVECyn
HUVECjr2 and HUVECyn (pooled) were from TCS Biologicals (product code ZHC-
2101, batch 23203T). These endothelial cells are from human umbilical vein and had not been
immortalised. HUVECjr2 were purchased in 1999 and were cultured as described for C-
HUVEC in EGM-2 medium containing 2% FCS to produce a single working cell bank
expanded from the original stock (by Dr C.J Robinson, NIBSC). HUVECjr2 used in the
experiments described in this study were from this single working cell bank and were cultured
as for C-HUVEC. HUVECjr2 were used in experiments between passage 2 and passage 13.
Page 127
Page 127 of 286
HUVECyn were purchased in 2001. A single working cell bank was prepared (by Dr Y. Zhao,
NIBSC) using cells expanded from the original source. In this study, HUVECyn from this
single working cell bank were used at passages 3 and 4 and were maintained in EGM-2
containing 2% FCS. Prior to passage, new culture flasks (75 cm2) were first coated with gelatin
by adding 10 ml gelatin (Sigma G1393) mixed 1:1 with sterile PBS A prior to a 10 min
incubation at room temperature. Gelatin was then removed and flasks were washed 2x with
sterile PBS A. Cells were passaged as described for C-HUVEC but were washed with 10 ml
sterile PBS A, trypsinised with 5 ml trypsin-EDTA diluted 1 in 5 with sterile PBS A and were
seeded at 0.5 x 10⁶ cells in each gelatin coated flask.
5.2.3 Culture of human saphenous vein endothelial cells (HSVEC)
HSVEC were a kind gift from Professor A. George (Imperial College, London).
Endothelial cells isolated from human saphenous vein from one consenting donor, under a
project approved by the relevant ethics committee, were cryogenically frozen at passage 2 at
Imperial College London, Department of Medicine. Cells used in these experiments were from
this single working cell bank and were used at passages 4 and 5. HSVEC were maintained in
medium prepared as described in Table 5 (HSVEC culture medium) and were passaged as
described for C-HUVEC; after removing the existing culture medium, cells were washed with 5
ml sterile PBS A and trypsinised with 5 ml trypsin-EDTA diluted 1 in 2 with sterile PBS A.
Cells resuspended in fresh culture medium (5 - 10 ml/flask) were pooled, counted and seeded at
0.5 x 10⁶ cells/flask in 20 ml HSVEC culture medium.
Page 128
Page 128 of 286
Table 5. Components of HSVEC culture medium (500 ml total volume)
Component Final Concentration/Volume Source
Endothelial Cell Serum
Free Media
189 ml stock solution Gibco 11111-044
Endothelial Cell Basal
Medium (EBM)
189 ml stock solution Lonza cc-3156
Penicillin, Streptomycin,
Amphotericin B
(PSA)
50 U/ml pen, 50 U/ml strep & 0.25
µg/ml amphotericin B (5 ml of PSA*
aliquot)
Lonza DE17-603E (pen
& strep solution), Sigma
A2942 (amphotericin B)
L-Glutamine 2 mM (5 ml of 200 mM stock
solution)
Gibco 25030-032
Endothelial Cell Growth
Supplement (ECGS)
0.1 mg/ml (10 ml of 5 mg/ml ECGS*
aliquot)
BD Biosciences 356006
Hi-FCS 20% v/v (100 ml stock serum) NIBSC
Heparin 20 IU/ml (2 ml of 5000 IU/ml stock
solution)
CP Pharmaceuticals
Multiparin
*PSA: 10 ml amphotericin B stock solution added to 100 ml pen & strep stock solution; 5 ml aliquots
stored below -20°C. *ECGS: reconstituted in 20 ml EBM to make 5 mg/ml solution; 10 ml aliquots stored
below -20°C.
5.2.4 Co-culture assays (endothelial cells and PBMC)
Culture medium used for assays was RPMI 1640 (Sigma R0883) supplemented with
2mM L-glutamine (Sigma G7513), 100 units/ml penicillin, 0.1 mg/ml streptomycin (Sigma
P0781) and 1x non-essential amino acids (100x stock, Gibco 11140). Peripheral blood
collection from healthy donors and isolation of PBMC was as described in General Methods.
TGN1412 and controls were incubated with 125,000 PBMC/well in 300 µl culture medium
containing 2% hi-hAB serum, over monolayers of endothelial cells seeded at 15,000 – 30,000
cells/well the previous day in 100 µl of culture medium containing 10-15% hi-hAB serum (all
“spent” medium was aspirated prior to addition of PBMC), in 96-well polystyrene, tissue-
Page 129
Page 129 of 286
culture treated, flat bottomed microtitre plates (Nunc 167008). Usually, cell-conditioned
medium was harvested after 24 h, which was extended to 48 h when IFNγ was to be measured.
Cell-conditioned medium was assayed using cytokine-specific ELISAs for some or all of the
following: TNF , IL-2, IL-6, IL-8 and IFNγ, as described in General Methods. Standard curves
for each cytokine were prepared in culture medium containing 2% hi-hAB serum. Where
relevant, cell proliferative responses of remaining cells were quantified by measuring 3H-
thymidine incorporation, as described in General Methods, added to wells in culture medium
containing 2% hi-hAB serum.
The previous paragraph describes the procedure for typical co-culture assays. However,
any deviations from this procedure in an attempt to optimise the assay are described in the
figures presenting the results. These deviations included substitution of hi-hAB serum with hi-
FCS in the final culture medium, changes to the percentage hi-hAB serum in the final culture
medium (2, 10 or 15%), and changes to endothelial cell and/or PBMC cell density seeded in the
wells (30,000 or 60,000 endothelial cells and 125,000 or 200,000 PBMC per well). Where
deviations from the typical procedure were made, cytokine standard curves for ELISAs were
prepared in the same culture medium used for the co-culture assay, for example, if 10% hi-hAB
serum was used in the co-culture assay, cytokine standard curves were prepared in culture
medium containing 10% hi-hAB serum. Similarly, when cell proliferative responses were
measured, 3H-thymidine was added in the same supplemented culture medium used for the co-
culture assay.
Positive controls used include bacterial endotoxin (WHO IS 94/580 from NIBSC) which
stimulated IL-6 release from both endothelial cells and PBMC and the mitogenic plant-derived
lectin phytohaemagglutinin, PHA (Sigma). PHA in solution can activate polyclonal T cells in
the absence of MHC/antigen complexes and co-stimulatory molecules. It cross-links and
clusters TCRs resulting in the production a various cytokines including TNFα, IL-2, IL-6, IL-8,
and IFNγ. Other controls were an isotype-matched (to TGN1412) negative control, culture
medium only, and omitting the cell monolayer or omitting the PBMC.
Page 130
Page 130 of 286
5.2.5 Co-culture assays (endothelial cells and diluted whole blood)
Human whole blood was collected from consenting donors as described in section 2.2.
Co-culture assays using whole blood were conducted as described for PBMC in section 5.2.4
with TGN1412 and controls incubated with 20% whole blood in 300 µl sterile PBS B over a
monolayer of HUVECjr2 for 24 h. Cell-conditioned medium was assayed using cytokine-
specific ELISAs as described in General Methods.
5.2.6 Statistical analyses
Unless otherwise stated in the results section, significant differences between data sets
were established using Wilcoxon’s paired signed rank test.
5.3 Results
5.3.1 The effect of co-culturing PBMC over a monolayer of C-HUVEC on TNF , IL-2,
IL-6, IL-8 and cell proliferative responses to TGN1412
Figure 25 shows that TNF , IL-6, IL-8, IL-2 and cell proliferative responses to TGN1412
incubated in aqueous phase for 16 – 24 h with C-HUVEC or PBMC alone were very small and
were not notably different from responses to the isotype-matched negative control. In contrast,
TNF , IL-6, IL-8, IL-2 and cell proliferative responses to TGN1412 incubated in aqueous phase
for 16 – 24 h with PBMC cultured over a monolayer of C-HUVEC were significantly larger
than responses to the isotype-matched negative control (p<0.005 when comparing responses to
TGN1412 at 1 µg/well with responses to the isotype-matched negative control at 1 µg/well).
Values for responses of cells in co-culture to 1 µg/well TGN1412 were 415 ± 76 pg/ml TNF ,
5510 ± 910 pg/ml IL-6, 30,423 ± 2573 pg/ml IL-8 and 204 ± 26 pg/ml IL-2, values are means ±
S.E.M of 10 donors of PBMC and 4 donors of umbilical cords from 4 independent experiments
consisting of the following: 1st cord + PBMC from 2 donors (experiment 1), 2
nd cord + PBMC
Page 131
Page 131 of 286
from 4 donors (experiment 2), 3rd
cord + PBMC from 2 donors (experiment 3) and 4th cord +
PBMC from 2 donors (experiment 4).
Figure 25. The effect of co-culturing PBMC over a monolayer of C-HUVEC on TNF , IL-6, IL-8, IL-2
and cell proliferative responses to TGN1412. TGN1412 at doses 0.1, 1 and 10 µg/well, an isotype-
matched negative control (IC) at 1 µg/well and culture medium alone (CM) were incubated for 16 - 24 h
in aqueous phase with either C-HUVEC i.e. freshly isolated from umbilical cords (black) or with PBMC
(grey) or with PBMC co-cultured over a monolayer of C-HUVEC (white). Cell-proliferative responses
were measured in wells containing PBMC alone and PBMC co-cultured with C-HUVEC. Values for the
cytokine and cell proliferative responses are means ± S.E.M of 10 donors of PBMC and 4 donors of
umbilical cords from 4 independent experiments.
5.3.2 The effect of co-culturing PBMC over a monolayer of HUVECyn on TNF , IL-6
and IL-8 responses to TGN1412
Figure 26 shows that TNF , IL-6 and IL-8 responses to TGN1412 at doses of 0.1, 1 and
10 µg/well were only marginally larger than responses to the isotype-matched negative control
at 1 µg/well when incubated for 24 h with PBMC cultured over a monolayer of HUVECyn
endothelial cells suggesting that these endothelial cells were poor at mediating TGN1412-
Page 132
Page 132 of 286
stimulated responses in co-culture assays. A repeat of the experiment with an additional 4
donors of PBMC gave a similar pattern of results.
Figure 26. The effect of co-culturing PBMC over a monolayer of human umbilical vein endothelial cells
(HUVECyn) on TNF , IL-6 and IL-8 responses to TGN1412. Cytokine responses of co-cultured cells
(PBMC and HUVECyn) to TGN1412 and an isotype-matched negative control (IC) at 1 µg/well after a
24 h incubation period. Values for cytokine release (pg/ml) are means ± S.E.M of 4 donors of PBMC
from 1 independent experiment but are representative are results from 2 independent experiments, each
with 4 different donors of PBMC.
5.3.3 Comparison of the capability of primary endothelial cells (C-HUVEC) with
endothelium derived cells (HUVECjr2) to mediate TGN1412-induced cytokine and
cell proliferative responses in co-culture assays with PBMC.
Figure 27A shows that aqueous TGN1412 stimulated dose-related release of TNF , IL-6,
IL-8, IFNγ, IL-2 and cell proliferative responses when incubated for 48 h with PBMC cultured
over a monolayer of either C-HUVEC or HUVECjr2. Under the same experimental conditions,
cytokine and cell proliferative responses to an isotype-matched negative control, after baseline
correction, were smaller than responses to the smallest dose of TGN1412 tested. For both C-
Page 133
Page 133 of 286
HUVEC and HUVECjr2, the smallest dose of TGN1412 tested (0.04 µg/well, equivalent to 0.13
µg/ml) stimulated cytokine responses for all cytokines measured and cell proliferative
responses, and 1 µg/well TGN1412 (equivalent to 3.3 µg/ml) stimulated the largest cytokine
responses (for all cytokines measured) and the largest cell proliferative responses. TGN1412
stimulated larger TNF , IL-2 and cell proliferative responses in co-culture assays using
HUVECjr2 as the monolayer. In contrast, IL-6, IL-8 and IFNγ responses to TGN1412 were
larger when C-HUVEC were used as the monolayer. Larger concentrations of background IL-6
and IL-8 were measured in co-culture assays where C-HUVEC were used instead of HUVECjr2
(Figure 27B), however this did not contribute to the larger IL-6 and IL-8 responses to TGN1412
in co-cultures using C-HUVEC because data for these assays were baseline corrected.
Page 134
Page 134 of 286
Cytokine JR2s
(pg/ml)
C-HUVECs
(pg/ml)
TNFα 92 ± 38 83 ± 17
IL-6 132 ± 26 522 ± 107
IL-8 2615 ± 743 5429 ± 1095
IFNγ 8 ± 4 13 ± 4
IL-2 3 ± 1 6 ± 3
Figure 27. Comparison of human umbilical vein endothelial cells of different origins on their capability to
interact with PBMCs to support cytokine and cell proliferative responses to aqueous TGN1412 when
incubated with human PBMC. TNF , IL-6, IL-8, IFNγ, IL-2 and cell proliferative responses to TGN1412
(panel A) at 0.04 – 10 µg/well and supplemented culture medium alone (panel B) incubated for 48 h with
PBMC cultured over a monolayer of endothelial cells from fresh human umbilical vein (C-HUVEC) or
endothelium derived cells (HUVECjr2, denoted as JR2). Values for cytokine and cell proliferative
responses are means ± S.E.M of 11-16 and 22-28 donations of PBMC (from 15 different donors) for the
HUVECjr2 and C-HUVEC data respectively and 5 different umbilical cords for values for C-HUVEC,
from 4 independent experiments.
A.
B.
Page 135
Page 135 of 286
Isolated C-HUVEC and HUVECjr2 were cultured under exactly the same conditions
when maintained between assays as described in Methods for this chapter. Figure 28 shows
their appearance to be very similar in culture flasks despite C-HUVEC being more confluent.
Figure 28. Typical appearance of C-HUVEC and HUVECjr2 cultured in 75 cm2 flasks in EGM-2 culture
medium containing 2% FCS. Viewed under phase contrast microscopy at 100x magnification.
Although caution must be exercised when comparing in vivo and in vitro cytokine
concentrations, Table 6 shows that TGN1412 stimulated smaller concentrations of TNF , IL-2
and IFNγ release after 24 – 48 h incubations in co-culture assays compared with peak
concentrations measured in the blood of the clinical trial volunteers; in contrast, IL-6 and IL-8
concentrations in co-culture assays were broadly comparable with those measured in vivo. Of
course, responses varied from one trial volunteer to the next but it was not possible from the
information given (Suntharalingam et al., 2006) to estimate the individual values for all six
recipients in the trial. The data in Table 6 summarises as far as is practicable the magnitude of
responses to TGN1412 obtained in vivo and in vitro.
C-HUVEC HUVECjr2
Page 136
Page 136 of 286
Table 6. Comparison of peak cytokine responses (pg/ml) to TGN1412 in vivo (Suntharalingam et al.,
2006) and of cells in co-culture assays (PBMC with either C-HUVEC or HUVECjr2).
Cytokine In vivo peak responses*
(medians for 6 patients)
Co-culture
C-HUVEC HUVECjr2
24 h*1 48 h*
2 48 h*
2
TNF 4676 415 ± 76 618 ± 91 1121 ± 242
IL-6 3400 5510 ± 910 7379 ± 985 1754 ± 259
IL-8 ≥5000 30423 ± 2573 43018 ± 3918 18911 ± 3382
IL-2 4200 204 ± 26 91 ± 22 144 ± 52
IFNγ ≥5000 ND 164 ± 35 156 ± 49
* Peak responses were at 4 h post infusion of TGN1412. *1
Values are from Figure 25. *2
Values are
from Figure 27. ND = Not Determined.
5.3.4 The effect of co-culturing human whole blood over a monolayer of HUVECjr2 on
TNF , IL-6 and IL-8 responses to TGN1412
TNF , IL-6 and IL-8 responses to aqueous TGN1412 (0.1, 1 and 10 µg/well) and the
isotype-matched negative control (1 µg/well) incubated for 24 h with 20% human whole blood
over a monolayer of HUVECjr2 were all below 7 pg/ml. Cytokine responses to 2.5 IU (250
pg)/ml endotoxin (positive control) were: 428 ± 113 pg/ml TNF , 4210 ± 21 pg/ml IL-6 and
809 ± 192 pg/ml IL-8, values are means ± S.E.M of 2 donors of blood.
5.3.5 The effect of different serum/plasma supplements on cytokine and cell proliferative
responses to TGN1412 in co-culture assays
Figure 29 shows that in culture medium supplemented with hi-hAB serum, TGN1412
stimulated TNF , IL-6, IL-2 and cell proliferative responses which were significantly larger
than those stimulated by the isotype-matched negative control when incubated for 48 h with
125,000 PBMC/well cultured over a monolayer of 30,000/well HUVECjr2 (p<0.05 when
Page 137
Page 137 of 286
comparing responses to 1 µg/well TGN1412 with responses to 1 µg/well negative control). In
contrast, under the same experimental conditions but using hi-FCS as the culture medium
supplement, cytokine and cell proliferative responses to TGN1412 were very small and not
much different from responses to the negative control. Despite the lack of cytokine and cell
proliferative responses to TGN1412 in media containing hi-FCS, responses to PHA (positive
control) were marked in both FCS and hAB serum supplemented medium. Values shown in
Figure 29 are means of responses of 7 donors from 2 independent experiments. Different
batches of hi-FCS were used for each experiment and so the absence of responses to TGN1412
when hi-FCS was unlikely to have been attributable to a poor batch of serum.
Figure 29. Comparison of cytokine responses to TGN1412 in co-culture assays using either hi-FCS or hi-
hAB serum as the supplement. TNF , IL-6, IL-2 and cell proliferative responses to TGN1412, an
isotype-matched negative control (IC) at 1 µg/well, supplemented culture medium alone (CM) and PHA
at 10 µg/ml incubated for 48 h with 125,000 PBMC cultured over a monolayer of 30,000 HUVECjr2 in
300 µl culture medium supplemented with either 2% FCS or 2% hAB serum. Values for cytokine and cell
proliferative responses are means ± S.E.M of 7 donors of PBMC from 2 independent experiments.
Page 138
Page 138 of 286
Usually, cytokine values for responses to TGN1412 were read off cytokine ELISA
standard curves where the standard was diluted in the same culture medium used for the cell
culture and containing the same percentage of plasma/serum. The values in Figure 29 were read
off cytokine ELISA standard curves where the standard was diluted in culture medium (as for
the cell culture) but containing 2% hAB serum. A comparison of OD values given for cytokine
ELISA standard curves prepared in culture medium containing hi-FCS or hi-hAB serum (2%)
showed that the type of serum did not affect the concentration of cytokine measured by ELISA
(as shown in Figure 30).
Figure 30. Effects of different types of sera on the detection of TNFα, IL-6 and IL-2 by ELISA. Standard
curves of each cytokine were diluted in culture medium containing either hi-FCS or hi-hAB serum (2%)
and cytokine concentrations for each curve were measured in terms of optical density (OD) by ELISA.
5.3.6 The effect of cell density on cytokine responses to TGN1412 in co-culture assays
Figure 31 shows that TNF , IL-6 and IL-2 responses to TGN1412 (0.1, 1 and 10 µg/well)
incubated for 24 h with PBMC (at cell densities 125,000 and 200,000 cells/well) cultured over a
monolayer of HUVECjr2 (at cell densities 30,000 and 60,000 cells/well) in medium containing
either 2 or 10% hi-hAB serum were marked and were larger than responses to the isotype-
matched negative control. However, although there were marginal differences between
responses for different cell density combinations of PBMC and HUVECjr2 (for cultures in both
2 and 10% hi-hAB serum), none of the combinations gave responses for any of the cytokines
which were > 2x responses given by any other combination of cell densities.
Page 139
Page 139 of 286
Figure 31. Comparison of TNF , IL-6 and IL-2 responses to TGN1412 in 24 h co-culture assays using
different PBMC and HUVECjr2 (JR2s) cell densities in 2% and 10% hi-hAB serum. From left to right for
each experimental condition, responses are to TGN1412 at doses 0.1, 1 and 10 µg/well and an isotype-
matched negative control at 1 µg/well. Values are means ± S.E.M of baseline corrected responses from 4
donors of PBMC.
Page 140
Page 140 of 286
5.3.7 The effect of human AB serum concentration on cytokine responses to TGN1412 in
co-culture experiments
Figure 32 shows that TNF , IL-6 and IL-2 responses to TGN1412 (1 µg/well) incubated
for 24 h with 125,000 PBMC cultured over a monolayer of 30,000 HUVECjr2 in medium
containing either 2, 10 or 15% hi-hAB serum were marked and were larger than responses to the
isotype-matched negative control. Despite there being no significant statistical difference
between responses to TGN1412 in 2, 10 and 15% hi-hAB serum for any of the cytokines
measured (p>0.05, Kruskal-Wallis test with Dunn’s Multiple Comparisons procedure), TNF
and IL-2 responses were largest in medium containing 2% hi-hAB serum and smallest in
medium containing 15% hi-hAB serum. In contrast, IL-6 responses were largest in medium
containing higher concentrations of hi-hAB serum (10-15%) and smallest in medium containing
2% hi-hAB serum. However, for all three cytokines, the largest shift in response caused by
changing the serum concentration was no more than 100%. The concentration of hi-hAB serum
used had very little effect on background levels of cytokines in co-culture assays, i.e. cells
incubated in supplemented culture medium only.
Figure 32. Comparison of TNF , IL-6 and IL-2 responses to TGN1412 in co-culture assays using
different concentrations hi-hAB serum. Cytokine responses to 1 µg/well TGN1412, 1 µg/well isotype-
matched negative control (IC) and to culture medium alone (CM) when incubated with 125,000 PBMC
and 30,000 HUVECjr2 for 24 h in 2, 10 or 15% hi-hAB serum. Values are means ± S.E.M of 8 donors of
PBMC from 2 independent experiments.
Page 141
Page 141 of 286
The values in Figure 32 were read off standard curves diluted in culture medium (as for
the cell culture) but containing only 2% hi-hAB serum. However, a comparison of OD values
given for cytokine standard curves prepared in culture medium containing either 2 or 15% hi-
hAB serum showed that the concentration of hi-hAB serum used did affect the concentration of
cytokine measured by ELISA (as shown in Figure 33)
Figure 33. Effects of different human AB serum concentrations on the detection of TNF , IL-6 and IL-2
by ELISA. Standard curves for each cytokine were diluted in culture medium containing either 2 or 15%
hi-hAB serum and cytokine concentrations for each curve were measured in terms of optical density (OD)
by ELISA.
5.3.8 The effect of co-culturing PBMC over a monolayer of Human Saphenous Vein
Endothelial Cells (HSVECs) on TNF , IL-6 and IL-8 responses to TGN1412
Figure 34A shows that TNF , IL-6 and IL-8 responses to TGN1412 incubated in aqueous
phase with PBMC cultured over a monolayer of human saphenous vein endothelial cells for 24
h were marked. Cytokine responses to TGN1412 were not notably different from responses to
an isotype-matched negative control antibody. Values for responses of cells in co-culture to 1
µg/well TGN1412 were 2601 ± 316 pg/ml TNFα, 108,310 ± 7129 pg/ml IL-6 and 159,123 ±
23,880 pg/ml IL-8. Values are means and S.E.M of 8 donors of PBMC and 1 donor of HSVECs
from 2 independent experiments. Figure 34B shows that concentrations of cytokines release by
either HSVECs alone or PBMC alone incubated with TGN1412 or supplemented culture
medium were small in comparison with the concentrations measured when these cells were
Page 142
Page 142 of 286
cultured together with TGN1412 or supplemented culture medium which suggests that the large
responses of cells in co-culture were not a result of contamination.
Figure 34. The effect of co-culturing PBMC over a monolayer of human saphenous vein endothelial cells
(HSVECs) on TNF , IL-6 and IL-8 responses to TGN1412. Panel A: cytokine responses of co-cultured
cells (PBMC and HSVECs) to TGN1412, an isotype-matched negative control (IC) at 1 µg/well,
supplemented culture medium alone (CM) and endotoxin (ET) at 2.5 IU (250 pg)/ml after a 24 h
incubation period. Panel B: cytokine release (pg/ml) by HSVECs or PBMC alone incubated with aqueous
TGN1412 (1 µg/well) or in supplemented culture medium alone. Values for cytokine release (pg/ml) are
means ± S.E.M of 8 donors of PBMC and 1 donor of HSVECs from 2 independent experiments.
5.4 Discussion
Despite the fact that immobilised (to plastic) TGN1412 stimulated profound cytokine
release when incubated with human PBMC (Chapter 4), there is no in vivo analogue of a plastic
surface and so antibody immobilisation methods can justifiably be criticised for not being
Page 143
Page 143 of 286
physiologically relevant. It is very likely that cells, other than lymphocytes, are involved in
responses stimulated by TGN1412, such as other cells known to be involved in immunological
responses such as vascular endothelial cells.
An obvious method to try in the first instance was to incubate TGN1412 (in aqueous
phase) with PBMC cultured over a monolayer of endothelial cells. Endothelial cells derived
from human umbilical vein (HUVEC) were chosen because they are the usual ‘‘fresh’’ cell of
choice for studies of human endothelium (Marin et al., 2001). The reason for this is that despite
the considerable difficulties that are frequently encountered in obtaining fresh umbilical cords,
umbilical veins remain the easiest “fresh” human tissue to source. Initially, freshly isolated
endothelial cells from donated human umbilical veins (not subject to cryogenic storage) were
used (called C-HUVEC in this study) rather than a commercially available cell line since, for
the latter, the expression of functionally relevant molecules can be altered by cryogenic storage
and continuous passaging. In this “proof of principle” experiment, TGN1412 in aqueous phase
was unable to stimulate significant cytokine and cell proliferative responses when incubated
with either PBMC or C-HUVEC alone. Only when C-HUVEC and PBMC were co-cultured
could TGN1412 stimulate notable responses and did so for all readouts (TNF , IL-6, IL-8, IL-2
and cell proliferation) chosen as a representative panel of cytokines stimulated by TGN1412
during its “first time in man” clinical trial (Suntharalingam et al., 2006). Under the same
experimental conditions, background cytokine/cell proliferation levels of cells co-cultured in the
absence of TGN1412 or to an isotype-matched negative control antibody were negligible.
Given the difficulties in sourcing fresh umbilical cords, their intrinsic variability and the
requirement for medicines control testing of readily available endothelial cells, it was important
to identify and validate a source of such cells that were able to mediate responses to TGN1412
in a manner similar to C-HUVEC in co-culture experiments with PBMC. Since TNF , IL-6 and
IL-8 responses to TGN1412 incubated with PBMC cultured over a monolayer of HUVECyn
cells were only marginally above responses to the isotype-matched negative control, a decision
was made not to pursue experiments with these endothelial cells. Repeated passaging, culture in
sub-optimal conditions and cryogenic storage of these cells may have altered the expression of
molecules relevant to mediating TGN1412 responses. Another source of human umbilical vein
Page 144
Page 144 of 286
endothelial cells, HUVECjr2, readily available at NIBSC, was investigated. Preliminary
experiments carried-out as part of this study showed potential for these endothelial cells for use
in co-culture assays to predict the toxicity of TGN1412 as responses to TGN1412 were
significantly above those to the isotype-matched negative control (Stebbings et al., 2007). To
establish a true “likeness” of HUVECjr2 to non-cryogenically preserved umbilical vein
endothelial cells (C-HUVEC), a range of TGN1412-stimulated responses was compared for
both cell types: this included TNF , IL-6, IL-8, IL-2, IFNγ and cell proliferative responses
(Suntharalingam et al., 2006). A direct comparison between C-HUVEC and HUVECjr2 when
used as monolayers in co-culture experiments with the same donors of PBMC revealed that
HUVECjr2 were clearly capable of mediating responses (for all readouts) to TGN1412 above
those to the isotype-matched negative control antibody. Furthermore, the pattern of responses
mediated by HUVECjr2 and C-HUVEC was very similar. The smallest dose of TGN1412 tested
(0.04 µg/well) stimulated responses (for all readouts) above background levels when both C-
HUVEC and HUVECjr2 were used. In addition, the same dose of TGN1412 (1 µg/well)
stimulated the largest responses (for all readouts) when either C-HUVEC and HUVECjr2 were
used. It should be noted that 1 µg/well/300 µl is equal to 3.3 µg/ml which is close to our best
estimate of the in vitro equivalent (2 µg/ml) of the dose of TGN1412 given to the trial
volunteers (0.1 mg/kg) as described in section 3.2.1. Therefore, this co-culture method,
regardless of whether HUVECjr2 or C-HUVEC were used, was capable of detecting the toxicity
of TGN1412 at physiologically relevant doses. Based upon the in vitro data presented here, the
trial volunteers were given a dose that was very close to the maximum stimulatory dose based
on data from co-culture experiments.
The appearance of HUVECjr2 in culture flasks was very similar to that of C-HUVEC.
Confirmation that HUVECjr2 had not lost their endothelial phenotype came from a more
comprehensive study conducted with the aim of correlating endothelial phenotype with the
capability to mediate TGN1412-stimulated responses in co-culture assays. C-HUVEC isolated
from umbilical cords for experiments conducted in this thesis and HUVECjr2 both expressed
inducible endothelial markers ICAM-1, VCAM-1 and E-selectin and constitutive endothelial
Page 145
Page 145 of 286
markers von Willebrand factor (vWF) and CD31 and both C-HUVEC and HUVECjr2 were able
to bind Ulex europeus lectin (Findlay et al., 2011).
These findings taken together led to the conclusion that HUVECjr2 were “fit for purpose”
as an alternative monolayer to C-HUVEC in co-culture experiments with human PBMC, for
predicting the toxic effects of TGN1412. This, however, was a somewhat surprising result since
the single working cell bank of HUVECjr2 used for experiments in this study was expanded
from the same original batch of cells (i.e. batch ZHC-2101 from TCS Biologicals) as for
HUVECyn which, as discussed earlier, were poor mediators of TGN1412-stimulated responses
in co-culture assays. Single working cell banks for HUVECjr2 and HUVECyn were produced
by two different laboratories using different culture conditions. This emphasises the importance
of optimal culture conditions in maintaining endothelial cell phenotype and preventing cell de-
differentiation. Other studies have suggested that the tissue-specific phenotype of endothelial
cells is dependent on the microenvironment of the tissue and that such cells rapidly undergo de-
differentiation in vitro (Thum et al., 2000; Lacorre et al., 2004).
There were some obvious differences between responses to TGN1412 when co-cultured
with either HUVECjr2 or C-HUVEC. IL-6 and IL-8 responses to TGN1412 were larger when
C-HUVEC were used as the monolayer; in contrast, TNF , IL-2 and cell proliferative responses
were larger when HUVECjr2 were used as the monolayer. Some of these differences are
investigated further in the next chapter.
TNF , IL-8, IL-2 and IFNγ (but not IL-6) median cytokine concentrations in the blood of
the trial volunteers reduced considerably towards normal concentrations 24 h post infusion of
TGN1412 (Suntharalingam et al., 2006). In vitro cytokines accumulate in the cell-conditioned
medium; therefore in vitro one would have expected to find at least similar if not larger
concentrations unless, of course, cytokines were metabolised by the cells.
Although caution must be exercised when comparing in vivo and in vitro cytokine
concentrations, Table 6 shows that concentrations of TNF , IL-2 and IFNγ (but not
concentrations of IL-6 and IL-8) stimulated by TGN1412 in 24 - 48 h co-culture experiments
were smaller than peak concentrations measured in the blood of the trial volunteers.
Furthermore, TNF responses in co-culture experiments were smaller than those stimulated by
Page 146
Page 146 of 286
immobilised TGN1412 (Chapter 4). In addition, IL-2, TNFα and IFNγ concentrations
stimulated in co-culture assays here were considerably smaller than reported levels stimulated
by immobilised TGN1412 (Eastwood et al., 2010). With the aim of optimising the co-culture
assay, experiments were conducted to determine the effects of substituting PBMC with whole
blood, substituting umbilical vein endothelial cells with saphenous vein endothelial cells, and
altering serum type/concentration and cell density on the assay’s capability of predicting
TGN1412-stimulated cytokine responses. This was to determine whether or not the small
cytokine responses in the co-culture, relative to in vivo responses, could be enhanced by changes
in the experimental conditions to more closely match in vivo responses.
Responses to TGN1412 when whole blood was substituted for PBMC in 24 h co-culture
experiments using HUVECjr2 as the monolayer were not above background levels suggesting
that the presence of a factor or factors in blood that inhibit(s) responses. Since whole blood
could be argued to be the most physiologically relevant source of white blood cells, this result
was somewhat unexpected. That said, it is likely that due to the lack of flow conditions in vitro,
the erythrocytes, being the most dense and abundant cells in blood, would have settled under
gravity onto the endothelial cells prior to the leukocytes. This would have prevented cell to cell
contact between leukocytes and endothelial cells. This supports the notion that cell to cell
contact between leukocytes and endothelial cells is necessary for TGN1412-stimulation of
cytokine responses in co-culture assays. This notion is investigated further in Chapter 6.
Originally, human serum was chosen rather than bovine serum (FCS) as it was considered
to more closely mimic the in vivo situation, i.e. that of the trial volunteers. However, FCS is
richer in growth factors and, for this reason, is frequently used in cell culture assays. The use of
FCS rather than hAB serum in 48 h co-culture assays using 125,000 PBMC and 30,000
HUVECjr2 per well did not increase cytokine responses, in fact, quite the contrary as responses
were no different from those stimulated by the isotype-matched control. This was not likely to
have been an FCS batch-specific phenomenon since the same result was found in two
independent experiments (each with 4 different donors of PBMC), each using a different batch
of FCS. It is not clear whether or not FCS lacks something that hAB serum contains or if FCS
itself is inhibitory. Endothelial cells were incubated in wells in 10% FCS (or hAB serum) prior
Page 147
Page 147 of 286
to the day on which TGN1412 and PBMC were added and media was exchanged for that
containing 2% FCS (or hAB serum). HUVECjr2 were maintained in flasks in 2% FCS so 10%
FCS may have been toxic and could have rendered these cells incapable of eliciting responses to
TGN1412. In contrast, human AB serum at 10% was likely to have been less toxic because it
was less rich in growth factors, not being of foetal origin. It is unlikely, however, that 10% FCS
was toxic to HUVECjr2 since C-HUVEC were maintained in 10% FCS for several days
immediately after isolation from umbilical cord and thrived in this concentration of FCS
(personal observation). The reason for the absence of TGN1412-stimulated responses in media
supplemented with FCS could be related to the finding that bovine transferrin binds human cells
with a much lower affinity than human transferrin (Young and Garner, 1990). Usually, iron-
bound transferrin binds to transferrin receptor at the surface of the cell where it is internalised.
Iron is subsequently separated from transferrin and the transferrin receptor-transferrin complex
is recycled back to the membrane. In addition to its role in iron uptake, it has been suggested
that membrane bound transferrin receptor redistributes in the immunological synapse,
specifically in the pSMAC formed upon T cell stimulation with CD3 and CD28 antibodies
(Batista et al., 2004). A deficiency in transferrin (i.e. when FCS is used) may affect the level of
membrane-associated transferrin receptor which could interfere with synapse formation and
responses to TGN1412. FCS has been used as a media supplement for other experiments in
which TGN1412 was able to stimulate T cell responses (Eastwood et al., 2010), however this
involved TGN1412 immobilisation and so the mechanism for T cell stimulation is likely to have
been different to that in co-culture assays.
Increasing the density of PBMC or endothelial cells in the wells did not notably affect
cytokine responses to TGN1412 when 2 or 10% hAB serum was used in 24 h co-culture
experiments. It is possible that higher cell densities than those used are required to significantly
affect cytokine responses, however if this assay is to be used as a routine assay for testing the
safety of medicines, it is important to maintain practical limits and while culturing larger
numbers of endothelial cells would not pose a problem, obtaining enough PBMC from blood
donors may be more of a challenge. An alternative to fresh PBMC might be a mixture of cell
lines.
Page 148
Page 148 of 286
When TGN1412 was incubated for 24 h in co-culture assays of 125,000 PBMC and
30,000 endothelial cells, the inclusion of 2% hAB serum was associated with larger IL-2 and
TNF responses than 10 – 15% hAB, in contrast, 10 - 15% hAB serum was associated with
larger IL-6 responses than 2% hAB serum. The reason for this is unclear, however, it was not
due to the presence of IL-6 in the serum since IL-6 responses in culture medium alone (i.e. in
the absence of TGN1412) were no different when 10 or 15% hi-hAB serum was used. In
addition, optical density values for IL-6 standard curves prepared in culture medium containing
either 2% or 15% hi-hAB serum were no different when assayed by ELISA. The maximum
effect of increasing or decreasing the concentration of hAB serum was a halving or doubling in
the cytokine responses to TGN1412. This was surprising since it was expected that soluble
factors such as growth hormones required for the maintenance of cell cultures and other soluble
factors that may mediate responses to TGN1412 would be limited in culture medium containing
only 2% hAB serum. Although HUVEC are generally cultured in only 2% FCS, FCS is far
richer in growth factors than hAB serum. Since a majority of the readouts measured were larger
in 2% rather than 10 - 15% hAB serum, 2% hAB serum was chosen for all further experiments
as it is not practicable to set up cultures containing different concentrations of hAB serum for
each cytokine tested.
Based upon the data presented above, the co-culture assay of TGN1412 appears robust
since variations in cell numbers and/or serum concentrations through uncertainty of
measurement or operator error would not drastically affect the outcome; however, this cannot be
assumed to be the case for other medicines. Although not an exhaustive analysis of
experimental parameters that could affect cytokine responses to TGN1412, the above
experiments do examine the most obvious assay variables. One other obvious condition was to
use donors’ own plasma (collected during the isolation of PBMC from blood) in co-culture
assays. However, practically, this would be challenging because donor plasma would need to be
separated from blood prior to incubating the HUVEC overnight so that this plasma could be
used as the supplement in the HUVEC culture medium. Therefore, PBMC isolated from blood
at the same time as the plasma would have to be incubated overnight prior to their addition to
the HUVEC. An overnight incubation of the PBMC may have implications as cells may stick to
Page 149
Page 149 of 286
the vessel in which they are incubated. In addition, cytokine concentrations stimulated by
TGN1412 in co-culture assays were broadly similar for 24 h and 48 h incubations and so the
assay is flexible; a desired characteristic of a method intended for routine use. These
optimisation experiments have confirmed that none of the examined conditions give
significantly larger cytokine responses than the conditions that were chosen originally, i.e.
125,000 PBMC and 30,000 endothelial cells per well in 2% hAB serum.
Umbilical vein derived endothelial cells were initially selected as the cells to form the
monolayer in the co-culture assay for the reasons discussed above. However, endothelial cells
involved in responses stimulated by TGN1412 in the clinical trial obviously were not of
umbilical origin. Therefore, endothelial cells from saphenous vein (HSVEC) were also
evaluated for their use in co-culture assays as these were more physiologically relevant than
HUVEC. Although it was not possible to procure fresh saphenous vein tissue, HSVEC
cryogenically frozen at low passage (2) following isolation from saphenous vein were available
as a gift from the Department of Medicine, Imperial College London. When human saphenous
vein endothelial cells (HSVECs) were co-cultured with PBMC for 24 h, TGN1412 did not
stimulate TNF , IL-6 and IL-8 responses significantly above responses to the isotype-matched
negative control. However, this may have been because background concentrations of all three
cytokines were so large, simply as a result of culturing PBMC and HSVECs together (in the
absence of TGN1412).
The fact that none of the conditions described above dramatically increased TNF and
IL-2 cytokine responses to TGN1412 in 24 - 48 h co-culture assays, stimulated further thought
as to why cytokine concentrations were small compared with responses to immobilised
TGN1412 and with peak concentrations in the blood of the trial volunteers. One possibility was
that after a 24 - 48 h incubation of cells in co-culture with TGN1412, the concentration of IL-2
in the cell-conditioned medium was reduced as it was internalized by T cells. It has been
reported that interaction of IL-2 with high-affinity IL-2 receptors on the surface of T cells leads
to receptor-mediated internalization and activation of T cell proliferation, thus IL-2 is removed
from the extracellular environment (Subtil et al., 1994). In TGN1412 immobilisation assays,
greater cytokine release could have resulted in their accumulation in the cell-conditioned
Page 150
Page 150 of 286
medium if saturating levels were achieved. The IL-2 concentrations were reduced by half in cell
conditioned medium from 48 h co-culture assays compared with those of 24 h assays (with the
caveat that this was not a direct comparison within the same assay and so different donors of
PBMC were used). However, it is published that IL-2 concentrations, released by stimulated
lymphocytes into cell-conditioned medium, were maximal between 24 – 48 h (Gillis et al.,
1978) albeit under different experimental conditions. Another possibility is that IL-2 released
into the cell-conditioned medium may at least bind to IL-2 receptors expressed by endothelial
cells, if it is not internalised, so preventing its measurement by ELISA. However, only in one
report has it been shown that human umbilical vein endothelial cells possess IL-2 receptors
(Hicks et al., 1991).
IFNγ responses of PBMC to immobilised TGN1412 (in the absence of endothelial cells)
incubated for 24 h were small in comparison with peak IFNγ concentrations in the blood of the
TGN1412 trial volunteers. Only after 48 – 72 h stimulation with TGN1412 could higher
concentrations of IFNγ be measured. This incubation period was a requirement to allow
TGN1412-stimulated naive and central memory T cells (in PBMC) to mature into CD4+ effector
memory T cells, the subset responsible for producing TGN1412-stimulated IFNγ release and
which generally exist in very low numbers in peripheral blood. In vivo, of course, the IFNγ
response to TGN1412 was faster because CD4+
effector memory T cells are abundant in tissues
such as the lungs and gastrointestinal mucosa (Eastwood et al., 2010). It is for this reason that
TGN1412 was incubated for 48 h in co-culture experiments where IFNγ was to be a readout.
However, for unknown reasons, cytokine responses were still small in comparison with peak
cytokine concentrations in the blood of the trial volunteers. This finding could be indicative of a
lack of TGN1412-stimulated T cell maturation into effector memory T cells in co-culture
assays. Unpublished work at NIBSC has recently shown that much larger cytokine responses
are stimulated by TGN1412 in co-culture assays (involving HUVECjr2) when purified CD4+ T
cells were used instead of PBMC. Therefore, TGN1412, whether immobilised or incubated in
aqueous phase in co-culture assays, activates CD4+ T cells. However, it is possible that, when
immobilised, TGN1412 activated different CD4+ T cell subsets (i.e. naive and memory T cells)
Page 151
Page 151 of 286
compared with those stimulated in co-culture assays and that this affected the quantities of
cytokines released. This is discussed in more detail in Chapters 6 and 8.
It is not yet understood where exactly in the body TGN1412 initiated responses but what
is certain is that both TGN1412 and responding leukocytes would have come into contact with
endothelial cells. Since endothelial cells are considerably heterogeneic (Garlanda and Dejana,
1997), it is to be expected that endothelial cells from umbilical vein have a different phenotype
from endothelial cells located in vivo at sites where TGN1412 stimulated responses, and this
could be the basis for the smaller ‘sub-optimal’ concentrations of cytokines (compared with the
in vivo responses) measured in co-culture assays. In addition, in vivo, endothelial cells may act
in concert with other cell-types, such as fibroblasts, smooth muscle cells or specialist APCs
such as dendritic cells, to mediate TGN1412-stimulated responses.
Despite the gap in our understanding of the mechanisms underlying TGN1412-stimulated
responses in the co-culture assay, this co-culture method is one of only two published methods
available for predicting cytokine release to TGN1412 and if this assay had been used to test
TGN1412 prior to its clinical trial, it is highly unlikely that the trial would have gone ahead and
so is a more appropriate test procedure than the pre-clinical safety tests that were conducted.
The obvious question is, of course, what do endothelial cells contribute in PBMC assays in
which TGN1412 stimulates cytokine release without its prior immobilisation? This is
investigated in the next chapter.
Page 152
Page 152 of 286
CHAPTER 6:
Investigation of the
physiological mechanisms
underlying clinical
responses to TGN1412 using
co-culture
Page 153
Page 153 of 286
CHAPTER 6: Investigation of the mechanisms underlying responses to TGN1412 in co-
culture assays
6.1 Introduction
It is clear from the findings of the previous chapter that a method involving the co-culture
of human PBMC over a monolayer of human endothelial cells is better able to predict clinical
responses to aqueous TGN1412 than a method relying upon PBMC alone. Furthermore, the
inclusion of endothelial cells negates the requirement for immobilisation of TGN1412 to a
plastic surface, a procedure which has little physiological relevance. A number of possibilities
of how endothelial cells mediate (aqueous) TGN1412-stimulated responses in co-culture assays
are investigated in this chapter since this could give insight to the mechanisms underlying
clinical responses to this antibody. These possibilities are described in the following paragraphs.
In the study of transplant rejection, it is well established that endothelial cells play a
fundamental role in stimulating rejection of the transplant by the recipient. Since activation of
recipient CD4+ T cells (but not CD8+ T cells) is crucial to the rejection process, MHC class II
antigens expressed by endothelial cells, i.e. the MHC class recognised by CD4+ T cells, play an
important role in organ rejection (Rose, 1998). In vitro, IFNγ-induced allogeneic human
umbilical vein endothelial cells stimulated CD4+ T cell responses through an MHC class II
antigen-dependent mechanism (Page et al., 1994a; Rose, 1998). Allogeneic MHC/antigen
stimulation of recipient T cells can be through “direct” stimulation, differing from “indirect”
stimulation because it is the foreign MHC molecule itself that is the antigen and is recognised
by recipient TCRs. For direct stimulation, the “foreign” MHC molecule does not need to be
presented as part of the recipient’s MHC molecules expressed by recipient APCs (Rose, 1998).
Since CD4+ cells have been reported to be the predominant T cell subset responding to
immobilised TGN1412 (Stebbings et al., 2007) and are also stimulated by aqueous TGN1412 in
co-culture assays (unpublished data, NIBSC), it was conceivable that, in co-culture assays, the
direct stimulation of CD4+ T cell receptors by allogeneic MHC class II antigens expressed by
“foreign” endothelial cells played a role in mediating TGN1412-stimulated responses. For
Page 154
Page 154 of 286
example, TGN1412 may have provided a co-stimulatory signal following a primary signal given
through ligation of the TCR by foreign MHC class II expressed by endothelial cells (as
illustrated in Figure 35). If this had been the case, the use of co-culture assays for investigating
the underlying mechanisms of TGN1412-stimulation in vivo could be questioned because the
response stimulated could have been dependent on the fact that PBMC and endothelial cells
were from different donors. This scenario was clearly not the case when TGN1412 was given in
man. There is conflicting evidence in the literature regarding the expression of MHC class II
molecules by HUVEC. On the one hand, it has been reported that HUVEC do not constitutively
express MHC class II antigens in situ or in vitro (Rose, 1998) and, although expression is
induced by IFNγ (Collins et al., 1984), HUVEC are 10 – 100 times less sensitive to IFNγ than
microvascular endothelial cells regarding MHC class II upregulation (McDouall et al., 1997).
Since concentrations of IFNγ in cell-conditioned medium from PBMC/HUVEC co-culture
assays with culture medium alone (i.e. no TGN1412) after 48 h were negligible (see Figure
27B), it is unlikely that MHC class II expression was upregulated by IFNγ prior to T cell
activation by TGN1412, in which case allogeneic MHC class II expression was unlikely to have
been responsible for initial responses to TGN1412. On the other hand, in just one study, non-
treated HUVEC (i.e. without IFNγ treatment) incubated with allogeneic T cells induced T cell
proliferation in the absence of a mitogen or mAbs directed at the TCR/CD3 complex suggesting
that the presentation of alloantigens to T cells occurred (Adams et al., 1992). Furthermore,
MHC class II expression by endothelial cells may be induced by other means, for example,
allogeneic natural killer lymphocytes were able to upregulate MHC class II expression by
endothelial cells through a contact-dependent mechanism (Watson et al., 1995). In light of these
findings, the concept that endothelial cells mediate responses to aqueous TGN1412 in co-culture
assays because they are allogeneic was investigated.
It was established in Chapter 4 that the manner in which TGN1412 is presented to PBMC
is crucial to its capability to induce cytokine responses. It is a possibility that aqueous TGN1412
in co-culture assays is immobilised by endothelial cells, presenting the antibody in a similar
manner to that achieved by air-drying or wet-coating the antibody (Chapter 4). This concept is
illustrated in Figure 35. One possible mechanism for TGN1412 immobilisation is through
Page 155
Page 155 of 286
binding of its Fc with Fc receptors expressed on the surface of endothelial cells. Expression of
Fc receptors by endothelial cells in vitro has been reported (Bjerke et al., 1988; Pan et al., 1998;
Pan et al., 1999; Sandilands et al., 2010) and although Fc receptor expression is enhanced by the
cytokines TNF and IFNγ, low level constitutive expression of Fc receptor by endothelial cells
cultured in vitro, including HUVEC, has also been reported (Pan et al., 1998; Sandilands et al.,
2010). Indeed other cells such as monocytes and B lymphocytes within the PBMC fraction
express Fc receptors (Gergely et al., 1977; Maeda et al., 1996). Therefore, if immobilisation of
TGN1412 by Fc receptor was important, it would be expected that aqueous TGN1412 would
have stimulated responses from PBMC in the absence of endothelial cells, which was not found
to be the case. However, since endothelial cells in co-culture assays form a monolayer beneath
the PBMC, Fc receptors expressed by endothelial cells may have been better positioned than Fc
receptor expressed by PBMC to elicit TGN1412-stimulated responses. Consequently, the role of
TGN1412 immobilisation by endothelial cells in mediating TGN1412-stimulated responses in
co-culture assays was investigated.
Endothelial cells play a fundamental role in mediating inflammatory responses (Pober
and Sessa, 2007). The specific interaction of their cell surface adhesion molecules with ligands
expressed by immune cells mediates selective migration of immune cells across the endothelial
barrier, usually in post-capillary venules, into the infected tissue. A similar process occurs in the
high endothelial venules, specialised blood vessels which mediate the migration of lymphocytes
from the blood into lymph nodes (Faveeuw et al., 2000; Pittet and Mempel, 2008). Adhesion
molecules expressed by endothelial cells also regulate the circulation of lymphocytes through
tissues in the absence of infection by acting as tissue-specific “homing receptors” to which
lymphocytes adhere (Hamann et al., 1994). Some of the adhesion molecules expressed by
endothelial cells that mediate the migration of leukocytes across endothelial barriers are also
expressed by specialised APCs. Interaction of adhesion molecules expressed by APCs with their
ligands expressed by T cells mediates cell to cell adhesion and the formation of a stable
immunological synapse promoting T cell activation by the APC (as described in section 1.4.3).
In addition to their role in mediating cell to cell adhesion in the immunological synapse, there
Page 156
Page 156 of 286
have been numerous reports suggesting that adhesion molecules expressed by APCs also have a
co-stimulatory effect during T cell activation.
The first established receptor/ligand interaction mediating cell to cell adhesion was that of
LFA-3 with CD2 (Dustin et al., 1987). LFA-3 is a 222 amino-acid surface glycoprotein,
comprising extracellular, transmembrane and cytoplasmic domains, is expressed by specialised
APCs and endothelial cells (Wallner et al., 1987). Studies involving Jurkat cells (T lymphocyte
cell line) expressing CD2 and artificial membrane lipid bilayers expressing LFA-3 showed that
LFA-3/CD2 interactions not only promote cell to cell adhesion but also stimulate downstream
signalling processes in T cells in the absence of TCR ligation, although the presence of the TCR
was required for such events to occur. These signalling processes were the same as those that
follow TCR stimulation and which ultimately lead to increases in intracellular calcium levels
characteristic of T cell activation (Kaizuka et al., 2009). Similar results were found when anti-
CD2 antibodies were used to stimulate T cells (Kanner et al., 1992; Martelli et al., 2000). In
addition, the use of artificial lipid bilayers and Jurkat cells revealed that signalling events
activated upon LFA-3/CD2 ligation were accompanied by the reorganisation and clustering of
CD2 and associated signalling molecules into microdomains and that this was dependent on the
actin network. It was proposed that the formation of such microdomains is a requirement for the
activation of Lck since they allow Lck activators to cluster and exclude Lck inhibitors.
Microdomains of CD2/LFA-3 were spatially segregated from those containing TCRs.
CD2/LFA-3 clustered peripherally to TCRs concentrated in the cSMAC. One theory is that
CD2/LFA-3 signalling sustains signalling events triggered following TCR activation and spatial
segregation of the TCR and CD2 may be important for this process (Kaizuka et al., 2009).
ICAM-1 is also an adhesion molecule expressed by APCs which interacts with LFA-1
(otherwise known as αLβ2), the only β2 integrin expressed by T cells. ICAM-1 is a glycoprotein
and has an extracellular domain, a single transmembrane domain and a cytoplasmic domain
(Bella et al., 1998). In addition to its role in mediating cell to cell adhesion between APCs and T
cells and the formation of a stable immunological synapse, as described in section 1.4.3, as with
LFA-3, it is able to provide co-stimulatory signals during T cell activation by APCs. In one
study it was suggested that human CD4+ T cell proliferation stimulated by activated monocytes
Page 157
Page 157 of 286
(i.e. with enhanced APC function) in the presence of CD3 antibody (to provide a signal to T
cells through the TCR/CD3 complex) required ICAM-1/LFA-1 interaction (van Seventer et al.,
1991b). Other studies using CD4+ T cells from transgenic mice that were CD18 negative (β
chain of LFA-1) showed that the presence of LFA-1 was required for the optimal activation of
CD4+ T cells stimulated by antigen-TCR (Kandula and Abraham, 2004). Furthermore, T cell
proliferation and IL-2 release was induced by stimulator cells that had been transfected with
MHC molecules and ICAM-1 but not by those expressing MHC molecules in the absence of
ICAM-1 (Zuckerman et al., 1998).
The specific signaling events involved in ICAM-1/LFA-1 co-stimulation have not been
fully elucidated (Varga et al., 2010). However, the enhancement of IL-2 production from anti-
CD3-stimulated T cells by anti-LFA-1 or ICAM-1 was entirely dependent on the interaction of
the adaptor protein SLP-76 with ADAP (adhesion and degranulation-promoting adaptor protein)
suggesting that these two adaptor proteins play a role in mediating LFA-1 co-stimulation (Wang
et al., 2009). In a different study, beads coated with CD3 antibody alone or with CD3 antibody
combined with purified ICAM-1 or with ICAM-1 alone were incubated with human CD4+ T
cells. In this system, the interaction of ICAM-1 with LFA-1 prolonged the hydrolysis of PIP2 in
T cells resulting in the production of IP3 (inositol 1,4,5-triphosphate) and other products of PIP2.
As discussed in section 1.4.2 these products ultimately lead to an increase in intracellular
calcium levels during T cell activation. Indeed, in this study using antibody coated beads, a
prolonged increase in the level of intracellular calcium in T cells was observed when ICAM-1
was used in conjunction with CD3 antibody (van Seventer et al., 1992).
Given the co-stimulatory role of LFA-3 and ICAM-1 expressed by APCs in T cell
activation, it is not unreasonable to assume that these adhesion molecules, when expressed by
endothelial cells, may also give co-stimulatory signals in T cell activation. In fact there have
been several reports suggesting that endothelial cells have a role in vivo as non-specialised
APCs, in part owing to the fact that they express adhesion molecules which, when expressed by
APCs, have a co-stimulatory effect. Furthermore, endothelial cells are capable of expressing
high levels of MHC class I and II molecules in situ. Since the only known function of these
Page 158
Page 158 of 286
molecules is to present antigen to T cells, endothelial cells are clearly well equipped in this
regard as discussed above (Westphal et al., 1993a; Choi et al., 2004; Pober and Sessa, 2007).
Also in support of this theory that endothelial cells may function in vivo as non-
specialised APCs is the fact that endothelial cells (including HUVEC) are capable of co-
stimulating the proliferation of T cells incubated with anti-CD3 mAb (Hughes et al., 1990;
Westphal et al., 1992) or with mitogen (Shanahan, Jr. et al., 1985; Savage et al., 1991).
Endothelial cells also augmented the production of IL-2 from purified CD4+ T cells and PBMC
stimulated with the mitogen PHA. The use of transwell plates (i.e. plates containing a
membrane insert as shown in Figure 36) revealed that this augmentation of IL-2 production was
dependent on direct contact between endothelial cells and PBMC and was inhibited by blocking
antibodies to LFA-3 and CD2, but not by blocking antibodies to ICAM-1 and LFA-1 (Hughes et
al., 1990). In a different study, augmentation of IL-2 production from PHA-stimulated CD4+ T
cells was inhibited by eight different antibodies which target LFA-3. Furthermore, the
augmentation effect was delayed when T cells expressing low levels of CD2 were used, and
purified LFA-3 was also capable of augmenting IL-2 production. This implies that the release of
soluble factors such as cytokines is not responsible for the co-stimulatory effect and is
consistent with the notion that endothelial cell to T cell contact is required. Although endothelial
cells constitutively express LFA-3 (Smith and Thomas, 1990), they do not usually express
CD80 and CD86 (Denton et al., 1999), the natural ligands for CD28 (as described in section
1.4.1). Therefore the co-stimulatory activity of endothelial cells is not likely to involve this
classical co-stimulatory pathway.
Consistent with its role on APCs, ICAM-1 is also implicated in the co-stimulatory
activity of endothelial cells. The co-stimulatory activity of endothelial cells on anti-CD3 mAb-
stimulated or PHA-stimulated T cells was inhibited by blocking antibodies to ICAM-1
(Westphal et al., 1993a; Westphal et al., 1993b; Westphal et al., 1993c). In addition to LFA-3
and ICAM-1, endothelial cells express the cell surface adhesion molecule VCAM-1. VCAM-1
binds to VLA-4; an α4β1 integrin strongly expressed by activated T cells. The interaction of
VCAM-1 and VLA-4 plays an important role in mediating the recruitment of effector T cells
across endothelial barriers into sites of infection (Murphy et al., 2008) and in mediating the
Page 159
Page 159 of 286
migration of T cells from the blood across high endothelial venules into lymph nodes (Faveeuw
et al., 2000). VCAM-1/VLA-4 interactions have also been reported to provide co-stimulatory
signals in T cell activation (Pober and Cotran, 1991; van Seventer et al., 1991a; Udagawa et al.,
1996; Nguyen et al., 2008). It has been suggested that the adhesive function of VLA-4 expands
the area of the immunological synapse which facilitates antigen recognition by the TCR.
Furthermore, VLA-4/VCAM-1 interactions may promote antigen recognition through the
appointment of signalling molecules required for the transmission of signals from the
TCR/antigen complex. This includes adaptor molecules containing ITAM motifs, tyrosine
kinases and the adapter SLP-76. Cytoskeleton movements are responsible for the breakdown of
SLP-76 microclusters that are involved in T cell activation. VLA-4 was found to inhibit such
cytoskeleton movements leading to sustained signalling (Nguyen et al., 2008). T cells also
express the integrin α4β7 which, upon interaction with MAdCAM-1 expressed by endothelial
cells, facilitates the entry of T cells into mucosal lymphoid tissues such Peyer’s Patches in the
gut (Hamann et al., 1994). The interaction of α4β7 with its counterstructures has also been
reported to co-simulate anti-CD3 induced T cell proliferation (Lehnert et al., 1998).
It has been shown that a “docking structure” can form at the point of contact between
endothelial cells and T cells. In the “docking structure” the endothelial cell membrane forms a
“cup-like” shape which engulfs the T cell. It is within this cup that adhesion molecules
(including ICAM-1 and VCAM-1) interact with their ligands. In one study, in the presence of a
super antigen (i.e. antigens that bind non-specifically to TCRs and so activate polyclonal T cell
proliferation), molecules within the cup were organised into a mature synapse involving
SMACs including a cSMAC and pSMAC as described in section 1.4.3 for the APC/T cell
immunological synapses. Whether or not this docking structure plays a fundamental role in T
cell activation by MHC-expressing endothelial cells is yet to be established (Choi et al., 2004).
Co-stimulation of PHA-activated T cells by endothelial cells has been reported to activate
transcription factors AP-1, NFAT and NF-κB, i.e. those involved in T cell differentiation,
proliferation and T cell effector functions (Mestas and Hughes, 2001). Both the composition and
amount of AP-1 is affected by the presence of endothelial cells (Hughes and Pober, 1993) and
Page 160
Page 160 of 286
the export of NFAT from the nucleus is inhibited by endothelial cells, increasing its activity on
gene expression (Murphy and Hughes, 2002).
The evidence to suggest that endothelial cells can co-stimulate T cells and thus act as
APCs is very strong. Several theories have been proposed regarding the biological relevance of
endothelial cells in antigen presentation and T cell activation. One possibility is that following
re-infection with a specific pathogen pathogen-derived peptides are presented locally by
endothelial cells in the context of self-MHC molecules. Effector memory T cells may be alerted
to the re-appearance of a pathogen in the surrounding tissue following interaction with
antigen/MHC complexes presented by endothelial cells resulting in a rapid immunological
recall response. In microvessels such as venules effector memory T cells would have intimate
contact with endothelial cells as a result of the small lumen (Choi et al., 2004; Pober and Sessa,
2007). In support of this theory, it was revealed that human microvascular endothelial cells
presenting antigen were able to stimulate transendothelial migration of CD4+ effector memory
T cells (Pober and Sessa, 2007). Interaction of co-stimulatory adhesion molecules expressed by
endothelial cells with their ligands on effector memory T cells may also promote T cell
activation. Other studies have shown that co-stimulation of T cells by endothelial cells
(including HUVEC) is restricted to CD45RO+ memory T cells (Pober and Cotran, 1991;
Marelli-Berg et al., 1996; Pober et al., 1997; Ma and Pober, 1998; Murphy et al., 1999). It is
thought that naive T cells have more stringent activation requirements than memory T cells and
thus can only be activated by specialised APCs. This makes sense as if memory T cells were
underactive, the rapid recall responses conferred by memory T cells would be limited. One
possibility is that naive T cells may not express the necessary ligands for adhesion molecule-
specific interaction with endothelial cells (Choi et al., 2004). For example, it has been reported
that naive T cells preferentially express the inactive form of LFA-1 whereas memory T cells
express large amounts of the high affinity active form of LFA-1. In the same study, it was found
that although memory CD4+ T cells employed LFA-1/ICAM-1, CD2/LFA-3 and CD28/B7
interactions, naive CD4+ T cells employed CD2/LFA-3 or CD28/B7 interactions when
transfected CHO cells were used as a model APC (Parra et al., 1993).
Page 161
Page 161 of 286
The co-stimulatory properties of adhesion molecules expressed by endothelial cells,
which are thought to support the non-specialised APC function of endothelial cells in vivo, may
also provide a means for endothelial cells to promote TGN1412-stimulated responses in co-
culture assays and in vivo (as shown in Figure 35). The interaction of adhesion molecules
expressed by endothelial cells with their ligands expressed by T cells may firstly play a role in
optimising the positioning of signalling molecules required for T cell activation upon
stimulation with TGN1412. Furthermore, signals generated from the interaction of adhesion
molecules with their ligands may themselves promote TGN1412-stimulated responses. The
concept that adhesion molecules contribute to TGN1412-stimulated responses in co-culture
assays is investigated in this chapter.
Figure 35. Illustration of three possible roles of endothelial cells in mediating aqueous TGN1412-
stimulated T cell responses in co-culture assays. Left: TGN1412 costimulates CD4+ T cells when a
primary signal is generated by the interaction of allogeneic MHC class II molecules (expressed by
endothelial cells) with the TCR. Middle: Endothelial cells immobilise TGN1412 presenting it to T cells in
a manner that is also achieved by immobilising TGN1412 onto plastic. Right: co-stimulatory adhesion
molecules (expressed by endothelial cells) promote TGN1412 activation of T cells.
Page 162
Page 162 of 286
To further evaluate the physiological relevance of the co-culture assay, the biological
activity of the IL-2 released in response to TGN1412 was evaluated. In addition, the endothelial
cell monolayer was substituted by a monolayer of fibroblasts with the aim of evaluating the
importance of the endothelial cell phenotype in this assay.
Finally, the hypothesis that IL-6 responses in co-culture assays and in vivo could come, at
least in part, from endothelial cells was investigated. Endothelial cells have been reported to
release a range of cytokines including TNFα (Meyer, 2000), IFNα, IFNβ, IL-6, IL-11, IL-12 and
IL-18 (Choi et al., 2004) and so are involved in immune responses through mechanisms not
involving endothelial cell to immune cell contact. The concentrations of IL-6 produced by
PBMC (in the absence of endothelial cells) in response to immobilised TGN1412 in Chapter 4
were compared with the concentrations of IL-6 measured in the blood of the TGN1412 trial
volunteers. However, this was not the case in co-culture assays. Endothelial cells (including
HUVEC) are capable of releasing IL-6 in response to TNFα stimulation (Chi et al., 2001; Huang
et al., 2010). TNFα binds to the extracellular region of TNF receptor 1 expressed on the surface
of endothelial cells. This induces the formation of a complex (signalosome) consisting of
various signalling molecules, which stimulate several kinase cascades resulting in IL-6
expression (Pober and Sessa, 2007). Since TNFα is produced in response to TGN1412 in co-
culture assays, IL-6 responses in vivo and in co-culture assays could come, at least in part, from
endothelial cells.
6.2 Methods
Culture medium used for assays was RPMI 1640 (Sigma R0883) supplemented with 2
mM L-glutamine (Sigma G7513), 100 units/ml penicillin, 0.1 mg/ml streptomycin (Sigma
P0781) and non-essential amino acids (Gibco 11140) unless otherwise stated. Human AB serum
was from Biosera (4190-100) and was pooled from mixed donors. Heat inactivation of hAB
serum at NIBSC is carried out by heating stocks to 56°C for 25 min. Heat-inactivation was to
inactivate complement to eliminate any cytotoxic effects caused by these proteins. All cell
incubations were in a humidified incubator at 37°C in 5% CO2.
Page 163
Page 163 of 286
6.2.1 Transwell experiments
Transwell plates were from Corning Life Sciences (3391) and are illustrated in Figure 36.
Transwell plates were used in experiments to investigate the role of endothelial cell to PBMC
contact in TGN1412-stimulated responses.
Figure 36. Simplified illustration of a Corning Transwell system.
Maintenance of HUVECjr2 cultures was as described in section 5.2.2. PBMC from
healthy donors were isolated from fresh human blood as described in section 2.2. HUVECjr2
were seeded in outer wells (see Figure 36) of transwell plates at 45,000 cells/well in 150 µl
culture medium containing 10% hi-hAB serum and incubated overnight to allow the cells to
adhere. Spent culture media was replaced with 150 µl culture medium containing 2% hi-hAB
serum. Where HUVECjr2 to PBMC contact was to be prevented, pre-soaked (in culture medium
containing 2% hi-hAB serum for 1 h) transwell membranes were inserted to create the inner
wells (see Figure 36) and 55,000 PBMC in 40 µl culture medium containing 2% hi-hAB serum
was added to each inner well. Membranes of the inner wells of transwell plates have a much
smaller surface area than the bottoms of wells of NUNC plates used in conventional co-culture
assays. For this reason, PBMC were added to each inner well to give a density equivalent to that
of PBMC in wells of NUNC plates (385,000 PBMC/cm2).
Page 164
Page 164 of 286
TGN1412, an isotype-matched negative control antibody or endotoxin (WHO IS 94/580,
NIBSC) as a positive control were added in 40 µl and 150 µl (in culture medium containing 2%
hi-hAB serum), to inner and outer wells respectively to give final concentrations 0.3, 3.3 and
33.3 µg/ml TGN1412, 3.3 µg/ml isotype control concentration and 2.5 IU (250 pg)/ml
endotoxin in both the inner and outer wells. TGN1412 concentrations are equivalent to 0.1, 1
and 10 µg/well in conventional co-culture assays using NUNC plates where the final volume in
the well was 300 µl; a range of concentrations which invariably included the dose which
stimulated the largest cytokine responses.
The same experimental conditions were used in wells where HUVECjr2 and PBMC
contact was permitted in outer wells but where transwell membranes (inner wells) were not
inserted. However, in addition to adding 55,000 PBMC/well, other outer wells received 280,000
PBMC so that in the presence of HUVECjr2 to PBMC contact, both the equivalent cell number
(55,000 PBMC/well) and equivalent cell density (280,000 PBMC/well = 385,000 PBMC/cm2)
to PBMC over membranes in inner wells (where cell to cell contact was prevented) was used.
Plates were incubated for 24 h prior to the removal of cell-conditioned medium (from the outer
and inner wells, when present; medium was not pooled) which was assayed using an IL-6-
specific ELISA as described in section 2.4, in which the IL-6 standard was diluted in culture
medium containing 2% hi-hAB serum.
In a different experiment, outer wells in which HUVECjr2 to PBMC contact was
permitted (using 280 000 PBMC/well) were set up using the experimental conditions described
in the paragraph above; however, in contrast, the membranes (inner wells) were inserted above
both the HUVECjr2 and PBMC to determine whether or not the presence of membranes in the
assay system interfered with IL-6 responses. IL-6 was measured in cell-conditioned medium
taken from the outer wells. In addition, PBMC were incubated with endotoxin (2.5 IU [250
pg]/ml) in inner wells, but without HUVECjr2 below the membranes. IL-6 was measured in
cell-conditioned medium taken from the inner wells.
The presence of 55,000 PBMC could have potentially “clogged” the transwell
membranes (inserted to prevent endothelial cell to PBMC contact). It was therefore important to
check that soluble factors were able to move freely across the membrane because, if this was not
Page 165
Page 165 of 286
the case, the prevention of cell to cell contact could also have prevented “cross-talk” across the
membrane mediated by soluble factors. Consequently, PBMC above the membrane (in the inner
well) and HUVECjr2 below the membrane (in the outer well) were incubated with endotoxin
(2.5 IU [250 pg]/ml) added either only to the inner well or only to the outer well. IL-6 was
quantified in cell-conditioned medium taken from the inner well and from the outer well;
medium taken from the inner and outer wells was not pooled prior to IL-6 quantification. In
addition, in the absence of HUVECjr2 to PBMC cell contact, i.e. with PBMC in the inner well
and HUVECjr2 in the outer well, IL-6 (WHO IS 89/548, NIBSC) at concentrations of 62 – 1000
pg/ml were added either to the inner well or to the outer well. TGN1412 was also added to wells
(3.3 µg/ml) but, in contrast to IL-6, it was added to both sides of the membrane (i.e. to the inner
and outer wells). The transwell plates were incubated for 24 h and IL-6 was quantified by
ELISA in cell-conditioned medium taken from the inner and outer wells (this medium was not
pooled).
It was thought that mixing the medium in the inner and outer wells would re-suspend the
PBMC and establish a more homogenous environment within the entire system by promoting
the movement of soluble factors across the membrane. Therefore, cultures of PBMC and
HUVECjr2 in transwell plates with 3.3 µg/ml TGN1412 or an isotype-matched (to TGN1412)
control or 2.5 IU (250 pg)/ml endotoxin, in the absence and presence of transwell membranes
preventing HUVECjr2 to PBMC contact, were mixed (using a pipette) 3 times over the 24 h
incubation period. Where membranes were present, cultures within the inner and outer wells
were individually mixed. IL-6 was measured in cell-conditioned medium taken from inner and
outer wells; medium from the inner and outer wells was not pooled.
To investigate the effects of HUVECjr2 to PBMC contact on TNF and IL-2 responses to
TGN1412 in co-culture assays, cell-conditioned medium remaining from transwell cultures in
which IL-6 responses were measured (stored below -20°C) were thawed and assayed in TNF
and IL-2 specific ELISAs. Cytokine standards were prepared in culture medium containing 2%
hi-hAB serum; cell-conditioned medium taken from the inner well was pooled with that taken
from the outer well as there was not enough medium remaining from the inner well to assay this
individually.
Page 166
Page 166 of 286
6.2.2 Co-culture assays involving conventional CD28 agonistic antibody
Co-culture assays were conducted as described in section 5.2.4 however, in addition to
TGN1412 and an isotype control antibody, cells were incubated with a mouse anti-human CD28
mAb (eBioscience 16-0289, clone CD28.2) at 0.1, 1 and 10 µg/well for 48 h. Cell-conditioned
medium was assayed for TNF , IL-6 and IL-2 in specific ELISAs in which cytokine standards
were diluted in culture medium containing 2% hi-hAB serum. Cell proliferative responses were
measured by 3H-thymidine incorporation as described in section 2.5 in which the 3H-thymidine
was added in culture medium containing 2% hi-hAB serum.
6.2.3 Co-culture assays to investigate TGN1412-immobilisation by HUVECjr2
Co-culture assays were conducted as described in section 5.2.4. After removing 100 µl
spent medium from the HUVECjr2 monolayer after the overnight incubation following seeding,
HUVECjr2 were pre-incubated with 100 µl TGN1412 or an isotype-matched negative control at
1 µg/well in culture medium containing 2% hi-hAB serum or with this supplemented culture
medium alone for 5 h. Monolayers were washed gently twice with supplemented culture
medium. PBMC were added together with either TGN1412 (for wells not pre-incubated with
TGN1412) or supplemented culture medium alone (for wells pre-incubated with TGN1412).
Cultures were incubated for 48 h prior to removal of the cell-conditioned medium which was
assayed in cytokine-specific ELISAs. Cytokine standard curves were prepared in culture
medium containing 2% hi-hAB serum. Cell proliferative responses were measured by 3H-
thymidine incorporation as described in section 2.5 in which 3H-thymidine was added to wells
in culture medium containing 2% hi-hAB serum.
6.2.4 Flow cytometric analysis of LFA-3 expression by HUVECjr2 and PBMC
HUVECjr2 were cultured as described in section 5.2.2. After trypsinisation, cells from
flasks were resuspended and pooled in 20 ml sterile PBS B containing 1% BSA in centrifuge
Page 167
Page 167 of 286
tubes. Pooled cells were centrifuged twice at 365 x g for 5 min at room temperature.
Supernatants were removed after the first centrifugation step prior to re-suspension of the cell
pellet in 20 ml PBS B containing 1% BSA. After the second centrifugation step, cells were
resuspended in 2 ml PBS B containing 10% rabbit serum (Sigma R9133) prior to counting and
adjusting the cell concentration to 2 x 10⁶ cells/ml.
PBMC were isolated from fresh blood donated by two healthy individuals at NIBSC and
washed as described in section 2.2. Cells from each donor were resuspended in 20 ml PBS B
containing 1% BSA and centrifuged at 365 x g for 5 min at room temperature. Supernatants
were removed prior to re-suspension of the cell pellets in 2 ml PBS B containing 10% rabbit
serum, counting and adjusting to 2 x 10⁶ cells/ml.
Tubes containing HUVECjr2 and PBMC were incubated on ice for 10 min, prior to the
addition of 100 µl HUVECjr2 or PBMC to wells of a U bottom polystyrene 96-well microtitre
plate (Falcon 353077) to give 2 x 10⁵ cells/well. Microtitre plates were centrifuged at 80 x g for
3 min at room temperature. Supernatants were removed using a multichannel pipette prior to the
addition of 50 µl of either goat anti-human LFA-3 or control antibody (goat IgG with an
irrelevant specificity; antibodies used are described in Table 7) diluted to 15 µg/ml in PBS B
containing 1% BSA. Microtitre plates were incubated on ice for 30 minutes. Antibody was
removed prior to the addition of 200 µl PBS B containing 1% BSA and centrifugation at 80 x g
for 3 min. This washing procedure was repeated prior to the addition of 50 µl fluorescein
isothiocyanate (FITC)-conjugated rabbit anti-goat antibody (Abcam ab6737) diluted 1 in 25
with PBS B containing 0.1% BSA. A smaller concentration of BSA was used here to avoid
reducing the activity of formaldehyde used at a later stage. Microtitre plates were incubated on
ice for 20 min prior to aspiration of the FITC-conjugated antibody from cells which were
subsequently washed twice by adding 200 µl PBS B (without BSA), centrifuging at 80 x g for 3
min at room temperature and aspiration of the supernatant. Cells in each well were resuspended
in 200 µl FACs Fix solution and microtitre plates were wrapped in aluminium foil and stored at
4°C overnight. Flow cytometric analysis of the cells was conducted using a FACSCanto II flow
cytometer (Becton Dickenson) and FACS Diva software (Becton Dickenson) was used for data
acquisition. Data was analysed using Flow Jo software (TreeStar Inc.).
Page 168
Page 168 of 286
6.2.5 Co-cultures involving blocking antibodies
Blocking and control antibodies used are described in Table 7. Co-culture assays were
conducted as described in section 5.2.4. After removing 100 µl spent medium from the
HUVECjr2 monolayer after the overnight incubation following seeding, HUVECjr2 were pre-
incubated with either 100 µl relevant blocking antibody or a control antibody (class or subclass-
matched to the blocking antibody) to give (final) doses shown in the Results section or in
culture medium alone containing 2% hi-hAB serum. All antibodies were diluted in culture
medium containing 2% hi-hAB serum. After an incubation of approximately 5 h (for blocking
antibodies with an intended target expressed by HUVECjr2), 125,000 PBMC in 150 µl culture
medium containing 2% hi-hAB serum were added prior to the addition of 50 µl TGN1412 at 1
µg/well as this dose invariably stimulated the largest responses in conventional co-culture
assays as described in section 5.3. Other controls were an isotype-matched (to TGN1412)
antibody in the absence of blocking antibody, blocking antibody alone (i.e. in the absence of
TGN1412) at the largest concentration tested in wells with TGN1412, the isotype-matched (to
the blocking antibody) control antibody alone at the same concentration as the blocking
antibody tested alone, and culture medium containing 2% hi-hAB serum alone (no antibody).
Plates were incubated for 24 or 48 h. Cell conditioned medium was assayed in cytokine-specific
ELISAs and cell proliferative responses were measured by 3H-thymidine incorporation as
described in Chapter 2. Culture medium containing 2% hi-hAB serum was used to dilute
cytokine standards for ELISAs and 3H-thymidine.
In co-culture assays where Tysabri (an IgG4 anti-α4 integrin subunit antibody) was used
as a blocking antibody, a TGN1412 analogue (NIB1412-S228P) was used instead of TGN1412
itself. The purpose of using the analogue rather than TGN1412 itself was to prevent the possible
formation of half molecules and Fab arm exchange between TGN1412 and Tysabri when they
were incubated together since this would have confounded the objective of the experiment by
introducing a novel molecule. The analogue of TGN1412 differed from TGN1412 in that the
analogue had been rendered incapable of forming half molecules and undergoing Fab arm
exchange with other IgG4 molecules (Angal et al., 1993) unlike TGN1412 itself and other IgG4
Page 169
Page 169 of 286
antibodies including Tysabri (Labrijn et al., 2009). The analogue (NIB1412-S228P) was
generated at NIBSC through a serine to proline mutation in the hinge region at amino acid
position 228 (Edelman et al., 1969). Cytokine and cell proliferative responses stimulated by this
analogue in co-culture assays and when immobilised had been shown to be comparable to those
stimulated by TGN1412 itself. In addition, the mutated mAb had been shown to specifically
bind CD28 and to be free from detectable pyrogenic contaminants (manuscript in preparation).
Co-culture assays where Tysabri was used as a blocking antibody were conducted as
described above for other blocking antibodies used. Tysabri and an isotype-matched (to
Tysabri) control antibody were added in 10 µl culture medium containing 2% hi-hAB serum (to
give the final doses shown in the Results section) to wells containing attached HUVECjr2 after
spent medium was removed. Immediately after the addition of Tysabri/isotype-matched control
antibody, 150 µl PBMC were added followed by 150 µl TGN1412 analogue (NIB1412-S228P).
An extended incubation of Tysabri with HUVECjr2 prior to the addition of PBMC as described
above for other blocking antibodies was deemed to be unnecessary as the intended target for this
antibody is expressed by PBMC.
Co-culture assays where anti-human IL-2 antibody was used to block the activity of IL-2
released by cells in response to TGN1412 were conducted as described above for other blocking
antibodies. PBMC were added in 150 µl culture medium containing 2% hi-hAB serum to wells
containing attached HUVECjr2 after spent medium was removed. Following this, TGN1412
and isotype-matched (to TGN1412) control antibody were added (100 µl/well) prior to the
addition of 50 µl anti-IL-2 antibody or control antibody to give the (final) doses shown in the
Results section or culture medium containing 2% hi-hAB serum alone.
Page 170
Page 170 of 286
Table 7. Blocking and control antibodies used. Blocking antibodies were free of toxic preservatives.
Blocking/control
antibody
Source Description
Anti-LFA-3 R & D Systems; AF1689 Goat IgG specific for
recombinant human LFA-3
Control antibody: class-
matched to anti-LFA-3
R & D systems; AB-108-C Goat IgG with an
irrelevant specificity
(normal IgG from naive
[non-immunised] goats)
Anti-ICAM-1 Leinco Technologies; C372, clone
15.2
Mouse IgG1 specific for
human ICAM-1
Control antibody: isotype-
matched to anti-ICAM-1
R & D Systems; MAB002, clone
11711
Mouse IgG1 with an
irrelevant specificity
(Keyhole Limpet
Hemocyanin; KLH).
Anti- 4 integrin subunit Tysabri, purchased as clinical grade Humanised IgG4 specific
for human 4 integrin
subunit
Control antibody: isotype-
matched to anti- 4 integrin
subunit (Tysabri)
Clinical grade antibody (see section
2.6)
Humanised IgG4 with an
irrelevant specificity
Anti-IL-2 R & D Systems; MAB 602, clone
5355
Mouse IgG2a specific for
human IL-2
Control antibody: isotype-
matched to anti-IL-2
R & D Systems; MAB003, clone
20102
Mouse IgG2a with an
irrelevant specificity
(KLH)
6.2.6 Antibody immobilisation assays involving blocking antibodies
The blocking and control antibodies used are described in Table 7. Wells of 96-well
polypropylene U bottom plates (Corning 3790) were coated with 50 µl TGN1412 (10 µg/well)
or an isotype-matched (to TGN1412) negative control (10 µg/well) in 50 µl sterile PBS B or
PBS B alone and left to dry overnight in a class II laminar flow cabinet. Wells were washed 2x
with 200 µl PBS B prior to the addition of 100 µl of the relevant blocking antibody or control
antibody (class or subclass-matched to the blocking antibody) to give (final) doses shown in the
Results section or culture medium containing 2% hi-hAB serum alone. All antibodies were
diluted in culture medium containing 2% hi-hAB serum. Other controls were blocking antibody
Page 171
Page 171 of 286
alone (i.e. in the absence of immobilised TGN1412) at the largest concentration previously
tested in wells with TGN1412, the isotype-matched (to the blocking antibody) control antibody
alone at the same concentration as the blocking antibody tested alone and culture medium
containing 2% hi-hAB serum alone (no antibody). PBMC were added (125,000 cells/well in 150
µl culture medium containing 2% hi-hAB serum) and wells were incubated for 24 h. Cell-
conditioned medium was assayed in cytokine-specific ELISAs and cell proliferative responses
were measured by 3H-thymidine incorporation as described under General Methods. Culture
medium containing 2% hi-hAB serum was used to dilute cytokine standards for ELISAs and
3H-thymidine.
6.2.7 Fibroblast culture
Primary human gingival fibroblasts (HGF) were a kind gift from the Eastman Dental
Institute. Cells were maintained in culture medium containing 10% hi-FCS but excluding non-
essential amino acids. Cells were seeded at 0.8 x 10⁶ cells in 75cm
2 flasks (Falcon, BD) after
trypsinisation with trypsin-EDTA (Sigma T4049). Cells used in this study were from a single
working cell bank and were used between passage 5 and passage 7.
Human foreskin fibroblasts (HFF) Hs-27 were an expanded stock, originally from
European Collection of Cell Culture (94041901). Cells were maintained as for gingival
fibroblasts. Cells used in this study were from a single working cell bank and were used at
passage 5.
6.2.8 Co-culture assays involving PBMC and fibroblasts as the monolayer
Co-culture assays were conducted as described in section 5.2.4. Fibroblasts were seeded
in wells of flat-bottomed 96-well microtitre plates at 15,000 – 20,000 cells per well in 100 µl.
HGF were in maintenance medium (described in 6.2.7 above). HFF were cultured in
maintenance medium containing 10% hi-hAB serum rather than hi-FCS. Following an
overnight incubation at 37°C with 5% CO2, spent medium was removed from the fibroblast
Page 172
Page 172 of 286
monolayer. The monolayer was incubated with 125,000 PBMC (per well) and test sample (see
below) in culture medium (as described in section 6.2) containing 2% hi-FCS and 2% hi-hAB
serum for HGF and 2% hi-hAB serum only for HFF (final volume in well = 300 µl) for 16 - 24
h.
Test samples included TGN1412, an isotype-matched (to TGN1412) negative control, no
sample (i.e. culture medium alone) and positive controls IL-1α (International Standard 86/678,
NIBSC) and IL-17 (WHO IS 01/420, NIBSC). IL-1α has previously been shown at NIBSC to
stimulate pro-inflammatory cytokine release from HGF. IL-17 has also been reported to
stimulate pro-inflammatory cytokine release from fibroblasts (Yao et al., 1997).
6.2.9 Stimulation by TNF of IL-6 release from HUVEC
C-HUVEC and HUVECjr2 were seeded in wells of 96-well microtitre plates (NUNC) at
30,000 cells/well in 100 µl culture medium containing 10-15% hi-hAB serum and incubated
overnight. Spent medium was removed prior to the addition of 300 µl TNF (WHO IS 88/786,
NIBSC) at concentrations of 25 – 1000 pg/ml diluted in culture medium containing 2% hi-hAB
serum or supplemented culture medium alone. Cell-conditioned medium was removed after 48
h incubation and assayed in an IL-6 specific ELISA as described under General Methods in
which IL-6 standard was also diluted in culture medium containing 2% hi-hAB serum.
6.2.10 Statistical analyses
Unless otherwise stated in the results section, significant differences between data sets
were established using Wilcoxon’s paired signed rank test.
Page 173
Page 173 of 286
6.3 Results
6.3.1 Effects of endothelial cell to PBMC contact on IL-6 responses stimulated by
TGN1412
HUVECjr2 at 45,000 cells/well and PBMC at 55,000 cells/well were incubated for 24 h
in transwell plates but were separated by a porous membrane preventing endothelial cell to
PBMC contact. PBMC were incubated in inner wells above the HUVECjr2, which were in outer
wells in this transwell system (see Figure 36). TGN1412 or an isotype-matched negative control
was added above and below the membrane (i.e. to inner and outer wells) to achieve a final mAb
concentration of 3.3 µg/ml. Figure 37 shows that under these experimental conditions,
TGN1412 was unable to stimulate an IL-6 response significantly above responses to an isotype-
matched negative control when IL-6 responses were measured in cell-conditioned medium
sampled from the inner and outer wells, i.e. either side of the porous membrane (p>0.05). In
contrast, IL-6 responses to a positive control, endotoxin, were marked. Under the same
experimental conditions, but where PBMC were cultured in outer wells with HUVECjr2,
allowing PBMC to endothelial cell contact, TGN1412 (3.3 µg/ml) stimulated IL-6 responses
significantly above those to the isotype-matched negative control (3.3 µg/ml). This was found to
be the case when PBMC were seeded in the outer wells (over HUVECjr2) either at an
equivalent density (385,000 PBMC/cm2
= 280,000 PBMC/well) to PBMC when seeded on
transwell membranes in inner wells or at an equivalent cell number to PBMC when seeded over
transwell membranes in inner wells (55 000 PBMC/well); p<0.001. Therefore, the lack of IL-6
responses to TGN1412 when PBMC and HUVECjr2 were separated by a membrane was not
due to a small number of PBMC over the membrane. The number of PBMC added over the
membrane, i.e. in inner wells, was that which gave an equivalent cell density to that of
conventional co-culture assays in NUNC plates as described in Chapter 5.
Page 174
Page 174 of 286
Figure 37. Effect of endothelial cell (EC) to PBMC contact on IL-6 responses to TGN1412 in 24 h co-
culture assays. HUVECjr2 (ECs) and PBMC were incubated in transwell plates in which the PBMC
seeded in the inner wells above the HUVECjr2 which were in the outer wells were separated by a porous
membrane to prevent EC to PBMC contact (see Figure 36). Alternatively, PBMC and HUVECjr2 were
incubated together in just the outer wells to allow endothelial cell to PBMC contact. In both situations,
cells were incubated with TGN1412 at the doses shown, an isotype-matched negative control (IC) at 3.3
µg/ml, culture medium only or with 2.5 IU (250 pg)/ml endotoxin (ET; positive control). In wells where
PBMC to endothelial cell contact was prevented, IL-6 was measured in cell-conditioned medium sampled
from both the inner wells and the outer wells. In wells where EC to PBMC contact was permitted (i.e.
where the membrane/inner well was omitted), PBMC were seeded either at an equivalent density
(385,000 PBMC/cm2
= 280,000 PBMC/well) or cell number (55,000 PBMC/well) in outer wells with
HUVECjr2 to PBMC seeded in inner wells (i.e. over transwell membranes) when they were inserted.
HUVECjr2 were seeded at 45,000 cells/well in outer wells. Values are means and S.E.M of 8-12 donors
of PBMC in 2-3 independent experiments.
Other experiments showed that the lack of IL-6 responses to TGN1412 when endothelial
cell to PBMC contact was prevented was not a result of inhibition caused by the physical
presence of the membrane. In these experiments, IL-6 responses stimulated by TGN1412 (3.3
µg/ml) incubated with PBMC and HUVECjr2 in outer wells (i.e. in the presence of endothelial
cell to PBMC contact) but with the membrane inserted (inner well) above both cell types, were
not notably smaller than IL-6 responses without the membrane inserted. IL-6 was measured in
cell-conditioned medium taken from the outer cells. Responses were 467 ± 167 pg/ml IL-6 in
the presence of the membrane and 563 ± 156 pg/ml IL-6 in the absence of the membrane, values
Page 175
Page 175 of 286
are means (pg/ml) and S.E.M of 4 donors of PBMC. Also, PBMC cultured over a membrane
(i.e. in inner wells) in a transwell plate with endotoxin but in the absence of endothelial cells in
the outer well, released large concentrations of IL-6 in cell-conditioned medium taken from the
inner wells. Responses were: 1977, 1975, 3106 and 10,455 pg/ml IL-6, values are means of
duplicates for 4 donors of PBMC.
It was important to determine whether or not the 55,000 PBMC in the inner wells, that
would have settled on the transwell membranes, hampered the flow of soluble factors through
the membrane in wells of a transwell system. In the first experiment, endotoxin, a potent
stimulant of monocytes within the PBMC fraction and of endothelial cells, was added either to
the inner wells containing PBMC (i.e. above the membrane) or to the outer wells containing
HUVECjr2 (i.e. below the membrane) in a transwell plate. Endotoxin was added to give a final
concentration in the well (on the assumption that endotoxin was able to pass through the
membrane), of 2.5 IU (250 pg)/ml. The data in Table 8 shows that IL-6 release above
background concentrations could be measured in cell-conditioned medium taken from the outer
and inner wells (i.e. from above and below the membrane), when endotoxin was added as the
stimulus to the outer wells only or to the inner wells only. This suggests that IL-6 and/or
endotoxin were able to pass in both directions across the membrane in the presence of PBMC.
Table 8. IL-6 responses measured in cell-conditioned medium from above or below a membrane
separating PBMC and endothelial cells (HUVECjr2) in wells of a transwell system, to 2.5 IU (250 pg)/ml
endotoxin added either above or below the membrane.
Endotoxin added: Cell-conditioned medium from:
Above the membrane
(inner wells)
Below the membrane
(outer wells)
Above the membrane (to inner wells) > 4000 3033 ± 646
Below the membrane (to outer wells) > 4000 2220 ± 325
Values are means (pg/ml) and S.E.M of 4 donors of PBMC. Background IL-6 concentrations, i.e. in the
absence of endotoxin, were below 12 pg/ml in cell-conditioned medium taken from either above or below
the membrane.
Page 176
Page 176 of 286
In a different experiment, IL-6 was added either above or below the membrane (i.e. it was
added either to the inner or the outer wells) separating the PBMC from the endothelial cells.
TGN1412 (3.3 µg/ml) was added to both the inner and outer wells to mimic the conditions of
the experiments in Figure 37. The target final IL-6 concentration in the wells (on the assumption
that IL-6 would pass through the membrane after being added either above or below the
membrane) was 62.5 – 1000 pg/ml. Figure 38 shows that when IL-6 was added above the
membrane (to inner wells), for all 4 donors of PBMC, IL-6 could be measured at a range of
concentrations (i.e. small and large) in cell-conditioned medium from both the inner and outer
wells. This was also the case when IL-6 was added below the membrane (to outer wells).
However, when IL-6 was added above the membrane, slightly less IL-6 was measured in cell-
conditioned medium from below the membrane compared with that from above the membrane,
suggesting that IL-6 concentrations were not completely homogenous. This was not the case
when IL-6 was added below the membrane, i.e. for all 4 donors the concentration measured
from cell-conditioned medium above and below the membrane was similar.
Figure 38. Capability of IL-6 to pass through the porous membrane in a transwell plate in the presence of
PBMC and endothelial cells above and below the membrane respectively. IL-6 was added either above
(panel A) or below (panel B) a membrane separating PBMC in inner wells (55,000 PBMC/well) from
HUVECjr2 in outer wells (see Figure 36) and was incubated for 24 h with 3.3 µg/ml TGN1412. The
target final IL-6 concentrations, should IL-6 have passed through the membrane and become
homogenous, was 62.5 – 1000 pg/ml. IL-6 was measured in cell-conditioned medium taken from either
above or below the membrane (i.e. from inner and outer wells). Values are means of duplicates for 4
different donors of PBMC (D1 – D4) from one experiment. The expected (nominal) concentration of IL-6
to be detected, i.e. the amount added, is also indicated in each panel.
Page 177
Page 177 of 286
It was thought that mixing the well contents in the inner and outer wells would resuspend
PBMC above the membrane and would encourage the free-flow of soluble factors across the
membrane, creating a homogenous medium throughout the well. Figure 39 shows that there was
no difference between the IL-6 responses to TGN1412 in mixed and non-mixed wells. This was
the case for cell-conditioned medium taken from the inner and outer wells. In fact, IL-6
responses to TGN1412 were not greater than those to the isotype-matched negative control in
mixed and non-mixed wells, consistent with other experiments in which endothelial cell to
PBMC contact was prevented (statistical analysis not possible because IL-6 concentrations were
so small that actual values could not be estimated). However, endotoxin was able to stimulate
marked IL-6 responses under the same experimental conditions. When endothelial cell to
PBMC contact was permitted (i.e. in the absence of the membrane) IL-6 responses to TGN1412
were significantly larger than those to the isotype-matched negative control (p<0.05, paired t
test) whether or not wells were mixed. There was little difference between IL-6 responses to
TGN1412 in mixed and not mixed wells.
Page 178
Page 178 of 286
Figure 39. Effect of mixing (to achieve a homogenous environment within the well) on IL-6 responses to
TGN1412 in 24 h co-culture assays in the absence and presence of endothelial cell (EC) to PBMC
contact. HUVECjr2 (ECs) and PBMC were incubated in transwell plates in which the PBMC seeded in
the inner wells above the HUVECjr2 which were in the outer wells were separated by a porous membrane
to prevent EC to PBMC contact (see Figure 36). Alternatively, PBMC and HUVECjr2 were incubated
together in just the outer wells to allow endothelial cell to PBMC contact. In both situations, cells were
incubated with 3.3 µg/ml TGN1412, an isotype-matched negative control (IC) at 3.3 µg/ml or with 2.5 IU
(250 pg)/ml endotoxin (ET) as a positive control. The contents of the inner and outer wells were either
mixed or not mixed. Where the membrane was inserted and endothelial cell to PBMC contact was not
permitted, IL-6 was measured in cell-conditioned medium sampled from both sides of the membrane (i.e.
from the inner and outer wells). Where no membrane was used and EC to PBMC contact was permitted,
PBMC were seeded either at an equivalent density (385,000 PBMC/cm2
= 280,000 PBMC/well) or cell
number (55,000 PBMC/well) to PBMC seeded over transwell membranes in inner wells when they were
used (see above). HUVECjr2 were seeded at 45,000 cells/well in outer wells. Values are means and
S.E.M of 4 donors of PBMC.
Page 179
Page 179 of 286
6.3.2 Effect of endothelial cell to PBMC contact on TNF and IL-2 responses to TGN1412
in co-culture assays
It was not possible to measure TNF and IL-2 responses to TGN1412 in cell-conditioned
medium taken from above and below the membrane in transwell plates separately since only 70
µl of cell-conditioned medium could be removed from above the membrane (i.e. from the inner
wells) and most of this (50 µl) was used to measure IL-6. Therefore, after establishing that
soluble factors were able to pass through the membrane even with PBMC covering its surface, it
was decided to measure TNF and IL-2 concentrations produced in response to TGN1412 in
cell-conditioned medium pooled from above and below the membrane (i.e. from inner and outer
wells): these were the remaining aliquots of the solutions assayed to generate the data shown in
Figure 37. Figure 40 shows that TGN1412 was not able to stimulate TNF and IL-2 responses
significantly above responses to the isotype-matched negative control when incubated for 24 h
with HUVECjr2 which were below the membrane in outer wells and PBMC which were above
the membrane in inner wells (p>0.05 for TNF ; however it was not possible to statistically
analyse IL-2 responses since all were below the range of the IL-2 ELISA standard curve). In
contrast, TNF responses to the endotoxin positive control were marked. Under the same
experimental conditions except for the absence of a porous membrane (thus permitting
endothelial cell to PBMC contact), TGN1412 stimulated TNF and IL-2 responses significantly
above those to the isotype-matched negative control. This was the case when PBMC were
seeded in the outer wells (with HUVECjr2) either at an equivalent density (385,000 PBMC/cm2
= 280,000 PBMC/well) as PBMC seeded over transwell membranes in inner wells when these
were used or at an equivalent cell number (55,000 PBMC/well); p<0.05 for TNF . (It was not
possible to statistically analyse IL-2 responses since for the isotype-matched control, all were
below the range of the IL-2 ELISA standard curve.) Therefore, the lack of TNF and IL-2
responses to TGN1412 when cells were separated by a membrane was not due to a small
number of PBMC in the inner wells. Of note: the number of PBMC added above the membrane
Page 180
Page 180 of 286
was that which gave an equivalent cell density to that of conventional co-culture assays in
NUNC plates as described in Chapter 5.
Figure 40. Effect of endothelial cell (EC) to PBMC contact on TNF (left panel) and IL-2 (right panel)
responses to TGN1412 in 24 h co-culture assays. HUVECjr2 (ECs) and PBMC were incubated either
separately within transwell plates (i.e. PBMC were separated from HUVECjr2 by a porous membrane to
prevent EC to PBMC contact) or together in just the outer wells of transwell plates (permitting EC to
PBMC contact) with TGN1412 at the doses shown, an isotype-matched negative control (IC) at 3.3 µg/ml
or with 2.5 IU (250 pg)/ml endotoxin (ET) as a positive control (TNF only). In wells where a membrane
was used, cell-conditioned medium from both sides of the membrane (from inner and outer wells) was
pooled and mixed. In wells where no membrane was used and EC to PBMC contact was permitted,
PBMC were seeded either at an equivalent density (385,000 PBMC/cm2
= 280,000 PBMC/well, white
columns) or cell number (55,000 PBMC/well, grey columns) as PBMC seeded over transwell membranes
in inner wells when they were used. HUVECjr2 were seeded at 45,000 cells/well in outer wells. Values
are means and S.E.M of 4-6 donors of PBMC in 2-3 independent experiments.
6.3.3 Comparison of cytokine and cell proliferative responses to superagonistic and
agonistic anti-CD28 mAbs in co-cultures of PBMC and C-HUVEC
This experiment was carried out to investigate the possibility that allogeneic MHC class
II molecules expressed by endothelial cells played a role in mediating responses to TGN1412 in
co-culture assays. If this had been the case, it would have been expected that conventional
agonistic anti-CD28 antibody substituted for TGN1412 would stimulate cytokine/proliferative
Page 181
Page 181 of 286
responses. Figure 41 shows that superagonistic TGN1412 stimulated TNF , IL-6, IL-2 and cell
proliferative responses of PBMC and C-HUVEC co-cultured for 48 h significantly above
responses to an agonistic anti-CD28 mAb (not a superagonist) and to a negative control
antibody, p<0.001. The responses stimulated by the agonistic anti-CD28 were not significantly
above responses to the negative control antibody, p>0.05. (A one-way analysis of variance
[ANOVA] with Bonferroni's multiple comparison test for TNF , IL-6 and cell proliferation and
Kruskal-Wallis test with Dunn's multiple comparisons test for IL-2, responses to 1 µg/well for
all 3 antibodies were compared.) The results generated when HUVECjr2 were used as the
monolayer instead of C-HUVEC were similar to those for C-HUVEC presented in Figure 41.
The small increase in TNF and IL-6 responses to agonistic CD28 antibody at 10 µg/well
may be attributable to a low level of endotoxin contamination of the antibody as the antibody
used was not of clinical grade.
Page 182
Page 182 of 286
Figure 41. TNF , IL-6, IL-2 and cell proliferative responses to superagonistic (TGN1412) and agonistic
anti-CD28 mAbs and a negative control mAb (NC, 1 µg/well) in 48 h co-cultures of PBMC and C-
HUVEC. Values for cytokine and cell proliferative responses are means ± S.E.M of 22-28 donations of
PBMC (from 15 different donors) and 5 different umbilical cords from 4 independent experiments.
6.3.4 Cytokine and cell proliferative responses to TGN1412 pulsed with endothelial cells
prior to the addition of PBMC in co-culture assays
This experiment was carried out to investigate the possibility that TGN1412 was
immobilised by endothelial cells in co-culture assays. Figure 42 shows that when TGN1412 at
0.1, 1 and 10 µg/well was incubated with a monolayer of HUVECjr2 for approximately 5 h
prior to washing the monolayer and adding PBMC (black bars), TNF , IL-6, IFNγ, IL-2 and
cell proliferative responses were very small and no different from responses to the isotype-
matched negative control. In contrast, when TGN1412 was incubated with a co-culture of
Page 183
Page 183 of 286
HUVECjr2 and PBMC, after washing the monolayer, TNF , IL-6, IFNγ, IL-2 and cell
proliferative responses were notably larger than responses to the isotype-matched negative
control, as can be seen from Figure 42.
Figure 42. Effect of pulsing endothelial cells (ECs) with TGN1412 prior to the addition of PBMC in 48 h
co-culture assays on TNF , IL-6, IFNγ, IL-2 release and cell proliferative responses. TGN1412 or an
isotype-matched negative control (IC, 1 µg/well) were either incubated with a monolayer of HUVECjr2
(ECs) for approximately 5 h prior to washing the monolayer and adding PBMC (black bars) or were
incubated with HUVECjr2 and PBMC, i.e. after washing the monolayer (white bars). Values are means
and S.E.M. of 8 donors of PBMC in 2 independent experiments.
6.3.5 Inhibitory affects of LFA-3 blocking antibody on responses to TGN1412
First, in order to determine if LFA-3 is expressed on PBMC and endothelial cells used in
co-culture assays, flow cytometric analysis of the cells was carried out. This analysis showed
that the fluorescence intensity emitted by the majority of HUVECjr2 in a population labelled
with goat (IgG) anti-LFA-3 antibody and stained with FITC-conjugated anti-goat IgG antibody
was greater than that of HUVECjr2 labelled with a control antibody (goat IgG with irrelevant
Page 184
Page 184 of 286
specificity) and stained in the same way. This was also true for PBMC from 2 donors
confirming the expression of LFA-3 by HUVECjr2 and PBMC (see Figure 43).
Figure 43. LFA-3 expression by endothelial cells (HUVECjr2) and PBMC measured by flow cytometry.
Non-activated HUVECjr2 and PBMC from two different donors were labelled in suspension with goat
(IgG) anti-human LFA-3 blocking antibody (Anti-LFA3) or goat IgG with an irrelevant specificity
(Control Ab). Flow cytometric analysis of labelled cells after staining with a FITC-conjugated anti-goat
IgG antibody was used to create histograms showing the number of cells in each population (events)
emitting fluorescence at a range of intensities.
Page 185
Page 185 of 286
To determine whether or not LFA-3 played a role in responses stimulated by aqueous
TGN1412 in co-culture assays, endothelial cells were incubated with a goat IgG LFA-3
blocking antibody specific for the extracellular region of human LFA-3 that prevented
interaction of LFA-3 with its ligand CD2. Endothelial cells were also incubated with a control
antibody (goat IgG with irrelevant specificity) or culture medium alone. Incubations were for 5
h, after which time PBMC and TGN1412 were added (LFA-3 blocking antibody and control
antibody were not removed at this stage). TNF , IL-6, IL-2 and cell proliferative responses
stimulated by 1 µg/well TGN1412 in the absence of the LFA-3 blocking or control antibody
were substantially larger than those to an isotype-matched (to TGN1412) negative control
antibody. However, TNF , IL-2 and, to a lesser extent, cell proliferative responses (but not IL-6
responses) to TGN1412 were inhibited by LFA-3 blocking antibody in a dose-dependent
manner. In contrast, TGN1412-stimulated responses (TNF , IL-6, IL-2 and cell proliferation)
were not inhibited by a control antibody (goat IgG with irrelevant specificity). This suggests
that inhibition was a result of the blocking antibody’s specificity for LFA-3 and not merely
because of the presence of goat IgG in the culture. The data is shown in Figure 44 where values
are means of individual donor responses expressed as percentages of the response to TGN1412
alone. TNF , IL-2 and cell proliferative responses stimulated by TGN1412 were significantly
smaller when 0.1 µg/ml LFA-3 blocking antibody was present compared with those when 0.1
µg/ml control antibody was present (p<0.01, paired t test), but this was not the case for IL-6
responses (p>0.05, paired t test). All donors of PBMC tested gave a mean absolute response (of
4 replicates) to TGN1412 in the absence of blocking antibody that was at least double the mean
response to the IgG4 control. There was negligible difference between TNF , IL-6, IL-2 and
cell proliferative responses of cells with LFA-3 blocking antibody and control antibody in the
absence of TGN1412, compared with responses in the absence of either antibody, i.e. in culture
medium alone. This shows that any (direct) stimulatory affect of these antibodies did not
confound their effects on inhibition of TGN1412-stimulated responses. These data therefore
suggest that ligation of LFA-3 with its ligand CD2 plays a role in responses stimulated by
aqueous TGN1412 incubated in co-culture assays.
Page 186
Page 186 of 286
Figure 44. Inhibition of TGN1412-stimulated responses by LFA-3 blocking antibody in co-culture
assays. TGN1412 (1 µg/well) was incubated in the absence and presence of a polyclonal goat (IgG) anti-
human LFA-3 blocking antibody (Anti-LFA3) or goat IgG with an irrelevant specificity (Control Ab), at
doses of 0.01 – 0.1 µg/ml, for 48 h with PBMC cultured over a monolayer of endothelial cells
(HUVECjr2). Other controls included an isotype-matched (to TGN1412) negative control (IgG4 Control)
at 1 µg/well, LFA-3 blocking antibody alone (Anti-LFA3) at 0.1 µg/ml and the control antibody alone
(Control Ab) at 0.1 µg/ml. TNF , IL-2 and cell proliferative responses are means and S.E.M of 15-16
individual PBMC donor responses expressed as percentages of the response to TGN1412 alone, from 4
independent experiments.
However, TNF , IL-2 and cell proliferative responses to TGN1412 could not be
abolished even when larger concentrations of LFA-3 antibody were used, as shown in Figure
45. In the presence of the anti-LFA-3 antibody, TNF responses were reduced by a maximum
of 51%, IL-2 responses by a maximum of 68% and proliferative responses by a maximum of
Page 187
Page 187 of 286
22%. Increasing the concentration of anti-LFA-3 antibody from 1 to 10 µg/ml did not further
inhibit TNF and cell proliferative responses suggesting that responses would not be further
inhibited by even larger concentrations of LFA-3 blocking antibody.
Figure 45. Effect of LFA-3 blocking antibody over a 3-log dose range on responses to TGN1412 in co-
culture assays. TGN1412 was incubated at 1 µg/well in the absence and presence of LFA-3 blocking
antibody at doses 0.1 – 10 µg/ml for 48 h with PBMC cultured over a monolayer of endothelial cells
(HUVECjr2). TNF , IL-2 and cell proliferative responses are means and S.E.M of 4 individual PBMC
donor responses expressed as percentages of the response to TGN1412 alone, from 1 experiment.
There was no difference between optical density values given by cytokine-specific
ELISAs for a range of TNF , IL-6 and IL-2 standard concentrations prepared with either LFA-3
blocking antibody or control antibody at the maximum concentration used to block LFA-3 (10
µg/ml) or when prepared alone (Figure 46). This suggests that the effects of LFA-3 blocking
antibody and control antibody on responses to TGN1412 in co-culture assays were not because
they interfered with the detection of cytokines in cytokine-specific ELISAs.
Page 188
Page 188 of 286
Figure 46. Effect of LFA-3 blocking antibody and control antibody on the detection of cytokines by
cytokine-specific ELISAs. Dilution series of TNF , IL-6 or IL-2 recombinant cytokine standards were
prepared in the presence and absence of 10 µg/ml LFA-3 blocking antibody or control antibody. Each of
the dilution series prepared was assayed by ELISA. Values are means of duplicates for each concentration
of cytokine tested in one assay.
To determine whether or not ligation of LFA-3 to its receptor played a role in PBMC
responses stimulated by immobilised TGN1412 (i.e. in the absence of endothelial cells), 24 h
assays were carried out in which PBMC were incubated with immobilised TGN1412 and with
either a goat IgG LFA-3 blocking antibody, a control antibody (goat IgG with irrelevant
specificity) or culture medium alone. TNF , IL-2 and cell proliferative responses stimulated by
10 µg/well TGN1412 in the absence of the LFA-3 blocking or control antibodies were
substantially larger than those to an isotype-matched (to TGN1412) negative control antibody.
These responses stimulated by TGN1412 were not inhibited by the addition of LFA-3 blocking
antibody to an extent significantly greater than the extent of inhibition caused by control
antibody, at any of the concentrations tested (0.001 – 1 µg/ml, p>0.05, one-way ANOVA with
Bonferroni’s Multiple Comparisons Test). This is shown in Figure 47 where values are means
of 4 individual PBMC donor responses expressed as percentages of the response to immobilised
TGN1412 alone. The four donors of PBMC selected for the experiment to determine the effect
of LFA-3 blocking antibody on the effects of immobilised TGN1412 (Figure 47) were chosen
because they had all been shown to yield PBMC that were sensitive to blockade by the LFA-3
blocking antibody of TGN1412-evoked responses in co-culture assays (Figure 44). These data
therefore suggest that LFA-3 does not play a role in PBMC responses stimulated by
immobilised TGN1412 in the absence of endothelial cells. Furthermore, these data rule out the
Page 189
Page 189 of 286
possibility that the inhibitory effects of LFA-3 blocking antibody on TGN1412-mediated
responses in co-culture assays was a result of cytotoxicity caused by the blocking antibody since
immobilised TGN1412 stimulated marked cell proliferation in the presence of LFA-3 blocking
antibody.
Figure 47. Effects of LFA-3 blocking antibody on PBMC responses to immobilised TGN1412. TGN1412
(10 µg/well) was immobilised by air-drying and incubated with PBMC in the absence and presence of a
polyclonal goat (IgG) anti-human LFA-3 blocking antibody (Anti-LFA3) or goat IgG with an irrelevant
specificity (Control Ab), at doses of 0.001 – 1 µg/ml for 24 h. Other controls included an immobilised
isotype-matched (to TGN1412) negative control (IgG4 Control) at 10 µg/well, LFA-3 blocking antibody
alone (Anti-LFA3) at 1 µg/ml and the control antibody alone (Control Ab) at 1 µg/ml. TNF , IL-2 and
cell proliferative responses are means and S.E.M of 4 individual donor responses expressed as
percentages of the response to TGN1412 alone, from 1 experiment.
Page 190
Page 190 of 286
6.3.6 Inhibitory affects of ICAM-1 blocking antibody on cell proliferative responses to
TGN1412.
To determine whether or not ligation of ICAM-1 to its receptor plays a role in responses
stimulated either by aqueous TGN1412 in co-culture assays (with PBMC and endothelial cells)
or by immobilised TGN1412 in assays with PBMC only, responses stimulated by TGN1412 in
both types of assay were measured in the absence and presence of a mouse monoclonal (IgG1)
anti-human ICAM-1 blocking antibody (Anti-ICAM-1). Also included in these experiments was
a mouse monoclonal IgG1 antibody with an irrelevant specificity (Control Ab) at a range of
concentrations. In co-culture assays, endothelial cells were incubated with ICAM-1 blocking
antibody and control antibody or culture medium alone for 5 h, after which time PBMC and
TGN1412 were added (i.e. in the presence of ICAM-1 blocking antibody and control antibody).
Cell proliferative responses stimulated by 1 µg/well TGN1412 in the absence of the ICAM-1
blocking antibody or control antibody were substantially larger than those to an isotype-
matched (to TGN1412) negative control antibody. However, cell proliferative responses to
TGN1412 were inhibited by ICAM-1 blocking antibody in a dose-dependent manner and, to a
much lesser extent, by control antibody. This is shown in Figure 48 where values are means of 4
individual PBMC donor responses expressed as percentages of the response to TGN1412 alone.
Cell proliferative responses stimulated by TGN1412 were statistically significantly smaller
when 3.3 µg/ml ICAM-1 blocking antibody was used than responses when 3.3 µg/ml control
antibody was used (p<0.0001, paired t test). In contrast to the inhibitory affects of ICAM-1
blocking antibody in co-culture assays, this antibody and control antibody did not inhibit cell
proliferative responses of PBMC to immobilised TGN1412. In addition, there was no
significant difference statistically between TGN1412-stimulated cell proliferative responses
using ICAM-1 blocking antibody and control antibody (p>0.05 at all concentrations tested, one-
way ANOVA with Bonferroni’s Multiple Comparisons test).
For both types of assay (co-culture and immobilised antibody), there was negligible
difference between cell proliferative responses of cells to ICAM-1 blocking antibody and
control antibody in the absence of TGN1412, compared with responses in the absence of any
Page 191
Page 191 of 286
antibody, i.e. in culture medium alone. Therefore, the extent of inhibition of TGN1412-
stimulated responses caused by these antibodies was not confounded by any (direct) stimulatory
affect of these antibodies. Therefore, these data suggest that ICAM-1 plays a role in cell
proliferative responses stimulated by aqueous TGN1412 incubated in co-culture assays but not
in responses stimulated by immobilised TGN1412 incubated with PBMC alone. Furthermore,
the same 4 donors of PBMC were used for both types of assay, ruling out donor to donor
variation as a reason for the lack of inhibition of immobilised TGN1412-stimulated responses of
PBMC alone. These data also rule out the possibility that the inhibitory effect of ICAM-1
blocking antibody on TGN1412-mediated responses in co-culture assays was a result of
cytotoxicity caused by the blocking antibody since immobilised TGN1412 stimulated profound
T cell proliferation in the presence of ICAM-1 blocking antibody.
Unfortunately, it was not possible to determine the affects of ICAM-1 blocking antibody
on TNF and IL-6 responses to TGN1412 as the antibody used stimulated substantial IL-6 and
TNF responses when incubated in co-culture assays or with PBMC alone, in the absence of
TGN1412. A test for the presence of bacterial endotoxins (Limulus Amebocyte Lysate test
carried at NIBSC) revealed that 3.3 µg/ml ICAM-1 blocking antibody (i.e. the largest
concentration tested in the present study) contained 0.2 IU (20 pg)/ml endotoxin, which, when
considering the endotoxin dose response curve shown in Figure 11, is a sufficient amount of
endotoxin to stimulate the release of substantial concentrations of pro-inflammatory cytokines
such as TNF and IL-6.
Page 192
Page 192 of 286
Figure 48. Inhibition of responses by ICAM-1 blocking antibody, to aqueous TGN1412 in co-culture
assays and to immobilised TGN1412 incubated with PBMC alone. Co-culture assays: TGN1412 (1
µg/well) was incubated in the absence and presence of mouse monoclonal (IgG1) anti-human ICAM-1
blocking antibody (Anti-ICAM-1) or mouse monoclonal IgG1 antibody with an irrelevant specificity
(Control Ab), at concentrations ranging between 0.166 – 3.33 µg/ml for 48 h with PBMC cultured over a
monolayer of endothelial cells (HUVECjr2). Immobilised TGN1412: TGN1412 (10 µg/well)
immobilised by air-drying onto polypropylene was incubated with PBMC in the absence and presence of
ICAM-1 blocking antibody or control antibody at concentrations ranging between 0.003 – 3.3 µg/ml for
24 h. Other controls in both types of assay included an isotype-matched (to TGN1412) negative control
(IgG4 Control) at 1 µg/well for co-culture and 10 µg/well when immobilised, ICAM-1 blocking antibody
alone and control antibody alone, both at 3.3 µg/ml for both types of assay. Cell proliferative responses
are means and S.E.M of 4 individual PBMC donor responses expressed as percentages of the response to
TGN1412 alone, from 1 experiment for each type of assay. The same 4 donors of PBMC were used for
both assays.
6.3.7 Inhibitory effects of 4 integrin blocking antibody (Tysabri) on responses to a
TGN1412 analogue in co-culture assays
To determine whether or not integrins VLA-4 and 4:β7 play a role in mediating
TGN1412-stimulated responses in co-culture assays following ligation to their receptors,
VCAM-1 and MAdCAM-1 respectively, the therapeutic IgG4 mAb Tysabri was used as a
blocking antibody owing to its specificity for the α4 integrin subunit of VLA-4 and 4:β7.
Twenty-four hour co-culture assays (with HUVECjr2 as the monolayer) were carried out in
Page 193
Page 193 of 286
which a TGN1412 analogue (NIB1412-S228P) was used. This analogue was rendered incapable
of forming and exchanging half molecules with other IgG4 molecules (unlike TGN1412 itself)
as described in section 6.2.5. NIB1412-S228P was incubated in the absence and presence of
Tysabri, or control antibody (IgG4 with irrelevant specificity) at concentrations of 0.1 – 10
µg/well. The purpose of using NIB1412-S228P rather than TGN1412 itself was to prevent the
possible exchange of half molecules between TGN1412 and Tysabri when they were incubated
together since this would have confounded the objective of the experiment by introducing a
novel molecule. TNF , IL-6, IL-2 and cell proliferative responses stimulated by 1 µg/well
NIB1412-S228P were not inhibited by the addition of 4 integrin subunit blocking antibody
(Tysabri) at any of the concentrations tested or by a control antibody. In most cases mean
responses to NIB1412-S228P in the presence of 4 integrin subunit blocking antibody or
control antibody were marginally larger than responses to NIB1412-S228P alone, as shown in
Figure 49. Inhibition of NIB1412-S228P-stimulated TNF and IL-2 responses caused by 4
integrin subunit blocking antibody and control antibody was not confounded by any (direct)
stimulatory effect of these antibodies since responses to these antibodies in the absence of
NIB1412-S228P were negligible. The small (direct) stimulatory effects of 4 integrin subunit
blocking antibody and control antibody in terms of IL-6 release and cell proliferative responses
would not have confounded inhibitory effects to any appreciable extent. These data suggest that
interaction of 4 integrin subunit-containing integrins (VLA-4 and 4:β7) with their ligands
does not play a role in responses stimulated by TGN1412 in co-culture assays.
Page 194
Page 194 of 286
Figure 49. Effects of an 4 integrin subunit blocking antibody on responses to a TGN1412 analogue. A
TGN1412 analogue (NIB1412-S228P) rendered incapable of forming and exchanging half molecules
with other IgG4 molecules (unlike TGN1412 itself) was incubated at 1 µg/well in the absence and
presence of Tysabri, an IgG4 4 integrin blocking antibody, and a control antibody (IgG4 with an
irrelevant specificity) at concentrations between 0.1 – 10 µg/well for 24 h with PBMC cultured over a
monolayer of endothelial cells (HUVECjr2). Tysabri and control antibody were also incubated in the
absence of the TGN1412 analogue under the same experimental conditions. TNF , IL-6, IL-2 and cell
proliferative responses are means and S.E.M of 4 donors of PBMC from 1 experiment.
6.3.8 Inhibitory effects of an anti-human IL-2 antibody on cell proliferative responses to
TGN1412 in co-culture assays
To investigate the dependence of TGN1412-stimulated cell proliferative responses in co-
culture assays on the presence of IL-2, TGN1412 was incubated in 48 h co-culture assays using
Page 195
Page 195 of 286
HUVECjr2 as the monolayer in the absence and presence of a mouse (IgG2a) anti-human IL-2
antibody (0.1 – 30 µg/ml) or an isotype-matched (IgG2a) negative control with an irrelevant
specificity. Figure 50 shows that cell proliferative responses stimulated by TGN1412 (1
µg/well) were inhibited by the anti-human IL-2 antibody in a dose-dependent manner, the
maximum reduction being approximately 40%. In contrast, cell proliferative responses were not
inhibited by control antibody suggesting that inhibition was the result of the specificity of the
anti-IL-2 antibody rather than by the mere presence of a mouse IgG2a antibody. These data
suggest that TGN1412-stimulated cell proliferation is at least partially dependent on IL-2
production in co-culture assays.
Figure 50. Effect of anti-IL-2 antibody on TGN1412-stimulated cell proliferative responses in co-culture
assays. TGN1412 was incubated at 1 µg/well in the absence and presence of a mouse (IgG2a) anti-human
IL-2 antibody and an isotype-matched (mouse IgG2a) negative control antibody with an irrelevant
specificity, at concentrations between 0.1 – 30 μg/ml for 48 h with PBMC cultured over a monolayer
endothelial cells (HUVECjr2). Cell proliferative responses are means and S.E.M of 4 individual PBMC
donor responses expressed as percentages of the response to TGN1412 in the absence of anti-IL-2 or
control antibody.
Page 196
Page 196 of 286
6.3.9 The effect of co-culturing PBMC over a monolayer of fibroblasts on TNF , IL-6 and
IL-8 responses to TGN1412
Figure 51 shows that TNF , IL-6 and IL-8 responses to TGN1412 incubated in aqueous
phase for 16 – 24 h with either HGF or HFF were very small and were not significantly
different from responses to the isotype-matched negative control (p>0.05 when comparing
responses to TGN1412 at 1 µg/well with responses to the isotype-matched negative control at 1
µg/well). In addition, cytokine responses to TGN1412 incubated for 16 – 24 h with PBMC over
a monolayer of HGF, despite being larger than responses of HGF alone, were not significantly
different from responses to the isotype-matched negative control (p>0.05 when comparing
responses to TGN1412 at 1 µg/well with responses to the isotype-matched negative control at 1
µg/well). In contrast cytokine responses to the positive control IL-1α, incubated either with
HGF alone or with PBMC co-cultured over a monolayer of HGF, were marked. For
comparison, in co-culture assays of PBMC over a monolayer of HUVECjr2 rather than HGF
(using 2% FCS and 2% hAB together in the culture medium rather than 2% hAB serum alone)
TNF , IL-6 and IL-8 responses to 1 µg/well TGN1412 were notably larger than those to 1
µg/well isotype-matched negative control. This suggests that the small TGN1412-specific
responses in co-culture assays using HGF were unlikely to have been a result of using a mixture
of human and bovine serum. The mixture was chosen because HGF were found to be unable to
adhere to plates in serum containing hAB alone and because, as shown in Chapter 5, TGN1412
was unable to stimulate responses when FCS was used as the supplement.
TNF , IL-6 and IL-8 responses to TGN1412 incubated for 24 h with PBMC co-cultured
over a monolayer of HFFs, despite being larger than responses of HFFs alone, were not
substantially different from responses to the isotype-matched negative control (p>0.05 when
comparing responses to TGN1412 at 1 µg/well with responses to the isotype-matched negative
control at 1 µg/well). In contrast, cytokine responses to the positive control, IL-17, incubated
either with HFFs alone or with PBMC co-cultured over a monolayer of HFFs, were marked.
Page 197
Page 197 of 286
Figure 51. The effect of co-culturing PBMC over a monolayer of HGFs (top) or HFFs (bottom) on TNF ,
IL-6 and IL-8 responses to TGN1412. TGN1412 at doses of 0.1, 1 and 10 µg/well, an isotype-matched
negative control (IC) at 1 µg/well, culture medium alone (CM) and either IL-1α at 100 pg/ml or IL-17 at
200 pg/ml were incubated for 16 - 24 h in aqueous phase with either HGFs or HFFs alone (filled
columns) or with PBMC co-cultured over a monolayer of HGFs or HFFs (open columns). For HGFs,
values for the cytokine responses (pg/ml) are means ± S.E.M of 8 donors of PBMC and 1 donor of HGFs
from 2 independent experiments. For HFFs, values are means ± S.E.M of 4 donors of PBMC and 1 donor
of HFFs.
6.3.10 Stimulation by TNF of IL-6 release from human umbilical vein endothelial cells.
Figure 52 shows that TNF stimulates dose-dependent release of IL-6 when incubated for
48h with C-HUVEC or HUVECjr2 (30,000 cells/well), i.e. under the same culture conditions
that were used for co-culture assays (of PBMC over C-HUVEC or HUVECjr2). IL-6 release
from C-HUVEC and HUVECjr2 was very similar when they were stimulated with doses of
TNF up to 400 pg/ml; above this dose, IL-6 release was greater from C-HUVEC than from
HUVECjr2. When stimulated with 25,600 pg/ml TNF (i.e. the maximum dose tested), IL-6
release was approximately 970 pg/ml from C-HUVEC and 420 pg/ml from HUVECjr2. The
Page 198
Page 198 of 286
concentrations of TNF released in response to TGN1412 in co-culture experiments
(approximately 1100 pg/ml TNF for HUVECjr2 and 600 pg/ml TNF for C-HUVEC),
stimulated only approximately 170 pg/ml IL-6 release from HUVECjr2 alone and 190 pg/ml IL-
6 release from C-HUVEC alone, respectively. These concentrations of IL-6 released from
HUVECjr2 alone and C-HUVEC alone fall a long way short of the concentrations of IL-6
released in co-culture experiments (approximately1750 pg/ml for HUVECjr2 and 7380 pg/ml
for C-HUVEC). This suggests that IL-6 release from endothelial cells, stimulated by TNF
alone, is only partially responsible for the IL-6 concentrations measured in cell-conditioned
medium in co-culture assays.
Figure 52. Stimulation of IL-6 release from C-HUVEC and HUVECjr2 by TNF . IL-6 release stimulated
by TNF (2nd IS 88/786) at concentrations ranging 25 – 25,600 pg/ml, when incubated with 30,000
HUVECjr2 or C-HUVEC per well for 48 h under the same experimental conditions as for co-culture
assays. Values are means and S.E.M of 4 replicates for each dose of TNF (from 1 umbilical cord for C-
HUVEC data).
Page 199
Page 199 of 286
6.4 Discussion
Following on from the previous chapter, the obvious question was: what do endothelial
cells contribute to PBMC-based assays that allows TGN1412 to stimulate cytokine and cell
proliferative responses without prior immobilisation of this antibody onto a plastic surface? To
answer this, a number of possibilities of how endothelial cells mediate TGN1412-stimulated
responses in co-culture assays were investigated. Since HUVECjr2 were readily available and
had been shown (in Chapter 5) to be a satisfactory substitute for fresh endothelial cells (C-
HUVEC), HUVECjr2 were the endothelial cells of choice for further experiments with
confirmatory experiments conducted with C-HUVEC when these were available.
6.4.1 The role of PBMC to endothelial cell contact in mediating TGN1412-stimulated
responses
In co-culture assays PBMC settle under the force of gravity over the monolayer of
endothelial cells and so are in direct contact with the endothelial cells. To determine whether or
not endothelial cell to PBMC contact was required for TGN1412 stimulation of PBMC,
transwell plates were used in which HUVECjr2 cultured as monolayers in outer wells were
separated from PBMC in inner wells by a porous membrane (see Figure 36). It was shown that
TGN1412 stimulated IL-6, TNF and IL-2 responses in co-culture assays only when endothelial
cell to PBMC contact was permitted, i.e. when endothelial cells and PBMC were not separated
by a porous membrane.
It is unlikely that the membrane itself in some way hampered the capability of cells to
respond because when the membrane was inserted above a co-culture of endothelial cells and
PBMC that were directly in contact, IL-6 responses to TGN1412 were not affected. Similarly,
PBMC cultured alone over the porous membrane in the absence of endothelial cells produced
substantial concentrations of IL-6 in response to endotoxin.
The large number of PBMC settling on a membrane within such a small area could have
prevented the free-flow across the membrane of crucial soluble factors, produced by either
Page 200
Page 200 of 286
PBMC or endothelial cells or both. This may have been the reason for the absence of TGN1412-
stimulated responses when endothelial cell to PBMC contact was prevented by the membrane.
However, since IL-6 was measured at a range of concentrations in cell-conditioned medium
from above and below the membrane when spiked either into cell-conditioned medium above or
below the membrane, it is unlikely that PBMC were preventing the movement of soluble factors
across the membrane. IL-6 was chosen as a representative soluble cytokine for measuring the
capability of soluble factors to pass through the membrane. With a molecular weight of 26 KDa
(Naka et al., 2002), it is one of the larger cytokines, thus if IL-6 was able to pass through, it was
reasoned that others were likely to be able to pass as well. In addition, endotoxin spiked into
cell-conditioned medium above the membrane stimulated IL-6 release that was measured in
cell-conditioned medium above and below the membrane. The same was true when endotoxin
was spiked into cell-conditioned medium below the membrane. Furthermore, mixing the cell-
conditioned medium above and below the membrane in an attempt to achieve a more
homogenous medium throughout the entire well did not restore TGN1412-stimulated IL-6
responses. These results therefore suggest that TGN1412-stimulated responses in co-culture
assays were not initiated by soluble factors such as cytokines unless the soluble factors
responsible were very short-lived and lost all biological activity during the time that it took for
them to pass through the membrane.
Once it had been established that endothelial cell to PBMC contact was required in co-
culture assays for TGN1412 to stimulate TNF , IL-6 and IL-2 responses, a number of
mechanisms that could potentially underlie TGN1412-stimulation of PBMC, involving
endothelial cell to PBMC contact, were investigated.
6.4.2 The role of allogeneic MHC Class II antigens expressed by endothelial cells in
mediating TGN1412-stimulated responses
One possible theory was that a primary signal for CD4+ T cell activation, the pre-
dominant T cell subset reported to be stimulated by immobilised TGN1412 (Stebbings et al.,
2007) and which is also stimulated by TGN1412 in co-culture assays (unpublished data,
Page 201
Page 201 of 286
NIBSC), was provided by stimulation of the TCR by allogeneic MHC class II expressed by
endothelial cells and that TGN1412 provided a co-stimulatory signal. Most of the evidence
suggests that this is an unlikely theory (reviewed in the Introduction to this chapter), however,
to further investigate this notion, a conventional agonistic CD28 antibody was substituted for
TGN1412 in co-culture assays. Responses to this agonist (rather than superagonist) antibody
were negligible when either C-HUVEC or HUVECjr2 were used as the monolayer. Since this
co-stimulatory antibody can only activate T cells in the presence of a primary signal, for
example through antigen recognition by the TCR, it was unlikely that allogeneic MHC class II
antigen stimulation of the TCR was occurring. Thus, it can be concluded that stimulation of
cells in co-culture assays is specific to TGN1412 superagonists and not conventional agonistic
CD28 antibodies.
In organ transplant recipients, the primary signal for T cell activation is provided by
recognition of allogeneic MHC class II molecules on donor cells. An important co-stimulatory
signal required for T cell activation by donor endothelial cells is provided by the interaction of
LFA-3 (expressed by endothelial cells) with CD2 (expressed by T cells) since endothelial cells
lack CD80 and CD86 expression, the co-stimulatory CD28 ligands expressed by specialised
APCs (McDouall et al., 1996; Rose, 1998). Therefore, if allogeneic MHC class II antigens
expressed by endothelial cells were stimulating T cells to any extent in co-culture assays,
stimulation would have been expected in the absence of TGN1412, especially since LFA-3 had
been shown to be expressed by HUVECjr2 in this study. The negligible IL-2 responses of cells
in co-culture assays in the absence of TGN1412 clearly show this was not the case.
Taken together, these findings suggest that it was unlikely that endothelial cells mediated
TGN1412-stimulated responses in co-culture assays through a mechanism involving allogeneic
stimulation of the TCR and so this possibility was not pursued further.
Page 202
Page 202 of 286
6.4.3 The role of TGN1412 immobilisation by endothelial cells in mediating TGN1412-
stimulated responses
The notion that endothelial cells in co-culture assays immobilise TGN1412, perhaps
through Fc to Fc receptor interaction, to present the molecule to PBMC in a manner similar to
that achieved by air-drying or wet-coating the antibody on plastic surfaces, was investigated.
Had cytokine responses of cells been large in co-culture assays, where endothelial cells were
pre-incubated for 5 h with TGN1412 prior to gentle washing (to remove unbound TGN1412)
and the addition of PBMC, this would have suggested that TGN1412 was, in some manner,
being immobilised by endothelial cells. However, responses were negligible for all 8 PBMC
donors tested. These data suggest either that any remaining TGN1412, i.e. immobilised by
endothelial cells, was not capable of stimulating cytokine responses or that antibody was not
bound to endothelial cells (and hence not immobilised) with an affinity strong enough to
withstand washing of the endothelial cells. Since IgG4 antibody has a low affinity for Fc
receptors (Bugelski et al., 2009), it is possible that any Fc receptor-bound TGN1412 had been
washed away. Similarly, in a different study at NIBSC, binding of TGN1412 to C-HUVEC or
HUVECjr2 was not detected using immunocytochemistry or cell ELISA techniques (Findlay et
al, 2011). Since most experiments to show that TGN1412 is immobilised by endothelial cells
would involve washing these cells, this is a difficult concept to prove.
However, when 1 µg/well of a TGN1412 analogue (NIB1412-S228P) rendered incapable
of forming and exchanging half molecules with other IgG4 molecules (used for the reasons
described in section 0) was incubated in co-culture assays in the presence of Tysabri (IgG4) or
an isotype-matched (to Tysabri) negative control at 0.1 – 10 µg/well, responses to NIB1412-
S228P were not inhibited. Although the primary purpose of this experiment was to investigate
the role of 4 integrin subunit in TGN1412-stimulated responses, as discussed later, this lack of
inhibition suggests that immobilisation of NIB1412-S228P by endothelial cells was not crucial
to responses stimulated by this TGN1412 analogue. If immobilisation had been crucial, the
presence of excess amounts of the other IgG4κ molecules in the culture (Tysabri or its isotype
control) would have likely inhibited responses to the TGN1412 analogue through competition
Page 203
Page 203 of 286
for occupancy of endothelial cell surface components responsible for immobilising the
TGN1412 analogue (i.e. Fc receptors). Furthermore, Tysabri or its isotype-control were
incubated with endothelial cells and PBMC for at least 1 h prior to the addition of the TGN1412
analogue giving Tysabri and the control an advantage over the TGN1412 analogue with regard
to receptor occupancy. Moreover, human AB serum was added to co-cultures and since IgG1 is
the predominant subclass in serum, with its higher affinity for Fc receptors than IgG4 (Bugelski
et al., 2009), it was likely to have “blocked” any unbound Fc receptor. In one study, it was
suggested that aggregated target-bound TGN1412, with its putative higher affinity for Fc
receptors compared with unbound TGN1412, may displace any Fc receptor bound IgG in co-
culture assays (Sandilands et al., 2010). However, more recently, unpublished data from our
laboratory has revealed that another TGN1412 analogue produced by NIBSC with a mutated Fc
portion incapable of binding to Fc receptors (including FcγRIa, FcγRIIa, FcγRIIb, FcγRIIIa,
FcγRIIIb and FcRn) was still able to stimulate cytokine responses in co-culture assays
(manuscript in preparation). Taken together, these data suggest that immobilisation of TGN1412
through Fc receptor binding is unlikely to be the mechanism by which TGN1412 stimulated
responses in co-culture assays.
6.4.4 The role of adhesion molecules in mediating TGN1412-stimulated responses
Since endothelial cell to PBMC contact is required in order for TGN1412 to stimulate IL-
6, TNF and IL-2 responses of cells in co-culture assays, and since TGN1412-stimulated
responses are unlikely to be allogeneic or dependent on TGN1412 immobilisation by
endothelial cells, an alternative possible role for endothelial cells was investigated. Recruitment
of specific immune cell subsets from the bloodstream into tissues usually occurs in venules.
Recruitment is mediated by the interaction of specific combinations of adhesion molecules
expressed by vascular endothelium (forming the venules) and the immune cells (Pittet and
Mempel, 2008). Some of these receptor/ligand combinations are known to provide co-
stimulatory signals in T cell activation pathways. It is (at least in part) for this reason that there
has been much debate on the role of endothelial cells as non-specialised APCs in T cell
Page 204
Page 204 of 286
activation (Westphal et al., 1993a). Endothelial cells have been shown to promote TCR/CD3-
induced T cell activation and proliferation though a cell to cell contact-dependent mechanism
involving the interaction of LFA-3 expressed by endothelial cells and CD2 expressed by T cells
(Hughes et al., 1990; Hughes and Pober, 1993; Westphal et al., 1993b). It was therefore
conceivable that this receptor/ligand combination might have played a role in TGN1412-
stimulated responses. HUVECjr2 and PBMC isolated from two donors were shown, by flow
cytometric analysis, to constitutively express LFA-3. LFA-3 blocking antibody which prevents
ligation of LFA-3 with its ligand CD2, partially inhibited TNF , IL-2 and cell proliferative
responses to TGN1412 in co-culture experiments. However, these responses could not be
entirely inhibited when larger concentrations of blocking antibody were used and for cell
proliferative and TNF responses, 10 µg/ml did not inhibit responses to a greater extent than 1
µg/ml, suggesting that LFA-3 was saturated with blocking antibody at such concentrations.
Under these (saturated) conditions, LFA-3 blocking antibody reduced TGN1412-stimulated cell
proliferation (-22%), TNF release (-51%) and IL-2 release (-68%) suggesting that LFA-3
augments responses to TGN1412 in co-culture assays but that LFA-3 alone is not responsible
for the initiation of TGN1412-stimulated responses.
An assumption was made that if LFA-3 blocking antibody was pre-incubated with
endothelial cells and removed by washing prior to addition of PBMC and TGN1412, LFA-3
molecules expressed post addition of PBMC/TGN1412 (i.e. upregulated as a result of cytokines
produced by endothelial cells/PBMC) would not be blocked by LFA-3 antibody. Consequently,
LFA-3 blocking antibody was left in co-cultures throughout the duration of the incubation
period. However, flow cytometric analysis clearly showed that PBMC, in addition to endothelial
cells, express LFA-3 and this is consistent with findings from other studies (Hviid et al., 1993).
Therefore, the inhibitory effects of the LFA-3 blocking antibody in co-culture assays in theory
could have been a result of blocking LFA-3 expressed by either endothelial cells or PBMC or
both. However, the findings from the studies referenced above (Hughes et al., 1990; Hughes and
Pober, 1993; Westphal et al., 1993b) suggest that LFA-3 expressed by endothelial cells may be
more likely to have been the source of the stimulatory activity in co-cultures of endothelial cells
and PBMC. The stimulatory activity of LFA-3 was specific to co-culture assays since, when
Page 205
Page 205 of 286
LFA-3 blocking antibody was incubated with PBMC alone, responses to immobilised TGN1412
were not inhibited. Perhaps responses of PBMC stimulated by immobilised TGN1412 were so
large that they could not be further augmented by co-stimulatory molecules expressed by
PBMC.
The mechanism by which LFA-3 augments responses to TGN1412 in co-culture assays is
unclear. Of course, as a CD28 superagonist, TGN1412 is able to stimulate T cells without the
requirement for a primary signal through ligation of the TCR. The signalling pathways leading
to T cell activation by CD28 superagonists and how this differs from conventional CD28/TCR
co-stimulation is still the subject of debate and is reviewed in the General Introduction. What is
clear from the past ten years of research is the involvement of Src-family protein tyrosine
kinases in pathways activated by both conventional and superagonistic (TGN1412) CD28 mAbs
(Waibler et al., 2008; Schraven and Kalinke, 2008) as discussed in Chapter 1. It is generally
accepted that Src-family protein tyrosine kinases can attach to lipid rafts after post-translational
modification with palmitate, allowing them to be recruited close to cytoplasmic domains of
membrane-bound signalling receptors (Tavano et al., 2004; Murphy et al., 2008). It has been
reported that antibodies used to block CD2 expressed on the surface of T cells prevented
endothelial cell-induced aggregation of lipid rafts and IL-2 release by T cells (Mestas and
Hughes, 2001). It was suggested by Mestas and Hughes that lipid raft aggregation may lead to
the rearrangement of signalling molecules involved in T cell activation upon stimulation via the
TCR. In addition, engagement of CD28 expressed by T cells promoted lipid raft aggregation at
the immunological synapse, resulting in a reorganisation of signal molecules involved in T cell
activation (Tavano et al., 2006). Taken together, these findings support the notion that in co-
culture assays, TGN1412-stimulated lipid raft aggregation in the T cell membrane is enhanced
by ligation of LFA-3, expressed by endothelial cells, to CD2, expressed by T cells, leading to an
increase in the number of Src-family kinases in the immunological synapse. This in turn could
amplify phosphorylation events of relevant signalling molecules leading to larger T cell
responses. Further evidence to support this theory was that ligation of an LFA-3/IgG fusion
protein with CD2 augmented anti-CD3 induced tyrosine kinase activity and T cell proliferation
(Kanner et al., 1992).
Page 206
Page 206 of 286
Furthermore, as discussed in the Introduction to this chapter, signalling events within T
cells resulting from LFA-3/CD2 interactions in the absence of TCR stimulation have been
reported to involve ITAM motifs in the ζ chain of the TCR, Lck, ZAP70, LAT, PLC-γ1 and
SLP-76. These are the same signalling processes that follow TCR ligation (Kaizuka et al.,
2009). It was also reported that the presence of the TCR, ZAP-70 and LAT are required for
CD28 superagonistic activation, despite the fact that ligation of the TCR is not required. It was
suggested that superagonistic CD28 activation was reliant on low level constitutive
“background” signals emanating from unligated TCRs (Hunig and Dennehy, 2005) and that
amplification of background TCR signalling by CD28 superagonists occurs at the level of
SLP76 involvement (Dennehy et al., 2007). Therefore, in co-culture assays and thus in the
putative presence of the TCR but in the absence of TCR ligation/stimulation, signals emanating
from LFA-3/CD2 interaction could, in fact, provide (additional) signals for bivalently bound
TGN1412 (as a CD28 superagonist) to “boost” but not for monovalently bound CD28 agonists
(as illustrated in Figure 7). The word “additional” is used here in brackets because it is not
known whether or not constitutive “background” signals are coming from the TCR in co-culture
assays. Furthermore, signals emanating from LFA-3/CD2 interaction alone were not solely
responsible for the initiation of TGN1412-stimulated responses because TGN1412-stimulated
activity could not be entirely blocked with LFA-3 blocking antibody. (This is discussed in more
detail below.) However, additional signals resulting from LFA-3/CD2 interaction may lower the
T cell activation threshold.
In contrast to TNF , IL-2 and cell proliferative responses, IL-6 responses to TGN1412 in
co-culture assays were not inhibited by the LFA-3 blocking antibody. This supports the notion
that receptor/ligand combinations other than LFA-3/CD2 are involved in mediating TGN1412-
stimulated responses since transwell experiments showed that IL-6 responses stimulated by
TGN1412 are dependent on endothelial cell to PBMC contact. It is unclear why reduced
concentrations of TNF as a result of inhibition caused by LFA-3 blocking antibody did not
lead to reduced IL-6 release since TNF stimulated IL-6 release by endothelial cells in a dose-
dependent manner, and because TNF has the same effect on monocytes (Murphy et al., 2008).
Page 207
Page 207 of 286
ICAM-1 expressed by endothelial cells plays a pivotal role in mediating leukocyte
adhesion and migration across endothelial cells through ligation with LFA-1 expressed by
leukocytes (Petruzzelli et al., 1998; Faveeuw et al., 2000; Muller, 2002; Pittet and Mempel,
2008). ICAM-1 is also expressed by specialised APCs and functions as a co-stimulatory
molecule after ligation with LFA-1, promoting T cell activation (Wingren et al., 1995;
Chirathaworn et al., 2002; Wang et al., 2009). In addition, the co-stimulatory effects of
endothelial cells on T cell activation have been reported to be mediated through the interaction
of ICAM-1 expressed by endothelial cells and LFA-1 expressed by T cells (Westphal et al.,
1993a; Westphal et al., 1993b; Westphal et al., 1993c). It was therefore conceivable that in co-
culture assays, ICAM-1 expressed by endothelial cells may have co-stimulated with TGN1412
to activate cells via interaction with LFA-1. It has been shown that both HUVECjr2 and C-
HUVEC used in this study constitutively express ICAM-1 (Findlay et al., 2011b). It has also
been reported elsewhere that endothelial cells constitutively express ICAM-1 (Rose, 1998).
Preliminary experiments in the current study have shown that ICAM-1 blocking antibody,
which prevents ligation of ICAM-1 with its ligand LFA-1, reduced TGN1412-stimulated cell-
proliferative responses by 43%. This suggests that ligation of this receptor ligand pair is
involved in TGN1412 activation of cells in co-culture assays. However, because ICAM-1 is
expressed by cells within the PBMC fraction (Murphy et al., 2008) and because the ICAM-1
blocking antibody was left in the co-culture (as for LFA-3), the inhibition of TGN1412-
stimulated responses could have resulted from blocking ICAM-1 expressed by endothelial cells
or PBMC or both. The stimulatory activity of ICAM-1 was specific to co-culture assays as
when ICAM-1 blocking antibody was incubated with PBMC alone, cell proliferative responses
to immobilised TGN1412 were not inhibited. This is possibly for the same reason described for
LFA-3 above.
Unfortunately, due to the presence of bacterial endotoxin (a potent stimulus for pro-
inflammatory cytokine release) in the blocking antibody, it was not possible to use it in
experiments in which pro-inflammatory TNF and IL-6 responses were measured. An
endotoxin-free ICAM-1 blocking antibody could not be sourced to permit the investigation of
Page 208
Page 208 of 286
the contribution, if any, of ICAM-1 to TGN1412-stimulated pro-inflammatory cytokine
responses in co-culture assays.
Ligation of VCAM-1 expressed by specialised APCs to the integrin VLA-4 expressed by
T cells plays a pivotal role in T cell adhesion and, not surprisingly, can provide a co-stimulatory
signal for T cell activation (Pober and Cotran, 1991; van Seventer et al., 1991a; Nguyen et al.,
2008). Since endothelial cells can express VCAM-1, it was conceivable that this receptor/ligand
interaction played a role in TGN1412-stimulated responses in co-culture assays. Although
VCAM-1 was not constitutively expressed by resting HUVECjr2 or C-HUVEC (Findlay et al.,
2011b) eliminating the possibility that VCAM-1/VLA-4 interaction might have played a role in
initiating responses to TGN1412, VCAM-1 expression was induced after these HUVEC were
treated with TNF (Findlay et al., 2011b). This finding was in agreement with other reports that
its expression can be upregulated by IL-1 and TNF treatment (Rose, 1998). Consequently,
VCAM-1/VLA-4 interaction could conceivably have promoted responses to TGN1412 after
their initiation. The therapeutic mAb Tysabri is a humanised anti- 4 integrin subunit IgG4
antibody which blocks the interaction of integrins containing the 4 subunit with their ligands.
VLA-4 consists of subunits 4:β1 and so, in this study, Tysabri was used to block potential
VLA-4/VCAM-1 interaction. However, this antibody was unable to inhibit responses to a
TGN1412 analogue in co-culture assays. This suggests that VCAM-1/VLA-4 ligation was not
involved in promoting responses to TGN1412 after their initiation since Tysabri, which was
present in wells for the full co-culture incubation, should have prevented interaction between
newly expressed VCAM-1 and VLA-4 molecules. This was consistent with the finding of
another study which also showed that blocking the interaction of VCAM-1 expressed by
endothelial cells with VLA-4 expressed by T cells did not inhibit T cell activation (Westphal et
al., 1993a), albeit activation that was via stimulation of the TCR/CD3 complex rather than with
a CD28 superagonist.
In addition to VLA-4, the integrin 4:β7 clearly has the 4 subunit, thus interaction with
its ligand MAdCAM-1, also expressed by endothelial cells at least in vivo, should be blocked by
Tysabri. Although 4:β7/MAdCAM-1 interaction has been reported to provide a co-stimulatory
Page 209
Page 209 of 286
pathway in T cell activation (Lehnert et al., 1998), the data indicates that it did not contribute to
responses stimulated by a TGN1412 analogue in co-culture assays.
Of note, the finding that the TGN1412 analogue stimulated responses in co-culture assays
suggests that half-molecule formation of the original TGN1412 and Fab arm exchange is not
required for these effects to occur. In addition, the finding that the inclusion of Tysabri in co-
culture experiments with TGN1412 had very little effect on responses to TGN1412 validates
Tysabri as a suitable isotype-matched [to TGN1412] negative control.
Cell proliferative responses in co-culture assays were, at least, partially dependent on the
production of IL-2 since anti-human IL-2 antibody inhibited TGN1412-stimulated cell
proliferative responses in a dose-dependent manner through putative binding of IL-2, preventing
engagement with IL-2 receptor expressed by cells in co-culture. However, cell-proliferative
responses were not entirely blocked by anti-IL-2 mAb. It is possible that not all of the IL-2 in
the cell-conditioned medium was bound by anti-IL-2 mAb but instead was perhaps bound to the
IL-2 receptor resulting in some cell proliferation. The IL-2Rαβγ complex, following its putative
expression by TGN1412-activated T cells, would have a competitive advantage over the anti-
IL-2 mAb for binding to IL-2 due to its very high affinity for this cytokine. It is also possible
that other cytokines may have stimulated cell proliferation. For example, IL-4, IL-15 and
GMCSF are all capable of stimulating cell proliferation (Cheng et al., 2002) although it is
generally accepted that most T cell proliferation is usually through signalling induced by IL-2
and its high affinity receptor.
Inhibition of TGN1412-stimulated cell proliferative responses by LFA-3 and ICAM-1
blocking antibodies was likely to have been the result of inhibition of IL-2 responses. However,
although IL-2 responses could be reduced by a maximum of 68% when LFA-3 was blocked,
cell proliferative responses could only be reduced by a maximum of 22%. It is likely that the IL-
2 released, albeit in smaller amounts when LFA-3 was blocked, was still sufficient to stimulate
cell proliferation. In other studies, it was reported that endothelial cells augmented IL-2
production, albeit from mitogen-stimulated T cells. This augmentation was reported to be
dependent on CD2/LFA-3 interaction (Hughes et al., 1990; Savage et al., 1991) which is
consistent with the findings in the present study. Although the concentrations of IL-2 released in
Page 210
Page 210 of 286
co-culture assays were small in comparison with concentrations measured in the blood of the
trial volunteers, it appears that the IL-2 which was produced in vitro was having a biological
affect.
As discussed in the introduction to this chapter, there is evidence to suggest that the area
of interface between endothelial cells and T cells is highly organised and resembles the
immunological synapse which forms during APC-activation of T cells (Choi et al., 2004). The
function of an immunological synapse is to promote the organisation of molecules required for
T cell activation (Davis and Dustin, 2004). A fundamental purpose of co-stimulatory activation
pathways in T cell activation is to promote transportation of cell surface molecules distributed
around the T cell into the immunological synapse. This is achieved by promoting the
aggregation of lipid rafts which bring associated proteins with them (as described for LFA-3
above), and through cytoskeletal re-arrangements (Huppa and Davis, 2003). Co-stimulatory
combinations of LFA-1:ICAM-1 and CD2:LFA-3 have been reported to form part of the
immunological synapse in a number of studies (Huppa and Davis, 2003; Davis and Dustin,
2004; Dustin, 2007; Dustin, 2009; Kaizuka et al., 2009). Kaizuka et al. (2009) reported that
signalling events activated upon LFA-3/CD2 ligation were accompanied by the reorganisation
and clustering of CD2 and associated signalling molecules into microdomains and that this was
dependent on the actin network. This formation of microdomains was thought to be a
requirement for the activation of Lck. Other groups have suggested that the organisation of
signalling complexes in the synapse promoted by co-stimulatory pathways is based, to a certain
extent, on size, which favours the aggregation of various tyrosine kinases involved in signalling
but leads to exclusion of CD45, a phosphatase which would act as an antagonist of tyrosine
kinases (Dustin and Shaw, 1999). In summary, it would appear that the spatial organisation of
signalling molecules within the immunological synapse for T cell activation is very important. It
is conceivable that in co-culture assays, adhesion/co-stimulatory molecules expressed by
endothelial cells promote a favourable organisation of relevant signalling molecules/molecular
targets within the immunological synapse for T cell activation. This optimised spatial
organisation of signalling molecules may negate the requirement for TGN1412 to be presented
Page 211
Page 211 of 286
in the manner achieved by immobilisation in order for it to activate T cells. It is likely that a
threshold level of cross-linking of CD28 by TGN1412 is required and that this threshold can be
achieved by concentrating TGN1412 on a surface, i.e. by air-drying or wet-coating on plastic as
discussed in Chapter 4. LFA-3, ICAM-1 and other co-stimulatory/adhesion molecules expressed
by endothelial cells (discussed below) may act in concert to induce the formation of an
immunological synapse in which the spatial organisation of signalling molecules reduces the
threshold of CD28 cross-linking required for T cell activation. This reduced threshold may be
small enough such that aqueous TGN1412 can provide sufficient cross-linking. Indeed,
elsewhere it has been suggested that ICAM-1/LFA-1 interaction lowers the threshold amount of
foreign antigen required to activate T cells (Bachmann et al., 1997), albeit for activation via
TCR recognition of antigen and not by a CD28 superagonist.
In the present study LFA-3 alone was not entirely responsible for the initiation of
TGN1412-stimulated responses since such responses could not be completely blocked by LFA-
3 blocking antibody. Therefore, LFA-3 (and possibly ICAM-1) may simply augment responses
to aqueous TGN1412 while an alternative pathway involving endothelial cell/PBMC interaction
is responsible for the initiation of TGN1412-stimulated responses. However, on the contrary, it
is also possible that if one adhesion/costimulatory molecule is entirely blocked by antibody,
cells are still able to make use of other adhesion/costimulatory molecules (although the
threshold of cross-linking may increase). If this was the case with TGN1412, no single co-
stimulatory adhesion molecule would be exclusively responsible for allowing TGN1412 to
stimulate responses but together they could make this possible. In order to entirely block
responses to TGN1412 in co-culture assays, it may be necessary to use antibodies specific for
all of the co-stimulatory/adhesion molecules involved. In a published study, endothelial cell-
mediated augmentation of IL-2 responses to PHA-stimulated T cells could not be entirely
blocked by anti-LFA-3 antibody. However, when endothelial cells were substituted with
purified LFA-3, augmentation could be completely blocked with anti-LFA-3. So, it was
concluded that adhesion molecules other than LFA-3 were involved in the co-stimulatory
activity of endothelial cells (Savage et al., 1991). In another study, mixtures of antibodies
specific for a number of endothelial cell co-stimulatory/adhesion molecules (LFA-3, ICAM-1
Page 212
Page 212 of 286
and VCAM-1) resulted in greater inhibition of T cell responses than the individual antibodies
suggesting that these adhesion molecules acted in concert. However, in that study, T cell
activation was through antibody stimulation of the TCR/CD3 complex and not through
superagonistic anti-CD28 activation (Westphal et al., 1993a).
Many of the adhesion molecules/co-stimulatory molecules expressed by endothelial cells
are also expressed by PBMC. Therefore, if this notion regarding the formation of a “favourably
organised synapse” promoted by co-stimulatory/adhesion molecules were true, one could ask
why PBMC alone are unable to respond to aqueous TGN1412. Furthermore, why didn’t LFA-3
and ICAM-1 blocking antibodies inhibit responses of PBMC alone to immobilised TGN1412?
The answer to these questions could be explained by differences in the spatial arrangement of
PBMC and endothelial cells in the well and by differences in the density of relevant molecules
expressed on the surface of endothelial cells and PBMC within the well.
Adhesion molecules reported to have co-stimulatory effects on T cell activation may not
be expressed at high levels by non-activated endothelial cells in vivo and in vitro. Although one
of their biological functions is to mediate the adhesion and migration of immune effector cells
into tissue, their expression is usually upregulated in response to cytokines during the
inflammatory response. LFA-3 and ICAM-1 are both constitutively expressed by non-activated
endothelial cells but ICAM-1 in particular is expressed only at low levels (Smith and Thomas,
1990; Rose, 1998; Findlay et al., 2011b). Nevertheless, LFA-3 and ICAM-1 expression is
upregulated by pro-inflammatory cytokines, including TNF and IFNγ (Karmann et al., 1995;
Omari and Dorovini-Zis, 1999; Murphy et al., 2008). A low level expression of ICAM-1 and
LFA-3 may be sufficient for TGN1412-stimulated TNF release by T cells to occur, resulting in
upregulated expression of co-stimulatory molecules by endothelial cells, further promoting T
cell activation. LFA-1 exists in a low affinity form on non-activated T cells but conformational
changes leading to a high affinity state can be stimulated by several mechanisms including
cross-linking of CD2 and TCR/CD3 (Petruzzelli et al., 1998). Therefore, in co-culture assays,
LFA-3/CD2 interaction may have activated conformational changes in LFA-1 molecules. The
outcome of this change is expression of high affinity state LFA-1 molecules which would
enhance ICAM-1 ligation promoting TGN1412-stimulated T cell activation. However, it has
Page 213
Page 213 of 286
been suggested that although naive CD4+ T cells express large numbers of inactive LFA-1
molecules, CD4+ memory T cells express large numbers of active LFA-1 molecules (Parra et
al., 1993).
Although the co-stimulatory properties of LFA-3/CD2, ICAM-1/LFA-1 and VCAM-
1/VLA-4 interactions are the most studied, there are other cell surface proteins expressed by T
cells that also have been reported to provide co-stimulatory pathways, such as CD5, CD44,
CD9, CD27, CD30 (Mestas and Hughes, 2001; Mestas et al., 2005). Since some of the ligands
for these receptors may be expressed by endothelial cells, T cell activation in co-culture assays
might be mediated by cell surface proteins of endothelial origin not investigated in the present
study. For example, OX40 expressed by T cells can be co-stimulatory and endothelial cells
express OX40L, the ligand for OX40. It has been reported that ligation of OX40 with OX40L
expressed by endothelial cells augmented T cell responses to stimulation of the TCR/CD3
complex (Kunitomi et al., 2000; Mestas et al., 2005). In addition, ICOS expressed by T cells can
be co-stimulatory in T cell activation following ligation with its ligand LICOS (Simpson et al.,
2010). Indeed LICOS expression by endothelial cells has been confirmed. Furthermore, co-
culture of endothelial cells with CD4+ memory T cells in the presence of a superantigen led to
the production of Th1 and Th2 cytokines which was inhibited by a mAb specific for LICOS
(Khayyamian et al., 2002).
TGN1412 was unable to stimulate cytokine responses in co-culture assays significantly
above those to an isotype control when monolayers of HGF or HFF were used. This suggests
that not any cellular substrate can be used to elicit TGN1412-stimulated responses in co-culture
assays and that, most likely, the endothelial phenotype is required. This has been confirmed in a
a more comprehensive study at NIBSC where the capability of cell monolayers to elicit
TGN1412-stimulated responses in co-culture assays (using the method developed in this thesis)
correlated with endothelial phenotype, as defined by the expression of constitutive and induced
endothelial markers (Findlay et al., 2011). In addition, it has been reported elsewhere that
fibroblasts were unable to co-simulate T cells activated through the TCR/CD3 complex but that,
under the same experimental conditions, endothelial cells were able to do so (Page et al.,
Page 214
Page 214 of 286
1994b). It has been suggested that fibroblasts do not express the relevant co-stimulatory
molecules, at least at the densities required (Rose, 1998).
The capability of endothelial cells to act as APCs has been debated for many years.
Allogeneic endothelial cells expressing MHC class II molecules play a crucial role in transplant
rejection but in co-culture assays it seems that TGN1412-stimulated responses were not due to
allogeneic stimulation by endothelial cells, and obviously this could not have been the case in
the clinical trial volunteers. However, expression of co-stimulatory molecules by endothelial
cells is taken by some scientists as evidence to suggest that they can act as non-specialised
APCs in vivo, activating the memory T cell subset resulting in a rapid localised recall response
(as discussed in the introduction to this chapter). This APC function may have provided these
cells with the necessary “machinery” required to elicit TGN1412-stimulated responses in co-
culture assays and in vivo. Of course, the requirement for the monolayer in co-culture assays to
have an endothelial phenotype further validates the co-culture assay as “physiological” method
for detecting TGN1412-like activity. However, it does not rule out the possibility that other cell-
types were involved in vivo.
6.4.5 TGN1412-stimulated IL-6 release in co-culture assays is, at least in part, from
HUVEC
Although it is most likely that TGN1412 initiated responses in co-culture assays through
a contact-dependent mechanism between endothelial cells and PBMC, it is expected that a
number of soluble factors released after the initial stimulation intensified/amplified responses.
IL-6 responses to TGN1412 in co-culture experiments (with HUVECjr2 or C-HUVEC) were
much greater than responses to air-dried TGN1412 by PBMC alone, even though the same
PBMC cell density was used in both methods. It was therefore conceivable that IL-6 was
released from endothelial cells as well as from PBMC in co-culture experiments. In the present
study, C-HUVEC or HUVECjr2 cultured alone under the same conditions as in co-culture
assays released IL-6 in response to added TNF in a dose-dependent manner. It is likely
therefore that TNF , produced by PBMC in response to TGN1412, stimulated endothelial cells
Page 215
Page 215 of 286
to release IL-6. (Of note, the fact that C-HUVEC released more IL-6 in response to TNF than
HUVECjr2 may, in part, explain why IL-6 responses to TGN1412 in co-culture assays were
larger when C-HUVEC formed the monolayer.) However, IL-6 responses of HUVECjr2 and C-
HUVEC alone, stimulated by added TNF at a dose equivalent to the amount released in
response to TGN1412 in co-culture experiments, were much smaller than TGN1412-evoked IL-
6 responses in co-culture assays with PBMC. It is possible that endothelial cells produced IL-6
in response to soluble factors other than TNF and it is to be expected that cells within the
PBMC population produced IL-6 in co-culture assays, especially as IL-6 (albeit at smaller
concentrations) was produced in assays using PBMC alone with immobilised TGN1412.
Elsewhere it has been reported that IL-6 production by endothelial cells can be stimulated by
IL-1 (Sironi et al., 1989). In addition, endothelial cells and monocytes cultured together
produced synergistic IL-6 responses when endothelial cells were pre-treated with platelet-
activating factor (PAF), a potent inflammatory mediator also produced by endothelial cells
(Lacasse et al., 1996) and which could well have been produced in response to TGN1412 in vivo
and in vitro. Taken together, these data strongly suggests that endothelial cells contributed to
IL-6 production in responses to TGN1412 in vivo.
The inclusion of human endothelial cells in PBMC based assays has improved the
capability of the in vitro test to predict the clinical effects caused by TGN1412 by giving a test
system in which TGN1412 in aqueous phase (i.e. not dried onto plastic) stimulates cytokine
release. In this chapter, the mechanisms that may underlie TGN1412-stimulated responses in
co-culture assays, and thus potentially in vivo, have been investigated. It would, of course, be of
great benefit if this co-culture assay could be used as part of a testing programme to accurately
predict pro-inflammatory clinical infusion reactions caused by therapeutic mAbs other than
TGN1412. The utility for this purpose of this co-culture assay in comparison with other in vitro
tests for predicting clinical responses to therapeutic mAbs is evaluated in the next chapter.
Page 216
Page 216 of 286
CHAPTER 7:
Comparison of novel
methods for predicting the
risk of pro-inflammatory
clinical infusion reactions
during monoclonal antibody
therapy
Page 217
Page 217 of 286
CHAPTER 7: Comparison of novel methods for predicting the risk of pro-inflammatory
clinical infusion reactions during mAb therapy
7.1 Introduction
So far, the present study has focused on TGN1412 but clinical infusion reactions during
mAb therapy are far from exclusive to TGN1412. Depending on the antibody, a significant
number of clinical infusion reactions may occur, usually on the first or second infusion, and
these may be severe enough to constitute what has been termed ‘cytokine release syndrome’
(Breslin, 2007; Chung, 2008; Wing, 2008; Hansel et al., 2010). The response to TGN1412 was,
by far, the most extreme case of ‘cytokine release syndrome’, causing it to be termed a
‘cytokine storm’ (Suntharalingam et al., 2006). The TGN1412 incident prompted a re-think of
the conduct of first-in-human clinical trials (Expert Group on Phase One Clinical Trials, 2006;
European Medicines Agency, 2007; Stebbings et al., 2009) and the role of cytokine release
assays in the pre-clinical safety testing that precedes such trials (Wing, 2008). Subsequently, in
November 2009, a European Medicines Agency-sponsored workshop was held to consider the
merits of in vitro cytokine release assays for predicting cytokine release syndrome (Vidal et al.,
2010). The overall conclusion from the workshop was that cytokine-release assays have a place
in predicting the risk of pro-inflammatory clinical infusion reactions during mAb therapy and
that efforts should be made to further develop and refine the assays. During the present study,
the co-culture method resulted in much smaller cytokine responses to aqueous TGN1412 than
those of PBMC alone to TGN1412 air-dried onto polypropylene (the antibody immobilisation
technique for which the largest cytokine responses to TGN1412 were observed). The latter
technique better mimicked the magnitude of in vivo responses in humans to TGN1412
(Suntharalingam et al., 2006). However, air-drying an antibody onto plastic to stimulate cells
does not have an obvious in vivo analogue. Consequently, the experiments described in this
chapter were carried out to evaluate the suitability of the aqueous mAb/PBMC/endothelial co-
culture assay for predicting the risk of clinical infusion reactions to therapeutic mAbs other than
TGN1412 and to compare the mAb/PBMC/endothelial co-culture assay with the air-drying (of
Page 218
Page 218 of 286
the mAb) method. The panel of mAbs included in this evaluation comprised, in addition to
TGN1412 (essentially a positive control), mAbs associated with a significant incidence of pro-
inflammatory clinical infusion reactions, i.e. Herceptin and Campath-1H, and mAbs not
associated with a significant incidence of pro-inflammatory clinical infusion reactions, i.e.
Tysabri and Avastin (Dillman, 1999; Chung, 2008; Hellwig et al., 2008; Hansel et al., 2010).
The chosen readouts for the two methods were TNF , IL-6, IL-8, IL-2 and cell proliferation,
readouts associated with pro-inflammatory clinical infusion reactions (Wing, 2008; Bugelski et
al., 2009) and with TGN1412 activity.
7.2 Methods
7.2.1 Monoclonal antibodies
The clinical grade mAbs used in this study (Tysabri, Avastin, Herceptin, Campath-1H,
TGN1412 and an IgG4κ negative control) are described in 2.6.
7.2.2 General procedures
Aseptic technique was used for antibody manipulations and for the cell culture
procedures. Antibodies and reagents were stored according to the manufacturers’ instructions
and antibodies, reagents and lab ware for cell culture procedures were obtained as free from
detectable pyrogen/endotoxin. Culture medium for all experiments was RPMI 1640 (Sigma
R0883) supplemented with 2mM L-glutamine (Sigma G7513), 100 U/ml penicillin and 0.1
mg/ml streptomycin (Sigma P0781) and non-essential amino acids (Gibco 11140). Values (i.e.
each of the 4 replicates) in pg/ml or counts per min (cpm) for each donor’s response to
mAbs/controls were baseline corrected by deducting background values (i.e. the mean of 4
replicates for responses of cells from the same donor but where no mAb was added to wells)
and a mean of the 4 baseline corrected replicates calculated. Statistical analyses were conducted
using the Kruskal-Wallis Test with the Dunn’s Multiple Comparisons procedure.
Page 219
Page 219 of 286
7.2.3 Comparison of cytokine responses of PBMC incubated with mAbs immobilised by
air drying (Method 1)
Monoclonal antibodies Tysabri, Avastin, Herceptin, Campath-1H, TGN1412 and a
control mAb were immobilised by coating onto the surfaces of wells of untreated 96-well, U-
bottomed polypropylene microtitre plates (Corning #3790, now replaced with #3879). To coat,
50 µl of the antibody solution, diluted in PBS B, was added to each well. Plates were left
overnight in a class II laminar flow cabinet with the lids removed to allow the solutions to
evaporate. Coated plates were washed twice with 200 µl PBS B using a multi-channel pipette to
remove salt crystals and unbound antibody. Antibodies were air-dried onto polypropylene plates
as the largest absolute cytokine responses to mAbs were observed using this technique in
Chapter 4. PBMCs were isolated from fresh human blood as described in section 2.2. These
cells were incubated (125,000 cells/well) for 24 h at 37 °C, 5% CO2 in the antibody-coated
wells of plates containing 250 µl culture medium and 2% donor’s own plasma or in wells
containing 250 µl aqueous antibody (diluted with culture medium) or lectin PHA (positive
control) and 2% donor’s own plasma. After incubation, cell-conditioned medium was removed
from the PBMCs and assayed in cytokine-specific ELISAs for TNF , IL-6, IL-8 and IL-2 as
described in section 2.4. Standard curves for each cytokine were prepared in culture medium
containing 2% (final) pooled donor plasma (i.e. plasma from the four donors of PBMC, used for
any one assay). Cell proliferative responses of the remaining cells were quantified by measuring
3H-thymidine incorporation as described in section 2.5. 3H-thymidine was diluted in culture
medium containing 2% donor’s own plasma prior to addition to the cells.
7.2.4 Comparison of cytokine responses of human cells to mAbs incubated in aqueous
phase with PBMCs cultured over a monolayer of human umbilical vein endothelium
derived cells (Method 2)
HUVECjr2 were the endothelial cells used in the experiments described here and were
maintained as described in section 5.2.2. HUVECjr2 were from a single working cell bank
Page 220
Page 220 of 286
expanded from the original source and were used between passage 2 and passage 13.
HUVECjr2 were seeded in 96-well flat bottomed tissue culture treated microtitre plates (Nunc
167008) at 30,000 cells/well in 100 µl of culture medium containing 10% hi-hAB serum. After
an overnight incubation at 37 °C in 5% CO2, 100 µl culture medium was removed. PBMCs were
isolated from fresh human blood as described in section 2.2. Monoclonal antibodies Tysabri,
Avastin, Herceptin, Campath-1H, TGN1412, control mAb and PHA (positive control) were
incubated in aqueous phase with the attached endothelial cells and 125,000 PBMCs/well in 300
µl culture medium containing 2% hi-hAB serum for 46-48 h at 37 °C in 5% CO2. Under the
same experimental conditions, the mAbs and controls were also incubated with PBMCs alone.
Supernatants were harvested and assayed using cytokine-specific ELISAs for TNF , IL-6, IL-8
and IL-2 as described in section 2.4. Standard curves for each cytokine were prepared in culture
medium containing 2% hi-hAB serum. Cell proliferative responses of the remaining cells were
quantified by measuring 3H-thymidine incorporation as described in section 2.5. 3H-thymidine
was diluted in culture medium containing 2% hi-hAB serum prior to addition to the cells.
7.3 Results
Tables 9 and 10 and figures 53 and 54 show TNF , IL-6, IL-8, IL-2 and cell proliferative
responses of human cells cultured with the mAbs Tysabri, Avastin, Herceptin, Campath-1H,
TGN1412 and control mAb using two different methods. Method 1 was to incubate PBMCs
with mAbs immobilised by air-drying them onto the surfaces of wells of 96-well polypropylene
plates. Method 2 was to incubate mAbs added in aqueous phase to PBMCs cultured over a
monolayer of human umbilical vein endothelium-derived cells (co-culture). In Methods 1 and 2
antibodies were also incubated in aqueous phase with PBMCs alone for comparison. In Method
2, antibodies were added to the monolayer of human umbilical vein endothelium-derived cells
alone and none of the mAbs stimulated measurable cytokine release from these cells, i.e. in the
absence of PBMCs. For the methods where the mAbs were incubated in aqueous phase (i.e. in
co-culture experiments and when mAbs were incubated with PBMCs alone) the mAbs would
have been transferred in the cell-conditioned medium to the cytokine ELISA plates possibly
Page 221
Page 221 of 286
causing interference in the ELISAs. However, there was no detectable difference between the
values for absorbencies for TNF , IL-6, IL-8 and IL-2 cytokine standard curves prepared in the
absence and presence of either the control mAb, Tysabri, Avastin, Herceptin, Campath-1H or
TGN1412 (400 µg/ml). This shows that none of the mAbs in aqueous phase inhibited the
detection of cytokines by ELISA (see section 2.6 and Appendix II).
The mAbs Tysabri and Avastin are two mAbs that are rarely associated with clinical
infusion reactions (Chung, 2008; Hellwig et al., 2008) and one of the two, Avastin, which
stimulated larger responses than Tysabri, was chosen as the comparator for the mAbs that are
more frequently associated with pro-inflammatory clinical infusion reactions. For all of the
mAbs tested, cytokine and cell proliferative responses were larger when the antibody was
immobilised or incubated in co-culture than when incubated in aqueous phase with PBMCs
alone. Values in the tables and figures are means and S.E.M of the largest responses (calculated
from the largest responses for each donor) obtained from responses to 0.1–100 µg/well mAbs in
antibody immobilisation experiments and to 0.01–10 µg/well mAbs in co-culture experiments.
7.3.1 TNF , IL-6 and IL-8 responses for Method 1: antibody immobilisation by air-
drying
TNF , IL-6 and IL-8 responses of PBMCs incubated for 24 h with mAbs, either in
aqueous phase or immobilised by air-drying, and PHA (positive control) are given in Table 9
and the responses are summarised in Figure 53. TNF responses to immobilised TGN1412
were 6x larger than responses to Avastin (p<0.01); in contrast, responses to immobilised
Tysabri, Herceptin and Campath-1H were less than twice the responses to Avastin and these
small differences were not statistically significant (p>0.05). Small TNF responses to mAbs
Herceptin and Campath-1H added in aqueous phase were not statistically significantly different
from TNF responses to any of the other mAbs tested in aqueous phase (p>0.05).
IL-6 responses to immobilised TGN1412 were 6x larger than responses to Avastin
(p<0.05). IL-6 responses to immobilised Campath-1H were 5x larger than responses to Avastin.
Page 222
Page 222 of 286
However, this difference was not statistically significant (p>0.05), possibly due to the large
donor to donor variation of responses to Campath-1H. IL-6 responses to immobilised mAbs
Tysabri and Herceptin were less than twice the responses to Avastin and these small differences
were not statistically significant (p>0.05). Small IL-6 responses to mAbs Campath-1H and
TGN1412 tested in aqueous phase were not significantly different from IL-6 responses to
Avastin tested in aqueous phase (p>0.05).
IL-8 responses to immobilised TGN1412 and Campath-1H were 2.5x larger than
responses to Avastin (p<0.05). Responses to immobilised mAbs Tysabri, Herceptin and the
control mAb were less than twice the responses to Avastin and these small differences were not
statistically significant (p>0.05). Small responses stimulated by Campath-1H incubated in
aqueous phase were 6x larger than responses to Avastin in aqueous phase (p<0.05).
Despite the non-statistically significant (p>0.05) cytokine responses of PBMCs (alone) to
mAbs incubated in aqueous phase (except for the IL-8 response to Campath-1H), TNF , IL-6
and IL-8 responses to PHA (positive control) were marked.
7.3.2 TNF , IL-6 and IL-8 responses for Method 2: co-culture of PBMCs over a
monolayer of human umbilical vein endothelium-derived cells
TNF , IL-6 and IL-8 responses to mAbs and PHA (positive control) incubated for 48 h in
aqueous phase with PBMCs cultured over a monolayer of human umbilical vein endothelium-
derived cells or with PBMCs alone are given in Table 10; these responses are also summarised
in Figure 53. TNF responses to TGN1412 in co-culture experiments were 69x larger than
responses to Avastin (p<0.01). TNF responses to Campath-1H in co-culture experiments, were
8x larger than responses to Avastin (p>0.05). TNF responses of PBMCs alone stimulated by
Campath-1H, were 10x larger than responses of PBMC alone stimulated with Avastin (p<0.05).
TGN1412 and Campath-1H were the only mAbs capable of stimulating marked IL-6
responses in co-culture experiments and these responses were both 112x larger than responses
to Avastin, however this difference was statistically significant only for TGN1412 (p<0.05)
Page 223
Page 223 of 286
possibly due to the large donor to donor variation in responses to Campath-1H. Small IL-6
responses of PBMCs alone to Campath-1H were not significantly different from responses of
PBMC to Avastin (p>0.05).
TGN1412 and Campath-1H stimulated IL-8 responses in co-culture experiments that
were at least 32x larger than responses to Avastin in co-culture experiments (p<0.05). Very
small responses to the mAbs Tysabri and Herceptin in co-culture experiments were not
significantly larger than responses to Avastin (p>0.05). Only Campath-1H was able to stimulate
IL-8 responses above responses to Avastin when PBMCs were cultured alone: the responses
stimulated by Campath-1H were 22x larger than responses to Avastin (p<0.05).
TNF , IL-6 and IL-8 responses to PHA (positive control) incubated with PBMCs
cultured with endothelium derived cells or PBMCs alone were all marked.
Page 224
Page 224 of 286
Figure 53. TNF , IL-6 and IL-8 responses of human cells to mAbs Tysabri, Avastin, Herceptin,
Campath-1H, TGN1412 and the control mAb (NC, Negative Control) using two different methods. Left-
hand panels: PBMCs were cultured for 24 h with mAbs that had either been immobilised by air-drying
onto wells of a 96-well polypropylene microtitre plate (white bars) or that had been added as an aqueous
solution (black bars). Right-hand panels: PBMCs were cultured for 48 h with mAbs, in aqueous phase,
either over a monolayer of human umbilical vein endothelium derived cells (white bars) or alone (black
bars). The cytokine values (pg/ml) are means ± S.E.M of 4-18 donors of PBMC.
Page 225
Page 225 of 286
Table 9. Cytokine/cell proliferative responses of PBMCs to mAbs and PHA (10 µg/ml) incubated in
aqueous phase and mAbs immobilised by air-drying.
Control Tysabri Avastin Herceptin Campath-1H TGN1412 PHA
Aqu. Air-
dried
Aqu. Air-
dried
Aqu. Air-
dried
Aqu. Air-
dried
Aqu. Air-
dried
Aqu. Air-
dried
Aqu.
TNF 18 ±8
36 ±15
14 ±9
196 ±79
14 ±8
572 ±248
47 ±37
948 ±247
73 ±17
826 ±160
18 ±5
3414 ±511
4524 ±1018
IL-6 <1 2
±1.0
10
±5
79
±28
6
±3
147
±6
15
±10
283
±15
88
±31
785
±241
41
±36
939
±209
>4000
IL-8 1726
±1185
3458
±1123
1016
±613
9700
±2195
944
±545
13235
±2769
619
±391
22064
±2399
6050
±710
31689
±3812
781
±350
34020
±3233
39590
±4453
IL-2 2
±1
4
±2
4
±1
5
±2
11
±10
13
±7
14
±7
22
±15
14
±8
14
±7
6
±2
1350
±226
238
±55
Cell
Prolif.
32
±12
12
±10
35
±12
36
±19
15
±7
245
±167
23
±9
38
±27
23
±11
72
±37
293
±127
34148
±4516
64807
±6175
Values for cytokines (pg/ml) are means ± S.E.M of 8-12 donors of PBMC. Values for cell proliferative
responses (counts per min) are means ± S.E.M of 4-8 donors of PBMC.
Table 10. Cytokine/cell proliferative responses of PBMCs alone or PBMCs and human umbilical vein
endothelium derived cells in co-culture to mAbs and PHA incubated in aqueous phase.
Control Tysabri Avastin Herceptin Campath-1H TGN1412 PHA PBMC Co-
culture PBMC Co-
culture PBMC Co-
culture PBMC Co-
culture PBMC Co-
culture PBMC Co-
culture PBMC Co-
culture
TNF 5
±
7
±1
18
±8
12
±3
11
±4
15
±11
7
±2
16
±4
117
±25
123
±18
16
±4
1055
±288
>2000 >2000
IL-6 <1 11
±6
<1 15
±5
4
±3
14
±4
5
±4
32
±10
86
±60
1633
±571
14
±11
1572
±230
3766
±1146
2341
±719
IL-8 306
±111
282
±95
537
±197
1540
±628
339
±107
531
±138
191
±75
1152
±407
7478
±2517
17154
±3462
638
±232
22359
±3675
>30000 >30000
IL-2 <1 <1 <1 <1 <1 <1 <1 <1 <1 <1 2
±1
191
±47
515
±141
278
±116
Cell
Prolif.
15
±7
165
±59
82
±25
204
±46
72
±30
265
±86
60
±33
308
±128
257
±134
1759
±531
374
±177
57669
±6823
117034
±15953
93039
±15106
Values for cytokines (pg/ml) and for cell proliferative responses (counts per min) are means ± S.E.M of
4-18 donors of PBMC.
7.3.3 IL-2 and cell proliferative responses to mAbs for Methods 1 (antibody
immobilisation) and 2 (co-culture)
IL-2 and cell proliferative responses for methods 1 and 2 are given in tables 9 and 10 and
are summarised in Figure 54. None of the mAbs incubated in aqueous phase with PBMCs alone
in methods 1 and 2 stimulated notable IL-2 or cell proliferative responses. For methods 1 and 2,
notable IL-2 and cell proliferative responses were stimulated only by TGN1412 and these
responses to TGN1412 were at least 100x larger than responses to Avastin (p<0.01 for IL-2
responses in both methods, p<0.05 for cell proliferative responses in Method 2, p>0.05 for cell
proliferative responses in method 1). IL-2 and cell proliferative responses to PHA (positive
control) incubated with PBMCs cultured with endothelium derived cells or PBMCs alone were
marked.
Page 226
Page 226 of 286
Figure 54. IL-2 and cell proliferative responses of human cells to mAbs Tysabri, Avastin, Herceptin,
Campath-1H, TGN1412 and the control mAb (NC, Negative Control) using two different methods. Left-
hand panels: PBMCs were cultured for 24 h with mAbs that had either been immobilised by air-drying
onto wells of a 96-well polypropylene microtitre plate (white bars) or that had been added as an aqueous
solution (black bars). Right-hand panels: PBMCs were cultured for 48 h with mAbs, in aqueous phase,
either over a monolayer of human umbilical vein endothelium derived cells (white bars) or alone (black
bars). The values (pg/ml or counts per min) are means ± S.E.M of 4-18 donors of PBMC.
7.4 Discussion
Cytokine release assays represent an important element of the pre-clinical safety testing
of therapeutic mAbs and other medicines and vaccines in development (Vidal et al., 2010). The
two methods developed in previous chapters for predicting the clinical effects of TGN1412
were compared with regard to their capability to predict the clinical effects of therapeutic mAbs
other than TGN1412. Method 1 involved air-drying mAbs onto plastic (polypropylene) prior to
incubation with PBMC, and Method 2 involved incubating mAbs in aqueous phase with a co-
culture of PBMC and human umbilical vein endothelium-derived cells. The panel of mAbs
included in this evaluation comprised mAbs associated with a significant incidence of pro-
inflammatory clinical infusion reactions, i.e. Herceptin and Campath-1H, and mAbs not
associated with a significant incidence of pro-inflammatory clinical infusion reactions, i.e.
Page 227
Page 227 of 286
Tysabri and Avastin (Dillman, 1999; Chung, 2008; Hellwig et al., 2008; Hansel et al., 2010).
TGN1412 was chosen as the positive control for the two methods under evaluation since it had
been shown previously to stimulate the release of TNF , IL-6 and IL-8 in both methods.
The data obtained for TGN1412 in the present study can be summarised as follows:
TGN1412 was, overall, the most potent stimulator of cytokine release of the therapeutic mAbs
tested above and stimulated the release of TNF , IL-6, IL-8, IL-2 and cell proliferation in both
methods. These findings are broadly consistent with those in Chapter 4 and of previous studies
(Stebbings et al., 2007; Findlay et al., 2010; Eastwood et al., 2010). With regard to the other
antibodies tested, Campath-1H, when immobilised by air-drying, was the most potent stimulator
of IL-6 and IL-8 release (after TGN1412) but was not a potent stimulus for TNF release
relative to TGN1412. This is contrary to previous studies where immobilised Campath-1H was
a potent stimulus for TNF release (Eastwood et al., 2010); however, different experimental
conditions were used in the study of Eastwood et al. (2010), the main difference being the use of
15% FCS rather than 2% donors’ own plasma. Similarly, when tested in the co-culture of
PBMC over endothelial cells, Campath-1H stimulated the release of much less TNF than
TGN1412 but was its equal at stimulating the release of IL-6 and IL-8.
Unlike TGN1412 or, indeed, any of the other antibodies tested, when incubated in
aqueous phase with PBMCs alone, Campath-1H stimulated both IL-8 release and TNF release,
which was consistent with the findings of Wing et al. (1995) who investigated ex-vivo whole
blood cultures. This is consistent with the finding that first dose cytokine release syndrome
stimulated by Campath-1H (IgG1) is a consequence of Fc ligation of target-bound antibody
(CD52) to FcγIII receptors (CD16) on natural killer cells, a function weakened in Campath-1H’s
IgG4 counterpart (Wing et al., 1995; Wing et al., 1996). The destruction of targeted tumour
cells by Campath-1H is through antibody-dependent cell-mediated cytotoxicity (Waldmann and
Hale, 2005; Hansel et al., 2010). In contrast, TGN1412, as an anti-CD28 IgG4 mAb, does not
stimulate a “cytokine storm” by the same mechanism that Campath-1H stimulates cytokine
release syndrome (Eastwood et al., 2010).
Page 228
Page 228 of 286
The lack of cytokine responses to the IgG1 molecules Avastin and Herceptin in aqueous
phase with PBMCs alone, mediated by IgG1 Fc to Fc receptor ligation, is unclear especially for
Herceptin since there is evidence to suggest that Herceptin induces ADCC through FcγIII
receptor (CD16) ligation on natural killer cells (Arnould et al., 2006), as with Campath-1H.
Low target antigen density is a possible explanation since it has been shown that the expression
of lymphocyte surface antigens correlated approximately with the capability of human IgG1
antibodies against the surface antigens to stimulate cytokine release (Wing et al., 1995). Another
important factor in Fc receptor mediated cytokine release is the ease of access of the antibody
Fc region, once bound to its antigen, to the Fc receptor (Wing et al., 1996).
The release of IL-6 in vivo is delayed after infusion of Campath-1H, compared with the
release of TNF and IFNγ (Moreau et al., 1996) suggesting that IL-6 may be released in
response to TNF and IFNγ from cells other than T cells such as monocytes or endothelial cells
(Wing et al., 1996). In support of this notion, IL-6 release stimulated by aqueous phase
Campath-1H in the present study was much larger when PBMCs were cultured over a
monolayer of endothelial cells than when cultured with PBMC alone, whereas TNF release
remained much the same in the absence or presence of endothelial cells. An as yet unexplained
result, however, is the large IL-6 response of PBMCs stimulated by air-dried Campath-1H.
Large donor to donor variation in IL-6 responses to Campath-1H, for both methods, may be a
result of FcγIII receptor polymorphisms that modulate antibody dependent cell-mediated
cytotoxicity as is the case for therapeutic mAb Rituximab (Treon et al., 2005). A small (albeit
statistically significant) TNF response to Campath-1H compared with responses to TGN1412
may have been the result of natural killer cells constituting only a small proportion of PBMCs.
Another difference between TGN1412 and Campath-1H was the finding (from both
methods described in this study), that TGN1412 alone of the antibodies tested stimulated the
release of IL-2 and caused cell proliferation. Indeed, the capability of TGN1412 to stimulate the
release of IL-2 and to cause cell proliferation (and also the release of IFNγ) have previously
been described as the cardinal features of TGN1412 stimulation, with the major cell type
stimulated being CD4+ effector memory cells (Eastwood et al., 2010) in contrast to the CD8
+
and natural killer cells stimulated by Campath-1H (Wing et al., 1996).
Page 229
Page 229 of 286
Although the two methods evaluated were capable of distinguishing responses to
TGN1412 and Campath-1H from each other and from the responses to the other antibodies
tested, neither method adequately distinguished Herceptin, an antibody reported to cause a
significant incidence of pro-inflammatory clinical infusion reactions, from Avastin and Tysabri,
antibodies not associated with a significant incidence of pro-inflammatory clinical infusion
reactions, though Herceptin did stimulate more TNF , IL-6 and IL-8 release than Avastin and
Tysabri when immobilised by air-drying. Indeed, both the IL-6 and the IL-8 responses to the
immobilised antibodies tested showed a graded increase in the release of IL-6 and IL-8 with the
frequency/severity of clinical infusion reactions/cytokine release syndrome reported in the
literature (see above), as can be seen from Figure 53.
Perhaps not surprisingly, neither of the two methods evaluated offers perfect diagnostic
capability for cytokine release syndrome across the range of mAbs tested. What the two
methods do offer, however, particularly when used in conjunction and when IL-2 release and
cell proliferation are included as readouts, is a relatively straightforward means to discriminate
antibodies likely to precipitate a cytokine storm (like TGN1412) from antibodies that are likely
to stimulate cytokine release syndrome (like Campath-1H) without the need for expensive, state
of the art flow cytometry equipment. Furthermore, these methods were able to predict cytokine
release to antibodies with two distinct underlying mechanisms for causing cytokine release, i.e.
through activation of the target receptor and through Fc mediated effector functions. Further
work to investigate additional antibodies with a diverse range of mechanisms and
PBMC/endothelial cell interactions would further refine the methods, however, the methods as
described above are here shown to have value in predicting the potential for a therapeutic
antibody to trigger cytokine release syndrome in humans and its likely clinical consequences.
Data from such methods should therefore be integrated into the risk–benefit analysis for
candidate medicines in line with the principles described in the Committee for Medicinal
Products for Human Use Risk Mitigation Guideline (European Medicines Agency, 2007).
Page 230
Page 230 of 286
Chapter 8:
General discussion &
conclusions
Page 231
Page 231 of 286
CHAPTER 8: General discussion and conclusions
8.1 Failure of pre-clinical tests to predict the clinical effects of TGN1412
In March 2006, the therapeutic mAb TGN1412 was administered to human volunteers
during its “first time in man” phase I clinical trial. Infusion of this mAb stimulated a “cytokine
storm” resulting in life-threatening clinical effects (Suntharalingam et al., 2006). In the pre-
clinical testing phase, TGN1412 itself and TGN1412 orthologues were investigated using
animal models (rodents and macaques) and in in vitro experiments using human PBMC,
purified T cells and T cell subsets in which the CD28 superagonists were incubated with
aqueous TGN1412. None of the results from the pre-clinical testing had been interpreted as
suggesting that TGN1412 would cause severe adverse events in humans, despite the testing
revealing TGN1412’s capability to induce T cell proliferation and the production of pro- and
anti-inflammatory cytokines. The failure of pre-clinical testing to predict the toxic effects of
TGN1412 provided the impetus for this thesis, the hypothesis of which was that cytokine-driven
adverse effects of therapeutic monoclonal antibodies and the mechanisms involved can be better
predicted with novel in vitro procedures using human cells.
Following the failed clinical trial, it was established at NIBSC that the syringe material
administered to the trial volunteers was indeed of clinical grade, that it complied with its
specification and that no mistakes had been made in quality control tests to establish this status
(Expert Group on Phase One Clinical Trials, 2006). Although the tests conducted after the trial
included a rabbit pyrogen test and a bacterial endotoxins test, it was conceivable that TGN1412
contained a non-endotoxin pyrogenic contaminant to which rabbits were insensitive but to
which humans were sensitive. In the present study, when the cell-based assay optimised for the
detection of (all) pyrogenic contaminants was carried out as described in Chapter 3 (using
PBMC and whole blood), the results indicated that TGN1412 was free from (endotoxin and
‘non-endotoxin’) pyrogenic contaminants and that the pro-inflammatory activity of TGN1412
was a result of the intrinsic nature of the molecule itself. Moreover, the negligible cytokine
responses stimulated by TGN1412 in these experiments suggested that the cytokine release
Page 232
Page 232 of 286
assay optimised for detecting pro-inflammatory contaminants,was not appropriate for detecting
the intrinsic pro-inflammatory activity of TGN1412 itself, in common with the animal models
used. Consequently, there was an urgent need for new procedures better able to detect unwanted
(cytokine-releasing activities) intrinsic activities of mAbs (and other biological medicines).
It is only recently that scientists have been able to explain the failure of animal models to
predict the clinical effects of TGN1412 activity. In rodents, the removal of Tregs prior to
treatment with a CD28 superagonist results in an increase in systemic cytokines. For this reason
it has been suggested that IL-2 produced by T cells stimulates proliferation of Tregs which
“quench” the production of cytokines. In humans, the prevalence of the main cytokine-
producing cells stimulated by TGN1412 may be different than in rodents. For example, CD4+
memory cells are likely to be more abundant in humans than in laboratory rodents because
humans are exposed to infection more frequently than laboratory animals. As a consequence, in
humans, Tregs are unable to quench the overproduction of cytokines (Muller et al., 2008;
Gogishvili et al., 2008; Pallardy and Hunig, 2010; Romer et al., 2011). As previously
mentioned, the failure of macaques to predict the cytokine storm stimulated by TGN1412 is due
to a lack of CD28 expression by CD4+ effector memory cells (Eastwood et al., 2010).
8.2 Monoclonal antibody immobilisation
Stebbings et al. (2007) showed that, in vitro, TGN1412 was able to stimulate cytokine
responses if it was immobilised prior to incubation with human PBMC. The objective of the
study described in Chapter 4 was to further develop the in vitro antibody immobilisation test.
Six different methods of applying TGN1412 to 96-well microtitre plates were investigated to
determine the capability of these in vitro methods to predict the observed in vivo cytokine-
releasing activity of TGN1412. The methods included air-drying the mAb onto polystyrene or
polypropylene plates, wet-coating the mAb onto polystyrene or polypropylene plates and
incubating the mAb in aqueous phase in polystyrene or polypropylene plates. Immobilised mAb
was subsequently incubated with PBMC. TGN1412 stimulated significant dose-dependent
cytokine responses when immobilised onto both polystyrene and polypropylene plates but not
Page 233
Page 233 of 286
when incubated in aqueous phase in polystyrene or polypropylene plates. Overall, TGN1412
air-dried onto polypropylene plates gave the largest absolute cytokine responses. Wet-coating
onto polystyrene plates resulted in the smallest cytokine responses.
Substituting PBMC with whole blood resulted in smaller cytokine responses to
immobilised TGN1412 (air-dried). This was unexpected since whole blood assays more closely
mimic the in vivo situation and a number cell types are removed when isolating PBMC, for
example the granulocytes. It is possible that the isolation procedure somehow primed the PBMC
or removed a negative influence or influences from the whole blood, or both. Erythrocytes
undergo lysis when in culture, resulting in the release of haemoglobin which is toxic to other
cells (Sheerin et al., 1999). This toxicity may have inhibited cytokine release in whole blood
assays. Alternatively, it may simply be that because in the absence of blood flow, the
immobilised TGN1412 is rapidly covered with the large excess of red blood cells in whole
blood rather than with the lymphocytes that express the CD28 receptor. From a practical
perspective, of course, whole blood (as opposed to PBMC) would be the preferred method as it
is less time consuming. Others have found that whole blood assays give larger cytokine
responses than PBMC. Recently it was reported that endotoxin stimulates larger TNFα
responses in whole blood compared with PBMC (Chen et al., 2010). In addition, antigen-
induced cytokine release by T cells was reported to be smaller for PBMC than whole blood (Li
et al., 2010). It is likely that the most appropriate cell source (PBMC or whole blood) will
depend upon the nature of the product being tested and should be assessed on a case by case
basis. As with PBMC, TGN1412 air-dried onto polypropylene stimulated larger cytokine
responses using whole blood than TGN1412 air-dried onto polystyrene plates.
Overall the differences in TGN1412-stimulated cytokine responses between the
immobilisation methods could not be explained by different methods affecting either the quality
or quantity, or both, of TGN1412 immobilised. (In this context, quality means orientated with
the CD28-binding domain more readily available to bind CD28 expressed on T cells.) However,
one exception to this result was the finding that less TGN1412 remained bound to polystyrene
plates when immobilised by wet-coating, compared with the other methods. In addition, wet-
coating to polystyrene favoured TGN1412 being immobilised with an orientation such that the
Page 234
Page 234 of 286
CD28-specific variable region was less available to bind to the CD28. It should be noted that a
lack of binding of TGN1412 to polystyrene plates used in this study could be a result of the
tissue culture treatment that they had been subjected to and was not due to the fact or solely to
the fact that they were made of polystyrene.
To minimise clinical infusion reactions to other mAbs, it was important to determine
whether or not any of the methods used to immobilise TGN1412 were better at predicting
unwanted pro-inflammatory activities of mAbs other than TGN1412. It was only when the
antibodies were air-dried onto polypropylene or polystyrene or wet-coated onto polypropylene
(but not when wet-coated onto polystyrene), that the antibodies associated with pro-
inflammatory clinical infusion reactions stimulated cytokine responses. It is likely that, as with
TGN1412, the other mAbs tested were less able to bind to polystyrene plates when wet-coated.
It can be concluded that if antibody immobilisation procedures are used in pre-clinical tests to
predict the clinical effects of mAbs, caution must be exercised as not all plate types are equally
suitable and some may give false negative or false positive results.
It is not fully understood why, in vitro, immobilisation of TGN1412 is required to
stimulate cytokine responses. Immobilisation of TGN1412 may have presented this mAb to T
cells such that it was able to bind to CD28 receptors within a concentrated (i.e. polarised) area
of the cell surface and thus achieving a level of CD28 cross-linking above the threshold level
required for T cell activation. The manner in which TGN1412 is presented to its target receptor
in vitro is clearly crucial to its biological effect. Given that TGN1412 was administered as a
solution, it is not known how this polarised binding could have been achieved in vivo or, indeed,
if it occured at all. Perhaps, in vivo, other influences reduce the threshold of CD28 cross-linking
required for T cell activation, negating the requirement for the polarised binding of TGN1412 to
T cells.
It was also shown in Chapter 4 that immobilised TGN1412 was able to upregulate TNFα
gene expression in PBMC after a 30 minute incubation and that TNFα protein was detected in
cell-conditioned medium after a 60 min incubation of TGN1412 with PBMC. This finding
suggests that the kinetics of TNFα release stimulated by TGN1412 air-dried onto polypropylene
(chosen because this method stimulated the largest cytokine responses) mimicked the kinetics of
Page 235
Page 235 of 286
TNFα release in vivo in man (Suntharalingam et al., 2006), further validating this mAb
immobilisation method for the prediction of TGN1412-like activity. Also in support of this in
vitro method, elevated IL-6 and IL-8 responses of PBMC to immobilised TGN1412 could not
be measured in terms of gene expression (RT-PCR) or protein production (ELISA) even after a
90 minute incubation. This was consistent with the kinetics of IL-6 and IL-8 responses in vivo
which followed TNF responses (Suntharalingam et al., 2006). It is possible that cells bearing
CD28 receptor are directly stimulated by TGN1412 to release TNF which subsequently
stimulates other cells bearing TNF receptor (CD120) to release IL-6 and IL-8. Such ‘other
cells’ may include monocytes and endothelial cells. Consistent with the downstream role of
other cell types is the finding (Chapter 6) that TNFα was capable of stimulating endothelial cells
to release IL-6. It should also be noted that the kinetics of TNFα responses to immobilised
TGN1412 measured by ELISA broadly mirrored the kinetics of TNFα gene expression. It would
seem therefore that the TNFα ELISA used in this study, which is simpler and takes less time to
carry out than RT-PCR, is sufficient for evaluating the kinetics of cytokine responses over short
periods of stimulation. That said, cytokine levels after a 1 hr incubation with immobilised
TGN1412 measured by ELISA were much smaller than those measured in the blood of the trial
volunteers 1 h post infusion. The use of RT-PCR, however, was valuable as it was able to show
that, in vitro, TGN1412 stimulated de novo TNFα synthesis within 30 min of its incubation with
PBMC. Therefore, TNFα released by cells, at least in part, was not pre-formed (Suntharalingam
et al., 2006).
Antibody immobilisation was the first method to be developed following the TGN1412
clinical trial that proved to be capable of predicting the cytokine responses measured in the
blood of the trial volunteers. Had this test been carried out as part of the TGN1412 pre-clinical
testing phase, it is likely that the trial would not have proceeded. Nevertheless, this mAb
immobilisation method can be criticised for several reasons: immobilisation of a mAb onto a
plastic surface has little if any physiological relevance and for some mAbs may give “false
positives” if used as a pre-clinical safety test. For example, Avastin is a therapeutic mAb that is
not associated with causing cytokine release syndrome (Chung, 2008) but when immobilised by
air-drying in this study it was capable of stimulating some cytokine release. Therefore, it should
Page 236
Page 236 of 286
not be assumed that an antibody immobilised by air-drying that stimulates pro-inflammatory
cytokine responses of PBMC would automatically do so in man. In contrast, an antibody that
fails to stimulate pro-inflammatory cytokine responses of PBMC – even when it is immobilised
by air-drying – would appear to be unlikely to do so in vivo in man.
The use of a mAb immobilisation method to predict a “safe starting dose” for future
mAbs progressing to a phase I “first time in man” clinical trial would be questionable since it
cannot be certain how much of the mAb is attached to the well following the washing steps. In
addition, the amount that is attached may vary from one type of plate to another or even from
one batch of plates to another. Indeed, a ten-fold shift in the maximum immunostimulatory dose
(based on the amount added to wells) from 10 to 100 µg/well TGN1412 was observed in this
study following the change from one batch of plates to another from the same manufacturer.
Consequently, the mAb immobilisation method could be described as qualitative rather than
quantitative. To make dose predictions, one could perhaps establish the percentage of added
TGN1412 which remains bound to a specific batch of plates intended for use.
Following the TGN1412 clinical trial, the Secretary of State for Health set up an Expert
Scientific Group which was chaired by Sir Gordon Duff. The Duff Report was published after
ten Expert Scientific Group meetings and included considerations from 77 submitted viewpoints
from experts. It recognised that “The need for better and safer medicines is clear” and that “pre-
clinical development studies that were performed with TGN1412 did not predict a safe dose for
use in humans” (Expert Group on Phase One Clinical Trials, 2006). A method that is able to
predict the toxic effects of mAbs would clearly be even more valuable if it could be used to
make accurate predictions of a safe starting dose. A method whereby TGN1412 could be
incubated in aqueous phase was here considered a step in the right direction.
8.3 The co-culture method
In an attempt to develop a method which could predict the toxic effects of TGN1412 in
aqueous phase, the co-culture assay was developed as described above: this assay incorporated a
monolayer of human umbilical vein endothelial cells over which human PBMC and aqueous
Page 237
Page 237 of 286
TGN1412 were incubated. Since endothelial cells form the lining of blood vessels it was likely
that infused TGN1412 stimulated T cells in the presence of endothelial cells. Furthermore,
endothelial cells are involved in mediating inflammatory responses in vivo (Muller, 2002).
Indeed, this method was able to predict clinical responses stimulated by TGN1412 in aqueous
phase, with TGN1412 stimulating dose-dependent cytokine responses. The dose of aqueous
TGN1412 which stimulated the largest cytokine and cell proliferative responses was 3.3 µg/ml
(1 µg/well) which, in contrast to immobilised TGN1412, was a consistent maximally effective
dose in all experiments.
Unfortunately for the TGN1412 trial volunteers, this maximum immunostimulatory dose
in vitro (3.3 µg/ml) was close to the in vitro equivalent dose (2 µg/ml) of the dose given to the
trial volunteers (0.1 mg/kg) as described in Chapter 3. This fact shows that the co-culture
method is predictive of the nature of in vivo responses. The NOEL approach (no observed
adverse effect level) was used to calculate a safe starting dose for TGN1412 at its clinical trial.
Since no effects of TGN1412 were observed in Cynomolgus macaques following infusion of 50
mg/kg, this dose was used to calculate an equivalent safe starting dose for humans. What was
not known at the time was that macaques are an inappropriate animal model for predicting
TGN1412 activity since they do not respond as humans to TGN1412.
In light of the above findings, the MABEL approach (minimum anticipated biological
effect level) is now considered to be more appropriate than NOEL (Expert Group on Phase One
Clinical Trials, 2006) as the chosen starting dose is required to have some biological effect. The
MABEL approach has now been incorporated into the European Medicines Agency/Committee
for Medicinal Products for Human guidelines (European Medicines Agency, 2007). If data from
the co-culture assay is used to calculate a safe starting dose using the MABEL approach, 0.04
µg/well/300 µl = 0.132 µg/ml could be considered the MABEL (see Figure 27) where cytokine
release/cell proliferation are the measured biological effects. (This was the smallest dose of
TGN1412 tested in this study and it should be noted that smaller doses may have given a
biological effect).
Using the method to equate in vitro with in vivo doses described in section 3.2.1, 0.132
µg/ml would approximately equate to 396 µg/3 L blood plasma in a 70 kg adult, which gives a
Page 238
Page 238 of 286
starting dose of 0.0057 mg/kg. This is approximately 17 times smaller than the dose (0.1 mg/kg)
actually given to the trial volunteers, even without the addition of a safety margin which is also
usually applied (Stebbings et al., 2009). It should be noted however that this safe dose
prediction does not account for all differences between in vivo and in vitro systems. TGN1412
would be distributed and compartmentalised in the body and so it is likely that less TGN1412
would be available to activate cells in vivo than cells cultured in a well when equivalent doses
are applied. However this is less of a problem than if the reverse situation was to be the case.
The cell density, cell-types present (granulocytes are excluded from the PBMC fraction) and
cell flow-rate (nil in vitro) are examples of other conditions which differ between the in vivo and
in vitro situations. Further work to determine the effects of these differences on the MABEL of
TGN1412 would be of value. That said, if data from a co-culture assay had been used to
calculate a starting dose prior to the clinical trial, the starting dose would have been at least 17x
smaller than the dose given to the trial volunteers. It is likely that a smaller starting dose would
have been safer than the dose given during the trial, that is, of course, if the trial had been
allowed to go ahead in the face of significant TGN1412-stimulated cytokine release in vitro.
Despite efforts to optimize the experimental conditions for the co-culture assay,
TGN1412-stimulated increases in TNFα, IL-2 and IFNγ concentrations in 24 and 48 h co-
culture assays were considerably smaller than the concentrations measured in the blood of the
trial volunteers. It is possible that endothelial cells derived from human umbilical vein do not
have the same phenotype as endothelial cells involved in mediating TGN1412 responses in vivo.
Indeed, the heterogeneity of endothelial cells is widely acknowledged (Garlanda and Dejana,
1997) and those involved in vivo obviously would not have been of umbilical vein origin.
Unfortunately, when endothelial cells from a more physiologically relevant source, i.e. human
saphenous vein, were used instead of HUVEC in co-culture assays, background cytokine were
unacceptably large even in the absence of TGN1412 making it difficult to draw any conclusions
from the experiments.
In vitro culture of HUVEC may alter the expression of various molecules key to eliciting
TGN1412-stimulated responses. It was certainly found in the present study that different culture
conditions (implemented in two different laboratories) used for HUVEC from the same source
Page 239
Page 239 of 286
(TCS Biologicals, batch ZHC-2101) greatly affected the capability of these cells to mediate
TGN1412-stimulated responses in co-culture assays. This finding emphasises the importance of
culture conditions in maintaining endothelial cell phenotype. Indeed, it was shown in the present
study that an endothelial phenotype is important since fibroblasts from two different sources
(human gingiva and human foreskin) were poor mediators of TGN1412-stimulated responses in
co-culture assays. This is supported by an additional study conducted at NIBSC where the
capability of cells to evoke TGN1412-responses in co-culture assays (using the method
developed in this thesis) correlated with endothelial phenotype, defined by the expression of
constitutive and induced endothelial markers (Findlay et al., 2011b).
The small cytokine responses to TGN1412 in co-culture assays may reflect the fact that
only endothelial cells and PBMC were present. In vivo, endothelial cells may act in concert with
other cell-types, such as fibroblasts, smooth muscle cells or specialised APCs such as dendritic
cells, to mediate TGN1412-stimulated responses. Mature dendritic cells presenting antigen in
secondary lymphoid organs such as the lymph nodes express a high level of co-stimulatory
molecules required for T cell activation, in addition to the ligands for CD28. Such molecules
include ICAM-1 and LFA-3 (Lyerly et al., 2000; Kim et al., 2006) which in the work described
above were found to have a role in mediating TGN1412-stimulated cytokine responses in co-
culture assays. However, dendritic cells only exist in an immature state in peripheral blood (and
thus in PBMC) and these cells lack expression of co-stimulatory molecules (Lyerly et al., 2000).
Therefore, mature dendritic cells may have contributed to the mechanism of action of TGN1412
in vivo but may not have done so in co-culture assays.
As discussed in section 5.4, it is also possible that the small TGN1412-stimulated
responses in co-culture assays were the result of activation of different T cell subsets compared
with those activated by immobilised TGN1412 and with those activated in the trial volunteers. It
is likely that the mechanism by which TGN1412 stimulated responses in co-culture assays was
only part of what happened in the trial volunteers. In light of this, caution must be excised when
making ‘safe dose’ predictions for future mAbs with TGN1412-like activity entering into “first
time in man” clinical trials.
Page 240
Page 240 of 286
The concentrations of IL-6 released in response to TGN1412 in co-culture assays were
comparable to concentrations measured in the blood of the trial volunteers, unlike the
concentrations of IL-6 produced in response to immobilised TGN1412. HUVEC stimulated
with TNFα in this study released significant concentrations of IL-6 and so a likely mechanism is
that TNFα released in co-culture assays in response to TGN1412 acted upon endothelial cells,
stimulating the release of IL-6. It is likely that the smaller IL-6 responses of PBMC alone to
immobilised TGN1412 were due to the absence of an IL-6 contribution from endothelial cells
although clearly endothelial cells were not the sole source of IL-6 in co-culture assays as
discussed in section 6.4.5. As with TGN1412, IL-6 responses to Campath-1H were much larger
when the mAb was cultured with PBMC over a monolayer of endothelial cells. Therefore, it
would appear that the inclusion of a monolayer of endothelial cells in a PBMC based assay
improves the capability of the assay to predict IL-6 responses to medicines. In contrast to IL-6
responses, TNFα responses to TGN1412 in co-culture assays were smaller than TNFα responses
to immobilised TGN1412. It has been found previously that IL-6 inhibited the release of TNF
(and IL-1) from PBMC (Schindler et al., 1990). Therefore, it is possible that smaller TNFα
concentrations measured in co-culture assays compared with those measured in immobilisation
assays was, at least in part, a result of more inhibition of TNFα release by the larger
concentrations of IL-6 in the cell-conditioned media in co-culture assays.
Exactly why TGN1412 was able to stimulate responses in co-culture assays in aqueous
phase but not when incubated with PBMC alone is unclear. A number of possibilities were
investigated which led to a number of conclusions. Data from transwell experiments suggests
that endothelial cell to PBMC contact is required to initiate responses to TGN1412 in co-culture
and that the initial activation of T cells by TGN1412 is not through a soluble signal. The finding
that a conventional agonistic CD28 antibody did not stimulate cytokine or cell proliferative
responses in co-cultures assays suggests that a signal resulting from ligation of allogeneic MHC
class II molecules expressed by endothelial cells with the TCR was unlikely. In which case, this
interaction was unlikely to have played a role in mediating responses to TGN1412. It was also
concluded that it is unlikely that endothelial cells immobilised TGN1412 through Fc to Fc
receptor binding for reasons discussed in more detail in section 6.4.3.
Page 241
Page 241 of 286
What was found, however, was that the adhesion molecules LFA-3 and ICAM-1
promoted responses to TGN1412 in co-culture assays but not in assays in which immobilised
TGN1412 was incubated with PBMC alone. The reason for the latter is not clear but perhaps
responses of PBMC stimulated by immobilised TGN1412 were so large that they could not be
further augmented by co-stimulatory molecules expressed by PBMC. TGN1412-stimulated
responses in co-culture assays could not be completely inhibited by LFA-3 blockade suggesting
that other molecules were involved in the initiation of TGN1412-stimulated responses. It is
possible that T cells may make alternative use of adhesion/co-stimulatory molecules such that if
interaction with one molecule is prevented others could still perhaps initiate responses to
TGN1412. If this were to be the case, blocking antibodies specific for all adhesion/co-
stimulatory molecules involved would be required to entirely block TGN1412-stimulated
responses. Unfortunately the use of blocking antibodies is limited especially when pro-
inflammatory cytokine responses are readouts since “pyrogen-free” and “sodium-azide free” (a
preservative that is toxic to cells) antibodies are difficult to source. Of course when only
pyrogen/endotoxin-contaminated blocking antibodies are available, the readouts are limited to
those not affected by pyrogen/endotoxin such as IL-2 and cell-proliferation.
Findings from the co-culture experiments using blocking antibodies are consistent with
the notion that the interaction of various molecules expressed on the surface of endothelial cells
with their counterstructures expressed by T cells may promote the formation of an
immunological synapse at the endothelial cell/T cell interface. Within this synapse, LFA-3/CD2
and ICAM-1/LFA-1 interactions (and likely other interactions) may organise molecular
targets/signalling molecules in such a manner that negates the requirement for TGN1412 to be
immobilised in order to stimulate responses. The mechanisms underlying the effects that LFA-
3/CD2 interactions have on TGN1412-stimulated responses are not clear; this subject is
discussed in more detail in Chapter 6. In summary, LFA-3/CD2 interactions may promote the
aggregation of lipid rafts within the immunological synapse and thus signalling molecules such
as tyrosine kinases linked to the lipid rafts (Mestas and Hughes, 2001). The aggregation of lipid
rafts and associated signalling molecules within the immunological synapse may be mediated
by microfilaments as a result of LFA-3/CD2 interaction (Kaizuka et al., 2009). LFA-3/CD2
Page 242
Page 242 of 286
interactions may also promote the aggregation of activators of the tyrosine kinase Lck in the
immunological synapse but exclude inhibitors of Lck as suggested by Kaizuka et al. (2009)
albeit for T cell activation by APCs and not TGN1412. Another possible mechanism is that
TGN1412 may function by “boosting” signals resulting from LFA-3/CD2 interactions. This is
supported by evidence to suggest that superagonistic CD28 activation is reliant on low level
constitutive “background” signals emanating from unligated TCRs (Hunig and Dennehy, 2005)
and by the finding that, in the absence of TCR ligation, LFA-3/CD2 signalling involves the
same signalling molecules as TCR signalling (Kaizuka et al., 2009).
As discussed in Chapter 6, it has been suggested that, in vivo, microvessel endothelial
cells, such as those constituting venules, present foreign antigen from re-infecting pathogens
locally to memory T cells to stimulate a rapid recall response. The co-stimulatory molecules
expressed by endothelial cells which allow them to act as APCs in vivo may have also allowed
these cells to mediate T cell activation by TGN1412. Several studies have suggested that
endothelial cells are only capable of stimulating CD4+ memory T cell subsets but not naive T
cells (Pober and Cotran, 1991; Marelli-Berg et al., 1996; Pober et al., 1997; Ma and Pober,
1998; Murphy et al., 1999; Choi et al., 2004). It is thought that naive T cells have more stringent
activation requirements than memory T cell subsets and require specialised APCs (Choi et al.,
2004). One study suggested that microvascular endothelial cells are able to stimulate
transendothelial migration of CD4+ effector memory T cells (Pober and Sessa, 2007). The
finding that immobilised TGN1412 preferentially expands effector memory T cells (Eastwood
et al., 2010) is consistent with the fact that rapid responses to TGN1412 occurred during the
clinical trial (Suntharalingam et al., 2006). Effector memory T cells may therefore have been the
first T cell subset to be activated by TGN1412 in the trial volunteers. Given that endothelial
cells are believed to activate only memory T cell subsets during antigen presentation in vivo,
perhaps in co-culture assays involving endothelial cells, it is memory T cells that are activated
by TGN1412. Effector memory T cells exist in very low numbers in peripheral blood and this
could account in part for small IFNγ responses to TGN1412 in co-culture assays. In the study of
Eastwood et al. (2010), only after 48 – 72 h stimulations with immobilised TGN1412 were
larger concentrations of IFNγ detected in cell-conditioned medium. This incubation period of 48
Page 243
Page 243 of 286
– 72 h was required to allow TGN1412-stimulated naive and central memory T cells (in PBMC)
to mature into CD4+ effector memory T cells. However, concentrations of IFNγ in co-culture
assays were much smaller than those stimulated by immobilised TGN1412, even after 48 h
stimulation with TGN1412. It is possible that while immobilised TGN1412 is able to stimulate
both central memory and naive T cell maturation into effector memory T cells, in co-culture
assays using endothelial cells, perhaps central memory T cell maturation into effector memory T
cells but not naive T cell maturation is stimulated by TGN1412. In vivo, effector memory T
cells reside in tissues and are particularly abundant in the lungs and gastrointestinal mucosa
(Eastwood et al., 2010) but do not re-circulate through the lymph nodes, unlike central memory
T cells (see section 1.5). What is not clear is the logistics of exactly how abundant effector
memory T cells already in tissues could have interacted with endothelial cells forming venules
supplying the tissues. Central memory T cells may have been activated by TGN1412 in
microvessels during their circulation throughout the body, for example in the high endothelial
venules draining into the lymph nodes. However, responses mediated by central memory T cells
usually take longer (see section 1.5) and so these cells were unlikely to have been responsible
for the initial responses to TGN1412 in the clinical trial.
8.4 Other studies involving TGN1412 following its clinical trial
The two methods developed in this study for predicting TGN1412 activity were the first
to be published following the disastrous events of the TGN1412 clinical trial (Stebbings et al.,
2007; Findlay et al., 2010; Eastwood et al., 2010; Findlay et al., 2011a; Findlay et al., 2011b).
Studies have been carried out in other laboratories in an attempt to develop better methods for
predicting the capability of therapeutic mAbs (including TGN1412) to stimulate cytokine
release and in an attempt to better understand the mechanisms underlying TGN1412 toxicity.
Some of these methods were based upon findings from the studies described in the references
quoted above. After the discovery that immobilised TGN1412 can stimulate cytokine responses
from PBMC, one group evaluated the use of immobilising mAbs (including ANC28.1/5D10, a
mouse anti-human CD28 superagonist) on beads coated with Protein A to predict the capability
Page 244
Page 244 of 286
of these mAbs to stimulate cytokine release (Walker et al., 2011). Protein A binds with high
affinity to the Fc portion of some IgG antibodies and so can be used to immobilise mAbs
without disrupting their binding to target antigen. The authors showed that this method was able
to predict TGN1412-like activity since cytokine release by human whole blood stimulated with
the CD28 superagonist for 48 h were significantly larger than those in control wells where beads
were coated with autologous plasma. However, cytokine concentrations were considerably
smaller than those stimulated by TGN1412 immobilised directly onto plates in the present
study. This finding might be explained by the use of a different CD28 superagonist.
Unfortunately only whole blood was incubated with mAbs immobilised by Protein A-coated
beads and so a comparison between whole blood and PBMC could not be made.
The use of Protein A-coated beads is a more laborious and complex procedure than
directly coating the mAb onto plates. Furthermore, the use of Protein A-coated beads does not
provide a more physiologically relevant means for predicting TGN1412-like activity than the
mAb immobilisation methods already published (Stebbings et al., 2007). In addition to a CD28
superagonist, the authors tested 8 other therapeutic mAbs and used hierarchical cluster analysis
to show that the profile of cytokines stimulated by the CD28 superagonist was distinct from
profiles stimulated by other therapeutic mAbs. Consistent with the findings from both TGN1412
immobilisation assays and co-culture assays in the present study and the findings of Eastwood
et al. (2010), Walker et al (2011) reported that IL-2 stimulation was a cardinal feature of
TGN1412-like activity. As described in Chapter 6, the IL-2 released in co-culture assays in
response to TGN1412 clearly had a biological effect since when IL-2 was neutralised with an
anti-IL-2 mAb, cell proliferative responses were inhibited. During the clinical trial,
approximately 25 hours post-infusion of TGN1412, the trial volunteers were treated with an
anti-IL-2 receptor mAb because of the expected effects of TGN1412 on T cells (Suntharalingam
et al., 2006). This mAb binds to the α chain of the IL-2 receptor expressed by T cells preventing
IL-2 from binding to the receptor and subsequent T cell proliferation (Yang et al., 2010).
In addition to IL-2, however, Walker et al. (2011) showed that the CD28 superagonist
stimulated larger IL-4, IL-12 and IL-17 responses than were obtained with the other mAbs
tested which they suggested was also a feature of TGN1412-like activity. Indeed concentrations
Page 245
Page 245 of 286
of IL-4 were elevated in the blood of the trial volunteers though concentrations of IL-12 and IL-
17 were not reported (Suntharalingam et al., 2006).
The use of mAb immobilisation by Protein A-coated beads to compare cytokine
responses to therapeutic mAbs can be questioned. First, Protein A differentially binds different
IgG subclasses (Eliasson et al., 1989) and so differential cytokine release between mAbs could
reflect their affinity for Protein A. Second, it has been reported that Protein A itself (as a
bacterial antigen) can stimulate pro-inflammatory cytokine responses from monocytes (Tufano
et al., 1991). Third, binding of Protein A to the mAb is likely to affect Fc to Fc receptor
binding-mediated effector functions as it binds to a site close to the Fc receptor binding region
of IgG Fc (Deisenhofer, 1981; Walker et al., 2011). Therefore, cytokine release stimulated by
mAbs as a result of Fc-mediated mechanisms, may be affected or even not detected. That said,
Campath-1H, which works predominantly through ADCC, did stimulate IL-6 and IL-8
responses when immobilised by Protein A-coated beads.
In the study of Sandilands et al., (2010), mouse an anti-human CD28 superagonistic mAb
was immobilised by goat anti-mouse IgG coated wells of a microtitre plate. The same method
was previously described in the study of Stebbings et al., (2007), in which TGN1412
immobilised in this way stimulated lymphocyte proliferation and IL-2 release. This method was
not pursued in the present study because, in addition to being more time consuming and labour
intensive than coating TGN1412 directly onto wells, it did not prove possible to source a ‘clean’
TGN1412 capture antibody which did not itself stimulate pro-inflammatory cytokine release
from PBMC.
Sandilands et al. suggested that the rapid onset of clinical reactions to TGN1412 was
likely mediated by “faster-acting” cells such as monocytes (rather than lymphocytes) especially
since TNFα is commonly associated with activated monocytes (Sandilands et al., 2010). Using
the anti-IgG capture method, Sandilands et al. produced evidence to suggest that monocytes
were responsible for the initial rapid release of TNFα in the trial volunteers. Antibody-captured
CD28 superagonistic mAb stimulated TNFα release when incubated with purified monocytes
for 2 h. Furthermore, granulocytes were shown to express CD28, and CD28 specific mRNA was
upregulated following CD28 superagonist stimulation. These cells also underwent
Page 246
Page 246 of 286
morphological changes resulting in an appearance similar to those reported in the trial
volunteers (Suntharalingam et al., 2006). Initially after the trial it was assumed that the early
effects of TGN1412 were the result of T lymphocyte activation (as opposed to monocyte
activation) as it is these cells which predominantly express CD28. Indeed, several studies have
shown that lymphocytes release cytokines following 60 minute stimulations with immobilised
TGN1412 (Stebbings et al., 2007; Eastwood et al., 2010). It is possible, of course, that both
lymphocytes and granulocytes (including monocytes) are activated by TGN1412. In addition,
natural killer cells (another subset of lymphocytes) have been shown to express a variant of the
CD28 receptor (Galea-Lauri et al., 1999) and it is possible that TGN1412 may bind to this
receptor. Activated natural killer cells are producers of IFNγ and may have contributed to the
large quantities of IFNγ released in response to TGN1412 in the trial volunteers (Sandilands et
al., 2010).
Another model proposed by Sandilands et al. (2010) was that TGN1412 is immobilised
by FcγR1 expressed by endothelial cells but only when first bound to cells expressing CD28.
The authors speculated that target-bound TGN1412 would displace passively bound (to FcR)
IgG present within the blood. The authors showed that superagonistic anti-CD28-opsonised
PBMC stimulated TNFα release when incubated with HUVEC in a co-culture assay. However,
no comparison was made between superagonistic anti-CD28 mAb coated onto PBMC and
superagonistic anti-CD28 mAb incubated in aqueous phase in the co-cultures. It is therefore
difficult to determine if the anti-CD28 mAb used stimulated a response only because it was
bound to CD28-expressing cells prior to its addition to endothelial cells. Also, the CD28
superagonist used in the study of Sandilands et al., (2010) was a mouse IgG2a antibody which is
likely to have a different affinity for human FcR than TGN1412, a humanised IgG4 mAb. The
findings discussed in Chapter 6 of the present study suggest that it is unlikely that TGN1412 is
immobilised by endothelial cells.
Recently, a method has been reported by Romer et al., (2011) in which aqueous
TGN1412 was able to stimulate cytokine responses of PBMC alone. The authors’ speculated
that the failure of pre-clinical tests using PBMC to predict the cytokine storm stimulated by
TGN1412 was due to the loss of T cell priming which usually occurs in tissues and is mediated
Page 247
Page 247 of 286
by cell to cell contact. In tissues, when T cells scan MHC molecules expressed by other cells (in
search of cognitive antigen), weak background signalling events are thought to occur via the
TCR. This leads to the sub-threshold activation of T cells and is thought to improve the
responsiveness of T cells to cognitive antigen when it is encountered. It is thought that
background signalling via the TCR is lost by T cells in peripheral blood where cell to cell
contact is less likely. Since CD28 superagonist activation is dependent upon background TCR
signalling, as discussed earlier, the authors’ suggested that the lack of TGN1412-stimulated
responses of PBMC could be explained by the absence of background TCR signalling. It was
speculated that the “primed status” of T cells isolated from PBMC could be restored by the
introduction of a two-day high cell density pre-culture of PBMC prior to stimulation with
TGN1412. This pre-culture did indeed restore the capability of T cells to respond to aqueous
TGN1412. Furthermore, the inclusion of mAbs specific for MHC class I and II molecules in the
pre-culture prevented the restoration of responses to aqueous TGN1412 (Romer et al., 2011).
This theory points towards the notion that TGN1412 did not activate cells within the peripheral
blood of the trial volunteers, at least at first.
If the theory proposed by Romer et al., (2011) is true, it is not clear exactly how
immobilised TGN1412 bypasses the requirement for “background” signals via the TCR
achieved by a high cell density pre-culture of cells. Perhaps background signals are present but
are even weaker in assays using PBMC (without a high cell density pre-culture) with
immobilised TGN1412 compared with those achieved by a high cell density pre-culture. The
stronger background signals achieved by a pre-culture at high cell density may lower the
threshold of CD28 cross-linking required for T cell activation, allowing aqueous TGN1412 to
activate cells. Without the pre-culture, the higher CD28-cross linking threshold may only be
achieved by concentrating TGN1412 onto a surface. Endothelial cells in co-culture assays may
lower the activation threshold themselves by stimulating/augmenting background signals which
TGN1412 then boosts, resulting in activation. These signals may originate from MHC/TCR
interactions although this is questionable since constitutive expression of MHC molecules by
endothelial cells is unlikely as discussed in Chapter 6. A more plausible theory is that
interactions between co-stimulatory adhesion pairs expressed by endothelial cells and PBMC
Page 248
Page 248 of 286
stimulate/augment the background signalling required by TGN1412 as discussed earlier in
section 6.4.4.
8.5 Conclusions
To address the hypothesis of this study that cytokine-driven adverse effects of therapeutic
monoclonal antibodies and the mechanisms involved can be better predicted with novel in vitro
procedures using human cells, two methods have been developed, both of which involved the
use of human cells. Certainly both methods were better able to predict cytokine release
syndrome and cell proliferative responses stimulated by TGN1412 during its phase I clinical
trial than the in vivo and in vitro pre-clinical tests that were conducted.
Post-TGN1412, it is clear that animal models are not appropriate for the safety (and
efficacy) testing of all therapeutic mAbs. Therefore, more emphasis should be placed on the use
of in vitro tests using human tissue, given that TGN1412’s toxicity could have been predicted
by both of the in vitro methods developed in this study. The benefits gained from any procedure
developed for routine safety testing of biological medicines is related to the cost of the
procedure and its complexity to carry out. Time-consuming procedures requiring the use of
expensive, complex equipment and associated service contracts would be less favorable as
would procedures requiring a particularly high level of skill since the risk of error when
conducting the procedure is increased. The methods developed in this study offer a relatively
straightforward means to discriminate antibodies likely to precipitate a cytokine storm (like
TGN1412) from antibodies that are likely to stimulate cytokine release syndrome (like
Campath-1H) without the need for expensive, state-of-the-art equipment. Moreover, these
methods were able to predict cytokine release to antibodies with two distinct underlying
mechanisms for causing cytokine release, i.e. via activation of the target receptor and Fc-
mediated effector function. In addition, mAb-stimulated cytokine release in both methods
correlated with the frequency/severity of clinical infusion reactions/cytokine release syndrome
reported in the literature (see Chapter 7), with the exception of Herceptin in co-culture assays.
Page 249
Page 249 of 286
Of course, like most procedures, those developed in the present study are not without
their limitations. Immobilisation of an antibody onto a plastic surface has little physiological
relevance. Nevertheless, this artificial system better mimicked the magnitude of responses
stimulated by TGN1412 in the trial volunteers than the co-culture assay. Although the co-
culture procedure is more physiologically relevant, responding as it does to TGN1412 in
aqueous phase, the smaller cytokine responses suggest that it represents only part of the
underlying in vivo mechanism(s) of action of TGN1412. Another limitation of both procedures
is the difficulty often encountered in obtaining the human tissue required: relying on blood
donations from willing colleagues is not an option for all scientists. Although immortalized T
cell lines are commercially available, these may not behave in the same manner as T cells from
freshly isolated PBMC. In addition, sourcing fresh umbilical cords is not always easy due to
ethical constraints and logistical issues. For this reason, one objective of the present study was
to identify an alternative to fresh HUVEC from cords: an objective that was met when it was
shown that HUVECjr2 cells (pooled from multiple donors) responded to TGN1412 in much the
same way as fresh HUVEC from cords. The use of SCID (severe combined immunodeficiency)
mice, which can be successfully transplanted with human tissue, could be a potential tool for the
future testing of therapeutic biological medicines (Ito et al., 2002).
Despite their limitations, the methods using human cells developed in this study have
proved to be not only better than the usual pre-clinical tests at predicting cytokine release
caused by TGN1412 and other therapeutic mAbs but they have also proved to have value in
investigating the mechanism of action of TGN1412. The new methods are already being used in
the pharmaceutical industry to identify unwanted cytokine-releasing activities of candidate new
therapeutic mAbs and for identifying mitigation strategies. For example, the incubation of a
steroidal anti-inflammatory drug together with the mAb being tested would allow the evaluation
of the effectiveness of such drugs in diminishing cytokine release.
In addition, the new methods may be used to assess the effects of new mAbs given
concomitantly with other therapies. TGN1412 was developed as a candidate for the treatment of
arthritis. Pre-clinical studies had suggested that TGN1412 could be used safely in combination
with methotrexate, a treatment for arthritis that induces apoptosis of activated peripheral T cells
Page 250
Page 250 of 286
(Genestier et al., 1998; Paillot et al., 1998), because of the absence of any apparent interaction
(TeGenero AG, 2005a). However this suggestion was revealed to be flawed in light of the
TGN1412 clinical trial when it became evident that pre-clinical tests had not predicted the
clinical effects of TGN1412 alone.
The methods developed in this study may also be used to rank candidate therapeutic
mAbs with the same target according to their (unwanted) cytokine releasing activity in order to
identify the safest candidate. There is also potential for data from PBMC/HUVEC co-culture
assays to be used (in conjunction with other data) to make dose predictions for first time clinical
use since the mAb is incubated in aqueous phase (rather than being dried onto plastic which
precludes dose calculations). However, caution must be excised when extrapolating data from
an in vitro assay to the clinic.
The methods developed here may not be appropriate for predicting the toxic effects of all
mAbs as exemplified by Herceptin. When choosing an appropriate method, consideration
should be given to target location and its level of expression and the mechanism of action of the
mAb. Such factors could influence the human cell type(s) used, cytokines measured and
whether or not mAb immobilisation is necessary. Indeed it was a consensus decision made
during a European Medicines Agency sponsored workshop by 90 experts from the
pharmaceutical industry and regulatory agencies that the format of cytokine release assays for
predicting the toxic effects of mAbs should be “tailor-made” for the mAb tested (Vidal et al.,
2010). That said, the hypothesis that cytokine-driven adverse effects of therapeutic monoclonal
antibodies and the mechanisms involved can be better predicted with novel in vitro procedures
using human cells is strongly supported by the data described in this thesis, with the methods
facilitating the passage of safe therapeutic mAbs into phase I clinical trials.
Page 251
Page 251 of 286
8.6 Summary of key findings from the present study
8.6.1 Antibody immobilisation experiments
Procedures involving the incubation of TGN1412 in aqueous phase with human
PBMC/whole blood were not predictive of its adverse effects when given in man.
When immobilised onto plastic, TGN1412 was capable of stimulating responses from
human PBMC which mimicked the in vivo responses.
The technique used for mAb immobilisation (i.e. wet-coating or air-drying) and the type
of microplate onto which the mAb was immobilised influenced the size of the responses.
Wet-coating onto the polystyrene microplates described in section 4.2.1 resulted in a
lower amount of immobilised TGN1412 orientated such that it was capable of binding to
CD28, compared with other techniques.
TGN1412-stimulated cytokine responses of whole blood were much smaller than those of
PBMC.
Aqueous TGN1412 inhibited TNFα responses of PBMC to immobilised TGN1412. This
is consistent with the notion that polarised binding of TGN1412 with CD28 is required
for this mAb to stimulate responses.
The rapid release of TNFα within 30 minutes of adding PBMC to immobilised TGN1412
was, at least in part, a result of de novo synthesis of TNFα.
Therapeutic mAbs in addition to TGN1412, when immobilised, stimulated a graded
increase in IL-6 and IL-8 release with the frequency/severity of pro-inflammatory clinical
infusion reactions reported in the literature.
8.6.2 Co-culture experiments
The inclusion of a monolayer of human endothelial cells in PBMC-based assays allowed
TGN1412 added in aqueous phase to stimulate cytokine and cell proliferative responses.
The inclusion of a monolayer of fibroblasts did not have the same effect.
Page 252
Page 252 of 286
HUVECjr2 can be used as a substitute for fresh HUVEC.
Endothelial cell to PBMC contact was required in order for TGN1412 to stimulate TNFα,
IL-6 and IL-2 responses.
Cytokine and cell proliferative responses in co-culture assays were not stimulated by a
conventional CD28 agonistic mAb suggesting that responses to TGN1412 were not a
result of co-culturing allogeneic cells.
Immobilisation of TGN1412 by endothelial cells was unlikely to be the mechanism
through which TGN1412 was able to stimulate responses in co-culture assays.
LFA-3 promoted TNFα, IL-2 and cell proliferative responses to TGN1412 in the co-
culture method but not IL-6 responses. ICAM-1 promoted cell proliferative responses in
the co-culture method. Neither LFA-3 nor ICAM-1 promoted responses stimulated by
immobilised TGN1412.
TGN1412-stimulated cell-proliferative responses were, at least in part, a result of IL-2
activity.
Endothelial cells stimulated with TNFα released IL-6 into the culture medium and so
were likely to have been, at least in part, responsible for the larger TGN1412-stimulated
IL-6 responses in co-culture assays compared with those from PBMC alone stimulated by
immobilised TGN1412.
TNFα, IL-2 and IFNγ concentrations produced in response to TGN1412 in co-culture
assays were small in comparison with those measured in the serum of the trial volunteers
suggesting that this method is only partially representative of the in vivo mechanisms of
cytokine release.
As with the mAb immobilisation method, the co-culture assay was capable of predicting
the cytokine release frequently associated with Campath-1H infusions and could
discriminate these responses from the cardinal features of TGN1412-like activity.
Page 253
Page 253 of 286
8.7 Future studies
The findings from this study have opened a number of avenues for further work, of
course, time permitting. The use of microscopy to visualise patterns of CD28 clustering (and
that of associated signalling molecules) following ligation with immobilised and aqueous
TGN1412 may help to elucidate the mechanisms involved in the activation of cells.
Further work to identify which endothelial cell-expressed, membrane-bound, co-
stimulatory molecules (in addition to the ones identified here) activate signalling pathways in
TGN1412-stimulated T-cells in co-culture assays would perhaps allow further conclusions to be
drawn. This could be achieved with the use of blocking antibodies or with the use of inhibitory
RNA to block the expression of specific co-stimulatory molecules. It may be necessary to
incubate different “cocktails” of blocking antibodies with different specificities in co-culture
assays to fully block TGN1412-stimulated responses. The importance of any one co-stimulatory
molecule to the initiation of responses stimulated by TGN1412 in co-culture assays could be
investigated by incubating TGN1412 with PBMC/T cells and with immobilised
recombinant/purified preparations of the co-stimulatory molecules.
The role of the co-stimulatory molecules identified from the above experiments in
promoting the formation of a “favourably organised” immunological synapse allowing aqueous
TGN1412 to stimulate responses could subsequently be evaluated. Lipid raft aggregation and
the movement of microfilaments are associated with the formation of the immunological
synapse. The effect of, for example, LFA-3 blocking antibodies on lipid raft aggregation could
be visualised at the T cell:endothelial cell interface using fluorescently labelled cholera toxin B
which binds gangliosides associated with lipid rafts. The role of lipid raft aggregation in
mediating TGN1412-stimulated responses could be confirmed using MβCD (methyl-beta-
cyclodextrin) which disrupts lipid raft aggregation by removing cholesterol from the cell
membrane (Mestas and Hughes, 2001). In addition, latrunculin B de-polymerises actin filaments
(Kaizuka et al., 2009) and so could be used to correlate the inhibitory effects of, for example,
LFA-3 blocking antibody on TGN1412-stimulated responses in co-culture assays, with
microfilament activity.
Page 254
Page 254 of 286
Further experiments using flow cytometric techniques could be employed to investigate
which cell populations/sub-populations are activated by TGN1412, at what stage they are
activated and the cytokines that the different cell subsets produce. This would give further
insight as to physiological relevance of co-culture assays and to the mechanisms involved in the
superagonistic activity of anti-CD28 mAbs allowing their future potential as research tools or
even as therapeutic mAbs to be assessed. It would also be useful to expand the range of
therapeutic mAbs tested and cytokines measured (perhaps with the use of a multiplexing
system) in the assays developed in the present study. This would further validate these methods
for predicting the toxic effects of mAbs.
Page 255
Page 255 of 286
References
Acuto, O. and Michel, F., 2003. CD28-mediated co-stimulation: a quantitative support for TCR
signalling. Nat. Rev. Immunol. 3, 939.
Adams, P.W., Lee, H.S., Waldman, W.J., Sedmak, D.D., Morgan, C.J., Ward, J.S. and Orosz,
C.G., 1992. Alloantigenicity of human endothelial cells. 1. Frequency and phenotype of human
T helper lymphocytes that can react to allogeneic endothelial cells. J. Immunol. 148, 3753.
Aggarwal, B.B., 2000. Tumour necrosis factors receptor associated signalling molecules and
their role in activation of apoptosis, JNK and NF-kappaB. Ann. Rheum. Dis. 59, 6.
Angal, S., King, D.J., Bodmer, M.W., Turner, A., Lawson, A.D., Roberts, G., Pedley, B. and
Adair, J.R., 1993. A single amino acid substitution abolishes the heterogeneity of chimeric
mouse/human (IgG4) antibody. Mol. Immunol. 30, 105.
Appleman, L.J., Berezovskaya, A., Grass, I. and Boussiotis, V.A., 2000. CD28 costimulation
mediates T cell expansion via IL-2-independent and IL-2-dependent regulation of cell cycle
progression. J. Immunol. 164, 144.
Arnould, L., Gelly, M., Penault-Llorca, F., Benoit, L., Bonnetain, F., Migeon, C., Cabaret, V.,
Fermeaux, V., Bertheau, P., Garnier, J., Jeannin, J.F. and Coudert, B., 2006. Trastuzumab-based
treatment of HER2-positive breast cancer: an antibody-dependent cellular cytotoxicity
mechanism? Br. J. Cancer 94, 259.
Awan, F.T., Lapalombella, R., Trotta, R., Butchar, J.P., Yu, B., Benson, D.M., Jr., Roda, J.M.,
Cheney, C., Mo, X., Lehman, A., Jones, J., Flynn, J., Jarjoura, D., Desjarlais, J.R.,
Tridandapani, S., Caligiuri, M.A., Muthusamy, N. and Byrd, J.C., 2010. CD19 targeting of
chronic lymphocytic leukemia with a novel Fc-domain-engineered monoclonal antibody. Blood
115, 1204.
Page 256
Page 256 of 286
Bachmann, M.F., Kall-Faienza, K., Schmits, R., Bouchard, D., Beach, J., Speiser, D.E., Mak,
T.W. and Ohashi, P.S., 1997. Distinct roles for LFA-1 and CD28 during activation of naive T
cells: adhesion versus costimulation. Immunity 7, 549.
Bachmann, M.F. and Oxenius, A., 2007. Interleukin 2: from immunostimulation to
immunoregulation and back again. EMBO Rep. 8, 1142.
Batista, A., Millan, J., Mittelbrunn, M., Sanchez-Madrid, F. and Alonso, M.A., 2004.
Recruitment of transferrin receptor to immunological synapse in response to TCR engagement.
J. Immunol. 172, 6709.
BBC. Drug trial victim's 'hell' months. 2006. http://news.bbc.co.uk/1/hi/health/5121824.stm
Bella, J., Kolatkar, P.R., Marlor, C.W., Greve, J.M. and Rossmann, M.G., 1998. The structure
of the two amino-terminal domains of human ICAM-1 suggests how it functions as a rhinovirus
receptor and as an LFA-1 integrin ligand. Proc. Natl. Acad. Sci. U. S. A. 95, 4140.
Beyersdorf, N., Hanke, T., Kerkau, T. and Hunig, T., 2005. Superagonistic anti-CD28
antibodies: potent activators of regulatory T cells for the therapy of autoimmune diseases. Ann.
Rheum. Dis. 64, 91.
Bhogal, N. and Combes, R., 2006. TGN1412: time to change the paradigm for the testing of
new pharmaceuticals. Altern. Lab Anim. 34, 225.
Bhogal, N. and Combes, R., 2007. Immunostimulatory antibodies: challenging the drug testing
paradigm. Toxicol. In Vitro 21, 1227.
Bischof, A., Hara, T., Lin, C.H., Beyers, A.D. and Hunig, T., 2000. Autonomous induction of
proliferation, JNK and NF-alphaB activation in primary resting T cells by mobilized CD28. Eur.
J. Immunol. 30, 876.
Bjerke, J.R., Livden, J.K. and Matre, R., 1988. Fc gamma-receptors and HLA-DR antigens on
endothelial cells in psoriatic skin lesions. Acta Derm. Venereol. 68, 306.
Page 257
Page 257 of 286
Boehm, U., Klamp, T., Groot, M. and Howard, J.C., 1997. Cellular responses to interferon-
gamma. Annu. Rev. Immunol. 15, 749.
Boise, L.H., Minn, A.J., Noel, P.J., June, C.H., Accavitti, M.A., Lindsten, T. and Thompson,
C.B., 1995. CD28 costimulation can promote T cell survival by enhancing the expression of
Bcl-XL. Immunity 3, 87.
Brennan, F.R., Morton, L.D., Spindeldreher, S., Kiessling, A., Allenspach, R., Hey, A., Muller,
P.Y., Frings, W. and Sims, J., 2010. Safety and immunotoxicity assessment of
immunomodulatory monoclonal antibodies. MAbs. 2, 233.
Breslin, S., 2007. Cytokine-release syndrome: overview and nursing implications. Clin. J.
Oncol. Nurs. 11, 37.
Bugelski, P.J., Achuthanandam, R., Capocasale, R.J., Treacy, G. and Bouman-Thio, E., 2009.
Monoclonal antibody-induced cytokine-release syndrome. Expert. Rev. Clin. Immunol. 5, 499.
Burn, P., Kupfer, A. and Singer, S.J., 1988. Dynamic membrane-cytoskeletal interactions:
specific association of integrin and talin arises in vivo after phorbol ester treatment of peripheral
blood lymphocytes. Proc. Natl. Acad. Sci. U. S. A. 85, 497.
Burns, C.J., Silva, M.M., Gray, E. and Robinson, C.J., 2008. Quantitative RT-PCR as an
alternative to late-stage bioassays for vascular endothelial growth factor. J. Pharm. Biomed.
Anal. 47, 460.
Buzza, M.S. and Bird, P.I., 2006. Extracellular granzymes: current perspectives. Biol. Chem.
387, 827.
Campbell, J.J., Murphy, K.E., Kunkel, E.J., Brightling, C.E., Soler, D., Shen, Z., Boisvert, J.,
Greenberg, H.B., Vierra, M.A., Goodman, S.B., Genovese, M.C., Wardlaw, A.J., Butcher, E.C.
and Wu, L., 2001. CCR7 expression and memory T cell diversity in humans. J. Immunol. 166,
877.
Page 258
Page 258 of 286
Cantwell, M., Hua, T., Pappas, J. and Kipps, T.J., 1997. Acquired CD40-ligand deficiency in
chronic lymphocytic leukemia. Nat. Med. 3, 984.
Chen, J., Bruns, A.H., Donnelly, H.K. and Wunderink, R.G., 2010. Comparative in vitro
stimulation with lipopolysaccharide to study TNFalpha gene expression in fresh whole blood,
fresh and frozen peripheral blood mononuclear cells. J. Immunol. Methods 357, 33.
Cheng, L.E., Ohlen, C., Nelson, B.H. and Greenberg, P.D., 2002. Enhanced signaling through
the IL-2 receptor in CD8+ T cells regulated by antigen recognition results in preferential
proliferation and expansion of responding CD8+ T cells rather than promotion of cell death.
Proc. Natl. Acad. Sci. U. S. A. 99, 3001.
Chi, L., Li, Y., Stehno-Bittel, L., Gao, J., Morrison, D.C., Stechschulte, D.J. and Dileepan,
K.N., 2001. Interleukin-6 production by endothelial cells via stimulation of protease-activated
receptors is amplified by endotoxin and tumor necrosis factor-alpha. J. Interferon Cytokine Res.
21, 231.
Chichili, G.R. and Rodgers, W., 2009. Cytoskeleton-membrane interactions in membrane raft
structure. Cell Mol. Life Sci. 66, 2319.
Chirathaworn, C., Kohlmeier, J.E., Tibbetts, S.A., Rumsey, L.M., Chan, M.A. and Benedict,
S.H., 2002. Stimulation through intercellular adhesion molecule-1 provides a second signal for
T cell activation. J. Immunol. 168, 5530.
Choi, J., Enis, D.R., Koh, K.P., Shiao, S.L. and Pober, J.S., 2004. T lymphocyte-endothelial cell
interactions. Annu. Rev. Immunol. 22, 683.
Chung, C.H., 2008. Managing premedications and the risk for reactions to infusional
monoclonal antibody therapy. Oncologist 13, 725.
Collette, Y., Razanajaona, D., Ghiotto, M. and Olive, D., 1997. CD28 can promote T cell
survival through a phosphatidylinositol 3-kinase-independent mechanism. Eur. J. Immunol. 27,
3283.
Page 259
Page 259 of 286
Collins, A.V., Brodie, D.W., Gilbert, R.J., Iaboni, A., Manso-Sancho, R., Walse, B., Stuart,
D.I., van der Merwe, P.A. and Davis, S.J., 2002. The interaction properties of costimulatory
molecules revisited. Immunity 17, 201.
Collins, T., Korman, A.J., Wake, C.T., Boss, J.M., Kappes, D.J., Fiers, W., Ault, K.A.,
Gimbrone, M.A., Jr., Strominger, J.L. and Pober, J.S., 1984. Immune interferon activates
multiple class II major histocompatibility complex genes and the associated invariant chain
gene in human endothelial cells and dermal fibroblasts. Proc. Natl. Acad. Sci. U. S. A. 81, 4917.
Davis, D.M. and Dustin, M.L., 2004. What is the importance of the immunological synapse?
Trends Immunol. 25, 323.
Deisenhofer, J., 1981. Crystallographic refinement and atomic models of a human Fc fragment
and its complex with fragment B of protein A from Staphylococcus aureus at 2.9- and 2.8-A
resolution. Biochemistry 20, 2361.
Dennehy, K.M., Elias, F., Na, S.Y., Fischer, K.D., Hunig, T. and Luhder, F., 2007. Mitogenic
CD28 signals require the exchange factor Vav1 to enhance TCR signaling at the SLP-76-Vav-
Itk signalosome. J. Immunol. 178, 1363.
Dennehy, K.M., Elias, F., Zeder-Lutz, G., Ding, X., Altschuh, D., Luhder, F. and Hunig, T.,
2006. Cutting edge: monovalency of CD28 maintains the antigen dependence of T cell
costimulatory responses. J. Immunol. 176, 5725.
Dennehy, K.M., Kerstan, A., Bischof, A., Park, J.H., Na, S.Y. and Hunig, T., 2003. Mitogenic
signals through CD28 activate the protein kinase Ctheta-NF-kappaB pathway in primary
peripheral T cells. Int. Immunol. 15, 655.
Denton, M.D., Geehan, C.S., Alexander, S.I., Sayegh, M.H. and Briscoe, D.M., 1999.
Endothelial cells modify the costimulatory capacity of transmigrating leukocytes and promote
CD28-mediated CD4(+) T cell alloactivation. J. Exp. Med. 190, 555.
Page 260
Page 260 of 286
Dillman, R.O., 1999. Infusion reactions associated with the therapeutic use of monoclonal
antibodies in the treatment of malignancy. Cancer Metastasis Rev. 18, 465.
Dustin, M.L., 2007. Cell adhesion molecules and actin cytoskeleton at immune synapses and
kinapses. Curr. Opin. Cell Biol. 19, 529.
Dustin, M.L., 2009. Modular design of immunological synapses and kinapses. Cold Spring
Harb. Perspect. Biol. 1, 002873.
Dustin, M.L., Chakraborty, A.K. and Shaw, A.S., 2010. Understanding the structure and
function of the immunological synapse. Cold Spring Harb. Perspect. Biol. 2, 002311.
Dustin, M.L., Sanders, M.E., Shaw, S. and Springer, T.A., 1987. Purified lymphocyte function-
associated antigen 3 binds to CD2 and mediates T lymphocyte adhesion. J. Exp. Med. 165, 677.
Dustin, M.L. and Shaw, A.S., 1999. Costimulation: building an immunological synapse.
Science 283, 649.
Eastwood, D., Findlay, L., Poole, S., Bird, C., Wadhwa, M., Moore, M., Burns, C., Thorpe, R.
and Stebbings, R., 2010. Monoclonal antibody TGN1412 trial failure explained by species
differences in CD28 expression on CD4+ effector memory T-cells. Br. J. Pharmacol. 161, 512.
Edelman, G.M., Cunningham, B.A., Gall, W.E., Gottlieb, P.D., Rutishauser, U. and Waxdal,
M.J., 1969. The covalent structure of an entire gammaG immunoglobulin molecule. Proc. Natl.
Acad. Sci. U. S. A. 63, 78.
Ehrenstein, M.R., Evans, J.G., Singh, A., Moore, S., Warnes, G., Isenberg, D.A. and Mauri, C.,
2004. Compromised function of regulatory T cells in rheumatoid arthritis and reversal by anti-
TNFalpha therapy. J. Exp. Med. 200, 277.
Elflein, K., Rodriguez-Palmero, M., Kerkau, T. and Hunig, T., 2003. Rapid recovery from T
lymphopenia by CD28 superagonist therapy. Blood 102, 1764.
Page 261
Page 261 of 286
Eliasson, M., Andersson, R., Olsson, A., Wigzell, H. and Uhlen, M., 1989. Differential IgG-
binding characteristics of staphylococcal protein A, streptococcal protein G, and a chimeric
protein AG. J. Immunol. 142, 575.
Erbe, D.V., Collins, J.E., Shen, L., Graziano, R.F. and Fanger, M.W., 1990. The effect of
cytokines on the expression and function of Fc receptors for IgG on human myeloid cells. Mol.
Immunol. 27, 57.
European Medicines Agency, C.f.M.P.f.H.U. Guideline on strategies to identify and mitigate
risks for first-in-human clinical trials with investigational medicinal products. 2007.
http://www.ema.europa.eu/docs/en_GB/document_library/Scientific_guideline/2009/09/WC500
002988.pdf
Evans, E.J., Esnouf, R.M., Manso-Sancho, R., Gilbert, R.J., James, J.R., Yu, C., Fennelly, J.A.,
Vowles, C., Hanke, T., Walse, B., Hunig, T., Sorensen, P., Stuart, D.I. and Davis, S.J., 2005.
Crystal structure of a soluble CD28-Fab complex. Nat. Immunol. 6, 271.
Expert Group on Phase One Clinical Trials: Final report. 2006.
http://www.dh.gov.uk/en/Publicationsandstatistics/Publications/PublicationsPolicyAndGuidanc
e/DH_063117
Faveeuw, C., Di Mauro, M.E., Price, A.A. and Ager, A., 2000. Roles of alpha(4)
integrins/VCAM-1 and LFA-1/ICAM-1 in the binding and transendothelial migration of T
lymphocytes and T lymphoblasts across high endothelial venules. Int. Immunol. 12, 241.
Findlay, L., Eastwood, D., Ball, C., Robinson, C.J., Bird, C., Wadhwa, M., Thorpe, S.J.,
Thorpe, R., Stebbings, R. and Poole, S., 2011a. Comparison of novel methods for predicting the
risk of pro-inflammatory clinical infusion reactions during monoclonal antibody therapy. J.
Immunol. Methods 371, 134.
Page 262
Page 262 of 286
Findlay, L., Eastwood, D., Stebbings, R., Sharp, G., Mistry, Y., Ball, C., Hood, J., Thorpe, R.
and Poole, S., 2010. Improved in vitro methods to predict the in vivo toxicity in man of
therapeutic monoclonal antibodies including TGN1412. J. Immunol. Methods 352, 1.
Findlay, L., Sharp, G., Fox, B., Ball, C., Robinson, C.J., Bird, C., Stebbings, R., Eastwood, D.,
Wadhwa, M., Poole, S., Thorpe, R. and Thorpe, S.J., 2011b. Endothelial cells co-stimulate
peripheral blood mononuclear cell responses to monoclonal antibody TGN1412 in culture.
Cytokine 55, 141.
Flecknell, P., 2002. Replacement, reduction and refinement. ALTEX. 19, 73.
Gaines Das, R.E., Brugger, P., Patel, M., Mistry, Y. and Poole, S., 2004. Monocyte activation
test for pro-inflammatory and pyrogenic contaminants of parenteral drugs: test design and data
analysis. J. Immunol. Methods 288, 165.
Galea-Lauri, J., Darling, D., Gan, S.U., Krivochtchapov, L., Kuiper, M., Gaken, J.,
Souberbielle, B. and Farzaneh, F., 1999. Expression of a variant of CD28 on a subpopulation of
human NK cells: implications for B7-mediated stimulation of NK cells. J. Immunol. 163, 62.
Garlanda, C. and Dejana, E., 1997. Heterogeneity of endothelial cells. Specific markers.
Arterioscler. Thromb. Vasc. Biol. 17, 1193.
Genestier, L., Paillot, R., Fournel, S., Ferraro, C., Miossec, P. and Revillard, J.P., 1998.
Immunosuppressive properties of methotrexate: apoptosis and clonal deletion of activated
peripheral T cells. J. Clin. Invest 102, 322.
Gergely, P., Bakacs, T., Cornain, S. and Klein, E., 1977. Fc receptors on human blood B
lymphocytes. Clin. Exp. Immunol. 28, 99.
Gillis, S., Ferm, M.M., Ou, W. and Smith, K.A., 1978. T cell growth factor: parameters of
production and a quantitative microassay for activity. J. Immunol. 120, 2027.
Gogishvili, T., Elias, F., Emery, J.L., McPherson, K., Okkenhaug, K., Hunig, T. and Dennehy,
K.M., 2008. Proliferative signals mediated by CD28 superagonists require the exchange factor
Page 263
Page 263 of 286
Vav1 but not phosphoinositide 3-kinase in primary peripheral T cells. Eur. J. Immunol. 38,
2528.
Hamann, A., Andrew, D.P., Jablonski-Westrich, D., Holzmann, B. and Butcher, E.C., 1994.
Role of alpha 4-integrins in lymphocyte homing to mucosal tissues in vivo. J. Immunol. 152,
3282.
Hanke, T., 2006. Lessons from TGN1412. Lancet 368, 1569.
Hansel, T.T., Kropshofer, H., Singer, T., Mitchell, J.A. and George, A.J., 2010. The safety and
side effects of monoclonal antibodies. Nat. Rev. Drug Discov. 9, 325.
Hehner, S.P., Hofmann, T.G., Dienz, O., Droge, W. and Schmitz, M.L., 2000. Tyrosine-
phosphorylated Vav1 as a point of integration for T-cell receptor- and CD28-mediated
activation of JNK, p38, and interleukin-2 transcription. J. Biol. Chem. 275, 18160.
Hellwig, K., Schimrigk, S., Fischer, M., Haghikia, A., Muller, T., Chan, A. and Gold, R., 2008.
Allergic and nonallergic delayed infusion reactions during natalizumab therapy. Arch. Neurol.
65, 656.
Hicks, C., Cooley, M.A. and Penny, R., 1991. Investigation of interleukin 2 receptors on human
endothelial cells. Growth Factors 5, 201.
Huang, J., Lo, P.F., Zal, T., Gascoigne, N.R., Smith, B.A., Levin, S.D. and Grey, H.M., 2002.
CD28 plays a critical role in the segregation of PKC theta within the immunologic synapse.
Proc. Natl. Acad. Sci. U. S. A. 99, 9369.
Huang, N.L., Juang, J.M., Wang, Y.H., Hsueh, C.H., Liang, Y.J., Lin, J.L., Tsai, C.T. and Lai,
L.P., 2010. Rimonabant inhibits TNF-alpha-induced endothelial IL-6 secretion via CB1 receptor
and cAMP-dependent protein kinase pathway. Acta Pharmacol. Sin. 31, 1447.
Hughes, C.C. and Pober, J.S., 1993. Costimulation of peripheral blood T cell activation by
human endothelial cells. Enhanced IL-2 transcription correlates with increased c-fos synthesis
and increased Fos content of AP-1. J. Immunol. 150, 3148.
Page 264
Page 264 of 286
Hughes, C.C., Savage, C.O. and Pober, J.S., 1990. Endothelial cells augment T cell interleukin
2 production by a contact-dependent mechanism involving CD2/LFA-3 interaction. J. Exp.
Med. 171, 1453.
Hunig, T. and Dennehy, K., 2005. CD28 superagonists: mode of action and therapeutic
potential. Immunol. Lett. 100, 21.
Huppa, J.B. and Davis, M.M., 2003. T-cell-antigen recognition and the immunological synapse.
Nat. Rev. Immunol. 3, 973.
Hviid, L., Odum, N. and Theander, T.G., 1993. The relation between T-cell expression of LFA-
1 and immunological memory. Immunology 78, 237.
Isakov, N. and Biesinger, B., 2000. Lck protein tyrosine kinase is a key regulator of T-cell
activation and a target for signal intervention by Herpesvirus saimiri and other viral gene
products. Eur. J. Biochem. 267, 3413.
Ito, M., Hiramatsu, H., Kobayashi, K., Suzue, K., Kawahata, M., Hioki, K., Ueyama, Y.,
Koyanagi, Y., Sugamura, K., Tsuji, K., Heike, T. and Nakahata, T., 2002.
NOD/SCID/gamma(c)(null) mouse: an excellent recipient mouse model for engraftment of
human cells. Blood 100, 3175.
Jenkins, M.K., 1994. The ups and downs of T cell costimulation. Immunity 1, 443.
Kaizuka, Y., Douglass, A.D., Vardhana, S., Dustin, M.L. and Vale, R.D., 2009. The coreceptor
CD2 uses plasma membrane microdomains to transduce signals in T cells. J. Cell Biol. 185,
521.
Kandula, S. and Abraham, C., 2004. LFA-1 on CD4+ T cells is required for optimal antigen-
dependent activation in vivo. J. Immunol. 173, 4443.
Kaneko, E. and Niwa, R., 2011. Optimizing therapeutic antibody function: progress with Fc
domain engineering. BioDrugs. 25, 1.
Page 265
Page 265 of 286
Kanner, S.B., Damle, N.K., Blake, J., Aruffo, A. and Ledbetter, J.A., 1992. CD2/LFA-3 ligation
induces phospholipase-C gamma 1 tyrosine phosphorylation and regulates CD3 signaling. J.
Immunol. 148, 2023.
Karmann, K., Hughes, C.C., Schechner, J., Fanslow, W.C. and Pober, J.S., 1995. CD40 on
human endothelial cells: inducibility by cytokines and functional regulation of adhesion
molecule expression. Proc. Natl. Acad. Sci. U. S. A. 92, 4342.
Kenter, M.J. and Cohen, A.F., 2006. Establishing risk of human experimentation with drugs:
lessons from TGN1412. Lancet 368, 1387.
Khayyamian, S., Hutloff, A., Buchner, K., Grafe, M., Henn, V., Kroczek, R.A. and Mages,
H.W., 2002. ICOS-ligand, expressed on human endothelial cells, costimulates Th1 and Th2
cytokine secretion by memory CD4+ T cells. Proc. Natl. Acad. Sci. U. S. A 99, 6198.
Kim, R., Emi, M. and Tanabe, K., 2006. Functional roles of immature dendritic cells in
impaired immunity of solid tumour and their targeted strategies for provoking tumour
immunity. Clin. Exp. Immunol. 146, 189.
Kubota, T., Niwa, R., Satoh, M., Akinaga, S., Shitara, K. and Hanai, N., 2009. Engineered
therapeutic antibodies with improved effector functions. Cancer Sci. 100, 1566.
Kuby, J., 1997. Immunology, Third Edition.
Kuhns, M.S., Davis, M.M. and Garcia, K.C., 2006. Deconstructing the form and function of the
TCR/CD3 complex. Immunity 24, 133.
Kunitomi, A., Hori, T., Imura, A. and Uchiyama, T., 2000. Vascular endothelial cells provide T
cells with costimulatory signals via the OX40/gp34 system. J. Leukoc. Biol. 68, 111.
Labrijn, A.F., Buijsse, A.O., van den Bremer, E.T., Verwilligen, A.Y., Bleeker, W.K., Thorpe,
S.J., Killestein, J., Polman, C.H., Aalberse, R.C., Schuurman, J., van de Winkel, J.G. and
Parren, P.W., 2009. Therapeutic IgG4 antibodies engage in Fab-arm exchange with endogenous
human IgG4 in vivo. Nat. Biotechnol. 27, 767.
Page 266
Page 266 of 286
Lacasse, C., Turcotte, S., Gingras, D. and RolaPleszczynski, M., 1996. Adhesion-independent
synergy of monocytes and endothelial cells in cytokine production: Regulation of IL-6 and GM-
CSF production by PAF. Mediators of Inflammation 5, 56.
Lacorre, D.A., Baekkevold, E.S., Garrido, I., Brandtzaeg, P., Haraldsen, G., Amalric, F. and
Girard, J.P., 2004. Plasticity of endothelial cells: rapid dedifferentiation of freshly isolated high
endothelial venule endothelial cells outside the lymphoid tissue microenvironment. Blood 103,
4164.
Langer, J.A., Rashidbaigi, A., Garotta, G. and Kempner, E., 1994. Radiation inactivation of
human gamma-interferon: cellular activation requires two dimers. Proc. Natl. Acad. Sci. U. S.
A. 91, 5818.
Lanzavecchia, A. and Sallusto, F., 2005. Understanding the generation and function of memory
T cell subsets. Curr. Opin. Immunol. 17, 326.
Le Bert, N., Chain, B.M., Rook, G. and Noursadeghi, M., 2011. DC priming by M. vaccae
inhibits Th2 responses in contrast to specific TLR2 priming and is associated with selective
activation of the CREB pathway. PLoS. One 6, 18346.
Lehnert, K., Print, C.G., Yang, Y. and Krissansen, G.W., 1998. MAdCAM-1 costimulates T cell
proliferation exclusively through integrin alpha4beta7, whereas VCAM-1 and CS-1 peptide use
alpha4beta1: evidence for "remote" costimulation and induction of hyperresponsiveness to B7
molecules. Eur. J. Immunol. 28, 3605.
Li, M. and Beg, A.A., 2000. Induction of necrotic-like cell death by tumor necrosis factor alpha
and caspase inhibitors: novel mechanism for killing virus-infected cells. J. Virol. 74, 7470.
Li, P.G., Ivaldi, F., Moretti, P., Risso, M., Tripodi, G. and Manca, F., 2010. Validation of a
miniaturized assay based on IFNg secretion for assessment of specific T cell immunity. J.
Immunol. Methods 355, 68.
Page 267
Page 267 of 286
Liebsch, M., Grune, B., Seiler, A., Butzke, D., Oelgeschlager, M., Pirow, R., Adler, S.,
Riebeling, C. and Luch, A., 2011. Alternatives to animal testing: current status and future
perspectives. Arch. Toxicol. 85, 841.
Lin, C.H., Kerkau, T., Guntermann, C., Trischler, M., Beyersdorf, N., Scheuring, Y., Tony,
H.P., Kneitz, C., Wilhelm, M., Mueller, P., Huenig, T. and Hanke, T., 2004. Superagonistic
Anti-CD28 Antibody TGN1412 as a Potential Immunotherapeutic for the Treatment of B Cell
Chronic Lymphocytic Leukemia. ASH Annual Meeting Abstracts 104, 2519.
Luhder, F., Huang, Y., Dennehy, K.M., Guntermann, C., Muller, I., Winkler, E., Kerkau, T.,
Ikemizu, S., Davis, S.J., Hanke, T. and Hunig, T., 2003. Topological requirements and signaling
properties of T cell-activating, anti-CD28 antibody superagonists. J. Exp. Med. 197, 955.
Lyerly, H.K., Clay, T. and Morse, M.A., 2000. Optimizing dendritic cell function by genetic
modification. J. Natl. Cancer Inst. 92, 1198.
Ma, W. and Pober, J.S., 1998. Human endothelial cells effectively costimulate cytokine
production by, but not differentiation of, naive CD4+ T cells. J. Immunol. 161, 2158.
Maeda, M., van Schie, R.C., Yuksel, B., Greenough, A., Fanger, M.W., Guyre, P.M. and
Lydyard, P.M., 1996. Differential expression of Fc receptors for IgG by monocytes and
granulocytes from neonates and adults. Clin. Exp. Immunol. 103, 343.
Marelli-Berg, F.M., Hargreaves, R.E., Carmichael, P., Dorling, A., Lombardi, G. and Lechler,
R.I., 1996. Major histocompatibility complex class II-expressing endothelial cells induce
allospecific nonresponsiveness in naive T cells. J. Exp. Med. 183, 1603.
Marin, V., Kaplanski, G., Gres, S., Farnarier, C. and Bongrand, P., 2001. Endothelial cell
culture: protocol to obtain and cultivate human umbilical endothelial cells. J. Immunol. Methods
254, 183.
Page 268
Page 268 of 286
Martelli, M.P., Lin, H., Zhang, W., Samelson, L.E. and Bierer, B.E., 2000. Signaling via LAT
(linker for T-cell activation) and Syk/ZAP70 is required for ERK activation and NFAT
transcriptional activation following CD2 stimulation. Blood 96, 2181.
Mascoli, C.C. and Weary, M.E., 1979a. Applications and advantages of the Limulus amebocyte
lysate (LAL) pyrogen test for parenteral injectable products. Prog. Clin. Biol. Res. 29, 387.
Mascoli, C.C. and Weary, M.E., 1979b. Limulus amebocyte lysate (LAL) test for detecting
pyrogens in parenteral injectable products and medical devices: advantages to manufacturers
and regulatory officials. J. Parenter. Drug Assoc. 33, 81.
Mazza, J., Rossi, A. and Weinberg, J.M., 2010. Innovative uses of tumor necrosis factor alpha
inhibitors. Dermatol. Clin. 28, 559.
McDouall, R.M., Batten, P., McCormack, A., Yacoub, M.H. and Rose, M.L., 1997. MHC class
II expression on human heart microvascular endothelial cells: exquisite sensitivity to interferon-
gamma and natural killer cells. Transplantation 64, 1175.
McDouall, R.M., Page, C.S., Hafizi, S., Yacoub, M.H. and Rose, M.L., 1996. Alloproliferation
of purified CD4+ T cells to adult human heart endothelial cells, and study of second-signal
requirements. Immunology 89, 220.
McILwain, R.B., Timpa, J.G., Kurundkar, A.R., Holt, D.W., Kelly, D.R., Hartman, Y.E., Neel,
M.L., Karnatak, R.K., Schelonka, R.L., Anantharamaiah, G.M., Killingsworth, C.R. and
Maheshwari, A., 2010. Plasma concentrations of inflammatory cytokines rise rapidly during
ECMO-related SIRS due to the release of preformed stores in the intestine. Lab. Invest. 90, 128.
Mestas, J., Crampton, S.P., Hori, T. and Hughes, C.C., 2005. Endothelial cell co-stimulation
through OX40 augments and prolongs T cell cytokine synthesis by stabilization of cytokine
mRNA. Int. Immunol. 17, 737.
Mestas, J. and Hughes, C.C., 2001. Endothelial cell costimulation of T cell activation through
CD58-CD2 interactions involves lipid raft aggregation. J. Immunol. 167, 4378.
Page 269
Page 269 of 286
Meyer, O., 2000. Role of anti-TNF therapy in rheumatoid arthritis. Presse Med. 29, 463.
Mire-Sluis, A. and Thorpe, R., 1998. Cytokines.
Monks, C.R., Freiberg, B.A., Kupfer, H., Sciaky, N. and Kupfer, A., 1998. Three-dimensional
segregation of supramolecular activation clusters in T cells. Nature 395, 82.
Moreau, T., Coles, A., Wing, M., Isaacs, J., Hale, G., Waldmann, H. and Compston, A., 1996.
Transient increase in symptoms associated with cytokine release in patients with multiple
sclerosis. Brain 119, 225.
Muller, N., van den, B.J., Odoardi, F., Tischner, D., Herath, J., Flugel, A. and Reichardt, H.M.,
2008. A CD28 superagonistic antibody elicits 2 functionally distinct waves of T cell activation
in rats. J. Clin. Invest. 118, 1405.
Muller, W.A., 2002. Leukocyte-endothelial cell interactions in the inflammatory response. Lab.
Invest. 82, 521.
Murphy, K., Travers, P. and Walport, M., 2008. Janeway's Immunobiology, Seventh Edition.
Murphy, K.M. and Reiner, S.L., 2002. The lineage decisions of helper T cells. Nat. Rev.
Immunol. 2, 933.
Murphy, L.L. and Hughes, C.C., 2002. Endothelial cells stimulate T cell NFAT nuclear
translocation in the presence of cyclosporin A: involvement of the wnt/glycogen synthase
kinase-3 beta pathway. J. Immunol. 169, 3717.
Murphy, L.L., Mazanet, M.M., Taylor, A.C., Mestas, J. and Hughes, C.C., 1999. Single-cell
analysis of costimulation by B cells, endothelial cells, and fibroblasts demonstrates
heterogeneity in responses of CD4(+) memory T cells. Cell Immunol. 194, 150.
Naka, T., Nishimoto, N. and Kishimoto, T., 2002. The paradigm of IL-6: from basic science to
medicine. Arthritis Res. 4, 233.
Page 270
Page 270 of 286
Nakagawa, Y., Maeda, H. and Murai, T., 2002. Evaluation of the in vitro pyrogen test system
based on proinflammatory cytokine release from human monocytes: comparison with a human
whole blood culture test system and with the rabbit pyrogen test. Clin. Diagn. Lab Immunol. 9,
588.
Nguyen, K., Sylvain, N.R. and Bunnell, S.C., 2008. T cell costimulation via the integrin VLA-4
inhibits the actin-dependent centralization of signaling microclusters containing the adaptor
SLP-76. Immunity 28, 810.
Norcross, M.A., 1984. A synaptic basis for T-lymphocyte activation. Ann. Immunol. (Paris)
135, 113.
Novak, J.C., Lovett-Racke, A.E. and Racke, M.K., 2008. Monoclonal antibody therapies and
neurologic disorders. Arch. Neurol. 65, 1162.
O'Neill, L.A. and Dinarello, C.A., 2000. The IL-1 receptor/toll-like receptor superfamily:
crucial receptors for inflammation and host defense. Immunol. Today 21, 206.
Omari, K.I. and Dorovini-Zis, K., 1999. Expression and function of lymphocyte function
associated antigen-3 (LFA-3) at the blood-brain barrier. Cell Mol. Biol. 45, 25.
Oppenheim, J.J., 2007. IL-2: more than a T cell growth factor. J. Immunol. 179, 1413.
Page, C., Thompson, C., Yacoub, M. and Rose, M., 1994a. Human endothelial stimulation of
allogeneic T cells via a CTLA-4 independent pathway. Transpl. Immunol. 2, 342.
Page, C.S., Holloway, N., Smith, H., Yacoub, M. and Rose, M.L., 1994b. Alloproliferative
responses of purified CD4+ and CD8+ T cells to endothelial cells in the absence of
contaminating accessory cells. Transplantation 57, 1628.
Paillot, R., Genestier, L., Fournel, S., Ferraro, C., Miossec, P. and Revillard, J.P., 1998.
Activation-dependent lymphocyte apoptosis induced by methotrexate. Transplant. Proc. 30,
2348.
Page 271
Page 271 of 286
Pallardy, M. and Hunig, T., 2010. Primate testing of TGN1412: right target, wrong cell. Br. J.
Pharmacol. 161, 509.
Pan, L., Kreisle, R.A. and Shi, Y., 1999. Expression of endothelial cell IgG Fc receptors and
markers on various cultures. Chin Med. J. (Engl) 112, 157.
Pan, L.F., Kreisle, R.A. and Shi, Y.D., 1998. Detection of Fcgamma receptors on human
endothelial cells stimulated with cytokines tumour necrosis factor-alpha (TNF-alpha) and
interferon-gamma (IFN-gamma). Clin. Exp. Immunol. 112, 533.
Parra, E., Wingren, A.G., Hedlund, G., Sjogren, H.O., Kalland, T., Sansom, D. and Dohlsten,
M., 1993. Human naive and memory T-helper cells display distinct adhesion properties to
ICAM-1, LFA-3 and B7 molecules. Scand. J. Immunol. 38, 508.
Pease, J.E. and Williams, T.J., 2006. Chemokines and their receptors in allergic disease. J.
Allergy Clin. Immunol. 118, 305.
Peggs, K.S. and Allison, J.P., 2005. Co-stimulatory pathways in lymphocyte regulation: the
immunoglobulin superfamily. Br. J. Haematol. 130, 809.
Pepper, M. and Jenkins, M.K., 2011. Origins of CD4(+) effector and central memory T cells.
Nat. Immunol. 12, 467.
Petruzzelli, L., Maduzia, L. and Springer, T.A., 1998. Differential requirements for LFA-1
binding to ICAM-1 and LFA-1-mediated cell aggregation. J. Immunol. 160, 4208.
Pittet, M.J. and Mempel, T.R., 2008. Regulation of T-cell migration and effector functions:
insights from in vivo imaging studies. Immunol. Rev. 221, 107.
Pober, J.S. and Cotran, R.S., 1991. Immunologic interactions of T lymphocytes with vascular
endothelium. Adv. Immunol. 50, 261.
Page 272
Page 272 of 286
Pober, J.S., Ma, W., Biedermann, B. and Libby, P., 1997. Vascular cells have limited capacities
to activate and differentiate T cells: implications for transplant vascular sclerosis. Transpl.
Immunol. 5, 251.
Pober, J.S. and Sessa, W.C., 2007. Evolving functions of endothelial cells in inflammation. Nat.
Rev. Immunol. 7, 803.
Poole, S. and Patel, M. Monocyte Activation Test better able to detect non-endotoxin pyrogenic
contaminants in medical products. US7736863B2. 15-6-2010.
http://patft.uspto.gov/netacgi/nph-
Parser?Sect1=PTO1&Sect2=HITOFF&d=PALL&p=1&u=%2Fnetahtml%2FPTO%2Fsrchnum.
htm&r=1&f=G&l=50&s1=7736863.PN.&OS=PN/7736863&RS=PN/7736863
Poole, S., Thorpe, R., Meager, A., Hubbard, A.R. and Gearing, A.J., 1988. Detection of pyrogen
by cytokine release. Lancet 1, 130.
Probey, T.F. and Pittman, M., 1945. The Pyrogenicity of Bacterial Contaminants Found in
Biologic Products. J. Bacteriol. 50, 397.
Robinson, C.M., O'Dee, D., Hamilton, T. and Nau, G.J., 2010. Cytokines involved in interferon-
gamma production by human macrophages. J. Innate. Immun. 2, 56.
Rodgers, W., Farris, D. and Mishra, S., 2005. Merging complexes: properties of membrane raft
assembly during lymphocyte signaling. Trends Immunol. 26, 97.
Rodriguez-Palmero, M., Franch, A., Castell, M., Pelegri, C., Perez-Cano, F.J., Kleinschnitz, C.,
Stoll, G., Hunig, T. and Castellote, C., 2006. Effective treatment of adjuvant arthritis with a
stimulatory CD28-specific monoclonal antibody. J. Rheumatol. 33, 110.
Romer, P.S., Berr, S., Avota, E., Na, S.Y., Battaglia, M., Ten, B., I, Einsele, H. and Hunig, T.,
2011. Preculture of PBMC at high cell density increases sensitivity of T-cell responses,
revealing cytokine release by CD28 superagonist TGN1412. Blood 118, 6772.
Page 273
Page 273 of 286
Roose, J.P., Diehn, M., Tomlinson, M.G., Lin, J., Alizadeh, A.A., Botstein, D., Brown, P.O. and
Weiss, A., 2003. T cell receptor-independent basal signaling via Erk and Abl kinases suppresses
RAG gene expression. PLoS. Biol. 1, 53.
Rose, M.L., 1998. Endothelial cells as antigen-presenting cells: role in human transplant
rejection. Cell Mol. Life Sci. 54, 965.
Sallusto, F., Geginat, J. and Lanzavecchia, A., 2004. Central memory and effector memory T
cell subsets: function, generation, and maintenance. Annu. Rev. Immunol. 22, 745.
Sanchez-Lockhart, M. and Miller, J., 2006. Engagement of CD28 outside of the immunological
synapse results in up-regulation of IL-2 mRNA stability but not IL-2 transcription. J. Immunol.
176, 4778.
Sandilands, G.P., Wilson, M., Huser, C., Jolly, L., Sands, W.A. and McSharry, C., 2010. Were
monocytes responsible for initiating the cytokine storm in the TGN1412 clinical trial tragedy?
Clin. Exp. Immunol. 162, 516.
Savage, C.O., Hughes, C.C., Pepinsky, R.B., Wallner, B.P., Freedman, A.S. and Pober, J.S.,
1991. Endothelial cell lymphocyte function-associated antigen-3 and an unidentified ligand act
in concert to provide costimulation to human peripheral blood CD4+ T cells. Cell Immunol.
137, 150.
Savage, P., So, A., Spooner, R.A. and Epenetos, A.A., 1993. A recombinant single-chain
antibody interleukin-2 fusion protein. Cell Biophys. 22, 61.
Schindler, R., Mancilla, J., Endres, S., Ghorbani, R., Clark, S.C. and Dinarello, C.A., 1990.
Correlations and interactions in the production of interleukin-6 (IL-6), IL-1, and tumor necrosis
factor (TNF) in human blood mononuclear cells: IL-6 suppresses IL-1 and TNF. Blood 75, 40.
Schmidt, J., Elflein, K., Stienekemeier, M., Rodriguez-Palmero, M., Schneider, C., Toyka,
K.V., Gold, R. and Hunig, T., 2003. Treatment and prevention of experimental autoimmune
neuritis with superagonistic CD28-specific monoclonal antibodies. J. Neuroimmunol. 140, 143.
Page 274
Page 274 of 286
Schraven, B. and Kalinke, U., 2008. CD28 superagonists: what makes the difference in
humans? Immunity 28, 591.
Schroder, K., Hertzog, P.J., Ravasi, T. and Hume, D.A., 2004. Interferon-gamma: an overview
of signals, mechanisms and functions. J. Leukoc. Biol. 75, 163.
Schwartz, R.H., 2003. T cell anergy. Annu. Rev. Immunol. 21, 305.
Shah, B. and Mayer, L., 2010. Current status of monoclonal antibody therapy for the treatment
of inflammatory bowel disease. Expert. Rev. Clin. Immunol. 6, 607.
Shanahan, W.R., Jr., Weston, D.M. and Korn, J.H., 1985. Endothelial cells enhance the human
pokeweed mitogen lymphocyte response. J. Leukoc. Biol. 37, 305.
Sharpe, A.H. and Abbas, A.K., 2006. T-cell costimulation--biology, therapeutic potential, and
challenges. N. Engl. J. Med. 355, 973.
Sharpe, A.H. and Freeman, G.J., 2002. The B7-CD28 superfamily. Nat. Rev. Immunol. 2, 116.
Sheerin, N.S., Sacks, S.H. and Fogazzi, G.B., 1999. In vitro erythrophagocytosis by renal
tubular cells and tubular toxicity by haemoglobin and iron. Nephrol. Dial. Transplant. 14, 1391.
Siefken, R., Klein-Hessling, S., Serfling, E., Kurrle, R. and Schwinzer, R., 1998. A CD28-
associated signaling pathway leading to cytokine gene transcription and T cell proliferation
without TCR engagement. J. Immunol. 161, 1645.
Simpson, T.R., Quezada, S.A. and Allison, J.P., 2010. Regulation of CD4 T cell activation and
effector function by inducible costimulator (ICOS). Curr. Opin. Immunol. 22, 326.
Sironi, M., Breviario, F., Proserpio, P., Biondi, A., Vecchi, A., Van, D.J., Dejana, E. and
Mantovani, A., 1989. IL-1 stimulates IL-6 production in endothelial cells. J. Immunol. 142, 549.
Smith, M.E. and Thomas, J.A., 1990. Cellular expression of lymphocyte function associated
antigens and the intercellular adhesion molecule-1 in normal tissue. J. Clin. Pathol. 43, 893.
Page 275
Page 275 of 286
Stebbings, R., Findlay, L., Edwards, C., Eastwood, D., Bird, C., North, D., Mistry, Y., Dilger,
P., Liefooghe, E., Cludts, I., Fox, B., Tarrant, G., Robinson, J., Meager, T., Dolman, C., Thorpe,
S.J., Bristow, A., Wadhwa, M., Thorpe, R. and Poole, S., 2007. "Cytokine storm" in the phase I
trial of monoclonal antibody TGN1412: better understanding the causes to improve preclinical
testing of immunotherapeutics. J. Immunol. 179, 3325.
Stebbings, R., Poole, S. and Thorpe, R., 2009. Safety of biologics, lessons learnt from
TGN1412. Curr. Opin. Biotechnol. 20, 673.
Steere, A.C., Rifaat, M.K., Seligmann, E.B., Jr., Hochstein, H.D., Friedland, G., Dasse, P.,
Wustrack, K.O., Axnick, K.J. and Barker, L.F., 1978. Pyrogen reactions associated with the
infusion of normal serum albumin (human). Transfusion 18, 102.
Strunk, R.C., Cole, F.S., Perlmutter, D.H. and Colten, H.R., 1985. gamma-Interferon increases
expression of class III complement genes C2 and factor B in human monocytes and in murine
fibroblasts transfected with human C2 and factor B genes. J. Biol. Chem. 260, 15280.
Subtil, A., Hemar, A. and utry-Varsat, A., 1994. Rapid endocytosis of interleukin 2 receptors
when clathrin-coated pit endocytosis is inhibited. J. Cell Sci. 107, 3461.
Suntharalingam, G., Perry, M.R., Ward, S., Brett, S.J., Castello-Cortes, A., Brunner, M.D. and
Panoskaltsis, N., 2006. Cytokine storm in a phase 1 trial of the anti-CD28 monoclonal antibody
TGN1412. N. Engl. J. Med. 355, 1018.
Sylvain, N.R., Nguyen, K. and Bunnell, S.C., 2011. Vav1-mediated scaffolding interactions
stabilize SLP-76 microclusters and contribute to antigen-dependent T cell responses. Sci.
Signal. 4, 14.
Tacke, M., Hanke, G., Hanke, T. and Hunig, T., 1997. CD28-mediated induction of
proliferation in resting T cells in vitro and in vivo without engagement of the T cell receptor:
evidence for functionally distinct forms of CD28. Eur. J. Immunol. 27, 239.
Page 276
Page 276 of 286
Taktak, Y.S., Selkirk, S., Bristow, A.F., Carpenter, A., Ball, C., Rafferty, B. and Poole, S.,
1991. Assay of pyrogens by interleukin-6 release from monocytic cell lines. J. Pharm.
Pharmacol. 43, 578.
Tang, Q., Henriksen, K.J., Boden, E.K., Tooley, A.J., Ye, J., Subudhi, S.K., Zheng, X.X.,
Strom, T.B. and Bluestone, J.A., 2003. Cutting edge: CD28 controls peripheral homeostasis of
CD4+CD25+ regulatory T cells. J. Immunol. 171, 3348.
Tavano, R., Contento, R.L., Baranda, S.J., Soligo, M., Tuosto, L., Manes, S. and Viola, A.,
2006. CD28 interaction with filamin-A controls lipid raft accumulation at the T-cell
immunological synapse. Nat. Cell Biol. 8, 1270.
Tavano, R., Gri, G., Molon, B., Marinari, B., Rudd, C.E., Tuosto, L. and Viola, A., 2004. CD28
and lipid rafts coordinate recruitment of Lck to the immunological synapse of human T
lymphocytes. J. Immunol. 173, 5392.
TeGenero AG. TGN1412 Investigational Medicinal Product Dossier. 2005a.
http://www.circare.org/foia5/tgn1412dossier.pdf
TeGenero AG. TGN1412 investigator's brochure. 2005b.
http://www.circare.org/foia5/tgn1412investigatorbrochure.pdf
Thum, T., Haverich, A. and Borlak, J., 2000. Cellular dedifferentiation of endothelium is linked
to activation and silencing of certain nuclear transcription factors: implications for endothelial
dysfunction and vascular biology. FASEB J. 14, 740.
Tollerud, D.J., Brown, L.M., Clark, J.W., Neuland, C.Y., Mann, D.L., Pankiw-Trost, L.K. and
Blattner, W.A., 1991. Cryopreservation and long-term liquid nitrogen storage of peripheral
blood mononuclear cells for flow cytometry analysis: effects on cell subset proportions and
fluorescence intensity. J. Clin. Lab Anal. 5, 255.
Treon, S.P., Hansen, M., Branagan, A.R., Verselis, S., Emmanouilides, C., Kimby, E., Frankel,
S.R., Touroutoglou, N., Turnbull, B., Anderson, K.C., Maloney, D.G. and Fox, E.A., 2005.
Page 277
Page 277 of 286
Polymorphisms in FcgammaRIIIA (CD16) receptor expression are associated with clinical
response to rituximab in Waldenstrom's macroglobulinemia. J. Clin. Oncol. 23, 474.
Tufano, M.A., Cipollaro de l'Ero, G., Ianniello, R., Galdiero, M. and Galdiero, F., 1991. Protein
A and other surface components of Staphylococcus aureus stimulate production of IL-1 alpha,
IL-4, IL-6, TNF and IFN-gamma. Eur. Cytokine Netw. 2, 361.
Udagawa, T., Woodside, D.G. and McIntyre, B.W., 1996. Alpha 4 beta 1 (CD49d/CD29)
integrin costimulation of human T cells enhances transcription factor and cytokine induction in
the absence of altered sensitivity to anti-CD3 stimulation. J. Immunol. 157, 1965.
US Food and Drug Administration: Center for Biological Evaluation and Research. Estimating
the maximum safe starting dose in initial clinical trials for therapeutics in adult healthy
volunteers. 2005.
http://www.fda.gov/downloads/Drugs/GuidanceComplianceRegulatoryInformation/Guidances/u
cm078932.pdf
van der Neut Kolfschoten, M., Schuurman, J., Losen, M., Bleeker, W.K., Martinez-Martinez, P.,
Vermeulen, E., den Bleker, T.H., Wiegman, L., Vink, T., Aarden, L.A., De Baets, M.H., van de
Winkel, J.G., Aalberse, R.C. and Parren, P.W., 2007. Anti-inflammatory activity of human
IgG4 antibodies by dynamic Fab arm exchange. Science 317, 1554.
van Komen, J.S., Mishra, S., Byrum, J., Chichili, G.R., Yaciuk, J.C., Farris, A.D. and Rodgers,
W., 2007. Early and dynamic polarization of T cell membrane rafts and constituents prior to
TCR stop signals. J. Immunol. 179, 6845.
van Lier, R.A., Brouwer, M., Rebel, V.I., van Noesel, C.J. and Aarden, L.A., 1989. Immobilized
anti-CD3 monoclonal antibodies induce accessory cell-independent lymphokine production,
proliferation and helper activity in human T lymphocytes. Immunology 68, 45.
van Seventer, G.A., Bonvini, E., Yamada, H., Conti, A., Stringfellow, S., June, C.H. and Shaw,
S., 1992. Costimulation of T cell receptor/CD3-mediated activation of resting human CD4+ T
Page 278
Page 278 of 286
cells by leukocyte function-associated antigen-1 ligand intercellular cell adhesion molecule-1
involves prolonged inositol phospholipid hydrolysis and sustained increase of intracellular Ca2+
levels. J. Immunol. 149, 3872.
van Seventer, G.A., Newman, W., Shimizu, Y., Nutman, T.B., Tanaka, Y., Horgan, K.J., Gopal,
T.V., Ennis, E., O'Sullivan, D., Grey, H. and ., 1991a. Analysis of T cell stimulation by
superantigen plus major histocompatibility complex class II molecules or by CD3 monoclonal
antibody: costimulation by purified adhesion ligands VCAM-1, ICAM-1, but not ELAM-1. J.
Exp. Med. 174, 901.
van Seventer, G.A., Shimizu, Y., Horgan, K.J., Luce, G.E., Webb, D. and Shaw, S., 1991b.
Remote T cell co-stimulation via LFA-1/ICAM-1 and CD2/LFA-3: demonstration with
immobilized ligand/mAb and implication in monocyte-mediated co-stimulation. Eur. J.
Immunol. 21, 1711.
Varga, G., Nippe, N., Balkow, S., Peters, T., Wild, M.K., Seeliger, S., Beissert, S., Krummen,
M., Roth, J., Sunderkotter, C. and Grabbe, S., 2010. LFA-1 contributes to signal I of T-cell
activation and to the production of T(h)1 cytokines. J. Invest Dermatol. 130, 1005.
Vidal, J.M., Kawabata, T.T., Thorpe, R., Silva-Lima, B., Cederbrant, K., Poole, S., Mueller-
Berghaus, J., Pallardy, M. and van der Laan, J.W., 2010. In vitro cytokine release assays for
predicting cytokine release syndrome: the current state-of-the-science. Report of a European
Medicines Agency Workshop. Cytokine 51, 213.
Villalba, M., Bi, K., Rodriguez, F., Tanaka, Y., Schoenberger, S. and Altman, A., 2001.
Vav1/Rac-dependent actin cytoskeleton reorganization is required for lipid raft clustering in T
cells. J. Cell Biol. 155, 331.
von Mehren, M., Adams, G.P. and Weiner, L.M., 2003. Monoclonal antibody therapy for
cancer. Annu. Rev. Med. 54, 343.
Page 279
Page 279 of 286
Waibler, Z., Sender, L.Y., Merten, C., Hartig, R., Kliche, S., Gunzer, M., Reichardt, P., Kalinke,
U. and Schraven, B., 2008. Signaling signatures and functional properties of anti-human CD28
superagonistic antibodies. PLoS. One 3, 1708.
Waldmann, H. and Hale, G., 2005. CAMPATH: from concept to clinic. Philos. Trans. R. Soc.
Lond B Biol. Sci. 360, 1707.
Walker, L.S. and Abbas, A.K., 2002. The enemy within: keeping self-reactive T cells at bay in
the periphery. Nat. Rev. Immunol. 2, 11.
Walker, M.R., Makropoulos, D.A., Achuthanandam, R., Van, A.S. and Bugelski, P.J., 2011.
Development of a human whole blood assay for prediction of cytokine release similar to anti-
CD28 superagonists using multiplex cytokine and hierarchical cluster analysis. Int.
Immunopharmacol. 11, 1697.
Wallner, B.P., Frey, A.Z., Tizard, R., Mattaliano, R.J., Hession, C., Sanders, M.E., Dustin, M.L.
and Springer, T.A., 1987. Primary structure of lymphocyte function-associated antigen 3 (LFA-
3). The ligand of the T lymphocyte CD2 glycoprotein. J. Exp. Med. 166, 923.
Walsh, L.J., Trinchieri, G., Waldorf, H.A., Whitaker, D. and Murphy, G.F., 1991. Human
dermal mast cells contain and release tumor necrosis factor alpha, which induces endothelial
leukocyte adhesion molecule 1. Proc. Natl. Acad. Sci. U. S. A. 88, 4220.
Wang, H., Wei, B., Bismuth, G. and Rudd, C.E., 2009. SLP-76-ADAP adaptor module
regulates LFA-1 mediated costimulation and T cell motility. Proc. Natl. Acad. Sci. U. S. A. 106,
12436.
Watson, C.A., Petzelbauer, P., Zhou, J., Pardi, R. and Bender, J.R., 1995. Contact-dependent
endothelial class II HLA gene activation induced by NK cells is mediated by IFN-gamma-
dependent and -independent mechanisms. J. Immunol. 154, 3222.
Page 280
Page 280 of 286
Westphal, J.R., Tax, W.J., Willems, H.W., Koene, R.A., Ruiter, D.J. and De Waal, R.M., 1992.
Accessory function of endothelial cells in anti-CD3-induced T-cell proliferation: synergism
with monocytes. Scand. J. Immunol. 35, 449.
Westphal, J.R., Willems, H.W., Ruiter, D.J. and De Waal, R.M., 1993a. Involvement of LFA-
1/ICAM and CD2/LFA-3 in human endothelial cell accessory function. Behring Inst. Mitt. 51.
Westphal, J.R., Willems, H.W., Tax, W.J., Koene, R.A., Ruiter, D.J. and De Waal, R.M.,
1993b. Endothelial cells promote anti-CD3-induced T-cell proliferation via cell-cell contact
mediated by LFA-1 and CD2. Scand. J. Immunol. 38, 435.
Westphal, J.R., Willems, H.W., Tax, W.J., Koene, R.A., Ruiter, D.J. and De Waal, R.M., 1993c.
The proliferative response of human T cells to allogeneic IFN-gamma-treated endothelial cells
is mediated via both CD2/LFA-3 and LFA-1/ICAM-1 and -2 adhesion pathways. Transpl.
Immunol. 1, 183.
Wing, M., 2008. Monoclonal antibody first dose cytokine release syndromes-mechanisms and
prediction. J. Immunotoxicol. 5, 11.
Wing, M.G., Moreau, T., Greenwood, J., Smith, R.M., Hale, G., Isaacs, J., Waldmann, H.,
Lachmann, P.J. and Compston, A., 1996. Mechanism of first-dose cytokine-release syndrome
by CAMPATH 1-H: involvement of CD16 (FcgammaRIII) and CD11a/CD18 (LFA-1) on NK
cells. J. Clin. Invest 98, 2819.
Wing, M.G., Waldmann, H., Isaacs, J., Compston, D.A. and Hale, G., 1995. Ex-vivo whole
blood cultures for predicting cytokine-release syndrome: dependence on target antigen and
antibody isotype. Ther. Immunol. 2, 183.
Wingren, A.G., Parra, E., Varga, M., Kalland, T., Sjogren, H.O., Hedlund, G. and Dohlsten, M.,
1995. T cell activation pathways: B7, LFA-3, and ICAM-1 shape unique T cell profiles. Crit
Rev. Immunol. 15, 235.
Page 281
Page 281 of 286
Wyant, T.L., Tanner, M.K. and Sztein, M.B., 1999. Salmonella typhi flagella are potent
inducers of proinflammatory cytokine secretion by human monocytes. Infect. Immun. 67, 3619.
Yang, H., Wang, J., Du, J., Zhong, C., Zhang, D., Guo, H., Guo, Y. and Ding, J., 2010.
Structural basis of immunosuppression by the therapeutic antibody daclizumab. Cell Res. 20,
1361.
Yao, Z., Spriggs, M.K., Derry, J.M., Strockbine, L., Park, L.S., VandenBos, T., Zappone, J.D.,
Painter, S.L. and Armitage, R.J., 1997. Molecular characterization of the human interleukin
(IL)-17 receptor. Cytokine 9, 794.
Yokosuka, T., Kobayashi, W., Sakata-Sogawa, K., Takamatsu, M., Hashimoto-Tane, A.,
Dustin, M.L., Tokunaga, M. and Saito, T., 2008. Spatiotemporal regulation of T cell
costimulation by TCR-CD28 microclusters and protein kinase C theta translocation. Immunity
29, 589.
Young, S.P. and Garner, C., 1990. Delivery of iron to human cells by bovine transferrin.
Implications for the growth of human cells in vitro. Biochem. J. 265, 587.
Zuckerman, L.A., Pullen, L. and Miller, J., 1998. Functional consequences of costimulation by
ICAM-1 on IL-2 gene expression and T cell activation. J. Immunol. 160, 3259.
Page 282
Page 282 of 286
Appendix I
The buffers listed in this appendix were usually prepared by NIBSC Scientific Support Services.
Table 11. Phosphate Buffered Saline (PBS) A (sterile and non-sterile)
Material Amount Supplier
Sodium chloride 10 g Fisher Scientific S/3160/53
Potassium chloride 0.25 g Merck 10198 4L
Disodium hydrogen orthophosphate 1.44 g Merck 10249 4C
Potassium dihydrogen orthophosphate 0.25 g Merck 10203
Ultra Pure Water 1000 ml Barnstead
To sterilise, bottles were autoclaved for 15 min at 122°C, 1.05 bar.
Table 12. PBS B (sterile)
Material Amount Supplier
Sterile water 900 ml Baxter UKF7114
Sterile 10 x PBS 100 ml Gibco 70013016
Prepared in a class II laminar flow cabinet.
Table 13. Coating Buffer A
Material Amount Supplier
Sodium dihydrogen orthophosphate dihydrate 5.0 g Fisher Scientific S/3760/53
Disodium hydrogen orthophosphate 2.9 g VWR 102494C
Ultra Pure Water 400 ml Barnstead
After mixing to dissolve the solids, the pH was adjusted to 7.5 using 1 M sodium hydroxide prior to
making the volume up to 500 ml with Ultra Pure Water. Stored between 2 - 8°C.
Page 283
Page 283 of 286
Table 14. Coating Buffer B
Material Amount Supplier
Sodium chloride 8.18 g Fisher Scientific S/3160/53
Potassium chloride 0.2 g Fisher Scientific P/4280/53
Potassium dihydrogen orthophosphate 0.2 g Fisher Scientific P/4760/53
Disodium hydrogen orthophosphate 1.15 g VWR 102494C
Ultra Pure Water 1000 ml Barnstead
Stored between 2 - 8°C.
Table 15. Blocking Buffer A
After mixing to dissolve the solids, the pH was adjusted to 7.5 using 4 M hydrochloric acid prior to
making the volume up to 500 ml with Ultra Pure Water. Stored between 2 – 8°C.
Table 16. Detecting Antibody Dilution Buffer
Material Amount Supplier
Tris (hydroxymethyl) aminomethane 2.1 g VWR 103156x
Ultra Pure Water 400 ml Barnstead
Phenol 0.5 g Sigma P5566
Heat-inactivated (30 minutes at +56°C) FCS 25 ml Sera Laboratories Int. Ltd EU-000FI
After mixing to dissolve the solids, the pH was adjusted to 7.5 using 4 M hydrochloric acid prior to
making the volume up to 500 ml with Ultra Pure Water. Stored between 2 - 8°C.
Material Amount Supplier
Tris (hydroxymethyl) aminomethane 12.1 g VWR 103156x
Ultra Pure Water 400 ml Barnstead
Albumin from bovine serum 5 g Millipore 82-100-1
Page 284
Page 284 of 286
Table 17. Substrate Buffer A
Material Amount Supplier
Citric acid 6.3 g Sigma C-2404
Ultra Pure Water 800 ml Barnstead
After mixing to dissolve the solid, the pH was adjusted to 4.1 using 4 M potassium hydroxide prior to
making the volume up to 1000 ml with Ultra Pure Water. Stored between 2 - 8°C.
Table 18. TMB Substrate Solution
Material Amount Supplier
3,3',5,5'Tetramethylbenzidine (TMB) 240 mg Sigma T2885
Acetone 5 ml VWR 20065.327
Ethanol 45 ml Hayman Speciality Products F200238
Hydrogen peroxide solution 0.3 ml Sigma H-1009
The TMB was dissolved in acetone prior to addition of the remaining materials. Stored between 15 – 25
°C protected from light.
Table 19. Substrate Buffer B
Material Amount Supplier
Citric acid 7.3 g Sigma C-2404
Disodium hydrogen orthophosphate 9.47 g VWR 102494C
Ultra Pure Water 800 ml Barnstead
After mixing to dissolve the solids, the pH was adjusted to 5.0 with 1 M sodium hydroxide prior to
making the volume up to 1000 ml with Ultra Pure Water. Stored between 2 - 8°C.
Table 20. Stop Solution
Material Amount Supplier
Ultra Pure Water 500 ml Barnstead
Sulphuric acid 27.2 ml VWR 20690.330
Stored between 15 – 25 °C.
Page 285
Page 285 of 286
Table 21. Wash Dilution Buffer
Material Amount Supplier
Sodium chloride 29.22 g Fisher Scientific S/3160/53
Sodium dihydrogen orthophosphate dihydrate 0.39 g Fisher Scientific S/3760/53
Disodium hydrogen orthophosphate 1.07 g VWR 102494C
Ultra Pure Water 500 ml Barnstead
Tween 20 1 ml Sigma P5927
The solids were dissolved in Ultra Pure Water prior to the addition of Tween 20 (polyoxyethylene-
sorbitan monolaurate) to avoid frothing whilst mixing. The pH was then adjusted to 7.2 using 2 M sodium
hydroxide prior to the volume being made up to 1000 ml with Ultra Pure Water. Stored between 2 - 8°C.
Table 22. Tris Buffered Saline (TBS) 10x stock
Material Amount Supplier
Tris (hydroxymethyl) aminomethane 6 g VWR 103156X
Sodium chloride 80 g Fisher Scientific S/3160/53
Ultra Pure Water 800 ml Barnstead
After mixing to dissolve the solids, the pH was adjusted to 7.2 with hydrochloric acid prior to making the
volume up to 1000 ml with Ultra Pure Water. Stored between 2 - 8°C. The 10x stock was diluted 1 in 10
with Ultra Pure Water prior to use.
Table 23. FACS Fix Solution
Material Amount Supplier
PBS A 150 ml See above
Formaldehyde 25 ml Fisher Scientific F/14514/PB17
Ultra Pure Water 325 ml Barnstead
Stored between 15 – 25 °C.
Page 286
Page 286 of 286
Appendix II
Figure 55. Effect of the presence of mAbs TGN1412, Tysabri, Isotype Control, Avastin, Herceptin and
Campath-1H on the detection of cytokines TNFα, IL-6, IL-8, IL-2 and IFNγ by ELISA. A minimum of 3
concentrations of cytokine standard ranging concentrations typically used in experiments in this study to
generate standard curves in ELISAs were prepared in the absence and presence of each mAb used in this
study. The concentration of each mAb used reflected the highest dose incubated with cells in the methods
investigated in this thesis, i.e. the maximum dose that was transferred to ELISA plates (see section 2.6).
Values shown are means ± S.E.M of duplicates.