Proceedings of the International Conference on Emerging Trends in Engineering and Management (ICETEM14)
30 – 31, December 2014, Ernakulam, India
2
software. The advantage of the proposed element is that it can model plates with and without stiffeners within the
element. Structure can be analyzed using software Ansys10. Development of interaction curve is from the output obtained
from the Ansys10.
Thin plates are initially flat structural members bounded by two parallel planes, called faces, and a cylindrical
surface, called an edge or boundary. The generators of the cylindrical surface are perpendicular to the plane faces. The
distance between the plane faces is called the thickness (h) of the plate. It will be assumed that the plate thickness is small
compared with other characteristic dimensions of the faces (length, width, diameter, etc.). Geometrically, plates are
bounded either by straight or curved boundaries (Fig.1.1). The static or dynamic loads carried by plates are predominantly
perpendicular to the plate faces.
Fig 1.1: Plates are bounded by either straight or curved boundaries
The load-carrying action of a plate is similar, to a certain extent, to that of beams or cables; thus, plates can be
approximated by a grid work of an infinite number of beams or by a network of an infinite number of cables, depending
on the flexural rigidity of the structures. This two dimensional structural action of plates results in lighter structures, and
therefore offers numerous economic advantages. The plate, being originally flat, develops shear forces, bending and
twisting moments to resist transverse loads. Because the loads are generally carried in both directions and because the
twisting rigidity in isotropic plates is quite significant, a plate is considerably stiffer than a beam of comparable span and
thickness. So, thin plates combine light weight and a form efficiency with high load-carrying capacity, economy, and
technological effectiveness.
Fig: 1.1.2 Ship hull
Because of the distinct advantages discussed above, thin plates are extensively used in all fields of engineering.
Plates are used in architectural structures, bridges, hydraulic structures, pavements, containers, airplanes, missiles, ships,
instruments, machine parts, etc. (Fig. 1.1.3).
Proceedings of the International Conference on Emerging Trends in Engineering and Management (ICETEM14)
30 – 31, December 2014, Ernakulam, India
3
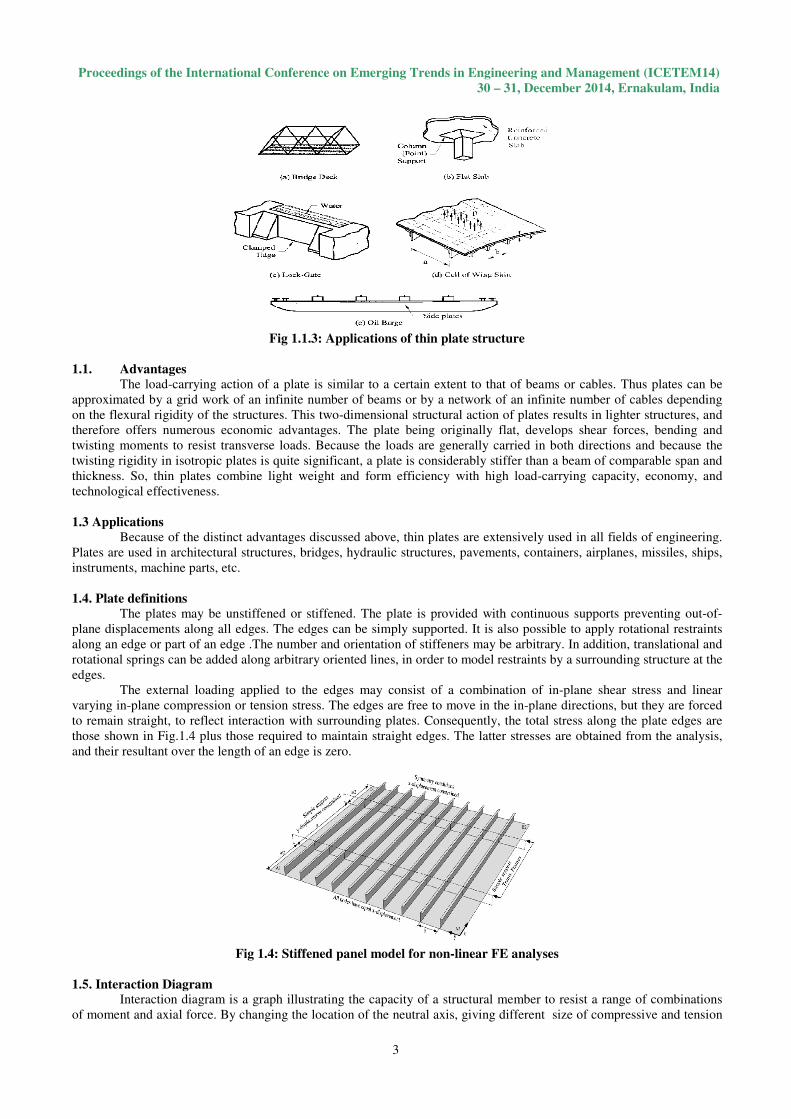
Fig 1.1.3: Applications of thin plate structure
1.1. Advantages
The load-carrying action of a plate is similar to a certain extent to that of beams or cables. Thus plates can be
approximated by a grid work of an infinite number of beams or by a network of an infinite number of cables depending
on the flexural rigidity of the structures. This two-dimensional structural action of plates results in lighter structures, and
therefore offers numerous economic advantages. The plate being originally flat, develops shear forces, bending and
twisting moments to resist transverse loads. Because the loads are generally carried in both directions and because the
twisting rigidity in isotropic plates is quite significant, a plate is considerably stiffer than a beam of comparable span and
thickness. So, thin plates combine light weight and form efficiency with high load-carrying capacity, economy, and
technological effectiveness.
1.3 Applications
Because of the distinct advantages discussed above, thin plates are extensively used in all fields of engineering.
Plates are used in architectural structures, bridges, hydraulic structures, pavements, containers, airplanes, missiles, ships,
instruments, machine parts, etc.
1.4. Plate definitions
The plates may be unstiffened or stiffened. The plate is provided with continuous supports preventing out-of-
plane displacements along all edges. The edges can be simply supported. It is also possible to apply rotational restraints
along an edge or part of an edge .The number and orientation of stiffeners may be arbitrary. In addition, translational and
rotational springs can be added along arbitrary oriented lines, in order to model restraints by a surrounding structure at the
edges.
The external loading applied to the edges may consist of a combination of in-plane shear stress and linear
varying in-plane compression or tension stress. The edges are free to move in the in-plane directions, but they are forced
to remain straight, to reflect interaction with surrounding plates. Consequently, the total stress along the plate edges are
those shown in Fig.1.4 plus those required to maintain straight edges. The latter stresses are obtained from the analysis,
and their resultant over the length of an edge is zero.
Fig 1.4: Stiffened panel model for non-linear FE analyses
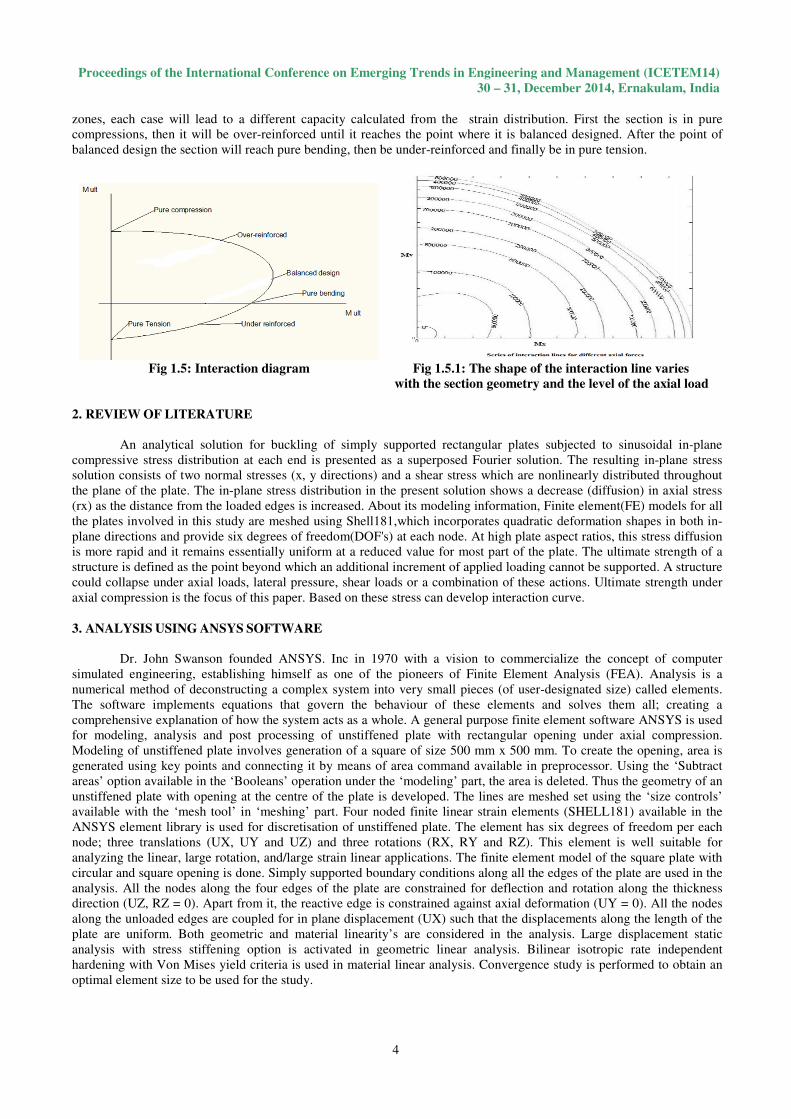
1.5. Interaction Diagram Interaction diagram is a graph illustrating the capacity of a structural member to resist a range of combinations
of moment and axial force. By changing the location of the neutral axis, giving different size of compressive and tension
Proceedings of the International Conference on Emerging Trends in Engineering and Management (ICETEM14)
30 – 31, December 2014, Ernakulam, India
4
zones, each case will lead to a different capacity calculated from the strain distribution. First the section is in pure
compressions, then it will be over-reinforced until it reaches the point where it is balanced designed. After the point of
balanced design the section will reach pure bending, then be under-reinforced and finally be in pure tension.
Fig 1.5: Interaction diagram Fig 1.5.1: The shape of the interaction line varies
with the section geometry and the level of the axial load
2. REVIEW OF LITERATURE
An analytical solution for buckling of simply supported rectangular plates subjected to sinusoidal in-plane
compressive stress distribution at each end is presented as a superposed Fourier solution. The resulting in-plane stress
solution consists of two normal stresses (x, y directions) and a shear stress which are nonlinearly distributed throughout
the plane of the plate. The in-plane stress distribution in the present solution shows a decrease (diffusion) in axial stress
(rx) as the distance from the loaded edges is increased. About its modeling information, Finite element(FE) models for all
the plates involved in this study are meshed using Shell181,which incorporates quadratic deformation shapes in both in-
plane directions and provide six degrees of freedom(DOF's) at each node. At high plate aspect ratios, this stress diffusion
is more rapid and it remains essentially uniform at a reduced value for most part of the plate. The ultimate strength of a
structure is defined as the point beyond which an additional increment of applied loading cannot be supported. A structure
could collapse under axial loads, lateral pressure, shear loads or a combination of these actions. Ultimate strength under
axial compression is the focus of this paper. Based on these stress can develop interaction curve.
3. ANALYSIS USING ANSYS SOFTWARE
Dr. John Swanson founded ANSYS. Inc in 1970 with a vision to commercialize the concept of computer
simulated engineering, establishing himself as one of the pioneers of Finite Element Analysis (FEA). Analysis is a
numerical method of deconstructing a complex system into very small pieces (of user-designated size) called elements.
The software implements equations that govern the behaviour of these elements and solves them all; creating a
comprehensive explanation of how the system acts as a whole. A general purpose finite element software ANSYS is used
for modeling, analysis and post processing of unstiffened plate with rectangular opening under axial compression.
Modeling of unstiffened plate involves generation of a square of size 500 mm x 500 mm. To create the opening, area is
generated using key points and connecting it by means of area command available in preprocessor. Using the ‘Subtract
areas’ option available in the ‘Booleans’ operation under the ‘modeling’ part, the area is deleted. Thus the geometry of an
unstiffened plate with opening at the centre of the plate is developed. The lines are meshed set using the ‘size controls’
available with the ‘mesh tool’ in ‘meshing’ part. Four noded finite linear strain elements (SHELL181) available in the
ANSYS element library is used for discretisation of unstiffened plate. The element has six degrees of freedom per each
node; three translations (UX, UY and UZ) and three rotations (RX, RY and RZ). This element is well suitable for
analyzing the linear, large rotation, and/large strain linear applications. The finite element model of the square plate with
circular and square opening is done. Simply supported boundary conditions along all the edges of the plate are used in the
analysis. All the nodes along the four edges of the plate are constrained for deflection and rotation along the thickness
direction (UZ, RZ = 0). Apart from it, the reactive edge is constrained against axial deformation (UY = 0). All the nodes
along the unloaded edges are coupled for in plane displacement (UX) such that the displacements along the length of the
plate are uniform. Both geometric and material linearity’s are considered in the analysis. Large displacement static
analysis with stress stiffening option is activated in geometric linear analysis. Bilinear isotropic rate independent
hardening with Von Mises yield criteria is used in material linear analysis. Convergence study is performed to obtain an
optimal element size to be used for the study.
Proceedings of the International Conference on Emerging Trends in Engineering and Management (ICETEM14)
30 – 31, December 2014, Ernakulam, India
5
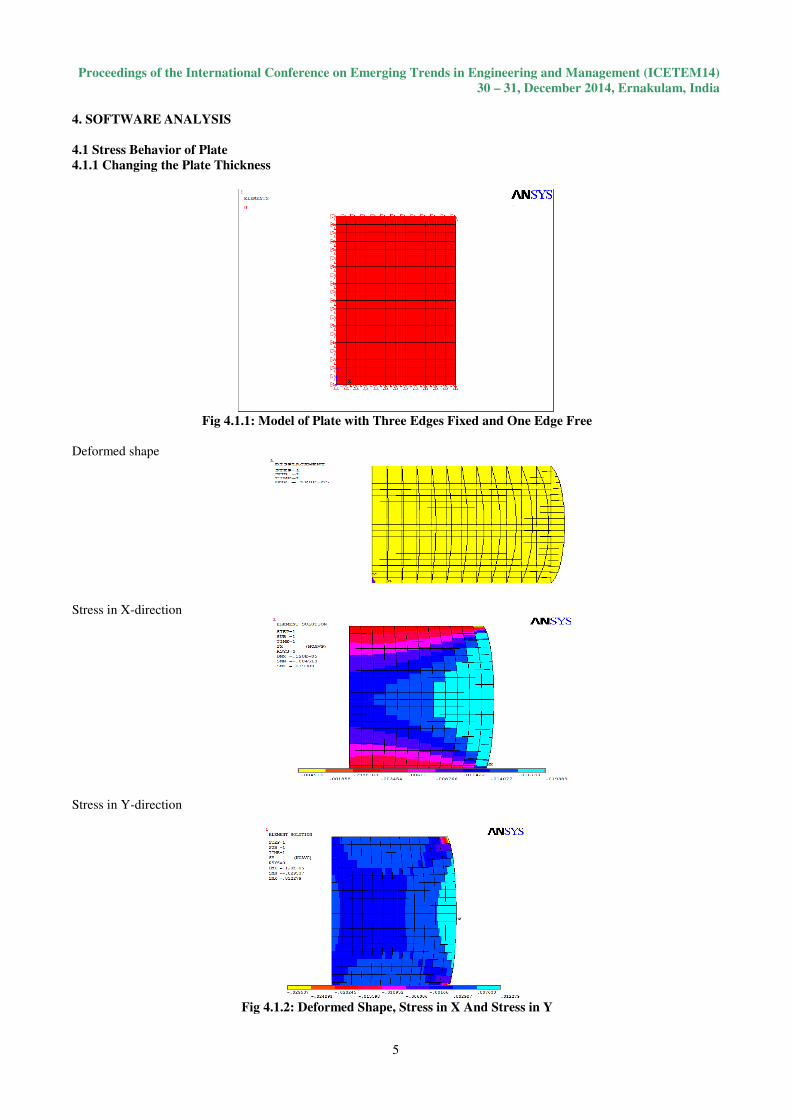
4. SOFTWARE ANALYSIS
4.1 Stress Behavior of Plate
4.1.1 Changing the Plate Thickness
Fig 4.1.1: Model of Plate with Three Edges Fixed and One Edge Free
Deformed shape
Stress in X-direction
Stress in Y-direction
Fig 4.1.2: Deformed Shape, Stress in X And Stress in Y
Proceedings of the International Conference on Emerging Trends in Engineering and Management (ICETEM14)
30 – 31, December 2014, Ernakulam, India
6
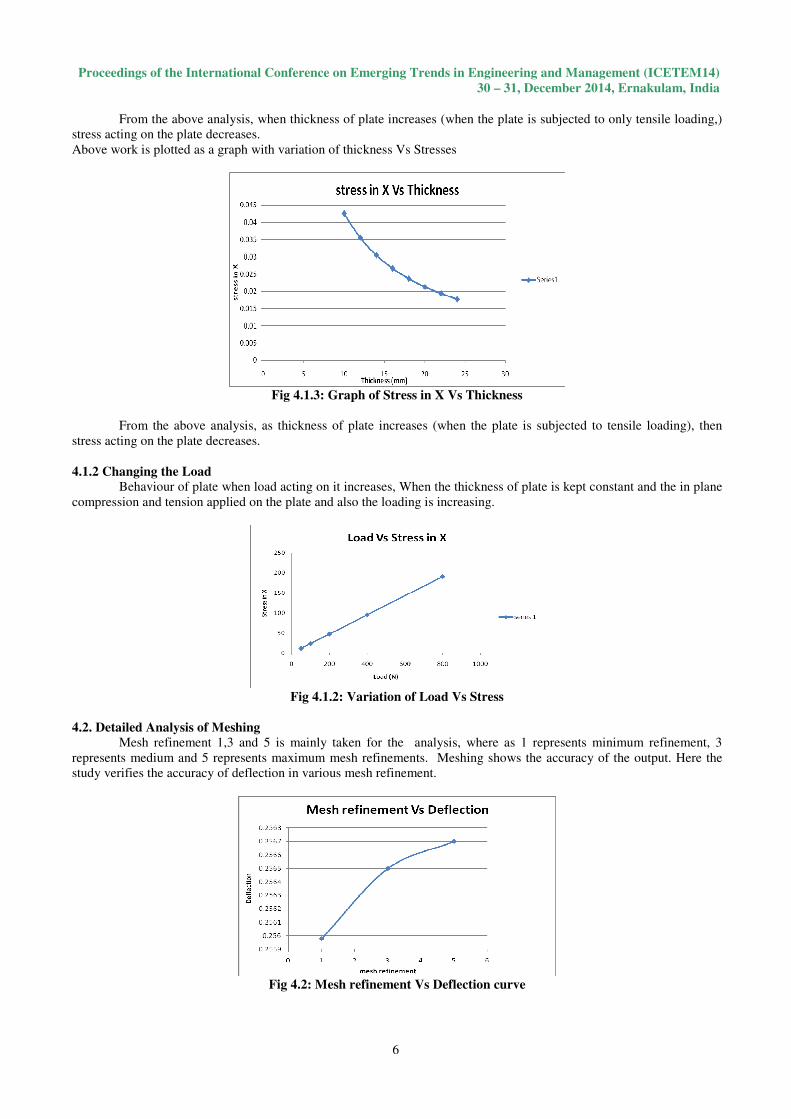
From the above analysis, when thickness of plate increases (when the plate is subjected to only tensile loading,)
stress acting on the plate decreases.
Above work is plotted as a graph with variation of thickness Vs Stresses
Fig 4.1.3: Graph of Stress in X Vs Thickness
From the above analysis, as thickness of plate increases (when the plate is subjected to tensile loading), then
stress acting on the plate decreases.
4.1.2 Changing the Load
Behaviour of plate when load acting on it increases, When the thickness of plate is kept constant and the in plane
compression and tension applied on the plate and also the loading is increasing.
Fig 4.1.2: Variation of Load Vs Stress
4.2. Detailed Analysis of Meshing
Mesh refinement 1,3 and 5 is mainly taken for the analysis, where as 1 represents minimum refinement, 3
represents medium and 5 represents maximum mesh refinements. Meshing shows the accuracy of the output. Here the
study verifies the accuracy of deflection in various mesh refinement.
Fig 4.2: Mesh refinement Vs Deflection curve
Proceedings of the International Conference on Emerging Trends in Engineering and Management (ICETEM14)
30 – 31, December 2014, Ernakulam, India
7
5. STRESSES AND DEFLECTION OF PLATE UNDER VARYING BOUNDARY CONDITION
Table 5.1: boundary conditions and stresses
sl. Boundary conditions Load N Stress in X Stress in Y
1
Rectangular Plates with Three
Edges Built In and the Fourth
Edge Free 50 68.78 10.35
2
Two Opposite Edges Simply
Supported, the Third Edge
Free, and the Fourth Edge
Built In 50 -4.568 -7.74
3
Three Edges Simply supported
and the One Edge Built In 50 -4.38 -7.723
4
Two Opposite Edges Simply
Supported and the Other Two
Edges Clamped. 50 -4.324 -7.182
5
One Edge or Two Adjacent
Edges Simply Supported and
the Other Edges Built In. 50 -1.834 -1.864
Fig 5.1: Stress-Boundary condition diagram
The above graph shows the variations of stress corresponding to different boundary conditions. Here reference
load is taken as 50N. From this graph, we can easily identify how the plate is behaving under various boundary
conditions. When Rectangular Plates with Three Edges Built In and the Fourth Edge Free (Let the boundary of the plate
be clamped at y =0 and x = ±a/2 and free along y = b, and uniformly distributed load of intensity q) shows maximum
stress both in X and Y direction.
Table 5.2: Boundary conditions and deflections
sl. Boundary conditions Load N Deflections
1
One Edge or Two Adjacent
Edges Simply Supported and the
Other Edges Built In. 50 0.0364
2
Three Edges Simply supported
and the One Edge Built In 50 0.1858
3
Two Opposite Edges Simply
Supported and the Other Two
Edges Clamped. 50 0.18688
4
Rectangular Plates with Three
Edges Built In and the Fourth
Edge Free 50 0.2567
5
Two Opposite Edges Simply
Supported, the Third Edge Free,
and the Fourth Built 50 0.277
Proceedings of the International Conference on Emerging Trends in Engineering and Management (ICETEM14)
30 – 31, December 2014, Ernakulam, India
8
Fig 5.2 Deflection –Boundary conditions diagram
This graph shows the relation between boundary condition and deflection. Here also maximum deflection
occurred at boundary condition 1.
6. MANUAL ANALYSIS
6.1. Rectangular Plates with Three Edges Built In and the Fourth Edge Free.
Plates with such boundary conditions are of particular interest as an integral part of rectangular tanks or retaining
walls. Consequently, the uniformly distributed and the hydrostatic load must be considered first of all in that case.
Here plate of size 1600x2400x22mm is considered. Hence, b/a = 1.5.so for manual calculation Wmax = .01462*q*a^4/D.
Table 6.1: Comparison table
Comparison of manual result and software result
b/a Load (N) q W(max) Deflection
(manual)
Deflection
(software)
1.5 50 .01462*q*a^4/D 0.2177 0.2567
1.5 100 .01462*q*a^4/D 0.4355 0.6357
1.5 200 .01462*q*a^4/D 0.871 1.272
1.5 400 .01462*q*a^4/D 1.742 2.545
1.5 800 .01462*q*a^4/D 3.484 5.086
Fig 6.1 Load-Deflection diagram
6.2. Deflections for a Uniformly Loaded Plate with Two Opposite Edges Simply Supported, the Third Edge Free,
and the Fourth Built.
Here also plate of size 1600x2400x22mm is considered. where b/a = 1.5.so for manual calculation Wmax =
0.0141q /4.
Proceedings of the International Conference on Emerging Trends in Engineering and Management (ICETEM14)
30 – 31, December 2014, Ernakulam, India
9
Table 6.2: Comparison table
Comparison of manual result and software result
b/a Load
(N) q W(max)
Deflection
(manual)
Deflection
(software)
1.5 50 .0141*q*a^4/D 0.21 0.2697
1.5 100 .0141*q*a^4/D 0.42 0.539
1.5 200 .0141*q*a^4/D 0.84 1.079
1.5 400 .0141*q*a^4/D 1.68 2.158
1.5 800 .0141*q*a^4/D 3.36 4.316
Fig 6.2: Load-Deflection diagram
6.3. Rectangular Plates with Three Edges Simply supported and the One Edge Built In
Let us consider a rectangular plate built in along the edge y = b/2 and simply supported along the other edges.
The deflection of the plate under any lateral load can be obtained by combining the solution for the plate with all sides
simply supported.
b/a = 1.5, hence 0.0064q /D this equation is used for the manual calculation.
Table 6.3: Comparison Table
Comparison of manual result and software result
b/a Load (N) q W(max) Deflection
(manual)
Deflection
(software)
1.5 50 .0141*q*a^4/D 0.0953 0.1858
1.5 100 .0141*q*a^4/D 0.191 0.3718
1.5 200 .0141*q*a^4/D 0.381 0.74366
1.5 400 .0141*q*a^4/D 0.763 1.487
1.5 800 .0141*q*a^4/D 1.525 2.974
Fig 6.3: Load- deflection diagram
Proceedings of the International Conference on Emerging Trends in Engineering and Management (ICETEM14)
30 – 31, December 2014, Ernakulam, India
10
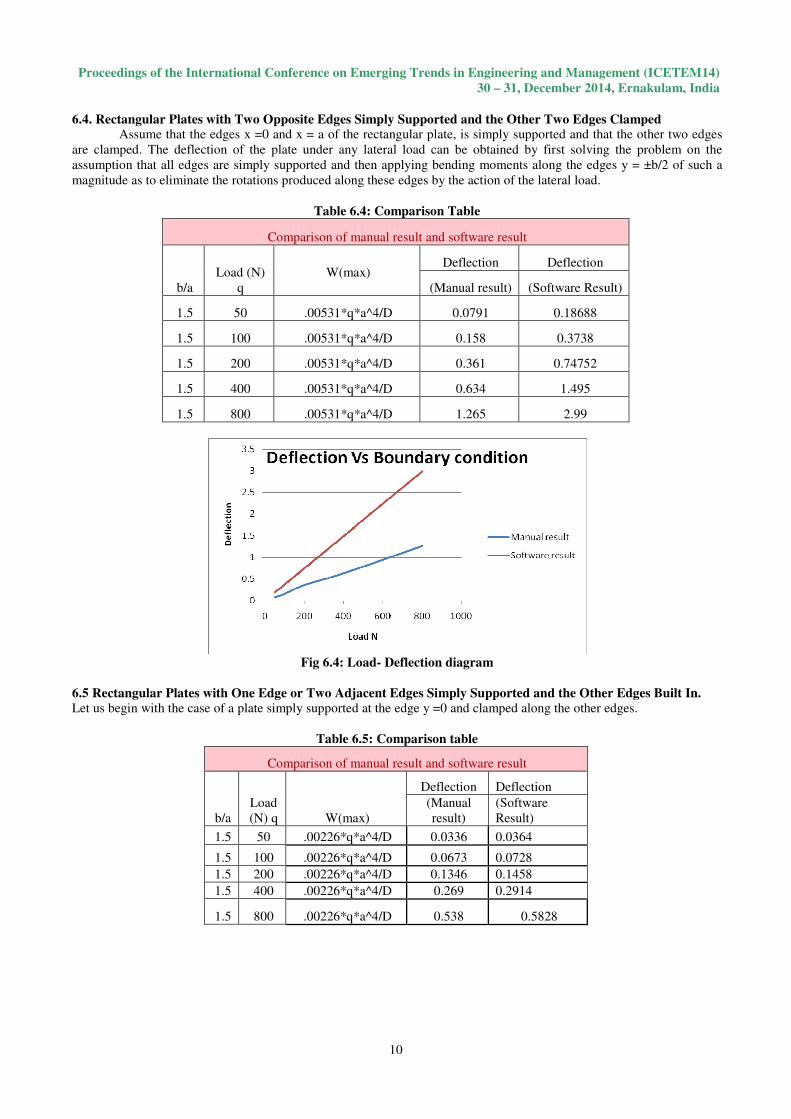
6.4. Rectangular Plates with Two Opposite Edges Simply Supported and the Other Two Edges Clamped Assume that the edges x =0 and x = a of the rectangular plate, is simply supported and that the other two edges
are clamped. The deflection of the plate under any lateral load can be obtained by first solving the problem on the
assumption that all edges are simply supported and then applying bending moments along the edges y = ±b/2 of such a
magnitude as to eliminate the rotations produced along these edges by the action of the lateral load.
Table 6.4: Comparison Table
Comparison of manual result and software result
b/a
Load (N)
q
W(max)
Deflection Deflection
(Manual result) (Software Result)
1.5 50 .00531*q*a^4/D 0.0791 0.18688
1.5 100 .00531*q*a^4/D 0.158 0.3738
1.5 200 .00531*q*a^4/D 0.361 0.74752
1.5 400 .00531*q*a^4/D 0.634 1.495
1.5 800 .00531*q*a^4/D 1.265 2.99
Fig 6.4: Load- Deflection diagram
6.5 Rectangular Plates with One Edge or Two Adjacent Edges Simply Supported and the Other Edges Built In.
Let us begin with the case of a plate simply supported at the edge y =0 and clamped along the other edges.
Table 6.5: Comparison table
Comparison of manual result and software result
b/a
Load
(N) q W(max)
Deflection Deflection
(Manual
result)
(Software
Result)
1.5 50 .00226*q*a^4/D 0.0336 0.0364
1.5 100 .00226*q*a^4/D 0.0673 0.0728
1.5 200 .00226*q*a^4/D 0.1346 0.1458
1.5 400 .00226*q*a^4/D 0.269 0.2914
1.5 800 .00226*q*a^4/D 0.538 0.5828
Proceedings of the International Conference on Emerging Trends in Engineering and Management (ICETEM14)
30 – 31, December 2014, Ernakulam, India
11
Fig 6.5: Load- deflection diagram
6.6 Corrections In Manual And Software Results:
From the above findings, we can observe that there is some correction between manual and software result. This
is shown below,
Table 6.6: Correction table
Correction Table
Reference load fixed as 50N
Sl
no. Boundary condition Deflection manual result Deflection software result
1
One Edge or Two Adjacent
Edges Simply Supported and
the Other Edges Built In. 0.0336 0.0364
2
Two Opposite Edges Simply
Supported, the Third Edge
Free, and the Fourth Built 0.21 0.2697
3
Rectangular Plates with Three
Edges Built In and the Fourth
Edge Free 0.2177 0.2567
4
Three Edges Simply supported
and the One Edge Built In 0.0953 0.1858
5
Two Opposite Edges Simply
Supported and the Other Two
Edges Clamped. 0.0791 0.1278
Fig 6.6: Boundary conditions – Deflection diagram
From the above graph, it is clear that, there is some variations in the manual and software result.
Proceedings of the International Conference on Emerging Trends in Engineering and Management (ICETEM14)
30 – 31, December 2014, Ernakulam, India
12
The graph showing the % of correction is,
Fig 6.7: Correction diagram
7. RELATION BETWEEN LOAD AND BOUNDARY CONDITION AT YIELD STRESS 250 MPA
Table 7.1: Load at yield stress 250MPa
Sl. Boundary conditions Load N
Yield stress
MPa
1
Two Opposite Edges Simply
Supported and the Other Two
Edges Clamped. 159.892 250
2
Three Edges Simply supported
and the One Edge Built In 159.871 250
3
One Edge or Two Adjacent
Edges Simply Supported and the
Other Edges Built In. 129.971 250
4
Two opposite edges simply
supported , the Third Edge
Free, and the Fourth Built 120.89 250
5
Edges Built In and the Fourth
Edge Free 100.8594 250
Fig 7.1: Load- boundary condition diagram
Proceedings of the International Conference on Emerging Trends in Engineering and Management (ICETEM14)
30 – 31, December 2014, Ernakulam, India
13
8. STUDY OF DEVELOPMENT OF INTERACTION CURVE
In this case plate is subjected to in plane and out of plane loading. This shows, when the plate subjected to out of
plane loading, how the variation of stresses affecting on the plate.
Fig 8.1: Graph showing stress in X and Y
Series 1 - Two Opposite Edges Simply Supported and the Other Two Edges Clamped
Series 2 - Three Edges Simply supported and the One Edge Built In
Series 3 - One Edge or Two Adjacent Edges Simply Supported and the Other Edges Built In
Series 4 - Two Opposite Edges Simply Supported, the Third Edge Free, and the Fourth Edge Built In
Series 5 - Rectangular Plates with Three Edges Built In and the Fourth Edge Free
8.2 Stress graph due to Combined loads
Rectangular Plates with Two Opposite Edges Simply Supported and the Other Two Edges Clamped.
In this case plate is subjected to in plane and out of plane loading. This shows, when these two loads act, how
the stresses affecting on the plate.
Fig 8.2: Stress graph
Series 1 – In plane loading
Series 2 – out of plane loading
Series 3 – combined loading
Proceedings of the International Conference on Emerging Trends in Engineering and Management (ICETEM14)
30 – 31, December 2014, Ernakulam, India
14
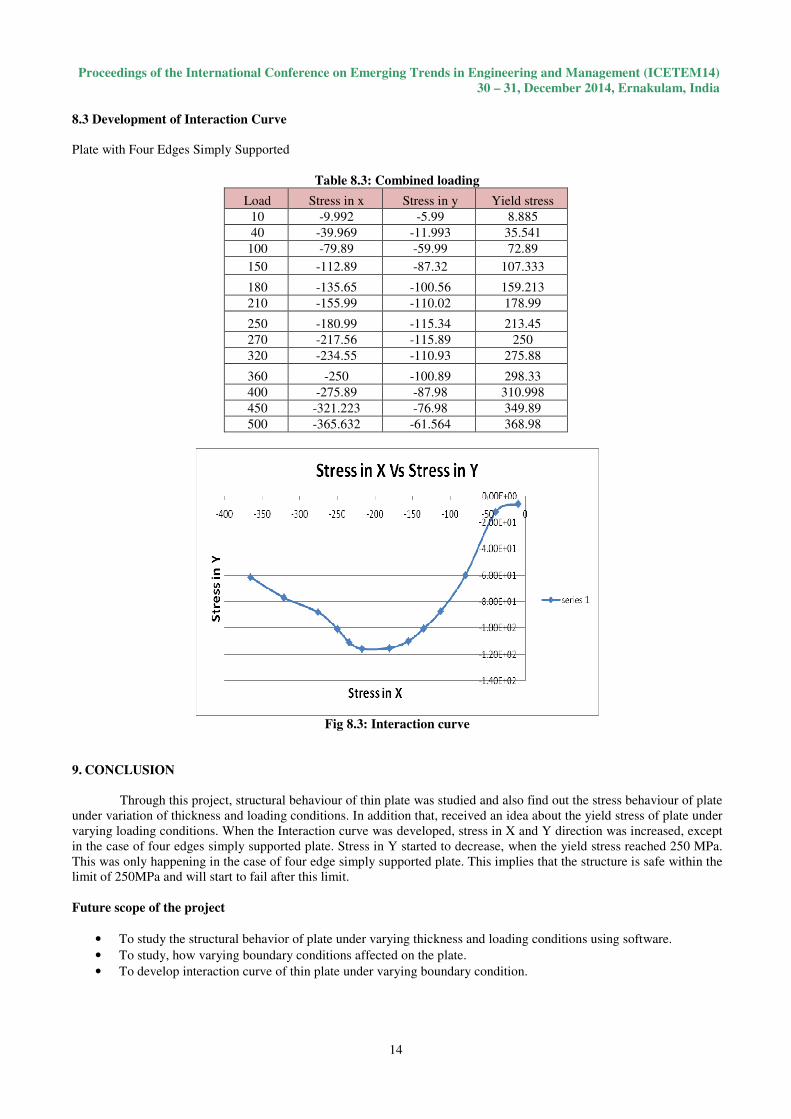
8.3 Development of Interaction Curve
Plate with Four Edges Simply Supported
Table 8.3: Combined loading
Load Stress in x Stress in y Yield stress
10 -9.992 -5.99 8.885
40 -39.969 -11.993 35.541
100 -79.89 -59.99 72.89
150 -112.89 -87.32 107.333
180 -135.65 -100.56 159.213
210 -155.99 -110.02 178.99
250 -180.99 -115.34 213.45
270 -217.56 -115.89 250
320 -234.55 -110.93 275.88
360 -250 -100.89 298.33
400 -275.89 -87.98 310.998
450 -321.223 -76.98 349.89
500 -365.632 -61.564 368.98
Fig 8.3: Interaction curve
9. CONCLUSION
Through this project, structural behaviour of thin plate was studied and also find out the stress behaviour of plate
under variation of thickness and loading conditions. In addition that, received an idea about the yield stress of plate under
varying loading conditions. When the Interaction curve was developed, stress in X and Y direction was increased, except
in the case of four edges simply supported plate. Stress in Y started to decrease, when the yield stress reached 250 MPa.
This was only happening in the case of four edge simply supported plate. This implies that the structure is safe within the
limit of 250MPa and will start to fail after this limit.
Future scope of the project
• To study the structural behavior of plate under varying thickness and loading conditions using software.
• To study, how varying boundary conditions affected on the plate.
• To develop interaction curve of thin plate under varying boundary condition.
Proceedings of the International Conference on Emerging Trends in Engineering and Management (ICETEM14)
30 – 31, December 2014, Ernakulam, India
15
10. ACKNOWLEDGEMENT
First and foremost I thank to lord almighty for the grace, strength, and hope to carry out and complete the master's
thesis report.
I wish to record my sincere thanks to Dr. V.S. Pradeepan, Head of Civil Engineering Department, SNGCE, for
his valuable suggestion.
I wish to express my deep sense of gratitude to our class coordinator and seminar coordinator Mrs. S. Usha,
Professor, Civil Engineering, for the sustained guidance and useful suggestions in completing the master's thesis work.
I wish to record my sincere gratitude to Mr. Harinarayanan. S, Professor, Civil Engineering, our seminar
coordinator for the sustained guidance and useful suggestions in completing the master's thesis work.
I wish to express my deep sense of gratitude to Mr. Unni Kartha G, Head of Civil Engineering Department,
FISAT, for his valuable time, sustained guidance and useful suggestions, which helped me in completing the master's
thesis work, in time.
I wish to express my deep sense of gratitude to my guide Mrs. Manju P.M, Associate Professor, Civil
Engineering, for her valuable time, sustained guidance and useful suggestions, which helped me in completing the
master's thesis work, in time.
Last, but not the least, I would like to express my heartfelt thanks to my beloved parents for their blessings, my
friends/classmates for their help and wishes for the successful completion of this master's thesis work.
REFERENCES
[1] Theory of plates and shells by Timoshinko.
[2] Niino, A., Maeda, S., “Recent development status of functionally gradient materials”. ISIJ International 30,
699–703, 1990.
[3] Shames, I.H., Dym, C.L., “Energy and Finite Element Methods in Structural Mechanics”. McGraw-Hill, New
York, 1985.
[4] Charles W. Bert , Krishna K. Devarakonda “Buckling of rectangular plats subjected to nonlinearly distributed
in- plane loading” International Journal of Solids and Structures 40 (2003) 4097–4106.
[5] Zahid A. Siddiqi a, Anant R. Kukreti “Analysis of eccentrically stiffened plates with mixed
boundaryconditions using differential quadrature method” Applied Mathematical Modelling 22,251-275, 1998.
[6] D. D. Milasinovic, "Geometric non-linear analysis of thin plate structures using harmonic coupled finite strip
method," Thin-Walled Structures, vol. 49, 2011, pp. 280-290.
[7] J.N. Reddy and D.H. Robbins, “Theories and computational models for composite laminates”, Appl. Mech.
Rev., vol. 47, pp. 147–169. 1994.
[8] Silverman, E., Rhodes, M., and Dyer, J., “Composite isogrid structures for spacecraft components,” SAMPE
Journal 35, 1999.pp 51–59.
[9] Wang X, Xinfeng X. “Accurate buckling loads of thin rectangular plates under parabolic edge compressions by
the differential quadrature method”. Inter- national Journal of Mechanical Sciences; 49:447–53. 2007
[10] Jafarpour Hamedani Sh, Khedmati MR, Azkat , “Vibration analysis of stiffened plates using finite element
method. Latin American Journal of Solids and Structures” Vol 9:1–20. 2012.
[11] Sh. Jafarpour hamedani, M.R. Khedmati, “Vibrations of stiffened plates with initial geometric imperfections”,
Master’s Thesis, Faculty of Marine Technol- ogy, Amirkabir University of Technology, Tehran, Iran,),