Page 1
Instructions for use
Title Development of Maillard reaction based time temperature indicator/integrator for application of agricultural and foodprocess engineering
Author(s) 李, 廷絢
Citation 北海道大学. 博士(農学) 甲第13142号
Issue Date 2018-03-22
DOI 10.14943/doctoral.k13142
Doc URL http://hdl.handle.net/2115/70147
Type theses (doctoral)
File Information Junghyun_Lee.pdf
Hokkaido University Collection of Scholarly and Academic Papers : HUSCAP
Page 2
Development of Maillard reaction based
time-temperature indicator/integrator
for application
of agricultural and food process engineering
(農業および食品プロセス工学のための
メイラード反応に基づく
積算温度インジケータの開発)
Hokkaido University
Graduate School of Agriculture
Division of Bio-systems Sustainability
Doctor Course
Lee JungHyun
Page 3
Acknowledgements
i
Acknowledgements
I am thankful to all the people who guided and encouraged me during the
completion of this research. First and foremost I want to thank, Assoc. Prof. Dr.
Shigenobu Koseki, my major supervisor, whose encouragement, guidance, and support
during my doctoral course enabled me to focus and achieve for the research. I am also
equally thankful to Prof. Dr. Shuso Kawamura and Prof. Dr. ChungSu Han, they were
always there to help me with his valuable advice and encouraged me. My sincere thanks
to co-evaluators Prof. Dr. Kazunori Iwabuchi for his constructive comments and
suggestions to the dissertation.
I am thankful to the all laboratory members, especially, Maillard reaction research
group: Rikako Harada, Akane Morita, and Kentaro Sakai for their valuable advice and
friendly help.
I would like to thank also Hokkaido Ornamental Plants and Vegetables Research
Center and Aeon Co. Ltd. for supporting in the experimental place and materials.
The financial support from the Rotary Yoneyama Memorial Foundation is
gratefully acknowledged. Especially, all member of Sapporo teine Rotary club as my
sewa club is always encouraged me to stabilize the Japan livelihood, as well as the
financial support.
Finally, my warmest thanks go to my father, my mother and my younger sister for
their everlasting unconditional support.
Page 4
ii
Table of Contents
Acknowledgement ··············································································· i
Table of Contents ················································································ ii
List of Tables ···················································································· vii
List of Figures ··················································································· viii
Chapter 1 Introduction
1.1 Importance of temperature management ·········································· 1
1.2 Time-temperature integrator/indicator ············································ 3
1.3 Maillard reaction ···································································· 8
1.4 Research objectives ································································· 10
Chapter 2 Color variation characteristic of Maillard reaction
2.1 Introduction ··········································································· 11
2.2 Materials and methods ······························································ 13
2.2.1 Reactant ·········································································· 13
2.2.2 Analysis of color changes ····················································· 14
2.2.3 Predictive modeling of color change kinetics ······························ 17
2.3 Result and discussion ······························································· 19
2.3.1 Characterization of color change under different conditions ············ 19
2.3.2 The quantitative evaluation of color change in Maillard reaction ······ 20
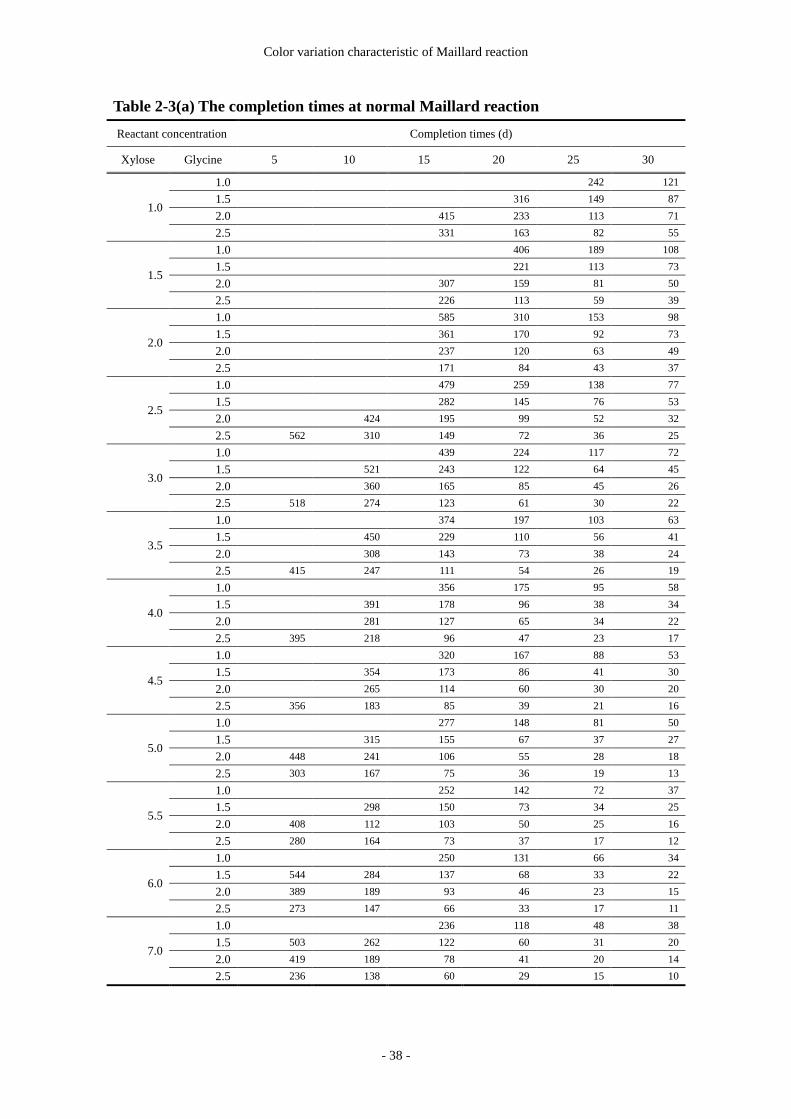
2.3.3 Effect of reactant concentration and temperature on color change ····· 36
2.3.4 Development of a model for predicting color variation ·················· 44
Page 5
iii
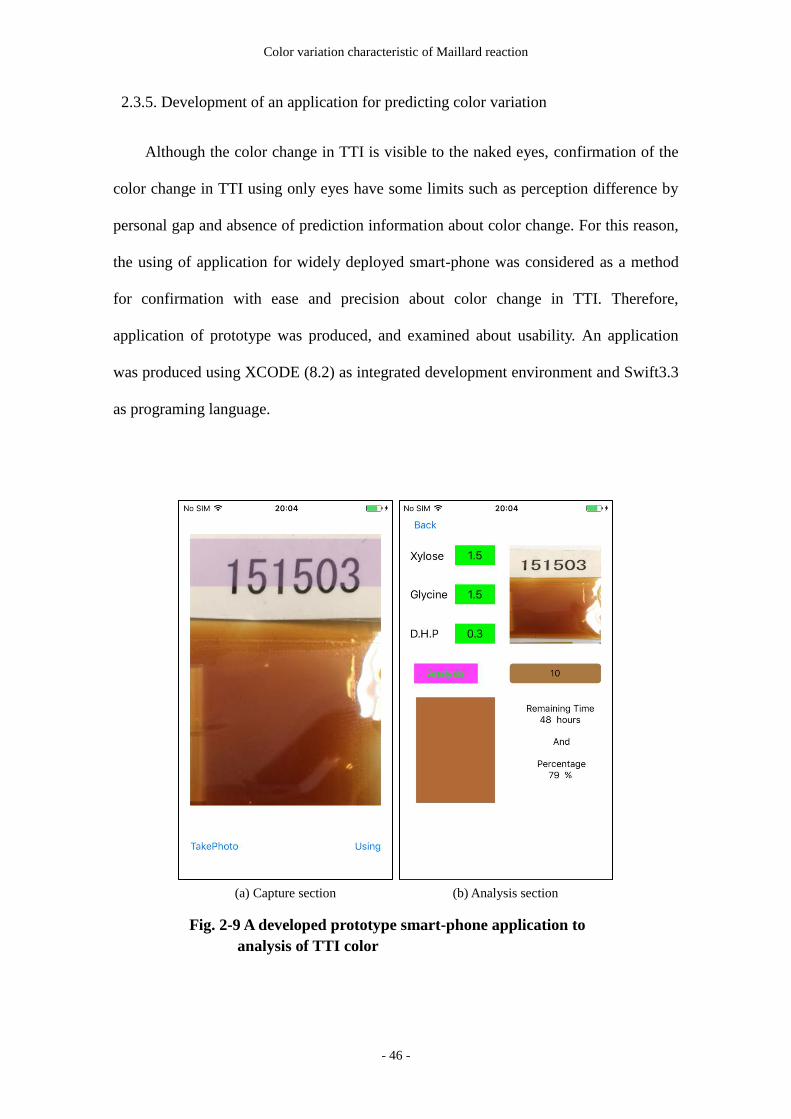
2.3.5 Development of an application for predicting color variation ··········· 46
2.4 Conclusion ··········································································· 48
Chapter 3 Application of a developed TTI into ripening and storage for melon
3.1 Introduction ··········································································· 49
3.2 Materials and methods ······························································ 51
3.2.1 Materials ········································································· 51
3.2.2 Pretreatment of melon ··························································· 51
3.2.3 Temperature conditions ························································· 52
3.2.4 Weight loss ······································································ 53
3.2.5 Color of the pulp ······························································· 53
3.2.6 Soluble solids contents (SSC) ················································ 54
3.2.7 Firmness ········································································· 54
3.2.8 Temperature dependence of quality change for melon ··················· 54
3.2.9 Time-temperature indicator (TTI) ··········································· 55
3.2.10 Statistical analysis ···························································· 55
3.3 Results and discussion ······························································ 56
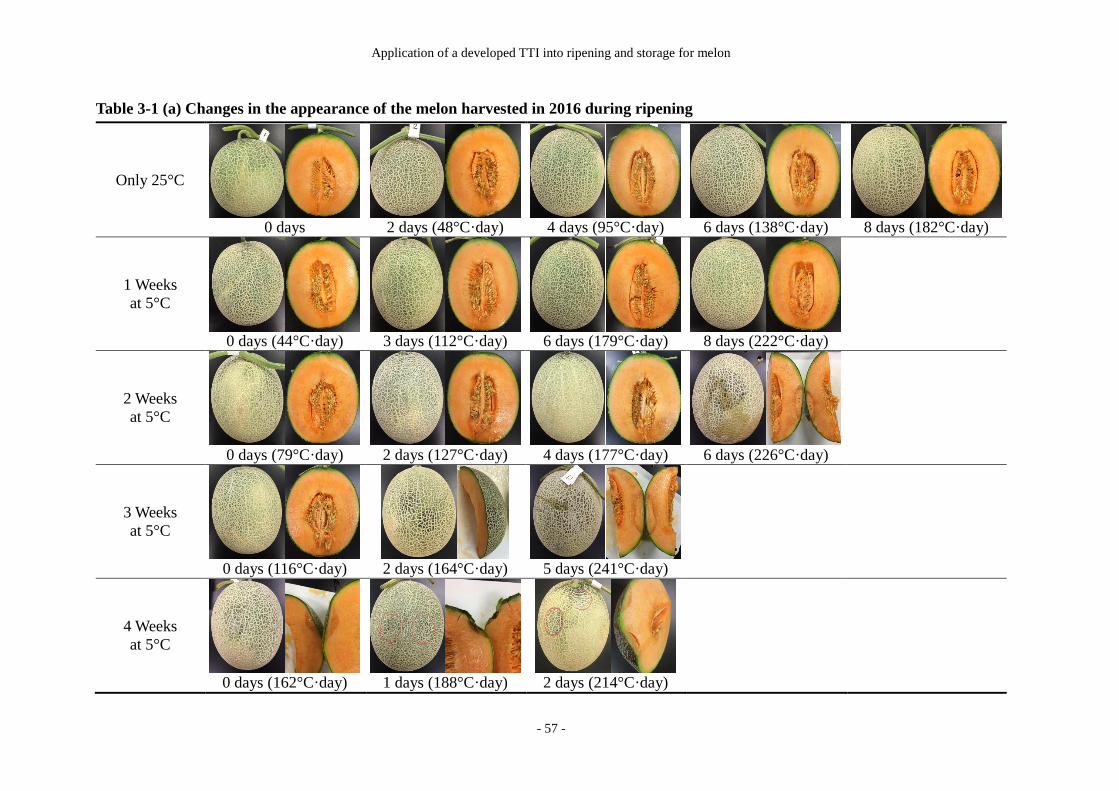
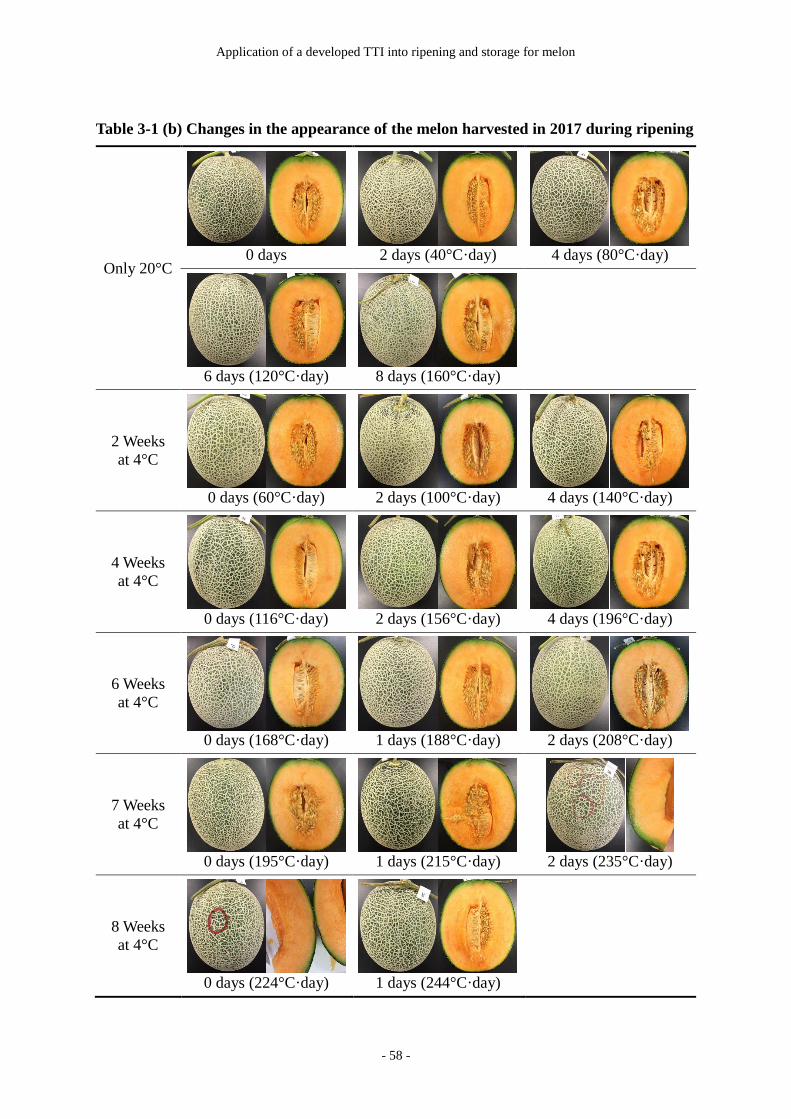
3.3.1 Changes in the appearance of the melon pulp during ripening period ··· 56
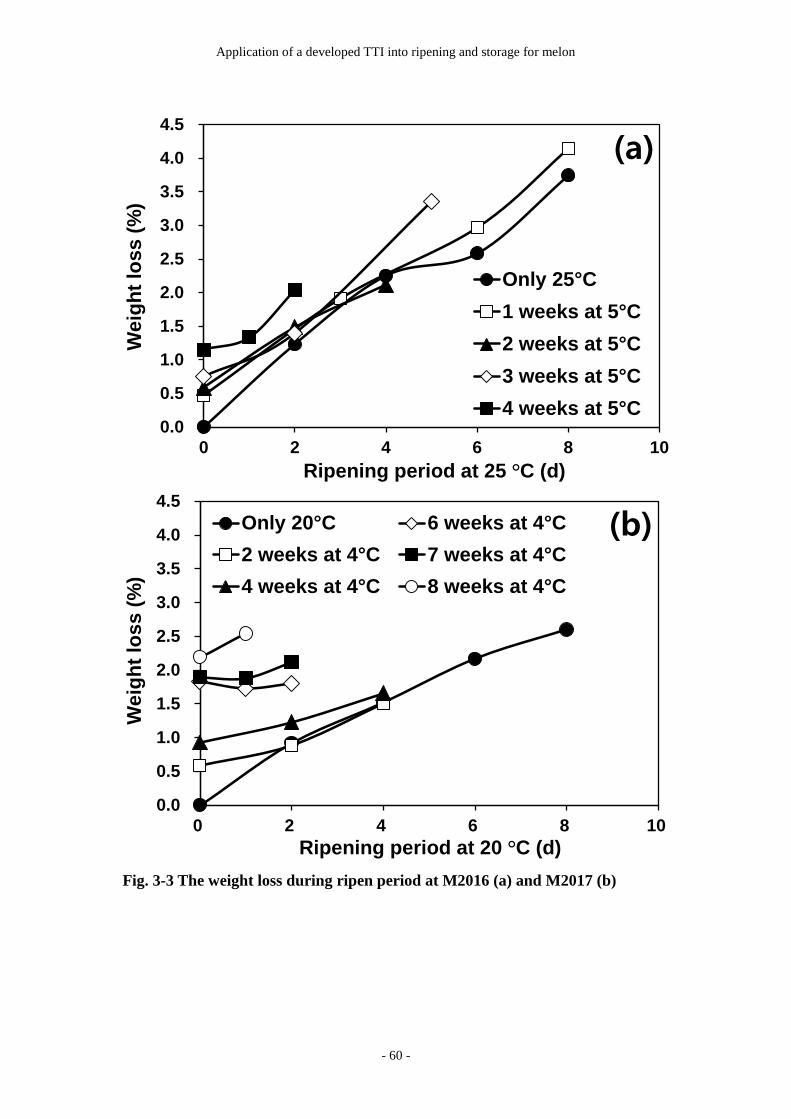
3.3.2 Weight loss ······································································ 59
3.3.3 Color of the pulp ······························································· 61
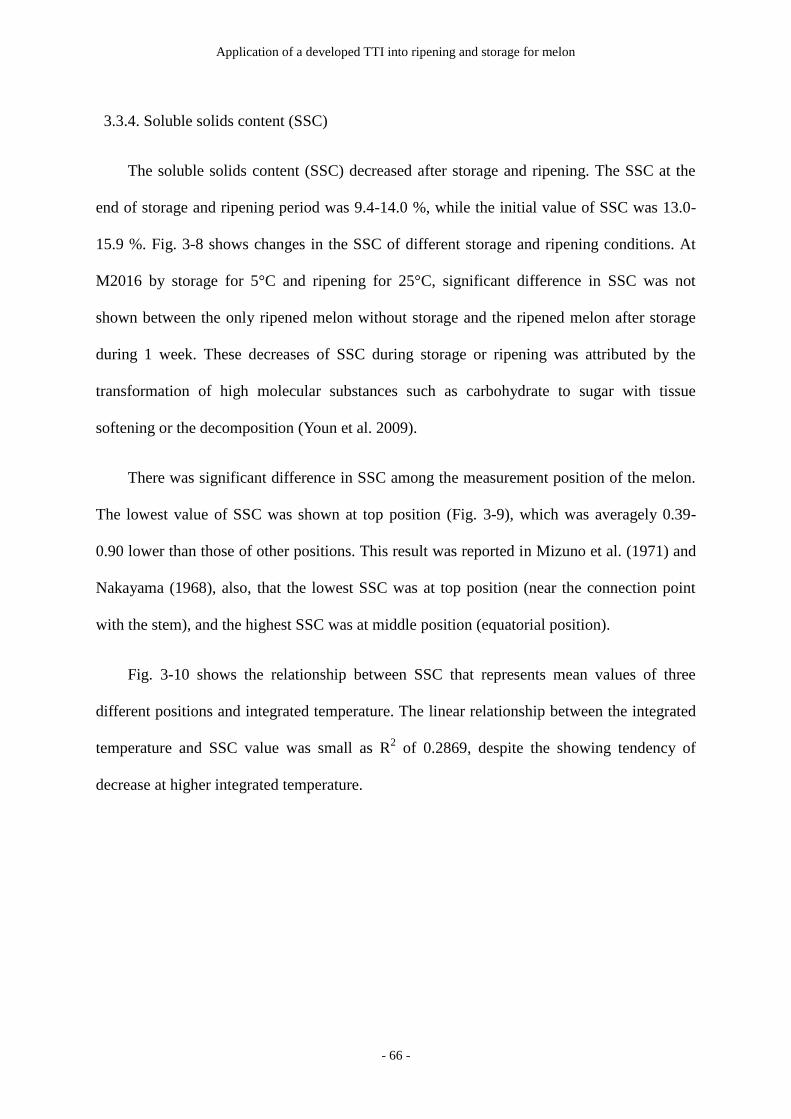
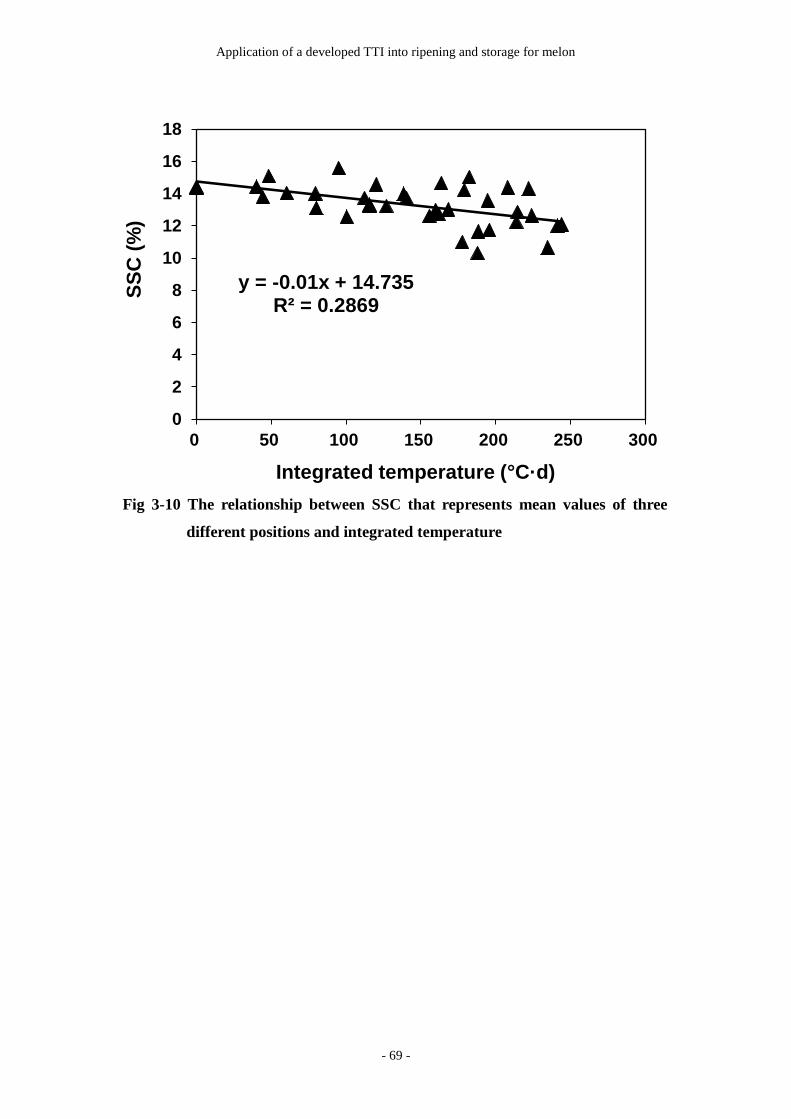
3.3.4 Soluble solids contents (SSC) ················································ 66
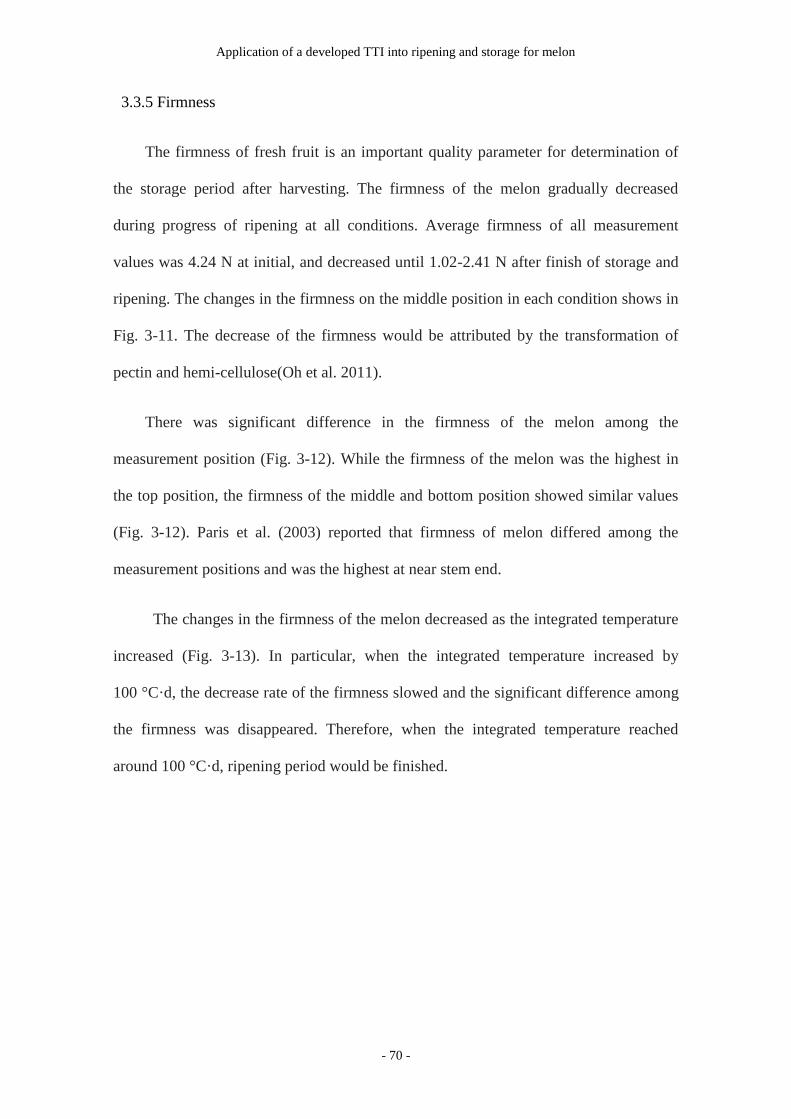
3.3.5 Firmness ········································································· 70
3.3.6 Temperature dependence of quality change for melon ··················· 74
3.3.7 Application of TTI (time-temperature indicator) ·························· 76
3.4 Conclusion ··········································································· 78
Page 6
iv
Chapter 4 Application of a developed TTI into shipping and storage for
vacuum-packaged beef
4.1 Introduction ··········································································· 79
4.2 Materials and methods ······························································ 81
4.2.1 Materials ········································································· 81
4.2.2 Drip loss ········································································· 82
4.2.3 pH ················································································ 82
4.2.4 Color of flesh surface ·························································· 83
4.2.5 Microbiological analysis ······················································ 83
4.2.6 Shear force ······································································· 84
4.2.7 Amount of 2-thiobarbituric acid reactive substance (TBARS) ·········· 84
4.2.8 Cooking loss ····································································· 85
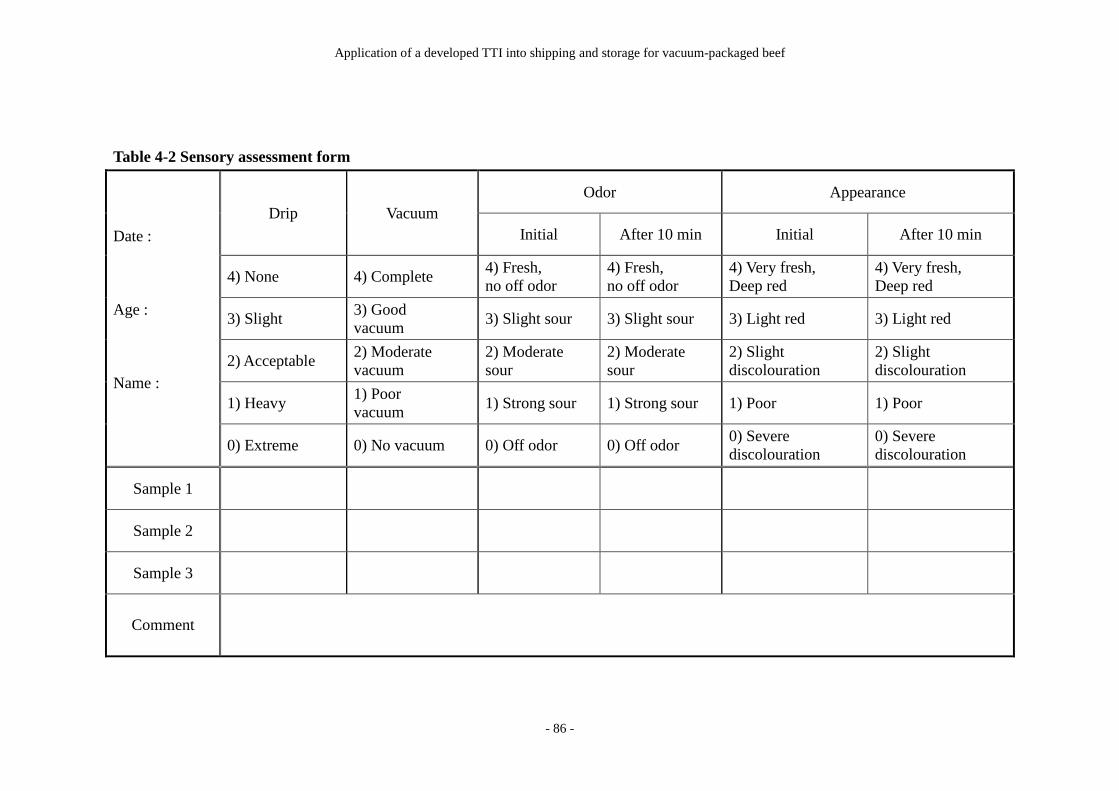
4.2.9 Sensory evaluation ······························································· 85
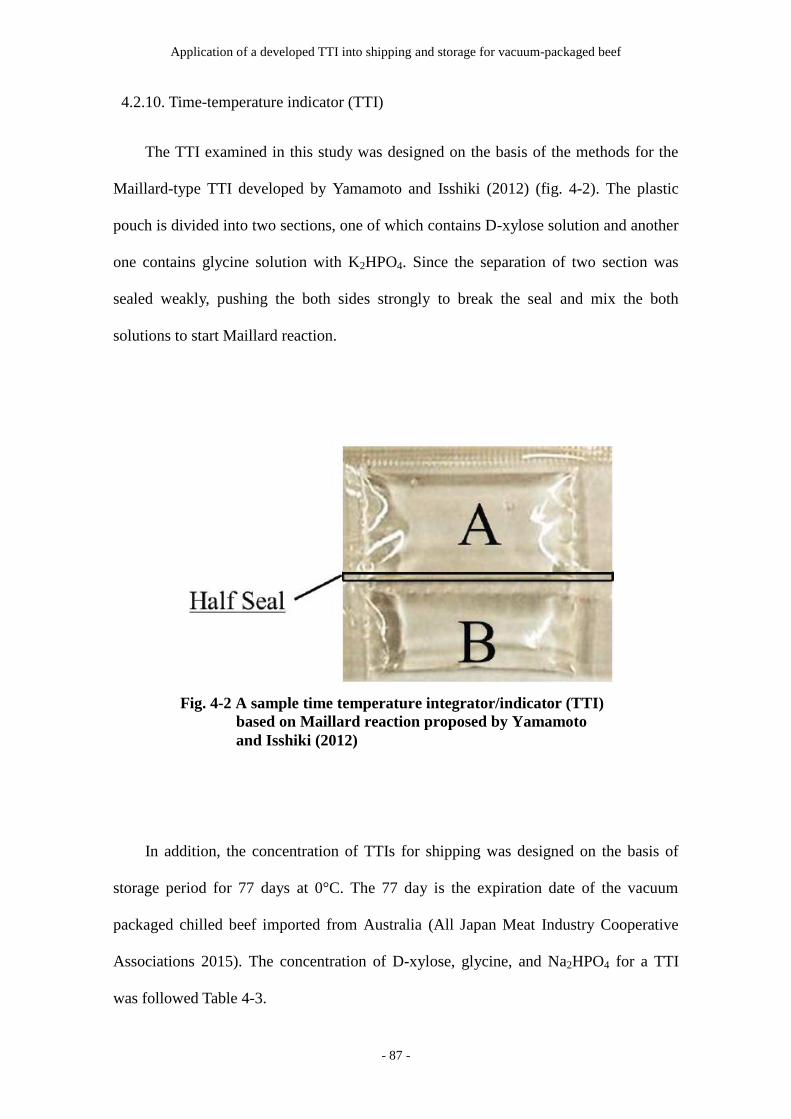
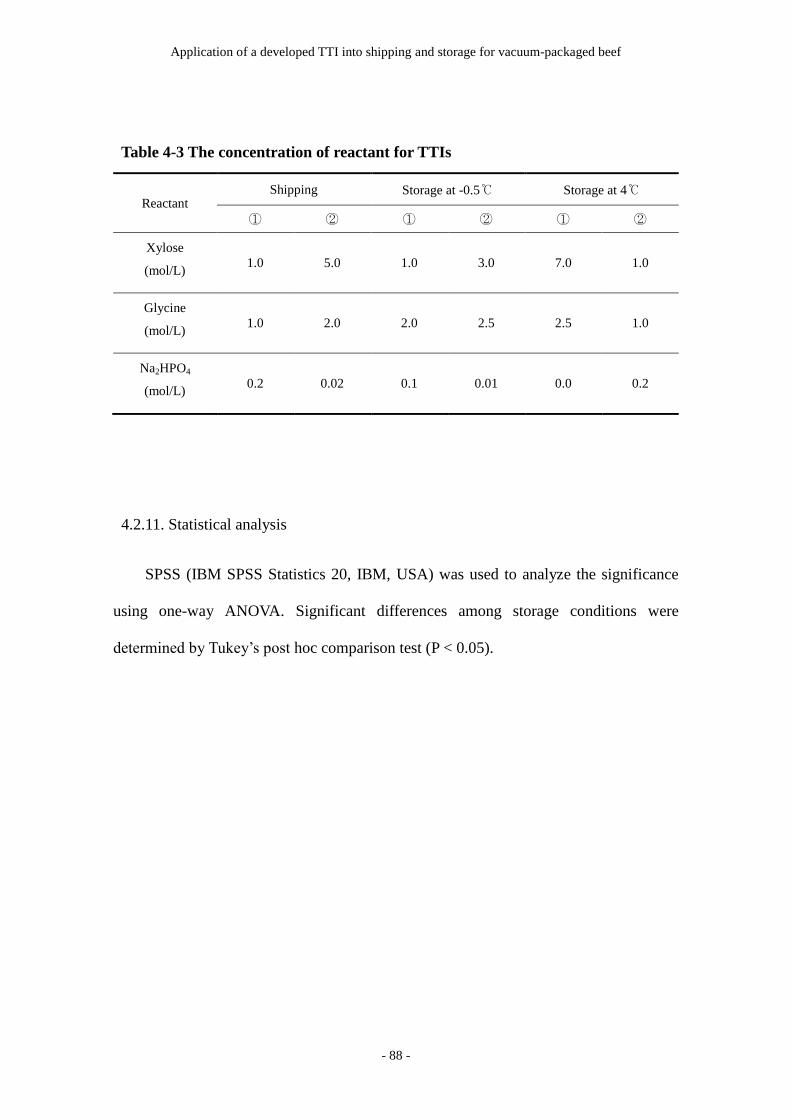
4.2.10 Time-temperature indicator (TTI) ·········································· 87
4.2.11 Statistical analysis ···························································· 88
4.3 Results and discussion ······························································ 89
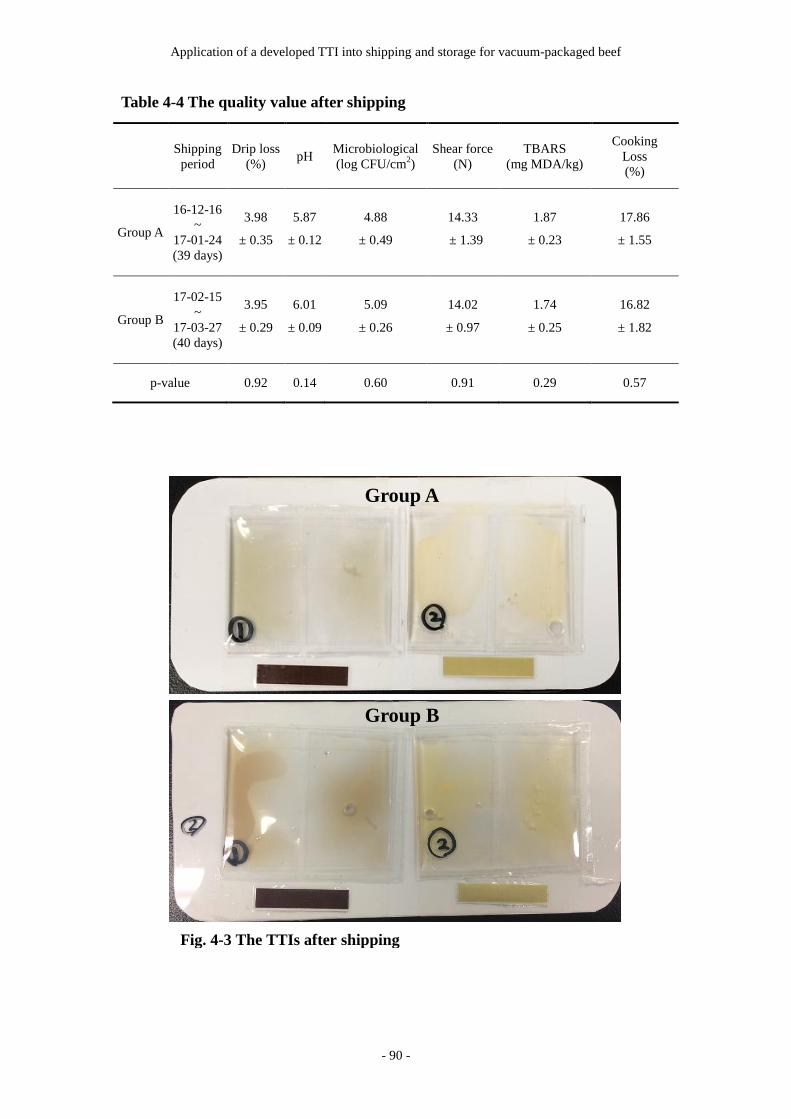
4.3.1 Changes in quality of beef after shipping ··································· 89
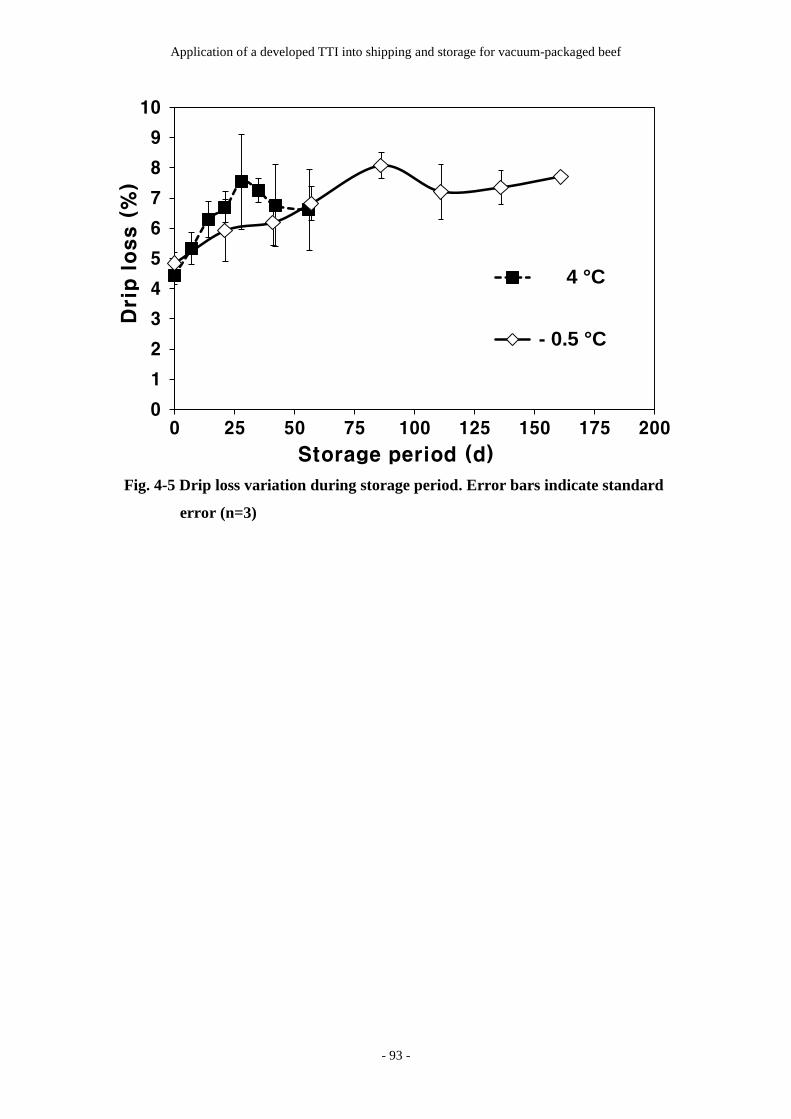
4.3.2 Drip loss ········································································· 92
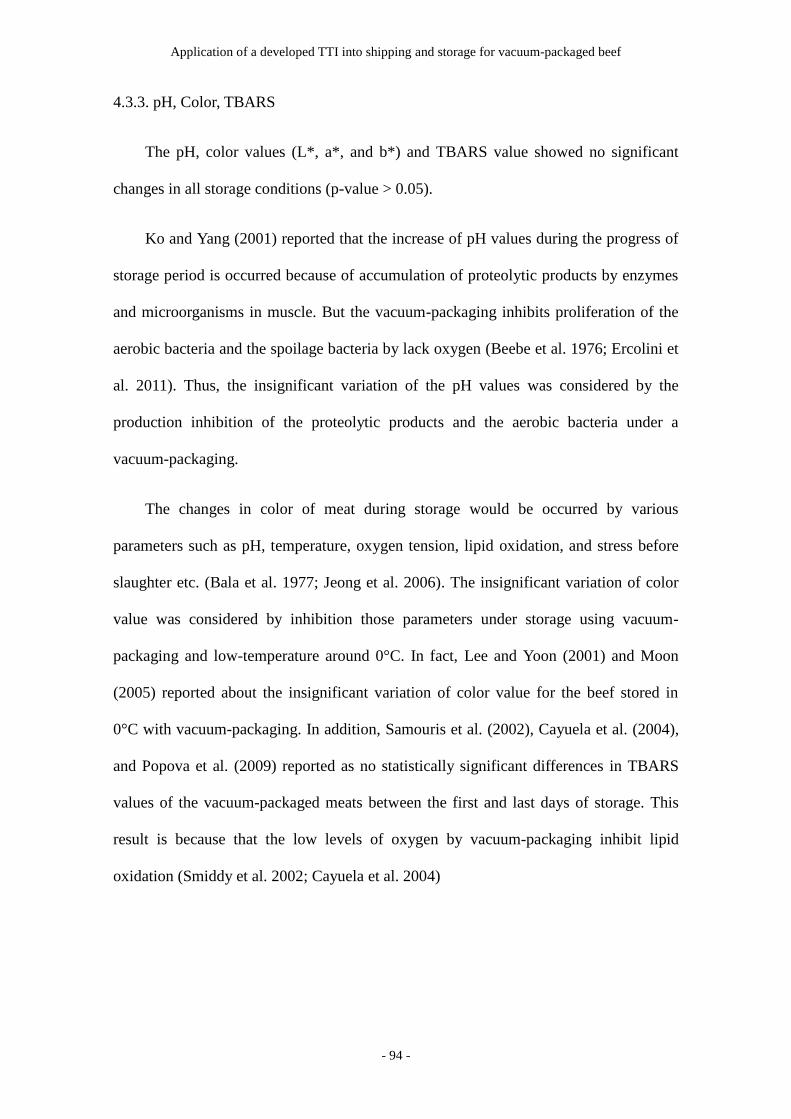
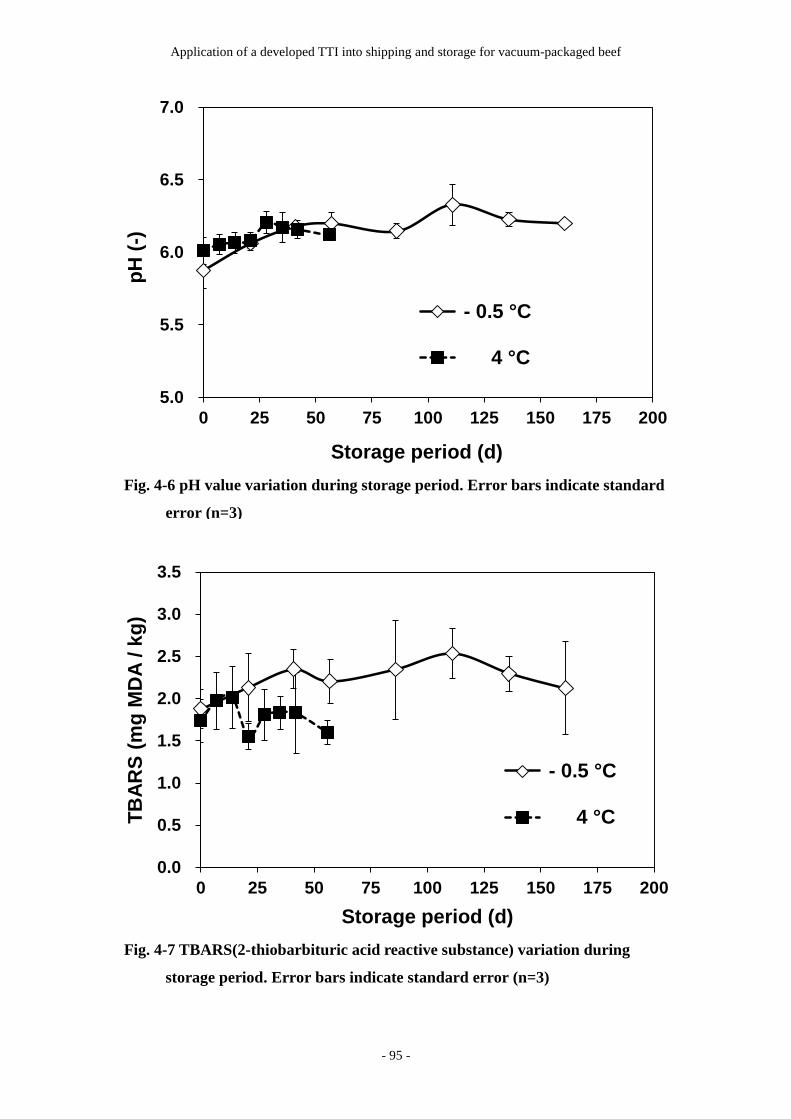
4.3.3 pH, Color, TBARS ····························································· 94
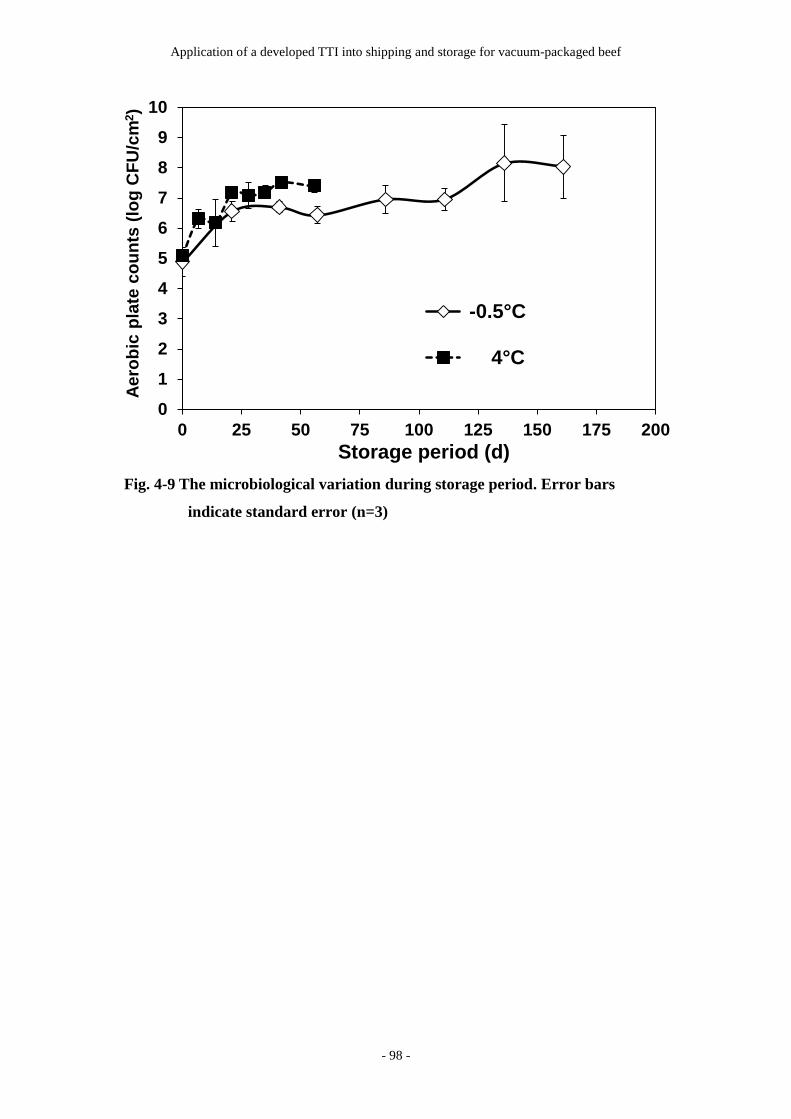
4.3.4 Microbiological analysis ······················································ 97
4.3.5 Shear force ······································································· 99
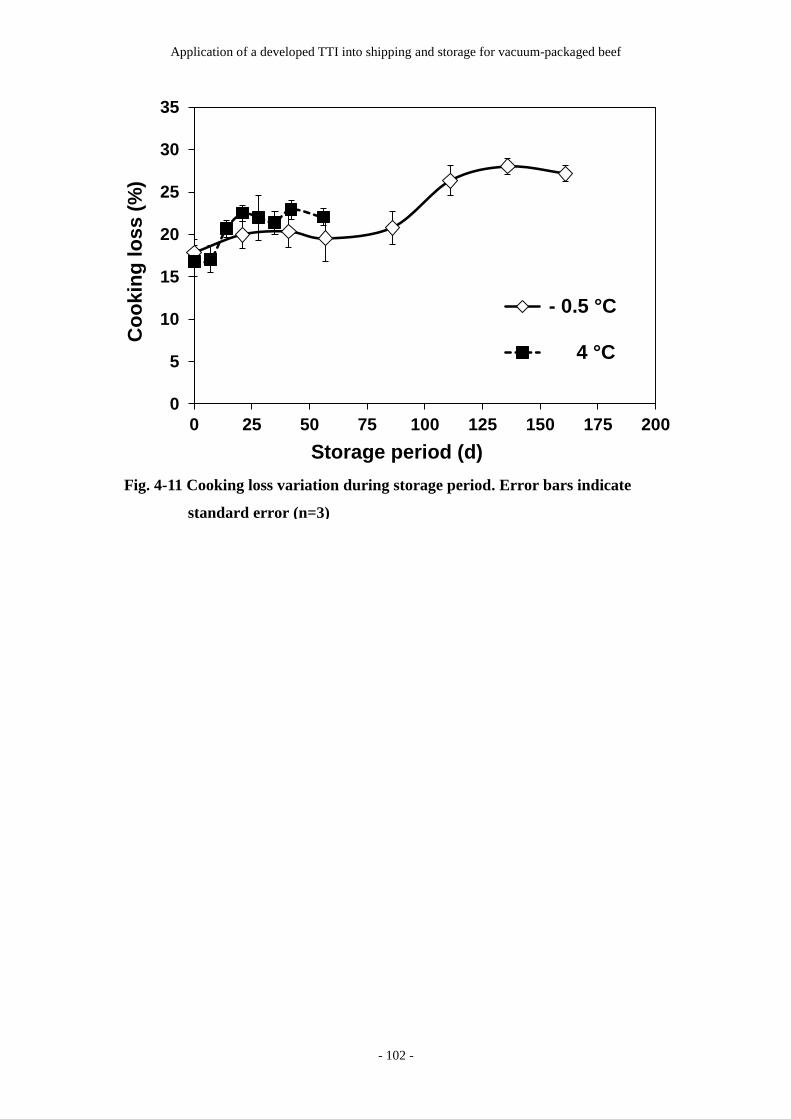
4.3.6 Cooking loss ···································································· 101
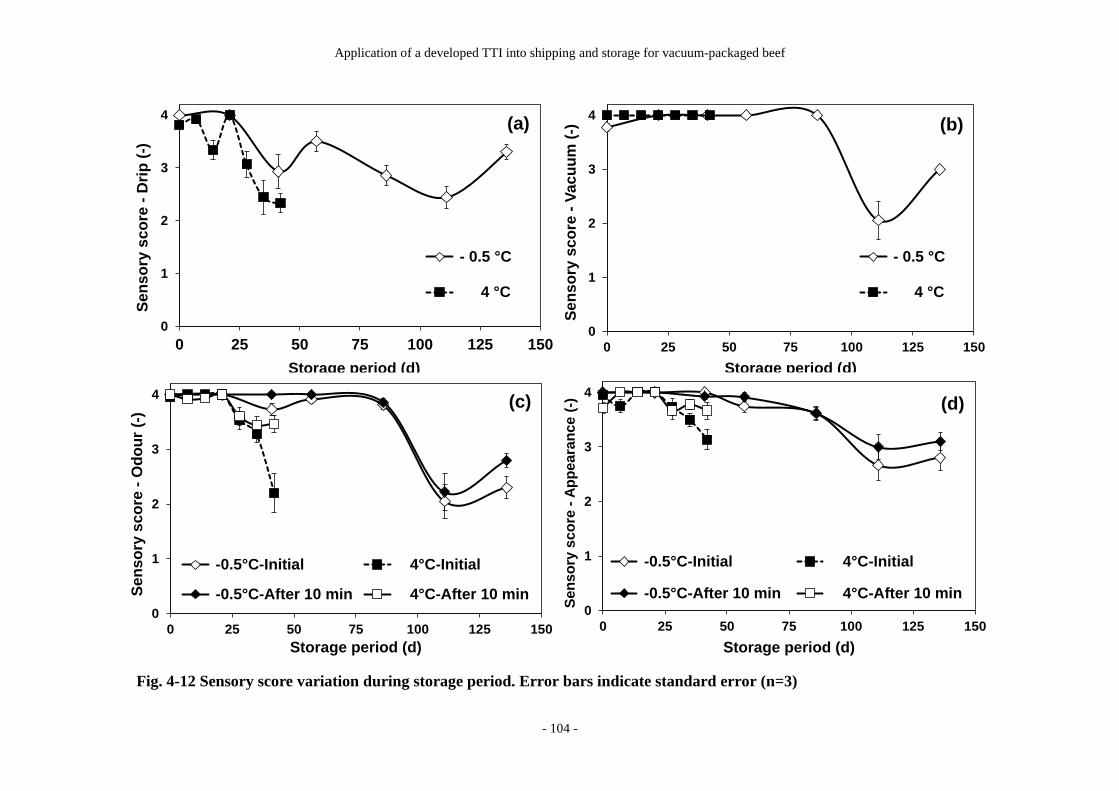
4.3.7 Sensory evaluation ···························································· 103
4.3.8 Application of TTI ···························································· 105
4.4 Conclusion ·········································································· 107
Page 7
v
Chapter 5 Application of a developed TTI for visualization of heating state of
processed foods
5.1 Introduction ·········································································· 108
5.2 Materials and methods ····························································· 111
5.2.1 Chemicals for Maillard reaction ············································· 111
5.2.2 Changes in color by Maillard reaction under heating conditions ······· 111
5.2.3 Monitoring of the color variation of the Maillard reaction
at constant temperatures ····················································· 112
5.2.4 Analysis and prediction of color variation ································· 112
5.2.5 Color variation in Maillard reaction
under rising temperature conditions ········································· 113
5.2.6 Practical application of Time-temperature indicator (TTI)
in hamburger cooking ························································ 114
5.2.7 Thermal inactivation of Escherichia coli O157:H7 in hamburgers ···· 115
5.3 Results and discussion ····························································· 117
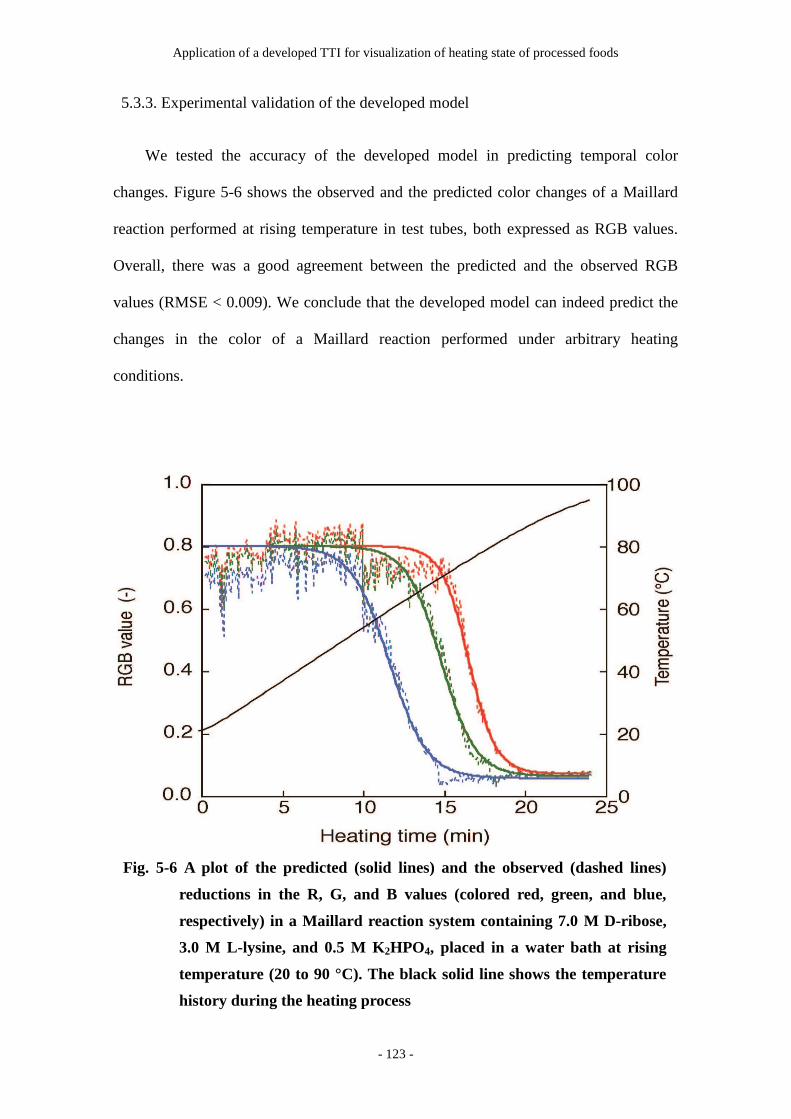
5.3.1 Selection of Maillard reaction substrates ·································· 117
5.3.2 Color change kinetics analysis ·············································· 121
5.3.3 Experimental validation of the developed model ························· 123
5.3.4 Performance of the Maillard eaction as a TTI
for hamburger cooking ······················································· 124
5.3.5 Confirmation of thermal inactivation E. coli O157:H7
in hamburgers ·································································· 126
5.4 Conclusion ·········································································· 128
Page 8
vi
Chapter 6 Summary ·········································································· 129
References ······················································································· 131
Page 9
List of Tables
vii
List of Tables
1.1 The commercially available TTIs ··················································· 7
2.1 Reaction conditions ··································································· 13
2.2 The fitted parameters (Ep. 1) at Maillard reaction ··························· 23-35
2.3 The completion times at Maillard reaction ···································· 38-39
2.4 The parameters of Arrhenius function (Ep. 3) ································ 42-43
2.5 The Results of regression analysis ················································· 45
3.1 Changes in the appearance of the melon ······································ 57-58
3.2 The color variation in a made TTI (Time-Temperature indicator) ············· 77
4.1 The initial properties of beef ························································ 82
4.2 Sensory assessment form ···························································· 86
4.3 The concentration of reactant for TTIs ············································ 88
4.4 The quality value after shipping ····················································· 90
4.5 The color variation in a made TTI (Time-Temperature indicator) ··········· 106
5.1 Composition of examined hamburger ··········································· 114
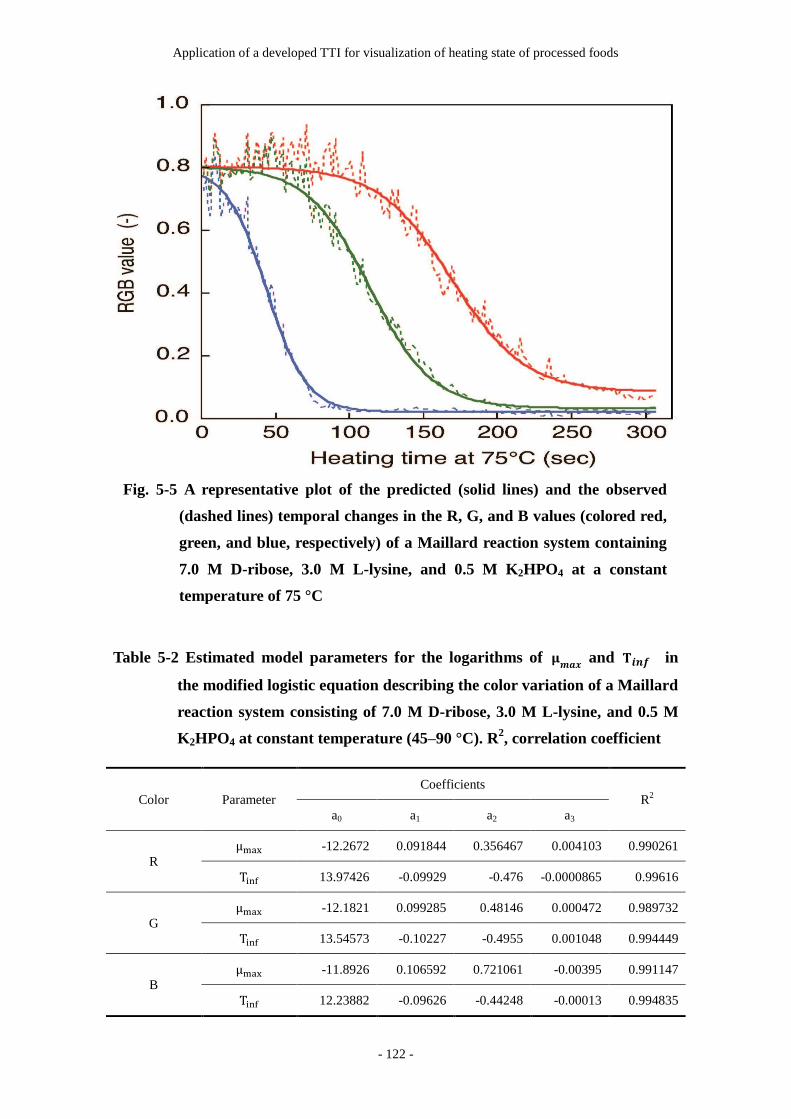
5.2 Estimated model parameters ····················································· 122
5.3 Comparison between the observed RGB values and
predicted RGB values by the developed mathematical model ··············· 125
Page 10
List of Figures
viii
List of Figures
2.1 The solutions during Maillard reaction in 96well microplate ·················· 14
2.2 The example of order for making modified value ······························· 16
2.3 Color change of Maillard reaction by D-xylose and Glycine ·················· 19
2.4 Color change of Maillard reaction by D-xylose, Glycine and Na2HPO4 ····· 19
2.5 A representation of the changes in the R, G, and B values
over time during general normal Maillard reaction at 20°C ···················· 21
2.6 A representation of the changes in the R, G, and B values
over time during fast Maillard reaction at 10°C ·································· 22
2.7 Representative B value variations as a function of reaction time
and concentrations of D-xylose, glycine, Na2HPO4, and temperature ········ 37
2.8 Arrhenius plot at 2.0 M D-xylose, 2.0 M glycine, and 0.3 M Na2HPO4 ······· 41
2.9 A developed prototype smart-phone application to analysis of TTI color ···· 46
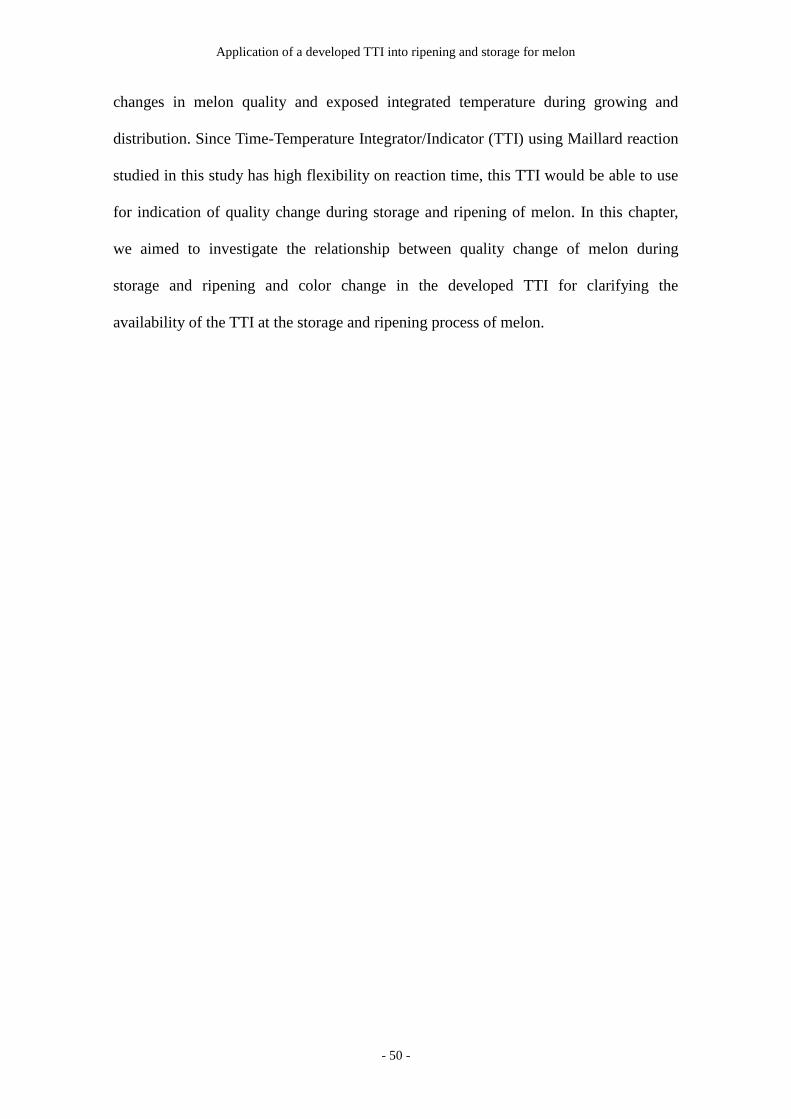
3.1 The appearance of the melons during MA storage ······························· 52
3.2 Schematic representation of preparation of the TTI ····························· 55
3.3 The weight loss by ripen period at M2016 and M2017 ··························· 60
3.4 The lightness (L) value variation by ripen period
at M2016 and M2017 ································································ 62
3.5 The redness (a*) value variation by ripen period
at M2016 and M2017 ································································ 63
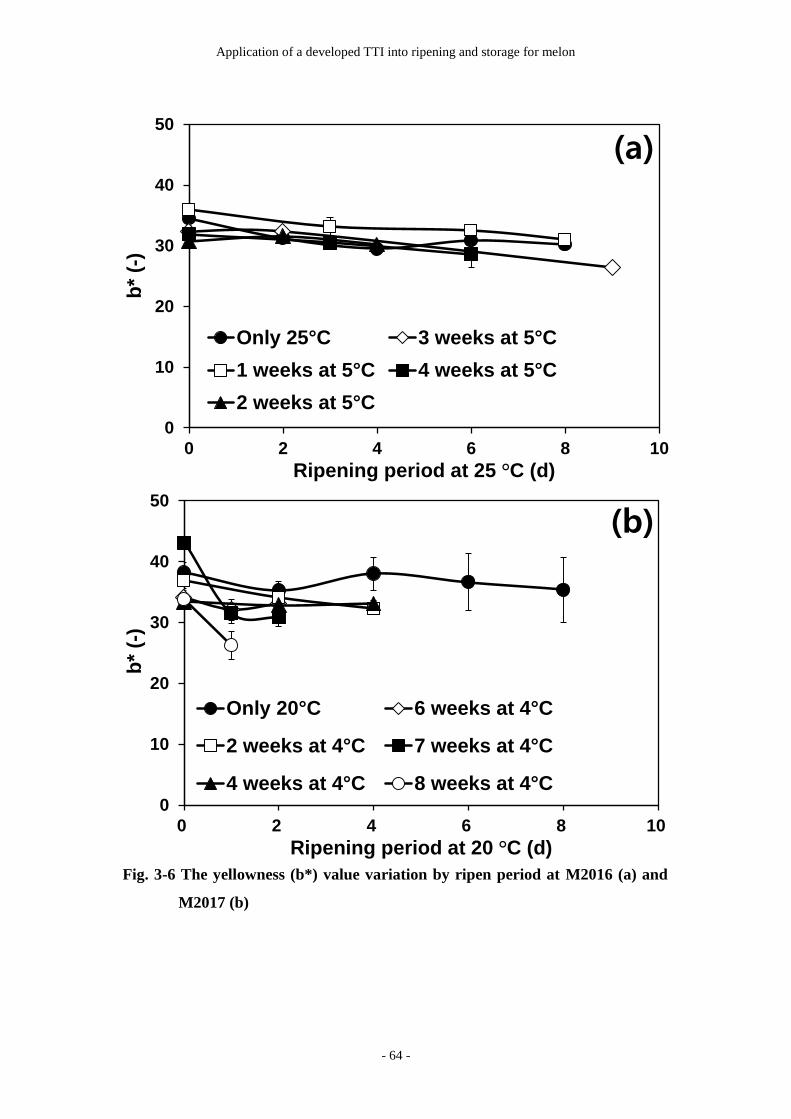
3.6 The yellowness (b*) value variation by ripen period
at M2016 and M2017 ································································ 64
3.7 The color difference (∆E) value variation by ripen period
at M2016 and M2017 ································································ 65
Page 11
List of Figures
ix
3.8 The soluble solids contents (SSC) of middle position
by ripen period at M2016 and M2017 ············································· 67
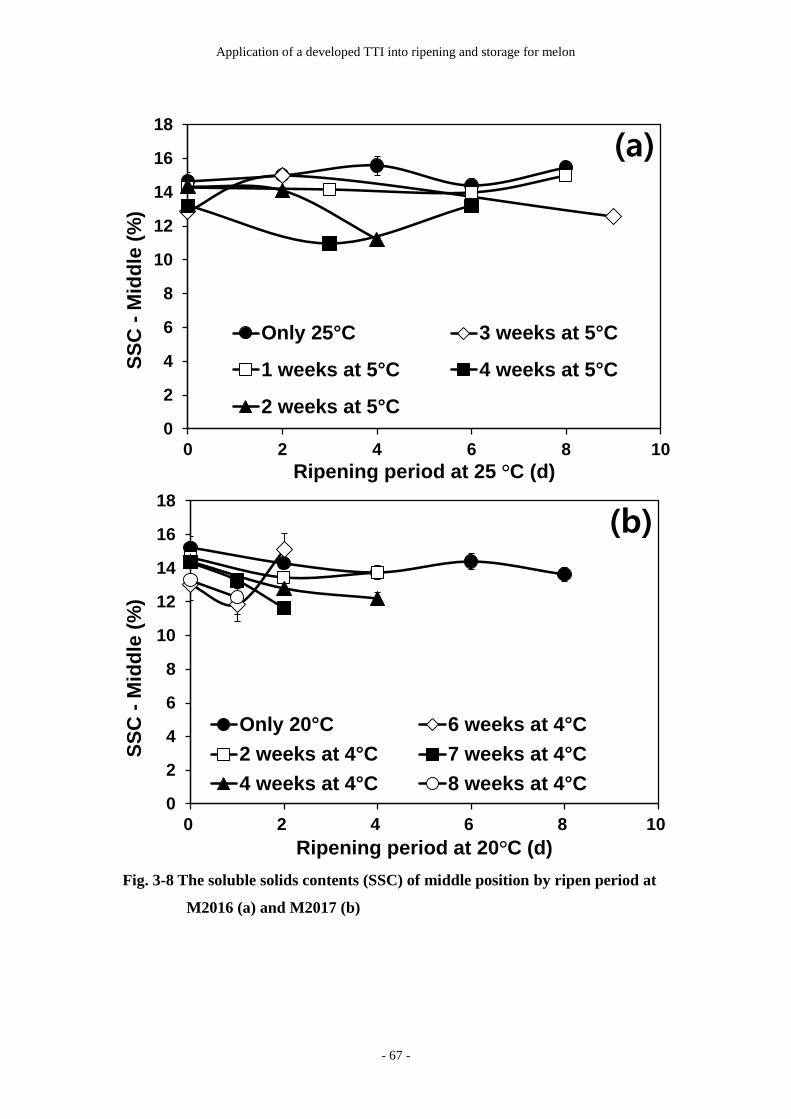
3.9 The difference of soluble solids contents (SSC)
by measurement position at M2016 and M2017 ································· 68
3.10 The relationship between SSC that represents mean values of
three different positions and integrated temperature ····························· 69
3.11 The firmness variation of middle position
by ripen period at M2016 and M2017 ············································· 71
3.12 The difference of firmness by measurement position
at M2016 and M2017 ································································ 72
3.13 The relationship between firmness that represents mean values of
three different positions and integrated temperature ····························· 73
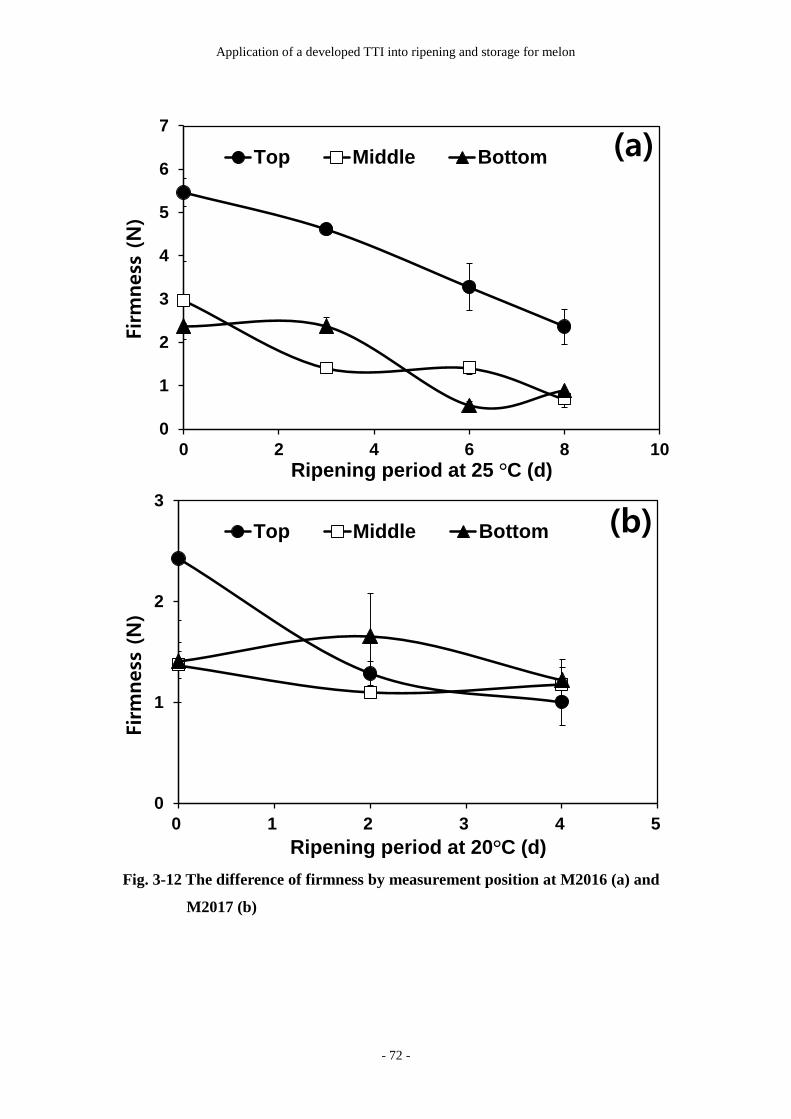
3.14 Arrhenius plot between weight loss and ripening temperature ················· 75
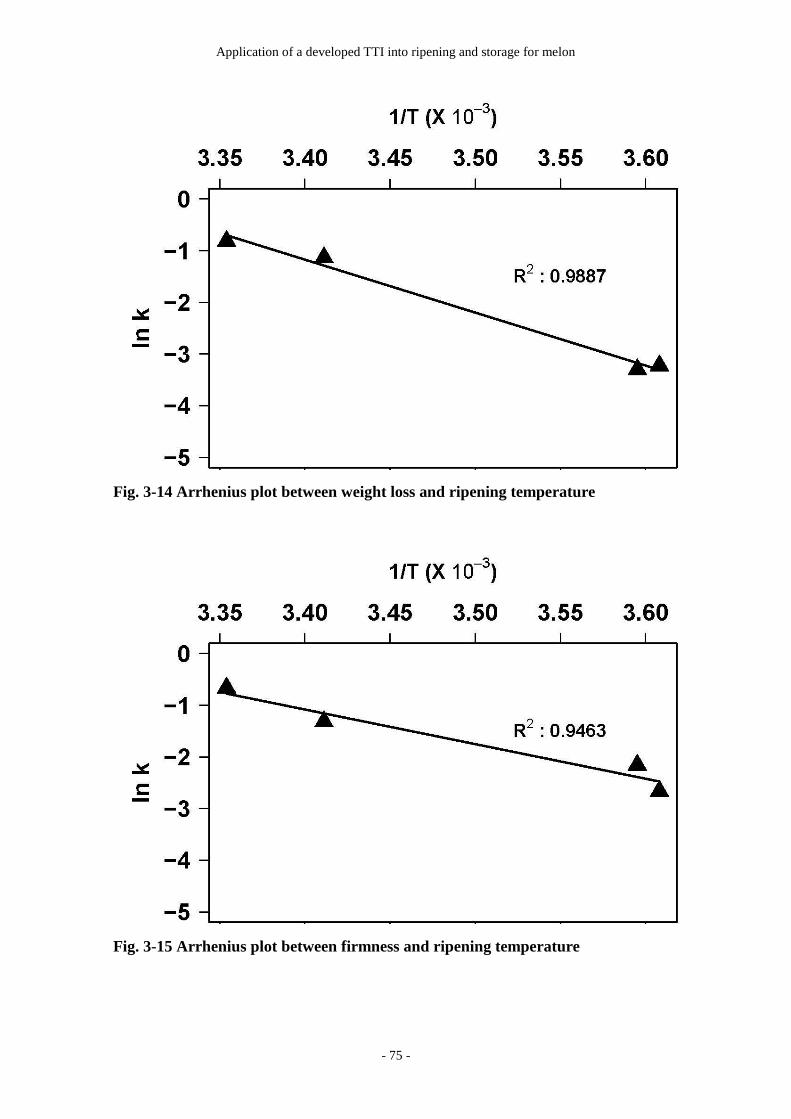
3.15 Arrhenius plot between firmness and ripening temperature ···················· 75
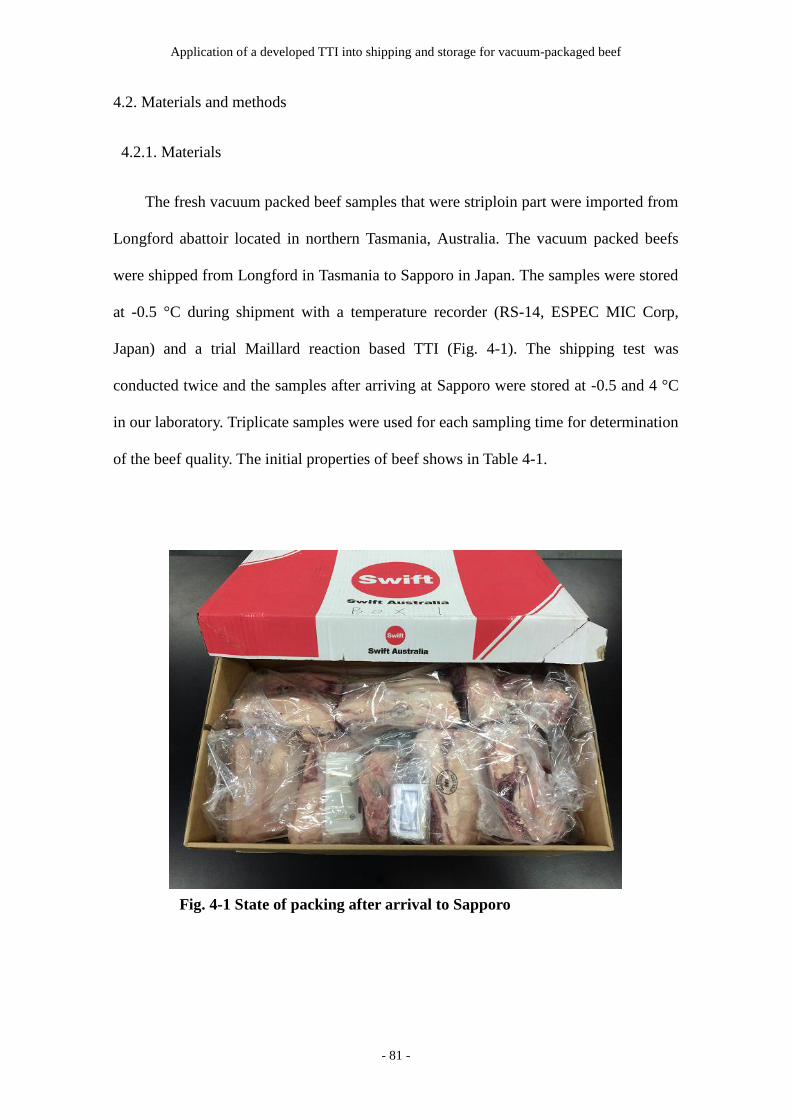
4.1 State of packing after arrival to Sapporo ·········································· 81
4.2 A sample time temperature integrator/indicator (TTI) based on
Maillard reaction proposed by Yamamoto and Isshiki (2012) ················· 87
4.3 The TTIs after shipping ······························································ 90
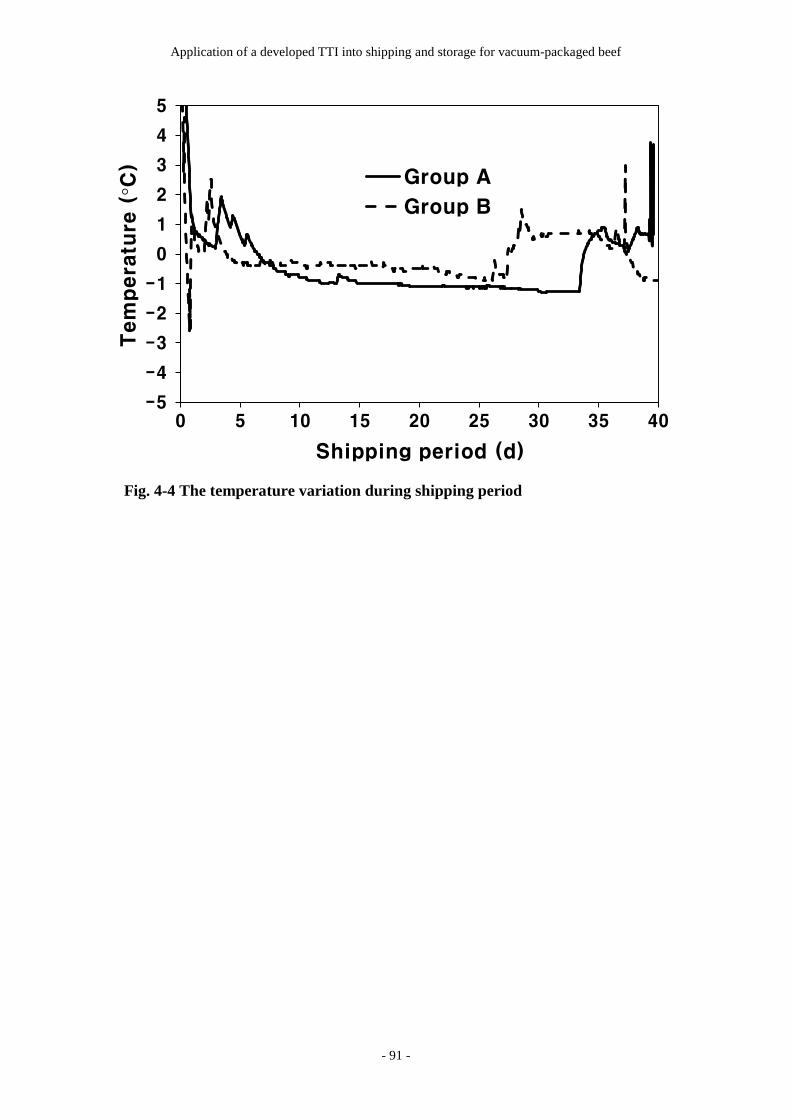
4.4 The temperature variation during shipping period ······························· 91
4.5 Drip loss variation during storage period ········································· 93
4.6 pH value variation during storage period ········································· 95
4.7 TBARS(2-thiobarbituric acid reactive substance) variation
during storage period ································································· 95
4.8 Color variations during storage period ············································ 96
4.9 The microbiological variation during storage period ···························· 98
Page 12
List of Figures
x
4.10 The shear force variation during storage period ································ 100
4.11 Cooking loss variation during storage period ··································· 102
4.12 Sensory score variation during storage period ·································· 104
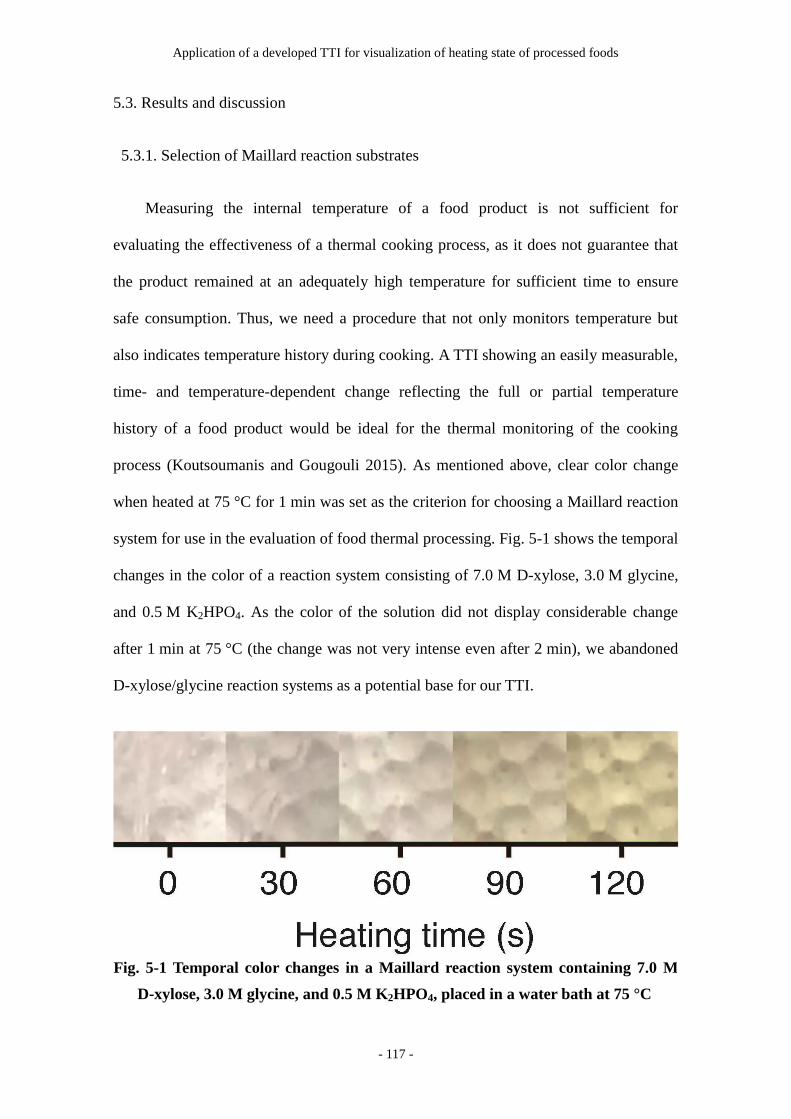
5.1 Temporal color changes in a Maillard reaction system containing
7.0 M D-xylose, 3.0 M glycine, and 0.5 M K2HPO4,
placed in a water bath at 75 °C. ··················································· 117
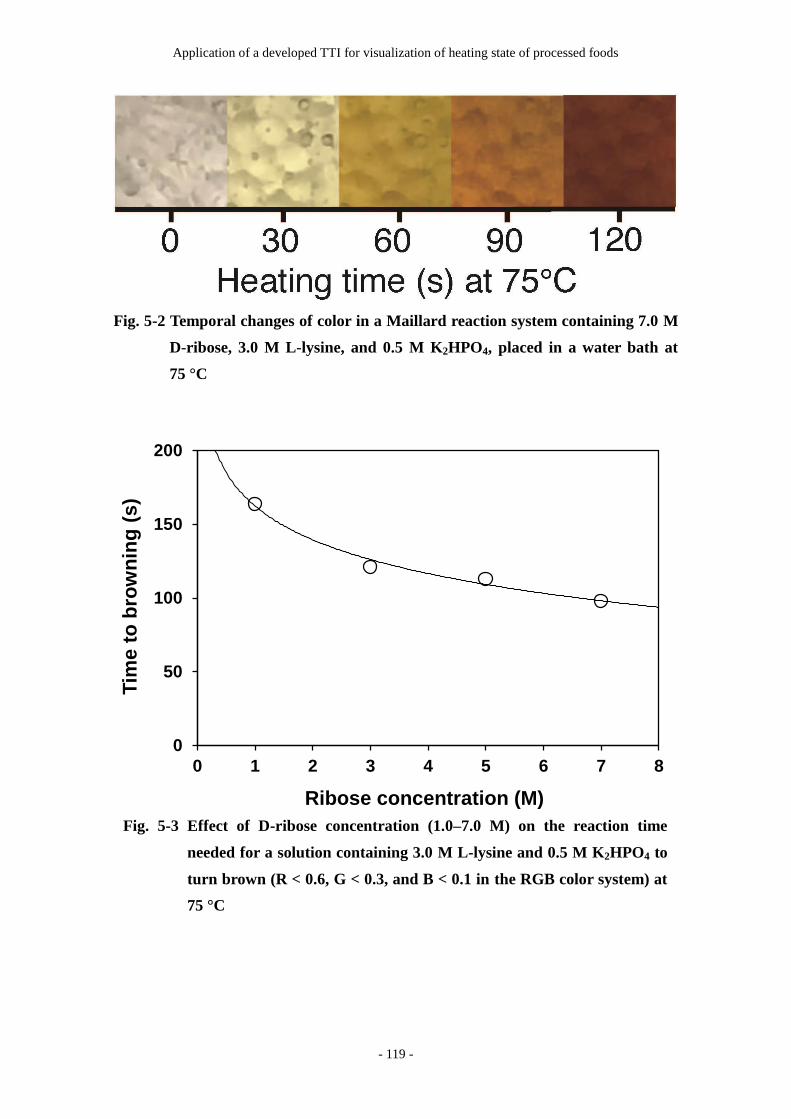
5.2 Temporal changes of color in a Maillard reaction system containing
7.0 M D-ribose, 3.0 M L-lysine, and 0.5 M K2HPO4, placed in
a water bath at 75 °C ································································· 119
5.3 Effect of ribose concentration (1.0 – 7.0 M) on the reaction time ··········· 119
5.4 Temporal changes of color in Maillard reaction systems containing
3.0 M D-ribose, 1.0–3.0 M L-lysine, 0.5 M K2HPO4, and various
concentrations of lysine (1.0–3.0 M) at 75 °C ··································· 120
5.5 A representative plot of the predicted and the observed
temporal changes in the R, G, and B values ···································· 122
5.6 A plot of the predicted and the observed reductions
in the R, G, and B values ························································· 123
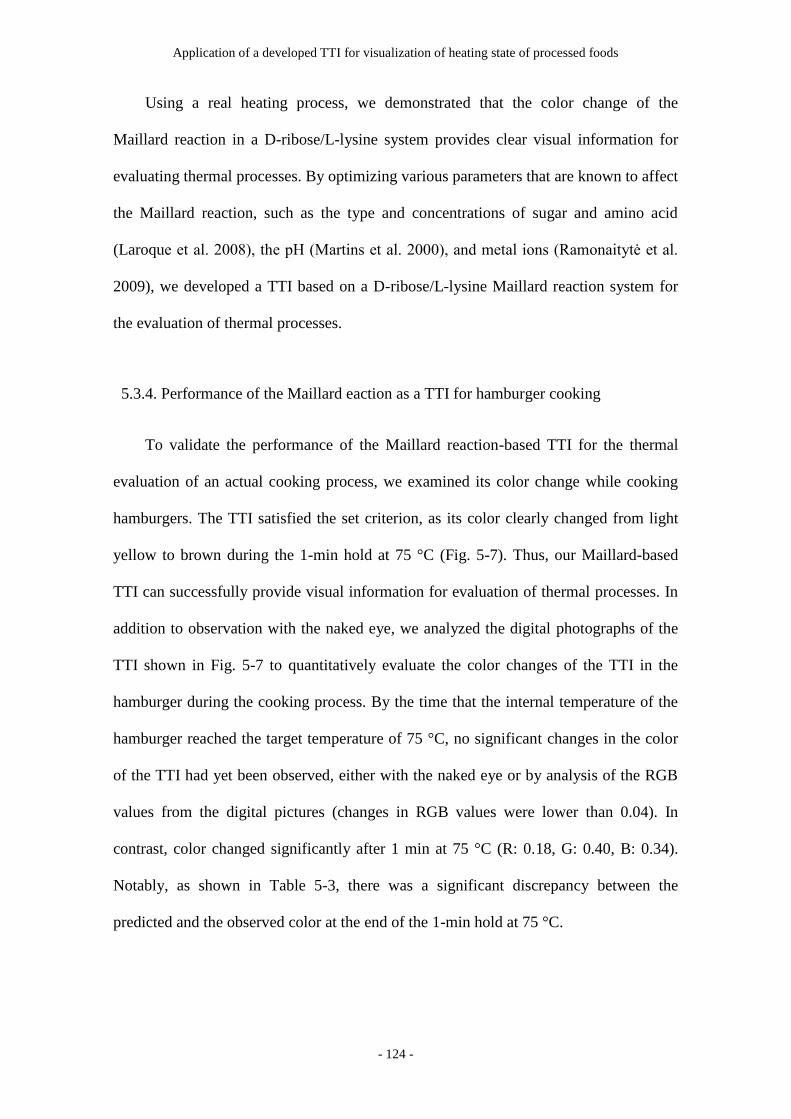
5.7 Colors of the Maillard-based TTI at the beginning and the end of
the 1-min hold at 75 °C, during a hamburger’s cooking process ············ 125
Page 13
Introduction
- 1 -
Chapter 1 Introduction
1.1. Importance of temperature management
Various agricultural processes such as harvest, distribution, storage are
indispensable to deliver agricultural products to consumers. In those agricultural
processes, temperature is one of the most important factor, which affects harvest timing,
shelf-life, changes in quality during distribution or storage, and microbiological safety,
etc.
Each crop has the minimum, maximum, and appropriate temperature. Appropriate
temperature management during growing periods of crops promotes the growth and will
be able to produce high quality agricultural products (Luo 2011). In the case of
greenhouse cultivation, the temperature exposed can be controlled. Temperature
difference, however, among the location of the crop in the greenhouse would occur by
the nonuniformity of temperature distribution in greenhouse. As a consequence, the
growth rate and optimal harvest timing differs among the growth position (Sharma et al.
1999; Bartzanas et al. 2002; Hattori et al. 2010). For this reason, although each crop is
individually needed to manage temperature for, temperature management for individual
crop is difficult in reality due to its troublesome work, cost, and etc. To realize
individual temperature management for each crop, there is a need for a special easy-to-
use tool.
Temperature management is also important factor during distribution and storage
of food. Appropriate temperature management during distribution and storage will be
able to deliver high quality crop to consumers. In general, the storage period of foods
without spoilage or quality degradation will increase under low-temperature because
low-temperature decreases the rate of biochemical and microbiological changes in foods
Page 14
Introduction
- 2 -
(Paull 1999). However, in the case of storage under freezing temperature, quality
deterioration occurs in appearance and texture by freezing, despite the shelf-life
significantly extends due to suppressed microbial growth and chemical changes
(Barbosa-Canovas et al. 2005; Aberoumand 2013). Therefore, raw agricultural
commodities are needed to store under 0-7°C for long-term storage with high quality
(Laguerre et al. 2013). Prediction of shelf-life and quality degradation is needed even at
low-temperature storage because the degradation of food under low-temperature storage
is not stopped but just delayed. Moreover, there is non-uniformity of temperature
distribution in the same storage space. Thus, confirmation and prediction of shelf-life
and the integrated temperature for individual food is difficult using only confirmation of
temperature (Mercier et al. 2017). There is a need for a special tool to provide
information on shelf-life and/or integrated temperature of the stored food.
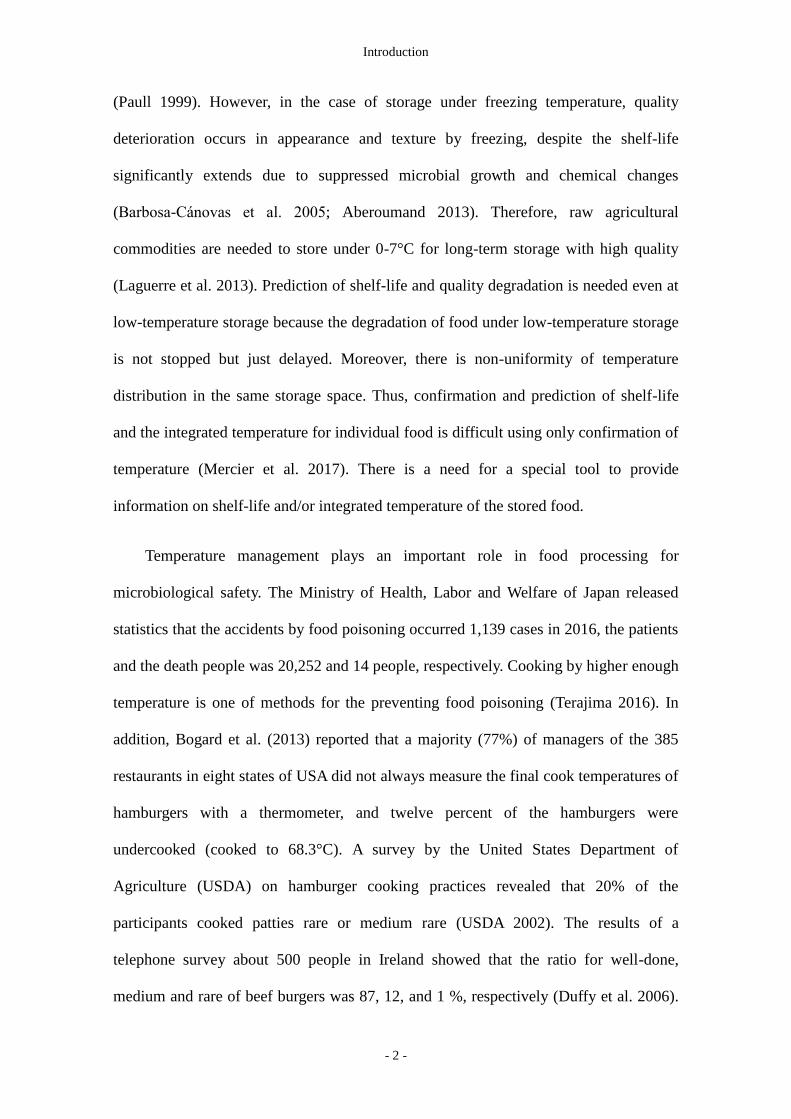
Temperature management plays an important role in food processing for
microbiological safety. The Ministry of Health, Labor and Welfare of Japan released
statistics that the accidents by food poisoning occurred 1,139 cases in 2016, the patients
and the death people was 20,252 and 14 people, respectively. Cooking by higher enough
temperature is one of methods for the preventing food poisoning (Terajima 2016). In
addition, Bogard et al. (2013) reported that a majority (77%) of managers of the 385
restaurants in eight states of USA did not always measure the final cook temperatures of
hamburgers with a thermometer, and twelve percent of the hamburgers were
undercooked (cooked to 68.3°C). A survey by the United States Department of
Agriculture (USDA) on hamburger cooking practices revealed that 20% of the
participants cooked patties rare or medium rare (USDA 2002). The results of a
telephone survey about 500 people in Ireland showed that the ratio for well-done,
medium and rare of beef burgers was 87, 12, and 1 %, respectively (Duffy et al. 2006).
Page 15
Introduction
- 3 -
These results indicates that there would be a possibility of food poisoning by pathogenic
bacteria such as Escherichia coli O157:H7. Thus, measurement and monitoring of
internal temperature during cooking is recommended for the confirmation of exposure
to high enough temperature in food. For this reason, a development of hardware has
been needed to simply and visually monitor temperature history during thermal
processing.
1.2. Time-temperature integrator/indicator
Confirmation of the temperature history during agricultural and food process is
necessary. One of the hardware to realize the demands of temperature history
monitoring and recording is time temperature integrator/indicators (TTIs) that has been
attracted attention for long time. TTIs allow to indicate the remaining shelf-life of
perishable products and the recording thermal history through the irreversible color
change by the accumulative effect of time and temperature (Wang et al. 2015).
Moreover, Taoukis and Labuza (2003) and Pavelková (2013) reported that TTIs are
cost-effective and user-friendly devices to monitor, record, and translate the overall
effect of temperature history. In those advantages, numerous TTIs have been studied.
TTIs are generally categorized as physical, chemical, and biological, based on the
principles they make use of to achieve color change.
Physical-type diffusion-based TTIs as follows: Wanihsuksombat et al. (2010)
reported that a lactic acid-based TTI prototype is based on the vapor diffusion of lactic
acid could be applied to show the time–temperature history of some foods. Kim et al.
(2016) studied that a prototype isopropyl palmitate (IPP) diffusion-based TTI system
showed potential for monitoring the microbial quality of non-pasteurized angelica (NPA)
Page 16
Introduction
- 4 -
juice based on temperature abuse. As the commercially available TTIs, 3M Monitor
Mark® (3M Co., USA) is diffusion-based indicator label and is indicated by
temperature-dependent permeation and a blue-dyed fatty acid ester diffusing along a
wick. The response range of this TTI is various such as 48 hours for -15°C, 48 hours for
5°C, 48 hours for 10°C, and 1 weeks for 31°C, etc. (Pavelková 2013; Wang et al. 2015;
3M United States 2017). Time strips® (Timestrip UK Limited, UK) use a special porous
membrane. The squeezing of a start button leads to move from the liquid to directly
contacting the membrane, and then the liquid diffuses through the membrane in a
consistent and totally repeatable way (Kuswandi et al. 2011). Time strips® also have
various type and response range, but that response range is limited as 2 hours - 7 days
despite available temperature range have a wide as -20 - 30°C (Timestrip UK Ltd. 2017).
Physical-type diffusion-based TTIs would be problematic because of the exudation of
the color material and the fact that aging porous substances would have an adverse
impact on safety and accuracy (Wang et al. 2015).
Chemical-type TTIs as follows: Ohta et al. (2008) reported that a color indicator
based on the bacterial strain sk22 isolated from commercial cod developed for
confirmation of temperature abuse in the cold chain. And the color in this indicator
changed for 32-72 hours in 12°C. Kim et al. (2012a) studied a laccase based TTI
prototype could be applied to predict losses of food quality ascribed to enzymatic
changes, hydrolysis, and lipid oxidation. Murakami et al. (2012) reported that a simple
indicator developed using red cabbage dye with sodium hydrogen carbonate, sodium
carbonate and lactose and changed for 36, 48, and 96 hours in 12, 10, 4°C, respectively.
Kuswandi et al. (2013) studied that a novel on-package color indicator based on
bromophenol blue can be used for real time visual monitoring of freshness state of
packaged guavas through the color indicator gradually changed color from blue to green
Page 17
Introduction
- 5 -
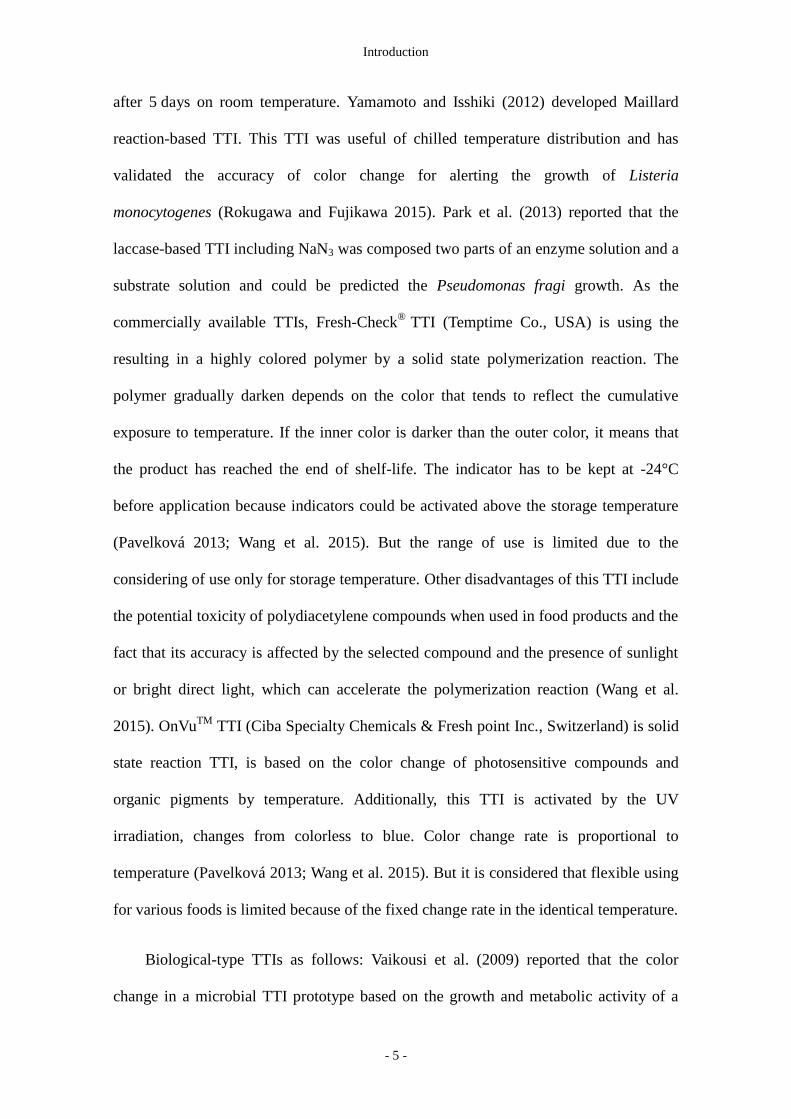
after 5 days on room temperature. Yamamoto and Isshiki (2012) developed Maillard
reaction-based TTI. This TTI was useful of chilled temperature distribution and has
validated the accuracy of color change for alerting the growth of Listeria
monocytogenes (Rokugawa and Fujikawa 2015). Park et al. (2013) reported that the
laccase-based TTI including NaN3 was composed two parts of an enzyme solution and a
substrate solution and could be predicted the Pseudomonas fragi growth. As the
commercially available TTIs, Fresh-Check®
TTI (Temptime Co., USA) is using the
resulting in a highly colored polymer by a solid state polymerization reaction. The
polymer gradually darken depends on the color that tends to reflect the cumulative
exposure to temperature. If the inner color is darker than the outer color, it means that
the product has reached the end of shelf-life. The indicator has to be kept at -24°C
before application because indicators could be activated above the storage temperature
(Pavelková 2013; Wang et al. 2015). But the range of use is limited due to the
considering of use only for storage temperature. Other disadvantages of this TTI include
the potential toxicity of polydiacetylene compounds when used in food products and the
fact that its accuracy is affected by the selected compound and the presence of sunlight
or bright direct light, which can accelerate the polymerization reaction (Wang et al.
2015). OnVuTM
TTI (Ciba Specialty Chemicals & Fresh point Inc., Switzerland) is solid
state reaction TTI, is based on the color change of photosensitive compounds and
organic pigments by temperature. Additionally, this TTI is activated by the UV
irradiation, changes from colorless to blue. Color change rate is proportional to
temperature (Pavelková 2013; Wang et al. 2015). But it is considered that flexible using
for various foods is limited because of the fixed change rate in the identical temperature.
Biological-type TTIs as follows: Vaikousi et al. (2009) reported that the color
change in a microbial TTI prototype based on the growth and metabolic activity of a
Page 18
Introduction
- 6 -
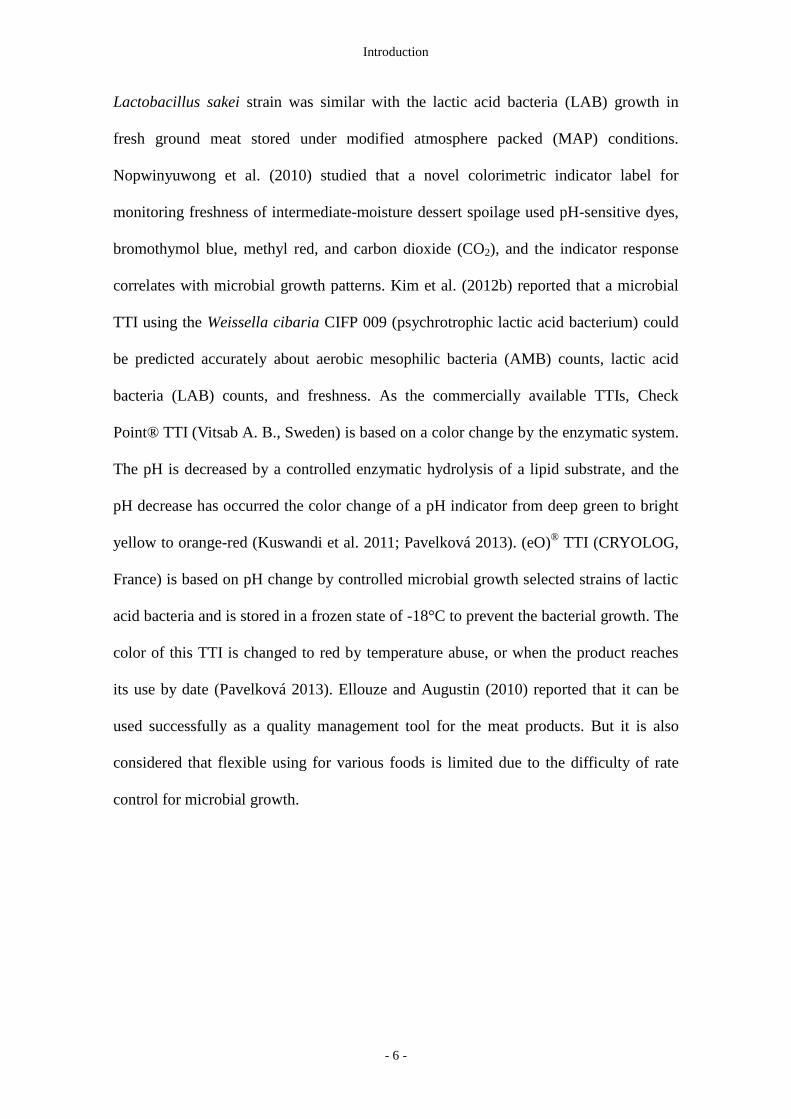
Lactobacillus sakei strain was similar with the lactic acid bacteria (LAB) growth in
fresh ground meat stored under modified atmosphere packed (MAP) conditions.
Nopwinyuwong et al. (2010) studied that a novel colorimetric indicator label for
monitoring freshness of intermediate-moisture dessert spoilage used pH-sensitive dyes,
bromothymol blue, methyl red, and carbon dioxide (CO2), and the indicator response
correlates with microbial growth patterns. Kim et al. (2012b) reported that a microbial
TTI using the Weissella cibaria CIFP 009 (psychrotrophic lactic acid bacterium) could
be predicted accurately about aerobic mesophilic bacteria (AMB) counts, lactic acid
bacteria (LAB) counts, and freshness. As the commercially available TTIs, Check
Point® TTI (Vitsab A. B., Sweden) is based on a color change by the enzymatic system.
The pH is decreased by a controlled enzymatic hydrolysis of a lipid substrate, and the
pH decrease has occurred the color change of a pH indicator from deep green to bright
yellow to orange-red (Kuswandi et al. 2011; Pavelková 2013). (eO)® TTI (CRYOLOG,
France) is based on pH change by controlled microbial growth selected strains of lactic
acid bacteria and is stored in a frozen state of -18°C to prevent the bacterial growth. The
color of this TTI is changed to red by temperature abuse, or when the product reaches
its use by date (Pavelková 2013). Ellouze and Augustin (2010) reported that it can be
used successfully as a quality management tool for the meat products. But it is also
considered that flexible using for various foods is limited due to the difficulty of rate
control for microbial growth.
Page 19
Introduction
- 7 -
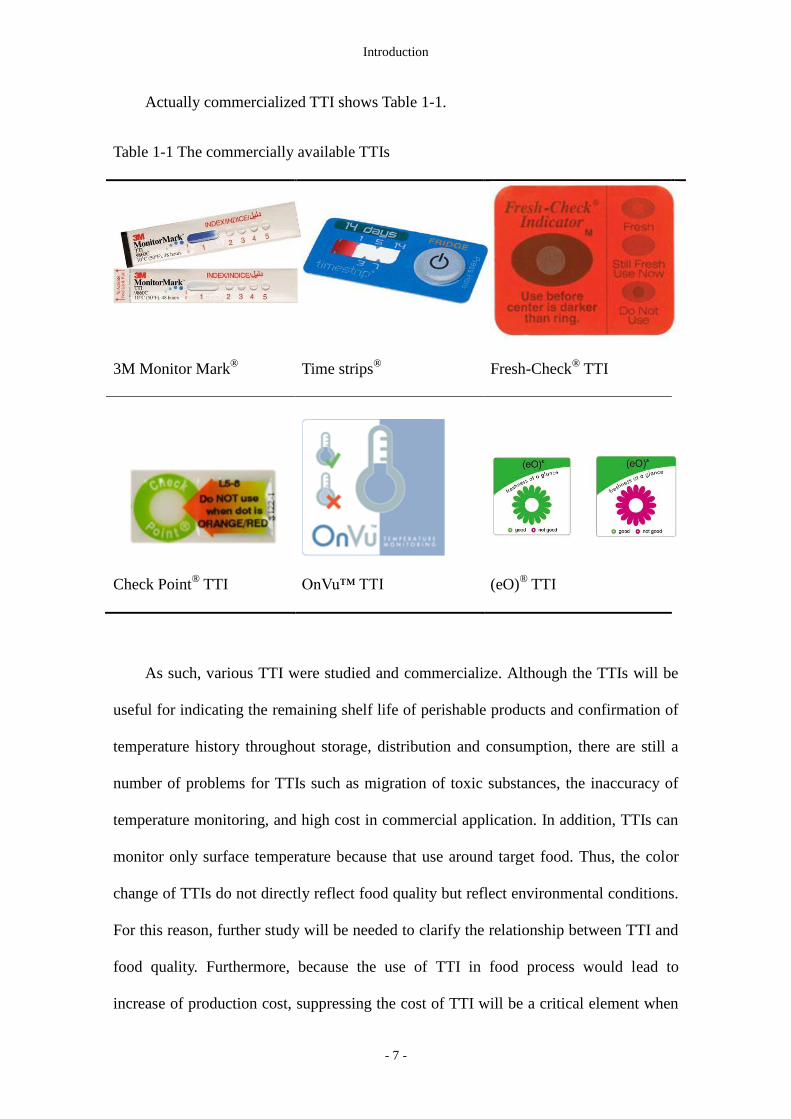
Actually commercialized TTI shows Table 1-1.
Table 1-1 The commercially available TTIs
3M Monitor Mark®
Time strips®
Fresh-Check® TTI
Check Point
® TTI
OnVu™ TTI
(eO)® TTI
As such, various TTI were studied and commercialize. Although the TTIs will be
useful for indicating the remaining shelf life of perishable products and confirmation of
temperature history throughout storage, distribution and consumption, there are still a
number of problems for TTIs such as migration of toxic substances, the inaccuracy of
temperature monitoring, and high cost in commercial application. In addition, TTIs can
monitor only surface temperature because that use around target food. Thus, the color
change of TTIs do not directly reflect food quality but reflect environmental conditions.
For this reason, further study will be needed to clarify the relationship between TTI and
food quality. Furthermore, because the use of TTI in food process would lead to
increase of production cost, suppressing the cost of TTI will be a critical element when
Page 20
Introduction
- 8 -
people choose whether to use them or not (Wang et al. 2015).
Existing TTIs have limitation on flexibility at range of reaction temperature and/or
reaction period. Since storage characteristics of each kind of food are very different
even at the same storage temperature, ideal TTIs should have flexibility corresponding
to each food characteristics by adjusting reaction rate. In fact, however, most of the
existing TTIs cannot flexibly control the variation rate in same temperature and/or
broaden available temperature range. If some special material used for the flexible TTIs,
that would result in a rising cost and fall-off the usability. Consequently, the Maillard
reaction was contemplated as the material with safety and flexibility.
1.3. Maillard reaction
Maillard reaction has long been known as one of food-related chemical reaction
with color change (Ames 1998). Maillard reaction is a type of non-enzymatic browning
and is form the brown nitrogenous polymers and co-polymers, known as Melanoidins
by the reaction between a reducing sugar and a compound possessing a free amino
group (Van 2006). This reaction was first described by Maillard (1912), but the first
coherent scheme was put forward by Hodge (1953). And the Maillard reaction is related
to aroma, taste, and color, in processes such as roasting of coffee and cocoa beans,
baking of bread and cakes, toasting of cereals and the cooking of meat (Ames 1990;
Martins et al. 2000).
Melanoidins as the produced by Maillard reaction during the processing and
storage of foods become known to can preservation of the quality and safety of foods.
Melanoidins can inhibit oxidation of unsaturated lipids and functional food ingredients,
Page 21
Introduction
- 9 -
the growth of microorganisms, and prevent the spoilage and deterioration of foods,
because of the antioxidant properties and antimicrobial activity (Wang et al. 2011).
Echavarría et al. (2012) reported that the melanoidins may have beneficial in
antioxidant activity, human health, displaying in vivo antioxidant, antimicrobial and
prebiotic activity in the intestine. Tamanna and Mahmood (2015) reported that Maillard
reaction products have both positive and negative impacts such as antioxidants,
bactericidal, antiallergenic, antibrowning, prooxidants, and carcinogens. A negative
impact of Maillard reaction is mainly the existence of a carcinogen named acrylamide.
However, acrylamide do not affect for TTI because that is formed by heating over
100°C (Eden et al. 2002; Mottram, Wedzicha, and Dodson 2002; Stadler et al. 2002) .
Various studies have ported that the rate of Maillard reaction can be controlled by
temperature, pH, kind of reactants and those concentrations. About this, Maillard (1912)
reported that the reaction rate among the 150, 100, and 37 °C was faster with higher
temperature. Ellis (1959) reported that the reaction rate increased at higher temperature
and higher pH, and differed by the use of phosphates, a kind of sugar and amino acid. In
particular, the order of reactivity for sugar was as follows; D-ribose > L-arabinose > D-
xylose > D-galactose > lactose > D-glucose > maltose. Martins et al. (2000) reported
that the reactivity of the sugar and amino group was also highly influenced by the
temperature and pH, and was increased at the higher temperature and the higher pH.
Sandwick et al. (2005) reported that the change in absorbance rate of reaction with
glycine was 50 times faster with 0.05 M Ribose than those with glucose or ribose.
Laroque et al. (2008) reported that the order of reactivity according to results of
measurement of browning intensity, monitoring of the disappearance, and
chromatographic data was as follows; fructose ≈ glucose < arabinose < xylose < ribose.
Page 22
Introduction
- 10 -
1.4. Research objectives
Various reaction rates can be obtained in Maillard reaction by the control of factors
such as reaction temperature, pH, reactant, and concentration of reactant. Thus, the
flexible property of Maillard reaction will be suitable for development of flexible TTIs.
Moreover, this flexibility would be benefit low temperature food distribution
management and other temperature management-related issues such as long-term
storage and judgment of fruit ripening and harvesting times.
Herein, we aimed to maximize the applicability of the Maillard reaction for
development of novel TTIs. To maximize the applicability of Maillard reaction, the
color changes by the Maillard reaction were investigated under various concentration
and temperature conditions, and a predictive model was developed for estimating the
time required for these changes to be appeared as a function of temperature and reactant
concentration. Furthermore, to verify the applicability of the developed Maillard
reaction based TTI, the TTIs were examined on various agricultural and food processes
such as distribution, storage, ripening, and cooking.
Page 23
Color variation characteristic of Maillard reaction
- 11 -
Chapter 2 Color variation characteristic of Maillard reaction
2.1. Introduction
The Maillard reaction has long been known as a food-processing-related chemical
transformation accompanied by a color change (Ames, 1998). Despite mostly resulting
in browning, this reaction can produce blue, green, and yellow colors at certain reaction
temperatures, which was used by Yamamoto and Isshiki (2012) in their model Maillard
reaction-based TTI. But this TTI was dedicated for low temperature management, the
reaction rate was adjusted by a particular combination of reducing sugar and amino acid.
However, numerous color variations would be realized by Maillard reaction, because
the reaction rate can be controlled by adjusting combination of kind of reactants and
those concentrations under various temperatures (Bell 1997; Benzing-Purdie,
Ripmeester, and Ratcliffe 1985). These flexibilities of the color variation would enable
to realize not only for managing low temperature food distribution but also for much
more various fields relating to temperature management such as long-term storage,
judgement of harvesting timing of fruits, and judgement of ripening some fruits, etc.
On the other hand, the design of TTIs for different food types requires the color
change to be quantitatively evaluated by some measuring system. Furthermore, TTI
color changes need to be correlated to food quality and/or safety changes to provide
additional information on food distribution under the selected temperature conditions.
Thus, quantitative evaluation of color change is indispensable for the development of
flexible TTIs.
Therefore, we aimed to investigate color changes induced by the Maillard reaction
under various conditions and establish a predictive model for estimating the time
required for these changes to appear as a function of temperature and reactant
Page 24
Color variation characteristic of Maillard reaction
- 12 -
concentration, using the analyzed data to develop novel TTIs.
Page 25
Color variation characteristic of Maillard reaction
- 13 -
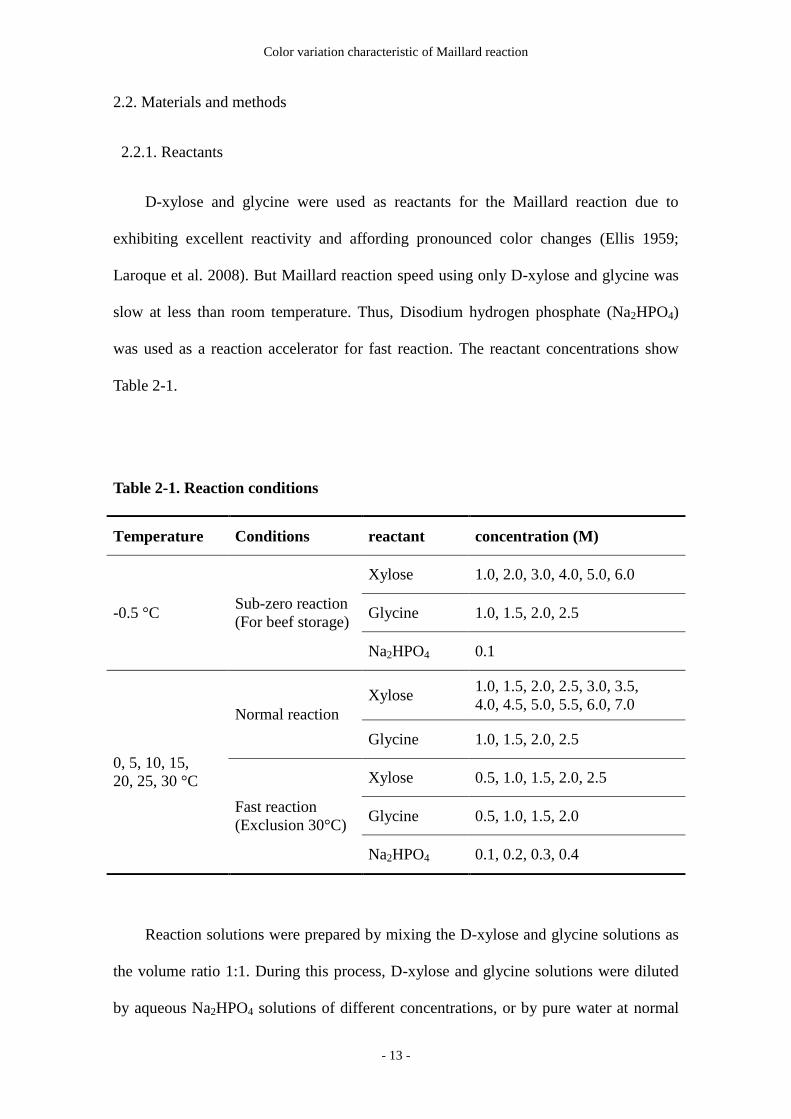
2.2. Materials and methods
2.2.1. Reactants
D-xylose and glycine were used as reactants for the Maillard reaction due to
exhibiting excellent reactivity and affording pronounced color changes (Ellis 1959;
Laroque et al. 2008). But Maillard reaction speed using only D-xylose and glycine was
slow at less than room temperature. Thus, Disodium hydrogen phosphate (Na2HPO4)
was used as a reaction accelerator for fast reaction. The reactant concentrations show
Table 2-1.
Reaction solutions were prepared by mixing the D-xylose and glycine solutions as
the volume ratio 1:1. During this process, D-xylose and glycine solutions were diluted
by aqueous Na2HPO4 solutions of different concentrations, or by pure water at normal
Table 2-1. Reaction conditions
Temperature Conditions reactant concentration (M)
-0.5 °C Sub-zero reaction
(For beef storage)
Xylose 1.0, 2.0, 3.0, 4.0, 5.0, 6.0
Glycine 1.0, 1.5, 2.0, 2.5
Na2HPO4 0.1
0, 5, 10, 15,
20, 25, 30 °C
Normal reaction
Xylose 1.0, 1.5, 2.0, 2.5, 3.0, 3.5,
4.0, 4.5, 5.0, 5.5, 6.0, 7.0
Glycine 1.0, 1.5, 2.0, 2.5
Fast reaction
(Exclusion 30°C)
Xylose 0.5, 1.0, 1.5, 2.0, 2.5
Glycine 0.5, 1.0, 1.5, 2.0
Na2HPO4 0.1, 0.2, 0.3, 0.4
Page 26
Color variation characteristic of Maillard reaction
- 14 -
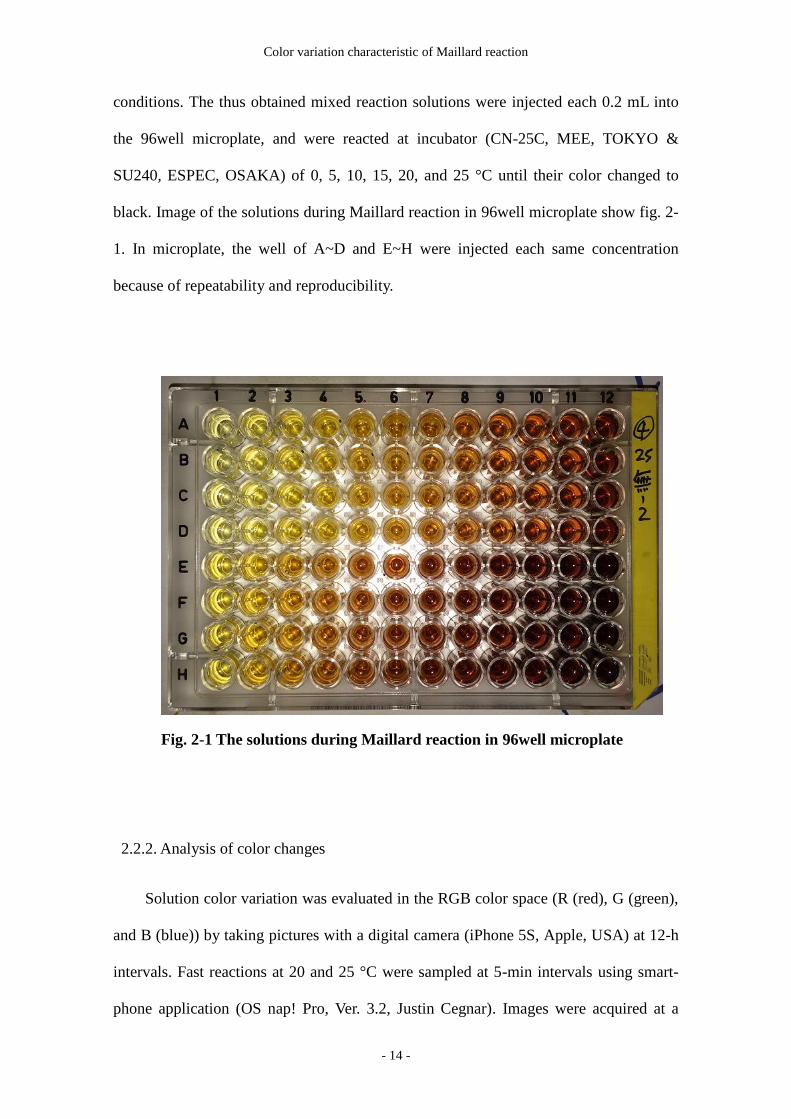
conditions. The thus obtained mixed reaction solutions were injected each 0.2 mL into
the 96well microplate, and were reacted at incubator (CN-25C, MEE, TOKYO &
SU240, ESPEC, OSAKA) of 0, 5, 10, 15, 20, and 25 °C until their color changed to
black. Image of the solutions during Maillard reaction in 96well microplate show fig. 2-
1. In microplate, the well of A~D and E~H were injected each same concentration
because of repeatability and reproducibility.
2.2.2. Analysis of color changes
Solution color variation was evaluated in the RGB color space (R (red), G (green),
and B (blue)) by taking pictures with a digital camera (iPhone 5S, Apple, USA) at 12-h
intervals. Fast reactions at 20 and 25 °C were sampled at 5-min intervals using smart-
phone application (OS nap! Pro, Ver. 3.2, Justin Cegnar). Images were acquired at a
Fig. 2-1 The solutions during Maillard reaction in 96well microplate
Page 27
Color variation characteristic of Maillard reaction
- 15 -
resolution of 1920×1080 pixels, an f/2.2 aperture, and a 4.15-mm focal length, with a
box blocking ambient light used to minimize lighting-related errors. A box for blocking
ambient light was the size of 320×250×170 mm and supplied white paper on a floor for
blocking influence by box color. And a source of light used only a flash in camera. For
better performance, optimized exposure conditions were employed, i.e., the camera was
used at an automatically set white balance and sensitivity (ISO 32). The captured
images were analyzed using the R (Ver. 3.3.0) statistical environment running in the R
studio (Ver. 0.99.491).
To compare reaction completion times under different conditions, a threshold value
was required as a completion index. Herein, 0.10 in red color value was used as
threshold values for the decision of completion time at normal reaction. And the
threshold values for fast reaction were used 0.20, 0.15, and 0.15 at red, green and blue,
respectively. Colors exhibiting appearing at lower RGB values than those threshold
values appeared dark brown or black. Additionally, these values could also be used for
timing purposes in the fabricated TTIs.
Color variation expressed by RGB value changes was described by a sigmoid
function (Eq. 2-1):
where 𝐶v color value, 𝑟max , time and 𝑇inf denote RGB parameter changes,
inflection point slope, reaction time, and inflection point time, respectively. Parameters
for each condition were estimated using the non-linear least square method (R, nls
package).
R, G, or B value variation (𝐶v) =∆𝐶v(R, G, or B)
1 + exp(−𝑟max(time − 𝑇inf)) 𝐸q. 2-1
Page 28
Color variation characteristic of Maillard reaction
- 16 -
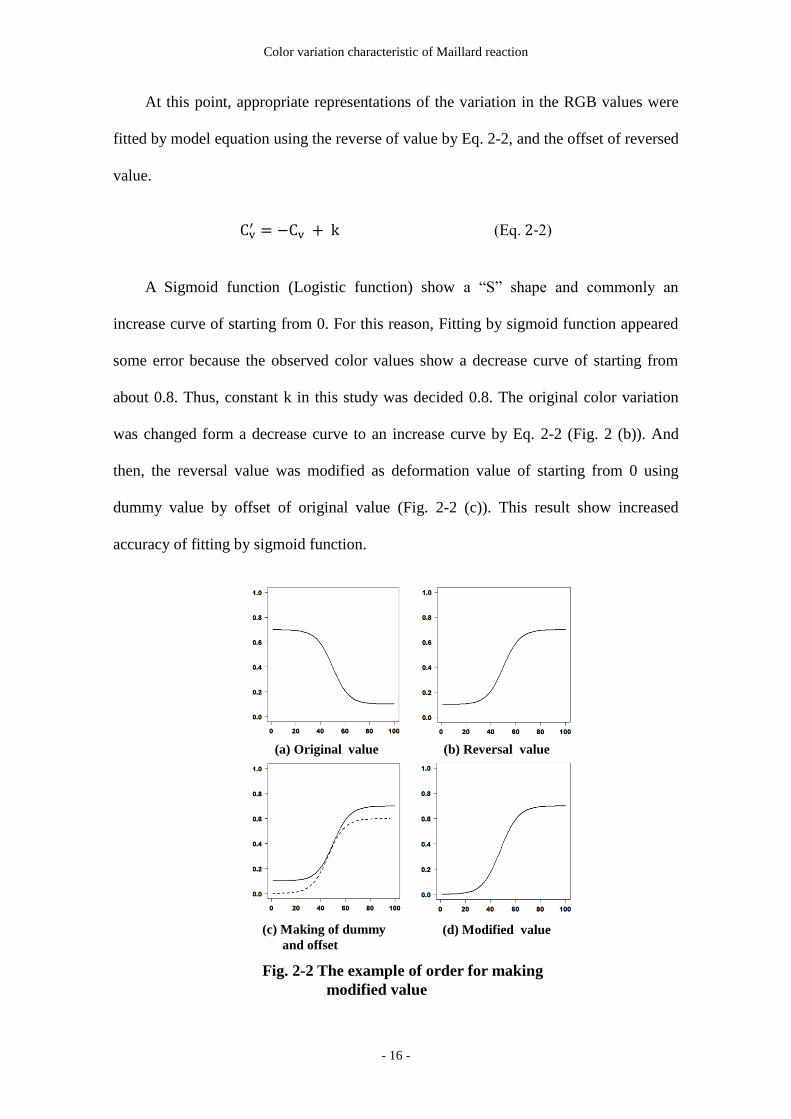
At this point, appropriate representations of the variation in the RGB values were
fitted by model equation using the reverse of value by Eq. 2-2, and the offset of reversed
value.
A Sigmoid function (Logistic function) show a “S” shape and commonly an
increase curve of starting from 0. For this reason, Fitting by sigmoid function appeared
some error because the observed color values show a decrease curve of starting from
about 0.8. Thus, constant k in this study was decided 0.8. The original color variation
was changed form a decrease curve to an increase curve by Eq. 2-2 (Fig. 2 (b)). And
then, the reversal value was modified as deformation value of starting from 0 using
dummy value by offset of original value (Fig. 2-2 (c)). This result show increased
accuracy of fitting by sigmoid function.
Cv′ = −Cv + k (Eq. 2-2)
(a) Original value (b) Reversal value
(c) Making of dummy
and offset
(d) Modified value
Fig. 2-2 The example of order for making
modified value
Page 29
Color variation characteristic of Maillard reaction
- 17 -
The temperature dependence of all reaction conditions was expressed by Arrhenius
function (Eq. 2-3):
where k is 𝜇max (inflection point slope) of sigmoid function, Ea the activation
energy, A is the pre-exponential factor, and R and T are ideal gas constant and absolute
temperature (K), respectively. And slope (Ea /R) and pre-exponential factor were
estimated using linear regression (Kim, Kim, and Lee 2012).
2.2.3. Predictive modeling of color change kinetics
Each parameter obtained by fitting the experimental data with Eq. 1 was described
as a function of reactant concentration and reaction temperature with the help of
multiple regression analysis (Eq. 2-4, Eq. 2-5). Eq. 2-4 was used at multiple regression
analysis for normal reaction conditions. And Eq. 2-4 was used for fast reaction
conditions. :
Where ai and bi are coefficients, T is the reaction temperature (absolute
temperature) and Xy, Gl, and DH are concentration of D-xylose, glycine, and Na2HPO4,
respectively. And all parameter (rmax, Tinf, or color value), reaction temperature (T)
and reactant concentration (Xy, Gl, DH) was transformed to a natural logarithmic value
ln k =Ea
RT+ lnA Eq. 2-3
Parameter (μmax , Tinf, or color value)
= a0 + a1 × T + a2 × Xy + a3 × Gl + a4 × T2 + a6 × Xy2 Ep. 2-4
Parameter (μmax , Tinf, or color value)
= b0 + b1 × T + b2 × Xy + b3 × Gl + b4 × DH + b5 × T2 + b6 × Xy2 Ep. 2-5
Page 30
Color variation characteristic of Maillard reaction
- 18 -
with the highest value in coefficient of determination of the regression analysis results.
Additionally, data with temperature of 0, 5, 15 and 25 °C were used for predictive
modeling. And predictive modeling was validated by data with temperature of 10 and
20 °C.
Page 31
Color variation characteristic of Maillard reaction
- 19 -
2.3. Results and discussion
2.3.1. Characterization of color change under different conditions
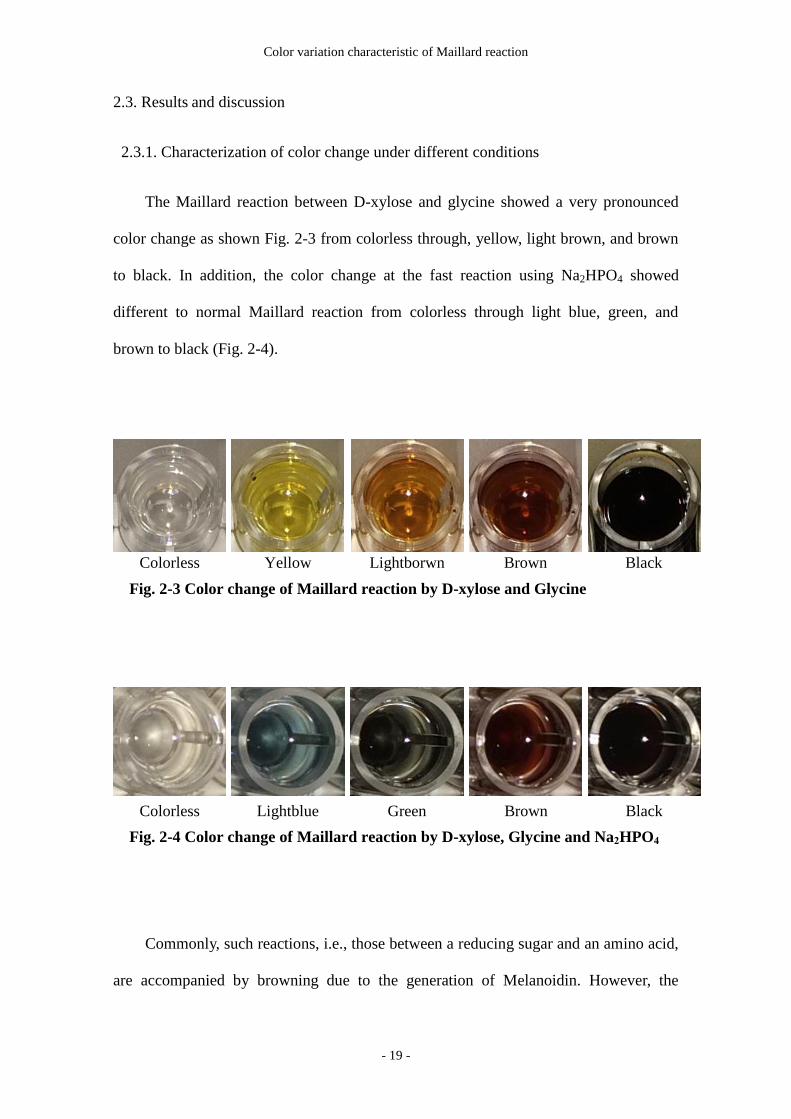
The Maillard reaction between D-xylose and glycine showed a very pronounced
color change as shown Fig. 2-3 from colorless through, yellow, light brown, and brown
to black. In addition, the color change at the fast reaction using Na2HPO4 showed
different to normal Maillard reaction from colorless through light blue, green, and
brown to black (Fig. 2-4).
Commonly, such reactions, i.e., those between a reducing sugar and an amino acid,
are accompanied by browning due to the generation of Melanoidin. However, the
Colorless
Fig. 2-3 Color change of Maillard reaction by D-xylose and Glycine
Yellow Lightborwn Brown Black
Colorless Lightblue Green Brown Black
Fig. 2-4 Color change of Maillard reaction by D-xylose, Glycine and Na2HPO4
Page 32
Color variation characteristic of Maillard reaction
- 20 -
Maillard reaction between glycine and D-xylose in slightly alkaline medium containing
sodium bicarbonate as an accelerator initially generates three blue-colored pigments,
denoted Blue-M1, Blue-M2, and Blue-M3 (Miura and Gomyo 1982).
Thus, the Maillard reaction between D-xylose and glycine solutions produced a
wide range of colors thus being suitable for TTI development. The expression of various
colors during the reaction enables users of TTI to recognize the temperature history by
naked eyes. To be practically applicable, TTIs should exhibit color changes easily
recognizable by the naked eye.
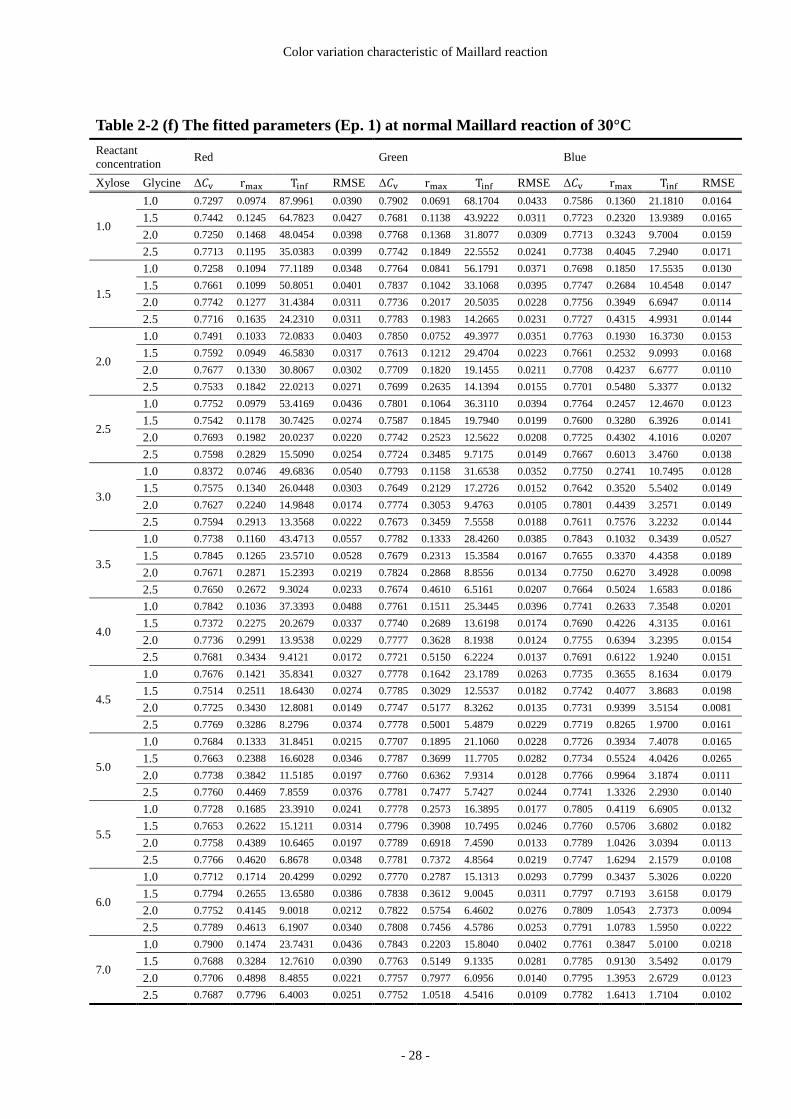
2.3.2. The quantitative evaluation of color change in Maillard reaction
Quantitative evaluation of color changes revealed that RGB values sigmoidally
decreased under all conditions. The variation of color values was changed depending on
using Na2HPO4. Figure 2-5 demonstrates representative observed/fitted color variations
at 15 °C for Xy = 4.5 M and Gl = 2.0 M. The variation rate of the three color values
(Red, Green, and Blue value) has clearly difference. The decrease of red color value was
slowest than green value and blue value due to the expression of brown color by the
generation of Melanoidin.
Page 33
Color variation characteristic of Maillard reaction
- 21 -
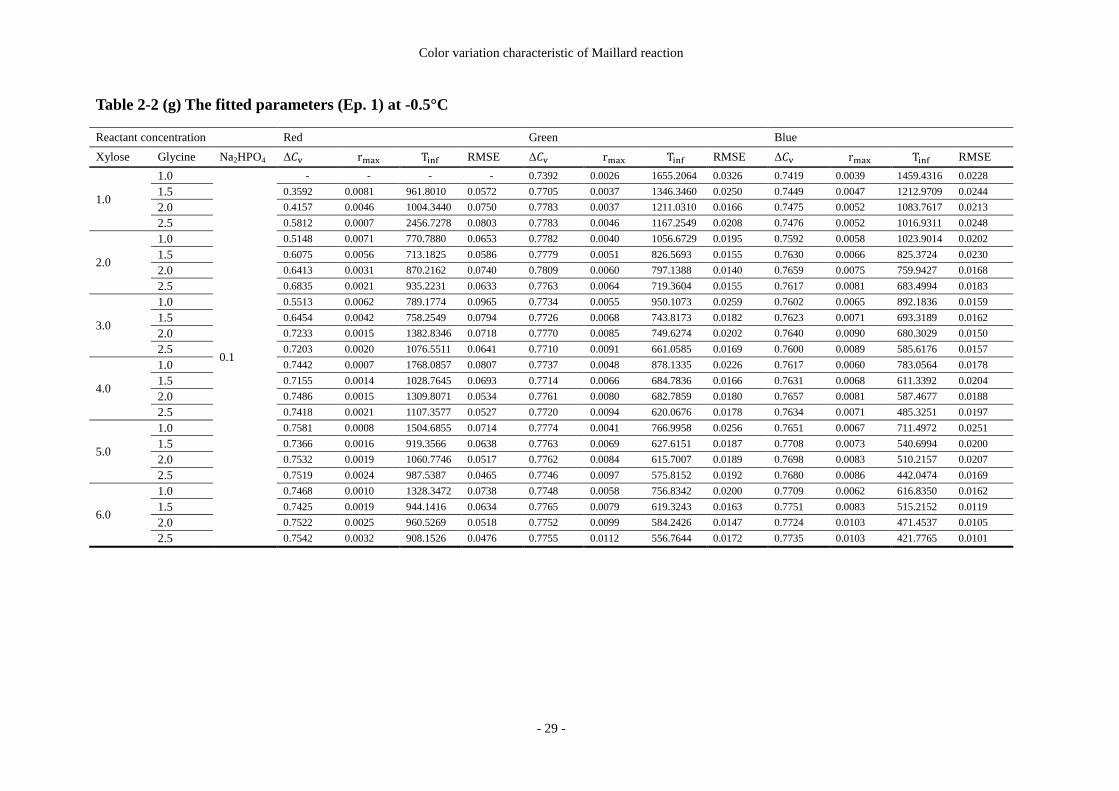
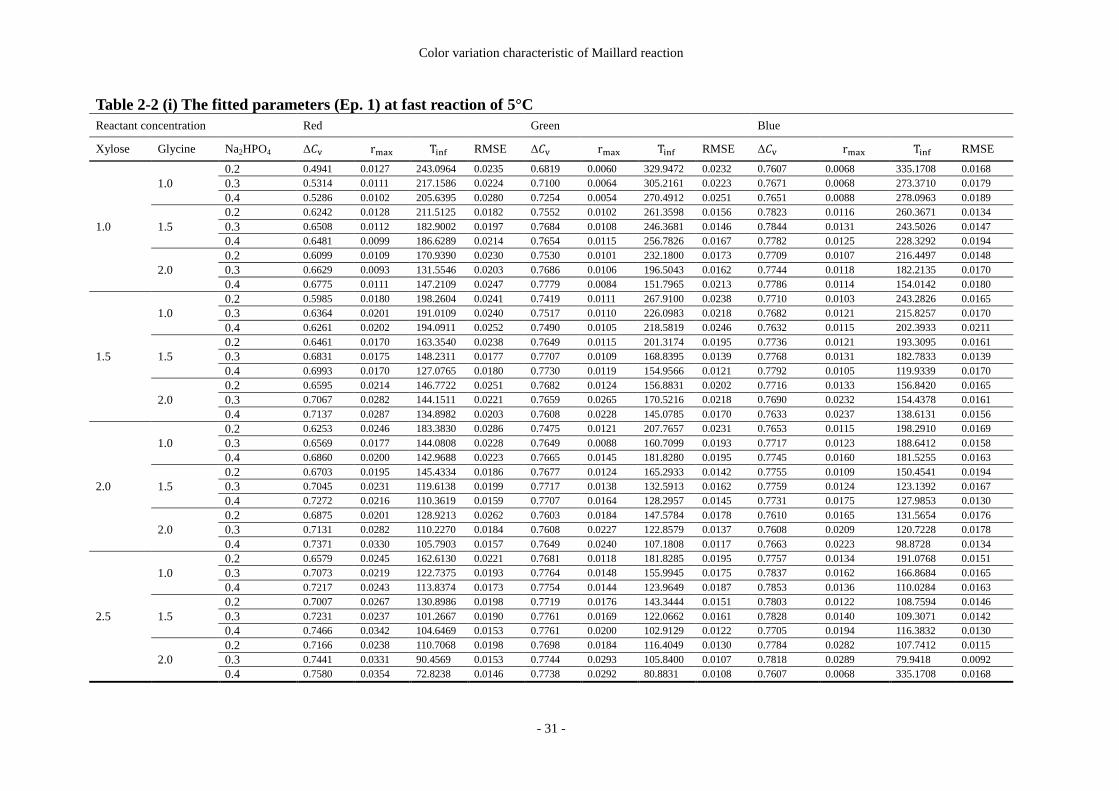
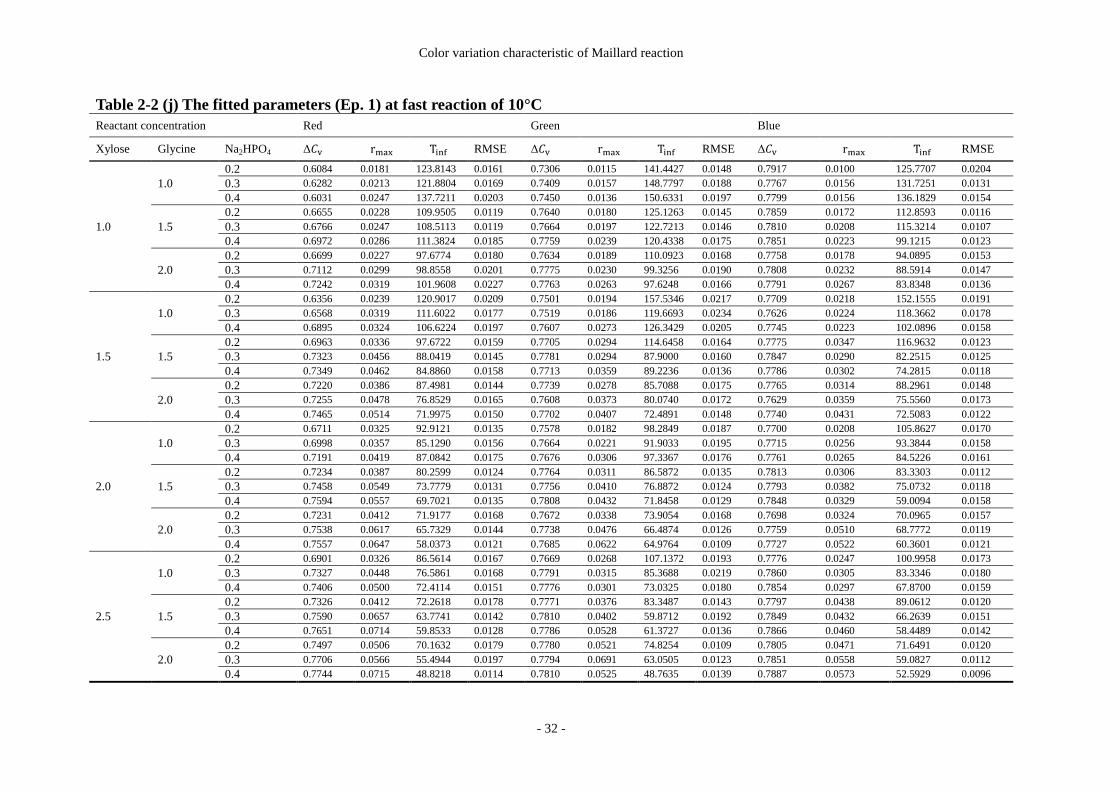
Whereas, the variation rate of the three color values at conditions using Na2HPO4
was similar. Figure 2-6 demonstrates representative observed/fitted color variations at
10 °C for Xy = 1.0 M, Gl = 1.5 M, and DH = 0.3 M. As Fig. 2-6, the slope of the three
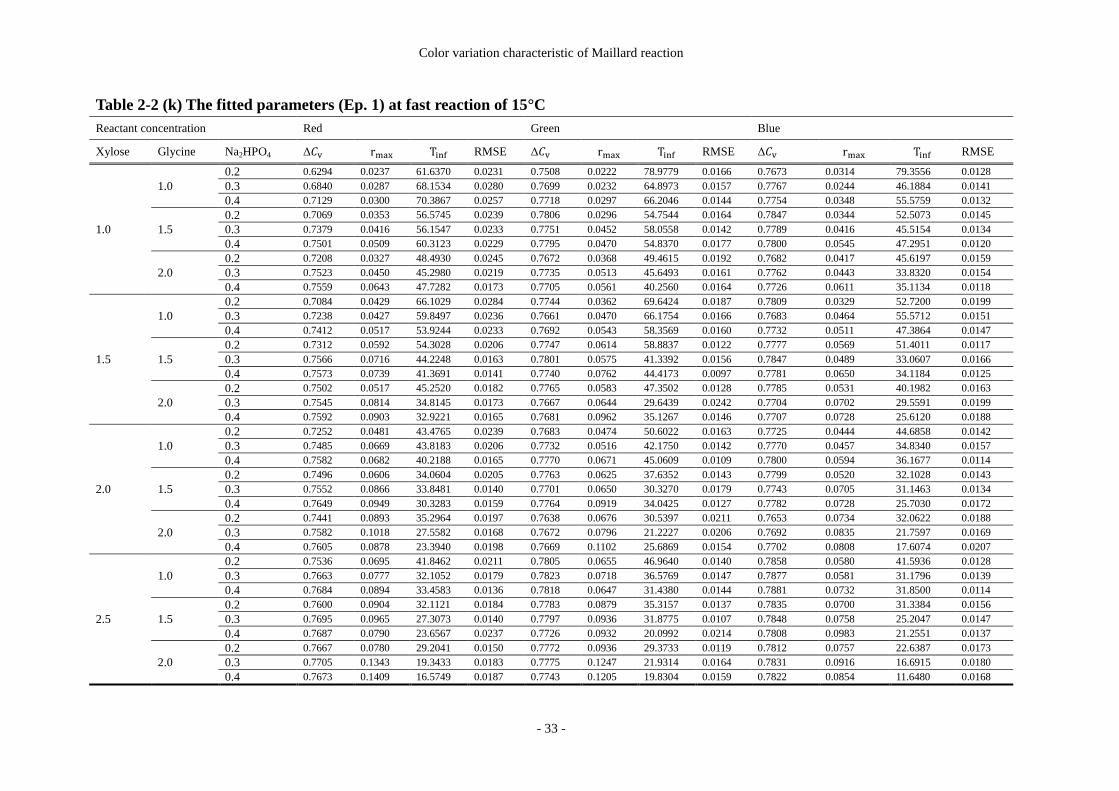
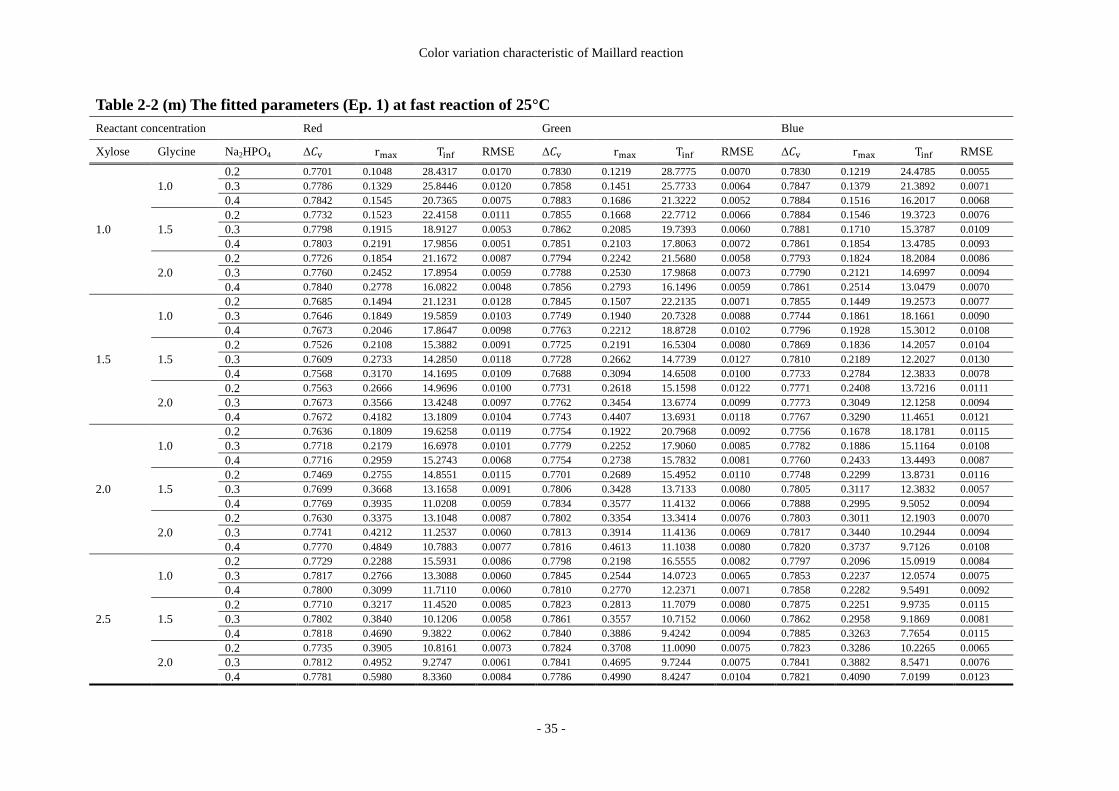
color values was similar. Thus, the 𝑟𝑚𝑎𝑥 and 𝑇𝑖𝑛𝑓 value at the results of fitting by Eq.
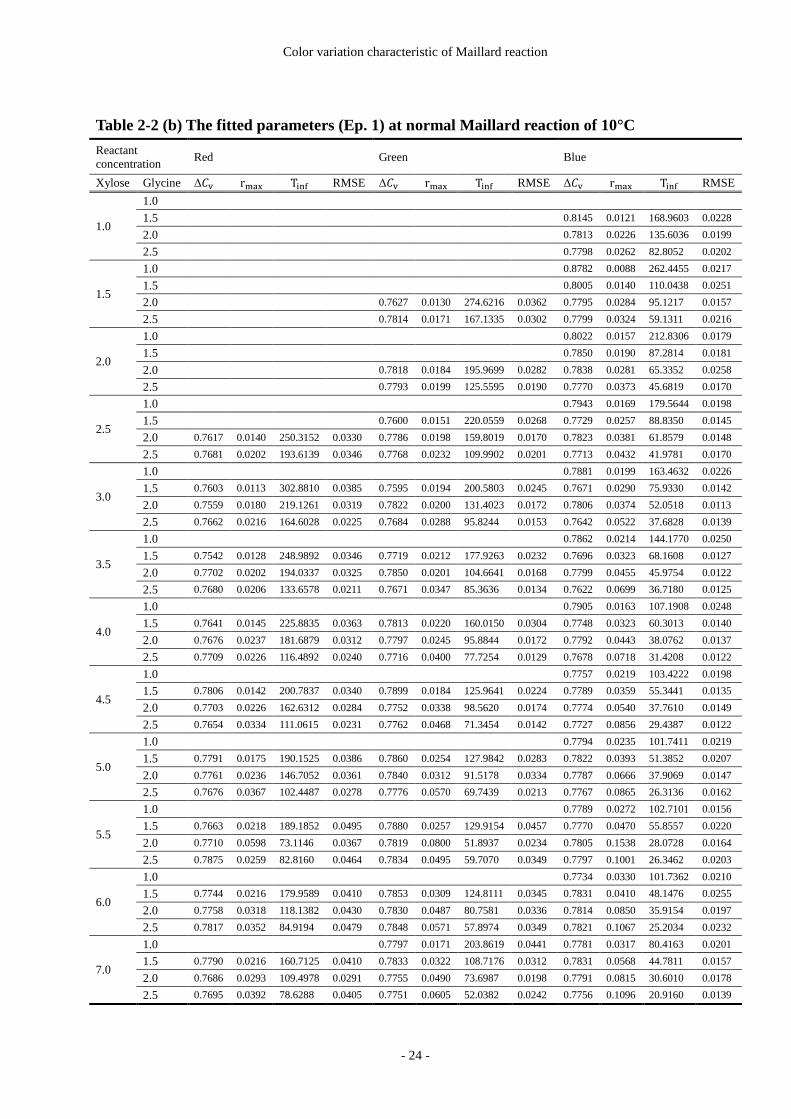
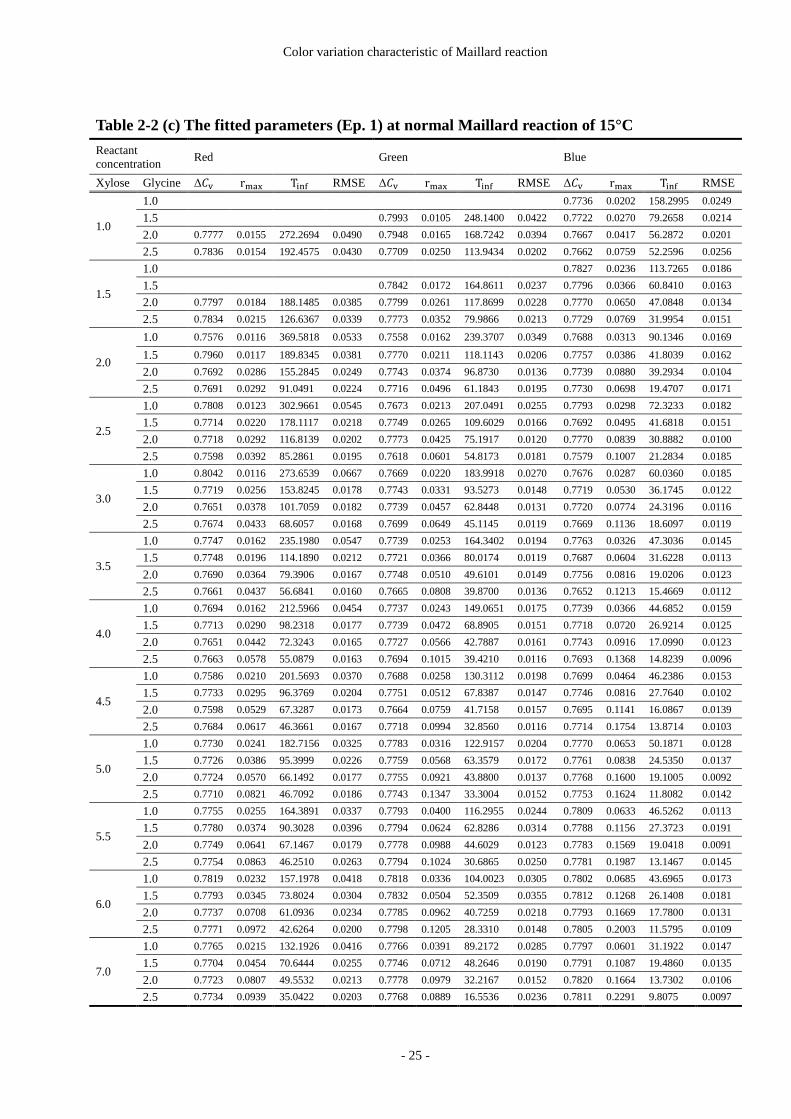
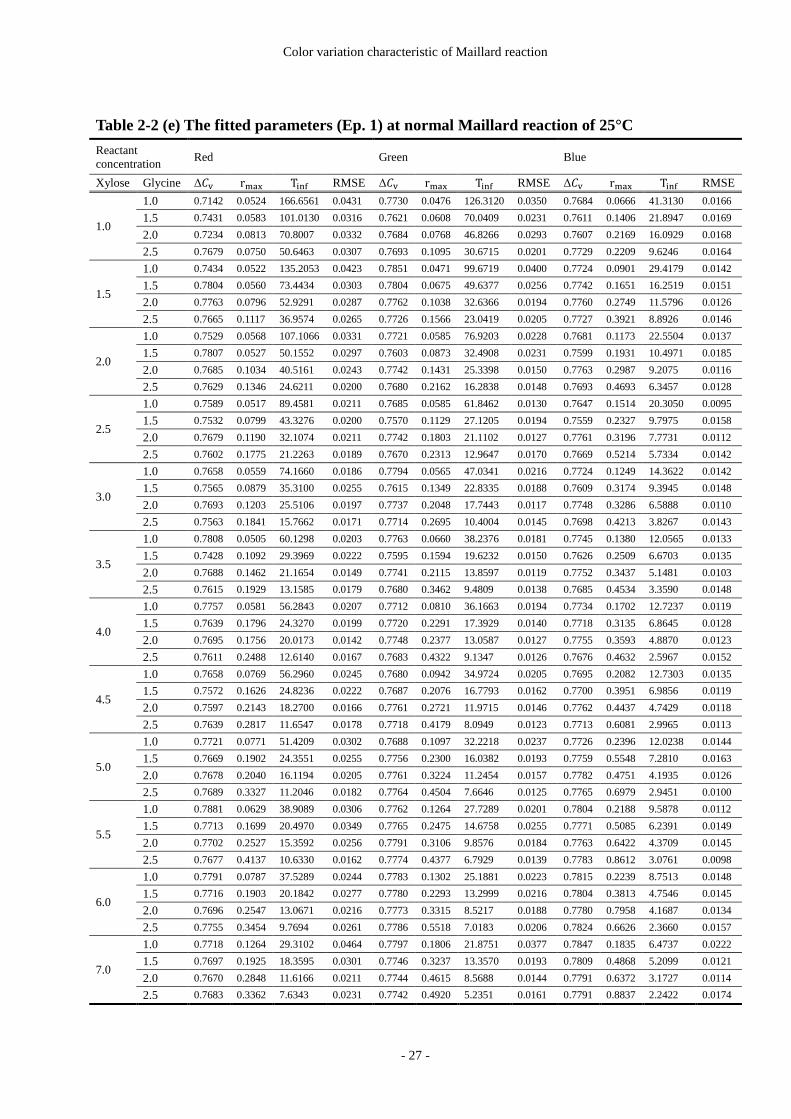
2-1 shown similar value, also. The fitted parameters of all conditions shows Table 2-2.
Fig. 2-5 A representation of the changes in the R (○), G (△), and B (□) values over
time during normal Maillard reaction at 20°C in the condition of 4.5 M D-
xylose and 2.0 M glycine. Solid, dashed, and dotted lines are illustrated
fitted curves for R, G, and B, respectively.
Page 34
Color variation characteristic of Maillard reaction
- 22 -
Fig. 2-6 A representation of the changes in the R (○), G (△), and B (□) values over
time during fast Maillard reaction at 10°C in the condition of 1.0 M D-
xylose, 1.5 M glycine, and 0.3 M Na2HPO4. Solid, dashed, and dotted lines
are illustrated fitted curves for R, G, and B, respectively.
Page 35
Color variation characteristic of Maillard reaction
- 23 -
Table 2-2 (a) The fitted parameters (Ep. 1) at normal Maillard reaction of 5°C
Reactant
concentration Red Green Blue
Xylose Glycine Δ𝐶v rmax Tinf RMSE Δ𝐶v rmax Tinf RMSE Δ𝐶v rmax Tinf RMSE
1.0
1.0
1.5
2.0
2.5 0.7839 0.0163 186.9528 0.0410
1.5
1.0
1.5
2.0
2.5 0.7955 0.0185 113.1169 0.0321
2.0
1.0
1.5 0.7731 0.0329 75.2810 0.0424
2.0 0.7866 0.0287 154.2107 0.0262
2.5 0.7184 0.0116 238.3562 0.0338 0.7713 0.0268 90.6473 0.0229
2.5
1.0
1.5 0.7796 0.0126 169.8765 0.0255
2.0 0.7835 0.0257 114.6133 0.0286
2.5 0.8212 0.0091 369.0838 0.0402 0.7482 0.0152 203.6181 0.0235 0.7703 0.0364 83.5597 0.0149
3.0
1.0
1.5 0.7696 0.0169 139.3669 0.0206
2.0 0.7824 0.0348 110.3735 0.0184
2.5 0.7833 0.0104 312.9604 0.0395 0.7479 0.0182 170.7382 0.0273 0.7676 0.0411 75.2307 0.0117
3.5
1.0
1.5 0.7573 0.0177 113.6135 0.0254
2.0 0.7766 0.0430 104.9982 0.0221
2.5 0.7946 0.0126 255.7120 0.0377 0.7602 0.0233 152.7248 0.0235 0.7694 0.0423 64.8031 0.0124
4.0
1.0 0.8125 0.0104 235.6610 0.0241
1.5 0.7529 0.0099 268.8092 0.0361 0.7691 0.0214 107.8477 0.0229
2.0 0.8500 0.0112 246.9655 0.0459 0.7776 0.0342 81.8913 0.0136
2.5 0.7461 0.0160 224.2222 0.0428 0.7719 0.0238 137.9582 0.0208 0.7723 0.0483 60.1580 0.0136
4.5
1.0 0.8016 0.0125 262.6927 0.0324
1.5 0.7573 0.0119 244.1436 0.0336 0.7705 0.0246 98.0039 0.0197
2.0 0.8002 0.0154 201.1066 0.0324 0.7807 0.0343 74.1623 0.0161
2.5 0.7537 0.0155 189.3488 0.0307 0.7763 0.0254 123.3656 0.0229 0.7771 0.0439 50.2332 0.0182
5.0
1.0 0.7746 0.0172 205.6749 0.0254
1.5 0.7665 0.0155 241.2774 0.0354 0.7733 0.0286 93.7093 0.0218
2.0 0.7537 0.0163 289.6577 0.0488 0.7835 0.0189 174.0240 0.0256 0.7793 0.0514 78.2021 0.0153
2.5 0.7538 0.0208 179.5359 0.0357 0.7796 0.0278 112.0799 0.0246 0.7778 0.0523 49.5958 0.0176
5.5
1.0 0.7827 0.0161 203.0597 0.0384
1.5 0.8207 0.0111 234.0609 0.0610 0.7695 0.0340 100.0418 0.0340
2.0 0.8254 0.0125 270.7164 0.0553 0.7815 0.0217 151.4443 0.0342 0.7820 0.0545 71.9829 0.0223
2.5 0.7556 0.0226 166.8241 0.0486 0.7807 0.0369 118.2918 0.0393 0.7796 0.0525 47.5527 0.0210
6.0
1.0 0.7757 0.0140 173.7304 0.0334
1.5 0.8470 0.0084 357.9057 0.0655 0.7885 0.0146 212.1147 0.0445 0.7729 0.0365 95.0313 0.0332
2.0 0.7890 0.0136 236.9667 0.0432 0.7795 0.0234 137.3581 0.0342 0.7796 0.0458 63.7910 0.0233
2.5 0.7636 0.0208 157.6842 0.0376 0.7898 0.0278 97.3919 0.0293 0.7838 0.0476 39.3201 0.0220
7.0
1.0 0.7914 0.0105 127.0733 0.0371
1.5 0.8078 0.0090 293.1750 0.0558 0.7865 0.0153 179.8942 0.0416 0.7800 0.0263 65.4837 0.0310
2.0 0.8177 0.0088 215.3046 0.0582 0.7697 0.0246 122.6631 0.0403 0.7807 0.0395 46.2695 0.0262
2.5 0.7578 0.0241 131.5936 0.0397 0.7813 0.0367 89.2279 0.0326 0.7833 0.0488 33.0943 0.0222
Page 36
Color variation characteristic of Maillard reaction
- 24 -
Table 2-2 (b) The fitted parameters (Ep. 1) at normal Maillard reaction of 10°C
Reactant
concentration Red Green Blue
Xylose Glycine Δ𝐶v rmax Tinf RMSE Δ𝐶v rmax Tinf RMSE Δ𝐶v rmax Tinf RMSE
1.0
1.0
1.5 0.8145 0.0121 168.9603 0.0228
2.0 0.7813 0.0226 135.6036 0.0199
2.5 0.7798 0.0262 82.8052 0.0202
1.5
1.0 0.8782 0.0088 262.4455 0.0217
1.5 0.8005 0.0140 110.0438 0.0251
2.0 0.7627 0.0130 274.6216 0.0362 0.7795 0.0284 95.1217 0.0157
2.5 0.7814 0.0171 167.1335 0.0302 0.7799 0.0324 59.1311 0.0216
2.0
1.0 0.8022 0.0157 212.8306 0.0179
1.5 0.7850 0.0190 87.2814 0.0181
2.0 0.7818 0.0184 195.9699 0.0282 0.7838 0.0281 65.3352 0.0258
2.5 0.7793 0.0199 125.5595 0.0190 0.7770 0.0373 45.6819 0.0170
2.5
1.0 0.7943 0.0169 179.5644 0.0198
1.5 0.7600 0.0151 220.0559 0.0268 0.7729 0.0257 88.8350 0.0145
2.0 0.7617 0.0140 250.3152 0.0330 0.7786 0.0198 159.8019 0.0170 0.7823 0.0381 61.8579 0.0148
2.5 0.7681 0.0202 193.6139 0.0346 0.7768 0.0232 109.9902 0.0201 0.7713 0.0432 41.9781 0.0170
3.0
1.0 0.7881 0.0199 163.4632 0.0226
1.5 0.7603 0.0113 302.8810 0.0385 0.7595 0.0194 200.5803 0.0245 0.7671 0.0290 75.9330 0.0142
2.0 0.7559 0.0180 219.1261 0.0319 0.7822 0.0200 131.4023 0.0172 0.7806 0.0374 52.0518 0.0113
2.5 0.7662 0.0216 164.6028 0.0225 0.7684 0.0288 95.8244 0.0153 0.7642 0.0522 37.6828 0.0139
3.5
1.0 0.7862 0.0214 144.1770 0.0250
1.5 0.7542 0.0128 248.9892 0.0346 0.7719 0.0212 177.9263 0.0232 0.7696 0.0323 68.1608 0.0127
2.0 0.7702 0.0202 194.0337 0.0325 0.7850 0.0201 104.6641 0.0168 0.7799 0.0455 45.9754 0.0122
2.5 0.7680 0.0206 133.6578 0.0211 0.7671 0.0347 85.3636 0.0134 0.7622 0.0699 36.7180 0.0125
4.0
1.0 0.7905 0.0163 107.1908 0.0248
1.5 0.7641 0.0145 225.8835 0.0363 0.7813 0.0220 160.0150 0.0304 0.7748 0.0323 60.3013 0.0140
2.0 0.7676 0.0237 181.6879 0.0312 0.7797 0.0245 95.8844 0.0172 0.7792 0.0443 38.0762 0.0137
2.5 0.7709 0.0226 116.4892 0.0240 0.7716 0.0400 77.7254 0.0129 0.7678 0.0718 31.4208 0.0122
4.5
1.0 0.7757 0.0219 103.4222 0.0198
1.5 0.7806 0.0142 200.7837 0.0340 0.7899 0.0184 125.9641 0.0224 0.7789 0.0359 55.3441 0.0135
2.0 0.7703 0.0226 162.6312 0.0284 0.7752 0.0338 98.5620 0.0174 0.7774 0.0540 37.7610 0.0149
2.5 0.7654 0.0334 111.0615 0.0231 0.7762 0.0468 71.3454 0.0142 0.7727 0.0856 29.4387 0.0122
5.0
1.0 0.7794 0.0235 101.7411 0.0219
1.5 0.7791 0.0175 190.1525 0.0386 0.7860 0.0254 127.9842 0.0283 0.7822 0.0393 51.3852 0.0207
2.0 0.7761 0.0236 146.7052 0.0361 0.7840 0.0312 91.5178 0.0334 0.7787 0.0666 37.9069 0.0147
2.5 0.7676 0.0367 102.4487 0.0278 0.7776 0.0570 69.7439 0.0213 0.7767 0.0865 26.3136 0.0162
5.5
1.0 0.7789 0.0272 102.7101 0.0156
1.5 0.7663 0.0218 189.1852 0.0495 0.7880 0.0257 129.9154 0.0457 0.7770 0.0470 55.8557 0.0220
2.0 0.7710 0.0598 73.1146 0.0367 0.7819 0.0800 51.8937 0.0234 0.7805 0.1538 28.0728 0.0164
2.5 0.7875 0.0259 82.8160 0.0464 0.7834 0.0495 59.7070 0.0349 0.7797 0.1001 26.3462 0.0203
6.0
1.0 0.7734 0.0330 101.7362 0.0210
1.5 0.7744 0.0216 179.9589 0.0410 0.7853 0.0309 124.8111 0.0345 0.7831 0.0410 48.1476 0.0255
2.0 0.7758 0.0318 118.1382 0.0430 0.7830 0.0487 80.7581 0.0336 0.7814 0.0850 35.9154 0.0197
2.5 0.7817 0.0352 84.9194 0.0479 0.7848 0.0571 57.8974 0.0349 0.7821 0.1067 25.2034 0.0232
7.0
1.0 0.7797 0.0171 203.8619 0.0441 0.7781 0.0317 80.4163 0.0201
1.5 0.7790 0.0216 160.7125 0.0410 0.7833 0.0322 108.7176 0.0312 0.7831 0.0568 44.7811 0.0157
2.0 0.7686 0.0293 109.4978 0.0291 0.7755 0.0490 73.6987 0.0198 0.7791 0.0815 30.6010 0.0178
2.5 0.7695 0.0392 78.6288 0.0405 0.7751 0.0605 52.0382 0.0242 0.7756 0.1096 20.9160 0.0139
Page 37
Color variation characteristic of Maillard reaction
- 25 -
Table 2-2 (c) The fitted parameters (Ep. 1) at normal Maillard reaction of 15°C
Reactant
concentration Red Green Blue
Xylose Glycine Δ𝐶v rmax Tinf RMSE Δ𝐶v rmax Tinf RMSE Δ𝐶v rmax Tinf RMSE
1.0
1.0 0.7736 0.0202 158.2995 0.0249
1.5 0.7993 0.0105 248.1400 0.0422 0.7722 0.0270 79.2658 0.0214
2.0 0.7777 0.0155 272.2694 0.0490 0.7948 0.0165 168.7242 0.0394 0.7667 0.0417 56.2872 0.0201
2.5 0.7836 0.0154 192.4575 0.0430 0.7709 0.0250 113.9434 0.0202 0.7662 0.0759 52.2596 0.0256
1.5
1.0 0.7827 0.0236 113.7265 0.0186
1.5 0.7842 0.0172 164.8611 0.0237 0.7796 0.0366 60.8410 0.0163
2.0 0.7797 0.0184 188.1485 0.0385 0.7799 0.0261 117.8699 0.0228 0.7770 0.0650 47.0848 0.0134
2.5 0.7834 0.0215 126.6367 0.0339 0.7773 0.0352 79.9866 0.0213 0.7729 0.0769 31.9954 0.0151
2.0
1.0 0.7576 0.0116 369.5818 0.0533 0.7558 0.0162 239.3707 0.0349 0.7688 0.0313 90.1346 0.0169
1.5 0.7960 0.0117 189.8345 0.0381 0.7770 0.0211 118.1143 0.0206 0.7757 0.0386 41.8039 0.0162
2.0 0.7692 0.0286 155.2845 0.0249 0.7743 0.0374 96.8730 0.0136 0.7739 0.0880 39.2934 0.0104
2.5 0.7691 0.0292 91.0491 0.0224 0.7716 0.0496 61.1843 0.0195 0.7730 0.0698 19.4707 0.0171
2.5
1.0 0.7808 0.0123 302.9661 0.0545 0.7673 0.0213 207.0491 0.0255 0.7793 0.0298 72.3233 0.0182
1.5 0.7714 0.0220 178.1117 0.0218 0.7749 0.0265 109.6029 0.0166 0.7692 0.0495 41.6818 0.0151
2.0 0.7718 0.0292 116.8139 0.0202 0.7773 0.0425 75.1917 0.0120 0.7770 0.0839 30.8882 0.0100
2.5 0.7598 0.0392 85.2861 0.0195 0.7618 0.0601 54.8173 0.0181 0.7579 0.1007 21.2834 0.0185
3.0
1.0 0.8042 0.0116 273.6539 0.0667 0.7669 0.0220 183.9918 0.0270 0.7676 0.0287 60.0360 0.0185
1.5 0.7719 0.0256 153.8245 0.0178 0.7743 0.0331 93.5273 0.0148 0.7719 0.0530 36.1745 0.0122
2.0 0.7651 0.0378 101.7059 0.0182 0.7739 0.0457 62.8448 0.0131 0.7720 0.0774 24.3196 0.0116
2.5 0.7674 0.0433 68.6057 0.0168 0.7699 0.0649 45.1145 0.0119 0.7669 0.1136 18.6097 0.0119
3.5
1.0 0.7747 0.0162 235.1980 0.0547 0.7739 0.0253 164.3402 0.0194 0.7763 0.0326 47.3036 0.0145
1.5 0.7748 0.0196 114.1890 0.0212 0.7721 0.0366 80.0174 0.0119 0.7687 0.0604 31.6228 0.0113
2.0 0.7690 0.0364 79.3906 0.0167 0.7748 0.0510 49.6101 0.0149 0.7756 0.0816 19.0206 0.0123
2.5 0.7661 0.0437 56.6841 0.0160 0.7665 0.0808 39.8700 0.0136 0.7652 0.1213 15.4669 0.0112
4.0
1.0 0.7694 0.0162 212.5966 0.0454 0.7737 0.0243 149.0651 0.0175 0.7739 0.0366 44.6852 0.0159
1.5 0.7713 0.0290 98.2318 0.0177 0.7739 0.0472 68.8905 0.0151 0.7718 0.0720 26.9214 0.0125
2.0 0.7651 0.0442 72.3243 0.0165 0.7727 0.0566 42.7887 0.0161 0.7743 0.0916 17.0990 0.0123
2.5 0.7663 0.0578 55.0879 0.0163 0.7694 0.1015 39.4210 0.0116 0.7693 0.1368 14.8239 0.0096
4.5
1.0 0.7586 0.0210 201.5693 0.0370 0.7688 0.0258 130.3112 0.0198 0.7699 0.0464 46.2386 0.0153
1.5 0.7733 0.0295 96.3769 0.0204 0.7751 0.0512 67.8387 0.0147 0.7746 0.0816 27.7640 0.0102
2.0 0.7598 0.0529 67.3287 0.0173 0.7664 0.0759 41.7158 0.0157 0.7695 0.1141 16.0867 0.0139
2.5 0.7684 0.0617 46.3661 0.0167 0.7718 0.0994 32.8560 0.0116 0.7714 0.1754 13.8714 0.0103
5.0
1.0 0.7730 0.0241 182.7156 0.0325 0.7783 0.0316 122.9157 0.0204 0.7770 0.0653 50.1871 0.0128
1.5 0.7726 0.0386 95.3999 0.0226 0.7759 0.0568 63.3579 0.0172 0.7761 0.0838 24.5350 0.0137
2.0 0.7724 0.0570 66.1492 0.0177 0.7755 0.0921 43.8800 0.0137 0.7768 0.1600 19.1005 0.0092
2.5 0.7710 0.0821 46.7092 0.0186 0.7743 0.1347 33.3004 0.0152 0.7753 0.1624 11.8082 0.0142
5.5
1.0 0.7755 0.0255 164.3891 0.0337 0.7793 0.0400 116.2955 0.0244 0.7809 0.0633 46.5262 0.0113
1.5 0.7780 0.0374 90.3028 0.0396 0.7794 0.0624 62.8286 0.0314 0.7788 0.1156 27.3723 0.0191
2.0 0.7749 0.0641 67.1467 0.0179 0.7778 0.0988 44.6029 0.0123 0.7783 0.1569 19.0418 0.0091
2.5 0.7754 0.0863 46.2510 0.0263 0.7794 0.1024 30.6865 0.0250 0.7781 0.1987 13.1467 0.0145
6.0
1.0 0.7819 0.0232 157.1978 0.0418 0.7818 0.0336 104.0023 0.0305 0.7802 0.0685 43.6965 0.0173
1.5 0.7793 0.0345 73.8024 0.0304 0.7832 0.0504 52.3509 0.0355 0.7812 0.1268 26.1408 0.0181
2.0 0.7737 0.0708 61.0936 0.0234 0.7785 0.0962 40.7259 0.0218 0.7793 0.1669 17.7800 0.0131
2.5 0.7771 0.0972 42.6264 0.0200 0.7798 0.1205 28.3310 0.0148 0.7805 0.2003 11.5795 0.0109
7.0
1.0 0.7765 0.0215 132.1926 0.0416 0.7766 0.0391 89.2172 0.0285 0.7797 0.0601 31.1922 0.0147
1.5 0.7704 0.0454 70.6444 0.0255 0.7746 0.0712 48.2646 0.0190 0.7791 0.1087 19.4860 0.0135
2.0 0.7723 0.0807 49.5532 0.0213 0.7778 0.0979 32.2167 0.0152 0.7820 0.1664 13.7302 0.0106
2.5 0.7734 0.0939 35.0422 0.0203 0.7768 0.0889 16.5536 0.0236 0.7811 0.2291 9.8075 0.0097
Page 38
Color variation characteristic of Maillard reaction
- 26 -
Table 2-2 (d) The fitted parameters (Ep. 1) at normal Maillard reaction of 20°C
Reactant
concentration Red Green Blue
Xylose Glycine Δ𝐶v rmax Tinf RMSE Δ𝐶v rmax Tinf RMSE Δ𝐶v rmax Tinf RMSE
1.0
1.0 0.7726 0.0305 73.4148 0.0254
1.5 0.7708 0.0174 183.6858 0.0403 0.7742 0.0243 118.3503 0.0204 0.7771 0.0499 33.2053 0.0149
2.0 0.6870 0.0451 138.8821 0.0429 0.7777 0.0386 92.9108 0.0338 0.7694 0.1050 28.4289 0.0153
2.5 0.7652 0.0369 98.0406 0.0341 0.7748 0.0516 58.6059 0.0219 0.7738 0.1245 18.4839 0.0118
1.5
1.0 0.7782 0.0466 56.8089 0.0166
1.5 0.7650 0.0279 135.5237 0.0359 0.7830 0.0306 78.6622 0.0261 0.7807 0.0618 23.1541 0.0142
2.0 0.7720 0.0424 104.4407 0.0363 0.7814 0.0528 66.5775 0.0231 0.7767 0.1490 22.2209 0.0114
2.5 0.7745 0.0493 67.0031 0.0265 0.7779 0.0645 36.3665 0.0208 0.7775 0.1625 14.8262 0.0133
2.0
1.0 0.7791 0.0197 199.0381 0.0427 0.7827 0.0252 131.8735 0.0242 0.7789 0.0587 41.4369 0.0138
1.5 0.7717 0.0298 93.0926 0.0213 0.7755 0.0438 58.9910 0.0204 0.7748 0.0888 18.2959 0.0115
2.0 0.7756 0.0521 77.0951 0.0337 0.7758 0.0830 50.1885 0.0259 0.7756 0.2053 18.7138 0.0119
2.5 0.7636 0.0659 47.0607 0.0193 0.7726 0.1039 28.7050 0.0151 0.7738 0.1795 10.2860 0.0123
2.5
1.0 0.7901 0.0217 164.4747 0.0420 0.7804 0.0322 113.7011 0.0260 0.7697 0.0699 35.6874 0.0165
1.5 0.7777 0.0362 83.8417 0.0333 0.7749 0.0634 59.4940 0.0199 0.7712 0.1323 20.8343 0.0149
2.0 0.7710 0.0652 63.7753 0.0322 0.7785 0.0814 37.0837 0.0181 0.7757 0.2360 16.2357 0.0117
2.5 0.7650 0.0833 43.1093 0.0210 0.7720 0.1283 26.9484 0.0183 0.7685 0.2689 11.1666 0.0123
3.0
1.0 0.7822 0.0236 132.8518 0.0264 0.7821 0.0321 87.7422 0.0223 0.7772 0.0791 30.6276 0.0128
1.5 0.7679 0.0489 73.4331 0.0265 0.7706 0.0726 48.5925 0.0184 0.7649 0.1718 18.8965 0.0152
2.0 0.7651 0.0778 53.8268 0.0284 0.7759 0.1104 32.4464 0.0175 0.7768 0.2077 12.6091 0.0130
2.5 0.7664 0.1014 36.9381 0.0232 0.7720 0.1428 22.3456 0.0223 0.7653 0.3070 9.6097 0.0140
3.5
1.0 0.7759 0.0281 116.8964 0.0278 0.7802 0.0383 77.6437 0.0247 0.7766 0.0960 29.3518 0.0104
1.5 0.7570 0.0579 65.7003 0.0258 0.7645 0.0756 40.1965 0.0196 0.7630 0.1876 16.5974 0.0125
2.0 0.7687 0.0874 45.9308 0.0230 0.7759 0.1433 29.9986 0.0156 0.7760 0.2238 11.3568 0.0122
2.5 0.7634 0.1139 32.1365 0.0233 0.7686 0.1726 20.0174 0.0221 0.7627 0.3872 9.1658 0.0137
4.0
1.0 0.7632 0.0373 109.9981 0.0292 0.7741 0.0513 75.5321 0.0264 0.7734 0.1111 27.2621 0.0125
1.5 0.7690 0.0652 60.0127 0.0278 0.7732 0.0918 36.8024 0.0222 0.7719 0.1813 14.3887 0.0138
2.0 0.7603 0.1050 41.1024 0.0232 0.7737 0.1525 26.7491 0.0169 0.7733 0.2730 11.0684 0.0106
2.5 0.7597 0.1461 29.1710 0.0249 0.7687 0.2292 19.2845 0.0163 0.7657 0.3602 8.1171 0.0129
4.5
1.0 0.7679 0.0362 102.3279 0.0331 0.7733 0.0552 70.5137 0.0277 0.7719 0.1155 24.7914 0.0139
1.5 0.7729 0.0664 51.0394 0.0268 0.7771 0.1012 32.4847 0.0233 0.7758 0.1911 12.9303 0.0136
2.0 0.7647 0.1087 38.0334 0.0259 0.7726 0.1790 25.4246 0.0186 0.7721 0.2741 9.9684 0.0127
2.5 0.7646 0.1677 24.5189 0.0228 0.7759 0.2329 16.7857 0.0162 0.7719 0.3885 7.0839 0.0114
5.0
1.0 0.7706 0.0432 94.5652 0.0321 0.7782 0.0583 63.3260 0.0273 0.7760 0.1296 23.8723 0.0117
1.5 0.7701 0.0915 41.0454 0.0253 0.7783 0.1328 27.4878 0.0188 0.7774 0.2744 12.4726 0.0120
2.0 0.7739 0.1114 34.6255 0.0292 0.7752 0.2124 23.7340 0.0166 0.7752 0.3264 9.7648 0.0090
2.5 0.7637 0.1989 23.7340 0.0276 0.7806 0.2405 15.7090 0.0156 0.7766 0.3823 6.5737 0.0141
5.5
1.0 0.7880 0.0380 86.8555 0.0372 0.7832 0.0581 58.8406 0.0303 0.7791 0.1135 20.6208 0.0150
1.5 0.7785 0.0719 41.6571 0.0450 0.7866 0.0961 28.5588 0.0489 0.7809 0.1787 11.8062 0.0226
2.0 0.7738 0.1126 29.4339 0.0312 0.7814 0.1729 19.9642 0.0232 0.7785 0.3040 8.6430 0.0135
2.5 0.7840 0.1400 21.5898 0.0495 0.7829 0.2552 15.4145 0.0342 0.7793 0.4589 7.0695 0.0237
6.0
1.0 0.7789 0.0498 86.4168 0.0328 0.7821 0.0642 56.3094 0.0244 0.7788 0.1451 21.5033 0.0134
1.5 0.7743 0.0831 40.6378 0.0330 0.7819 0.1399 29.0544 0.0272 0.7800 0.2329 12.4070 0.0165
2.0 0.7739 0.1397 29.5639 0.0323 0.7796 0.2226 20.0836 0.0208 0.7793 0.3909 9.0960 0.0110
2.5 0.7754 0.1889 20.5174 0.0305 0.7828 0.2664 14.1966 0.0223 0.7797 0.4892 6.6084 0.0171
7.0
1.0 0.7781 0.0465 70.8231 0.0422 0.7788 0.0762 49.8362 0.0280 0.7809 0.1475 18.0116 0.0151
1.5 0.7687 0.1109 38.5133 0.0284 0.7815 0.1336 24.7228 0.0238 0.7826 0.1989 9.7106 0.0170
2.0 0.7707 0.1473 24.7373 0.0278 0.7789 0.2118 16.6239 0.0181 0.7802 0.3569 7.1785 0.0129
2.5 0.7719 0.2144 18.0794 0.0226 0.7804 0.3047 12.8353 0.0153 0.7804 0.6285 6.1663 0.0135
Page 39
Color variation characteristic of Maillard reaction
- 27 -
Table 2-2 (e) The fitted parameters (Ep. 1) at normal Maillard reaction of 25°C
Reactant
concentration Red Green Blue
Xylose Glycine Δ𝐶v rmax Tinf RMSE Δ𝐶v rmax Tinf RMSE Δ𝐶v rmax Tinf RMSE
1.0
1.0 0.7142 0.0524 166.6561 0.0431 0.7730 0.0476 126.3120 0.0350 0.7684 0.0666 41.3130 0.0166
1.5 0.7431 0.0583 101.0130 0.0316 0.7621 0.0608 70.0409 0.0231 0.7611 0.1406 21.8947 0.0169
2.0 0.7234 0.0813 70.8007 0.0332 0.7684 0.0768 46.8266 0.0293 0.7607 0.2169 16.0929 0.0168
2.5 0.7679 0.0750 50.6463 0.0307 0.7693 0.1095 30.6715 0.0201 0.7729 0.2209 9.6246 0.0164
1.5
1.0 0.7434 0.0522 135.2053 0.0423 0.7851 0.0471 99.6719 0.0400 0.7724 0.0901 29.4179 0.0142
1.5 0.7804 0.0560 73.4434 0.0303 0.7804 0.0675 49.6377 0.0256 0.7742 0.1651 16.2519 0.0151
2.0 0.7763 0.0796 52.9291 0.0287 0.7762 0.1038 32.6366 0.0194 0.7760 0.2749 11.5796 0.0126
2.5 0.7665 0.1117 36.9574 0.0265 0.7726 0.1566 23.0419 0.0205 0.7727 0.3921 8.8926 0.0146
2.0
1.0 0.7529 0.0568 107.1066 0.0331 0.7721 0.0585 76.9203 0.0228 0.7681 0.1173 22.5504 0.0137
1.5 0.7807 0.0527 50.1552 0.0297 0.7603 0.0873 32.4908 0.0231 0.7599 0.1931 10.4971 0.0185
2.0 0.7685 0.1034 40.5161 0.0243 0.7742 0.1431 25.3398 0.0150 0.7763 0.2987 9.2075 0.0116
2.5 0.7629 0.1346 24.6211 0.0200 0.7680 0.2162 16.2838 0.0148 0.7693 0.4693 6.3457 0.0128
2.5
1.0 0.7589 0.0517 89.4581 0.0211 0.7685 0.0585 61.8462 0.0130 0.7647 0.1514 20.3050 0.0095
1.5 0.7532 0.0799 43.3276 0.0200 0.7570 0.1129 27.1205 0.0194 0.7559 0.2327 9.7975 0.0158
2.0 0.7679 0.1190 32.1074 0.0211 0.7742 0.1803 21.1102 0.0127 0.7761 0.3196 7.7731 0.0112
2.5 0.7602 0.1775 21.2263 0.0189 0.7670 0.2313 12.9647 0.0170 0.7669 0.5214 5.7334 0.0142
3.0
1.0 0.7658 0.0559 74.1660 0.0186 0.7794 0.0565 47.0341 0.0216 0.7724 0.1249 14.3622 0.0142
1.5 0.7565 0.0879 35.3100 0.0255 0.7615 0.1349 22.8335 0.0188 0.7609 0.3174 9.3945 0.0148
2.0 0.7693 0.1203 25.5106 0.0197 0.7737 0.2048 17.7443 0.0117 0.7748 0.3286 6.5888 0.0110
2.5 0.7563 0.1841 15.7662 0.0171 0.7714 0.2695 10.4004 0.0145 0.7698 0.4213 3.8267 0.0143
3.5
1.0 0.7808 0.0505 60.1298 0.0203 0.7763 0.0660 38.2376 0.0181 0.7745 0.1380 12.0565 0.0133
1.5 0.7428 0.1092 29.3969 0.0222 0.7595 0.1594 19.6232 0.0150 0.7626 0.2509 6.6703 0.0135
2.0 0.7688 0.1462 21.1654 0.0149 0.7741 0.2115 13.8597 0.0119 0.7752 0.3437 5.1481 0.0103
2.5 0.7615 0.1929 13.1585 0.0179 0.7680 0.3462 9.4809 0.0138 0.7685 0.4534 3.3590 0.0148
4.0
1.0 0.7757 0.0581 56.2843 0.0207 0.7712 0.0810 36.1663 0.0194 0.7734 0.1702 12.7237 0.0119
1.5 0.7639 0.1796 24.3270 0.0199 0.7720 0.2291 17.3929 0.0140 0.7718 0.3135 6.8645 0.0128
2.0 0.7695 0.1756 20.0173 0.0142 0.7748 0.2377 13.0587 0.0127 0.7755 0.3593 4.8870 0.0123
2.5 0.7611 0.2488 12.6140 0.0167 0.7683 0.4322 9.1347 0.0126 0.7676 0.4632 2.5967 0.0152
4.5
1.0 0.7658 0.0769 56.2960 0.0245 0.7680 0.0942 34.9724 0.0205 0.7695 0.2082 12.7303 0.0135
1.5 0.7572 0.1626 24.8236 0.0222 0.7687 0.2076 16.7793 0.0162 0.7700 0.3951 6.9856 0.0119
2.0 0.7597 0.2143 18.2700 0.0166 0.7761 0.2721 11.9715 0.0146 0.7762 0.4437 4.7429 0.0118
2.5 0.7639 0.2817 11.6547 0.0178 0.7718 0.4179 8.0949 0.0123 0.7713 0.6081 2.9965 0.0113
5.0
1.0 0.7721 0.0771 51.4209 0.0302 0.7688 0.1097 32.2218 0.0237 0.7726 0.2396 12.0238 0.0144
1.5 0.7669 0.1902 24.3551 0.0255 0.7756 0.2300 16.0382 0.0193 0.7759 0.5548 7.2810 0.0163
2.0 0.7678 0.2040 16.1194 0.0205 0.7761 0.3224 11.2454 0.0157 0.7782 0.4751 4.1935 0.0126
2.5 0.7689 0.3327 11.2046 0.0182 0.7764 0.4504 7.6646 0.0125 0.7765 0.6979 2.9451 0.0100
5.5
1.0 0.7881 0.0629 38.9089 0.0306 0.7762 0.1264 27.7289 0.0201 0.7804 0.2188 9.5878 0.0112
1.5 0.7713 0.1699 20.4970 0.0349 0.7765 0.2475 14.6758 0.0255 0.7771 0.5085 6.2391 0.0149
2.0 0.7702 0.2527 15.3592 0.0256 0.7791 0.3106 9.8576 0.0184 0.7763 0.6422 4.3709 0.0145
2.5 0.7677 0.4137 10.6330 0.0162 0.7774 0.4377 6.7929 0.0139 0.7783 0.8612 3.0761 0.0098
6.0
1.0 0.7791 0.0787 37.5289 0.0244 0.7783 0.1302 25.1881 0.0223 0.7815 0.2239 8.7513 0.0148
1.5 0.7716 0.1903 20.1842 0.0277 0.7780 0.2293 13.2999 0.0216 0.7804 0.3813 4.7546 0.0145
2.0 0.7696 0.2547 13.0671 0.0216 0.7773 0.3315 8.5217 0.0188 0.7780 0.7958 4.1687 0.0134
2.5 0.7755 0.3454 9.7694 0.0261 0.7786 0.5518 7.0183 0.0206 0.7824 0.6626 2.3660 0.0157
7.0
1.0 0.7718 0.1264 29.3102 0.0464 0.7797 0.1806 21.8751 0.0377 0.7847 0.1835 6.4737 0.0222
1.5 0.7697 0.1925 18.3595 0.0301 0.7746 0.3237 13.3570 0.0193 0.7809 0.4868 5.2099 0.0121
2.0 0.7670 0.2848 11.6166 0.0211 0.7744 0.4615 8.5688 0.0144 0.7791 0.6372 3.1727 0.0114
2.5 0.7683 0.3362 7.6343 0.0231 0.7742 0.4920 5.2351 0.0161 0.7791 0.8837 2.2422 0.0174
Page 40
Color variation characteristic of Maillard reaction
- 28 -
Table 2-2 (f) The fitted parameters (Ep. 1) at normal Maillard reaction of 30°C
Reactant
concentration Red Green Blue
Xylose Glycine Δ𝐶v rmax Tinf RMSE Δ𝐶v rmax Tinf RMSE Δ𝐶v rmax Tinf RMSE
1.0
1.0 0.7297 0.0974 87.9961 0.0390 0.7902 0.0691 68.1704 0.0433 0.7586 0.1360 21.1810 0.0164
1.5 0.7442 0.1245 64.7823 0.0427 0.7681 0.1138 43.9222 0.0311 0.7723 0.2320 13.9389 0.0165
2.0 0.7250 0.1468 48.0454 0.0398 0.7768 0.1368 31.8077 0.0309 0.7713 0.3243 9.7004 0.0159
2.5 0.7713 0.1195 35.0383 0.0399 0.7742 0.1849 22.5552 0.0241 0.7738 0.4045 7.2940 0.0171
1.5
1.0 0.7258 0.1094 77.1189 0.0348 0.7764 0.0841 56.1791 0.0371 0.7698 0.1850 17.5535 0.0130
1.5 0.7661 0.1099 50.8051 0.0401 0.7837 0.1042 33.1068 0.0395 0.7747 0.2684 10.4548 0.0147
2.0 0.7742 0.1277 31.4384 0.0311 0.7736 0.2017 20.5035 0.0228 0.7756 0.3949 6.6947 0.0114
2.5 0.7716 0.1635 24.2310 0.0311 0.7783 0.1983 14.2665 0.0231 0.7727 0.4315 4.9931 0.0144
2.0
1.0 0.7491 0.1033 72.0833 0.0403 0.7850 0.0752 49.3977 0.0351 0.7763 0.1930 16.3730 0.0153
1.5 0.7592 0.0949 46.5830 0.0317 0.7613 0.1212 29.4704 0.0223 0.7661 0.2532 9.0993 0.0168
2.0 0.7677 0.1330 30.8067 0.0302 0.7709 0.1820 19.1455 0.0211 0.7708 0.4237 6.6777 0.0110
2.5 0.7533 0.1842 22.0213 0.0271 0.7699 0.2635 14.1394 0.0155 0.7701 0.5480 5.3377 0.0132
2.5
1.0 0.7752 0.0979 53.4169 0.0436 0.7801 0.1064 36.3110 0.0394 0.7764 0.2457 12.4670 0.0123
1.5 0.7542 0.1178 30.7425 0.0274 0.7587 0.1845 19.7940 0.0199 0.7600 0.3280 6.3926 0.0141
2.0 0.7693 0.1982 20.0237 0.0220 0.7742 0.2523 12.5622 0.0208 0.7725 0.4302 4.1016 0.0207
2.5 0.7598 0.2829 15.5090 0.0254 0.7724 0.3485 9.7175 0.0149 0.7667 0.6013 3.4760 0.0138
3.0
1.0 0.8372 0.0746 49.6836 0.0540 0.7793 0.1158 31.6538 0.0352 0.7750 0.2741 10.7495 0.0128
1.5 0.7575 0.1340 26.0448 0.0303 0.7649 0.2129 17.2726 0.0152 0.7642 0.3520 5.5402 0.0149
2.0 0.7627 0.2240 14.9848 0.0174 0.7774 0.3053 9.4763 0.0105 0.7801 0.4439 3.2571 0.0149
2.5 0.7594 0.2913 13.3568 0.0222 0.7673 0.3459 7.5558 0.0188 0.7611 0.7576 3.2232 0.0144
3.5
1.0 0.7738 0.1160 43.4713 0.0557 0.7782 0.1333 28.4260 0.0385 0.7843 0.1032 0.3439 0.0527
1.5 0.7845 0.1265 23.5710 0.0528 0.7679 0.2313 15.3584 0.0167 0.7655 0.3370 4.4358 0.0189
2.0 0.7671 0.2871 15.2393 0.0219 0.7824 0.2868 8.8556 0.0134 0.7750 0.6270 3.4928 0.0098
2.5 0.7650 0.2672 9.3024 0.0233 0.7674 0.4610 6.5161 0.0207 0.7664 0.5024 1.6583 0.0186
4.0
1.0 0.7842 0.1036 37.3393 0.0488 0.7761 0.1511 25.3445 0.0396 0.7741 0.2633 7.3548 0.0201
1.5 0.7372 0.2275 20.2679 0.0337 0.7740 0.2689 13.6198 0.0174 0.7690 0.4226 4.3135 0.0161
2.0 0.7736 0.2991 13.9538 0.0229 0.7777 0.3628 8.1938 0.0124 0.7755 0.6394 3.2395 0.0154
2.5 0.7681 0.3434 9.4121 0.0172 0.7721 0.5150 6.2224 0.0137 0.7691 0.6122 1.9240 0.0151
4.5
1.0 0.7676 0.1421 35.8341 0.0327 0.7778 0.1642 23.1789 0.0263 0.7735 0.3655 8.1634 0.0179
1.5 0.7514 0.2511 18.6430 0.0274 0.7785 0.3029 12.5537 0.0182 0.7742 0.4077 3.8683 0.0198
2.0 0.7725 0.3430 12.8081 0.0149 0.7747 0.5177 8.3262 0.0135 0.7731 0.9399 3.5154 0.0081
2.5 0.7769 0.3286 8.2796 0.0374 0.7778 0.5001 5.4879 0.0229 0.7719 0.8265 1.9700 0.0161
5.0
1.0 0.7684 0.1333 31.8451 0.0215 0.7707 0.1895 21.1060 0.0228 0.7726 0.3934 7.4078 0.0165
1.5 0.7663 0.2388 16.6028 0.0346 0.7787 0.3699 11.7705 0.0282 0.7734 0.5524 4.0426 0.0265
2.0 0.7738 0.3842 11.5185 0.0197 0.7760 0.6362 7.9314 0.0128 0.7766 0.9964 3.1874 0.0111
2.5 0.7760 0.4469 7.8559 0.0376 0.7781 0.7477 5.7427 0.0244 0.7741 1.3326 2.2930 0.0140
5.5
1.0 0.7728 0.1685 23.3910 0.0241 0.7778 0.2573 16.3895 0.0177 0.7805 0.4119 6.6905 0.0132
1.5 0.7653 0.2622 15.1211 0.0314 0.7796 0.3908 10.7495 0.0246 0.7760 0.5706 3.6802 0.0182
2.0 0.7758 0.4389 10.6465 0.0197 0.7789 0.6918 7.4590 0.0133 0.7789 1.0426 3.0394 0.0113
2.5 0.7766 0.4620 6.8678 0.0348 0.7781 0.7372 4.8564 0.0219 0.7747 1.6294 2.1579 0.0108
6.0
1.0 0.7712 0.1714 20.4299 0.0292 0.7770 0.2787 15.1313 0.0293 0.7799 0.3437 5.3026 0.0220
1.5 0.7794 0.2655 13.6580 0.0386 0.7838 0.3612 9.0045 0.0311 0.7797 0.7193 3.6158 0.0179
2.0 0.7752 0.4145 9.0018 0.0212 0.7822 0.5754 6.4602 0.0276 0.7809 1.0543 2.7373 0.0094
2.5 0.7789 0.4613 6.1907 0.0340 0.7808 0.7456 4.5786 0.0253 0.7791 1.0783 1.5950 0.0222
7.0
1.0 0.7900 0.1474 23.7431 0.0436 0.7843 0.2203 15.8040 0.0402 0.7761 0.3847 5.0100 0.0218
1.5 0.7688 0.3284 12.7610 0.0390 0.7763 0.5149 9.1335 0.0281 0.7785 0.9130 3.5492 0.0179
2.0 0.7706 0.4898 8.4855 0.0221 0.7757 0.7977 6.0956 0.0140 0.7795 1.3953 2.6729 0.0123
2.5 0.7687 0.7796 6.4003 0.0251 0.7752 1.0518 4.5416 0.0109 0.7782 1.6413 1.7104 0.0102
Page 41
Color variation characteristic of Maillard reaction
- 29 -
Table 2-2 (g) The fitted parameters (Ep. 1) at -0.5°C
Reactant concentration Red Green Blue
Xylose Glycine Na2HPO4 Δ𝐶v rmax Tinf RMSE Δ𝐶v rmax Tinf RMSE Δ𝐶v rmax Tinf RMSE
1.0
1.0
0.1
- - - - 0.7392 0.0026 1655.2064 0.0326 0.7419 0.0039 1459.4316 0.0228
1.5 0.3592 0.0081 961.8010 0.0572 0.7705 0.0037 1346.3460 0.0250 0.7449 0.0047 1212.9709 0.0244
2.0 0.4157 0.0046 1004.3440 0.0750 0.7783 0.0037 1211.0310 0.0166 0.7475 0.0052 1083.7617 0.0213
2.5 0.5812 0.0007 2456.7278 0.0803 0.7783 0.0046 1167.2549 0.0208 0.7476 0.0052 1016.9311 0.0248
2.0
1.0 0.5148 0.0071 770.7880 0.0653 0.7782 0.0040 1056.6729 0.0195 0.7592 0.0058 1023.9014 0.0202
1.5 0.6075 0.0056 713.1825 0.0586 0.7779 0.0051 826.5693 0.0155 0.7630 0.0066 825.3724 0.0230
2.0 0.6413 0.0031 870.2162 0.0740 0.7809 0.0060 797.1388 0.0140 0.7659 0.0075 759.9427 0.0168
2.5 0.6835 0.0021 935.2231 0.0633 0.7763 0.0064 719.3604 0.0155 0.7617 0.0081 683.4994 0.0183
3.0
1.0 0.5513 0.0062 789.1774 0.0965 0.7734 0.0055 950.1073 0.0259 0.7602 0.0065 892.1836 0.0159
1.5 0.6454 0.0042 758.2549 0.0794 0.7726 0.0068 743.8173 0.0182 0.7623 0.0071 693.3189 0.0162
2.0 0.7233 0.0015 1382.8346 0.0718 0.7770 0.0085 749.6274 0.0202 0.7640 0.0090 680.3029 0.0150
2.5 0.7203 0.0020 1076.5511 0.0641 0.7710 0.0091 661.0585 0.0169 0.7600 0.0089 585.6176 0.0157
4.0
1.0 0.7442 0.0007 1768.0857 0.0807 0.7737 0.0048 878.1335 0.0226 0.7617 0.0060 783.0564 0.0178
1.5 0.7155 0.0014 1028.7645 0.0693 0.7714 0.0066 684.7836 0.0166 0.7631 0.0068 611.3392 0.0204
2.0 0.7486 0.0015 1309.8071 0.0534 0.7761 0.0080 682.7859 0.0180 0.7657 0.0081 587.4677 0.0188
2.5 0.7418 0.0021 1107.3577 0.0527 0.7720 0.0094 620.0676 0.0178 0.7634 0.0071 485.3251 0.0197
5.0
1.0 0.7581 0.0008 1504.6855 0.0714 0.7774 0.0041 766.9958 0.0256 0.7651 0.0067 711.4972 0.0251
1.5 0.7366 0.0016 919.3566 0.0638 0.7763 0.0069 627.6151 0.0187 0.7708 0.0073 540.6994 0.0200
2.0 0.7532 0.0019 1060.7746 0.0517 0.7762 0.0084 615.7007 0.0189 0.7698 0.0083 510.2157 0.0207
2.5 0.7519 0.0024 987.5387 0.0465 0.7746 0.0097 575.8152 0.0192 0.7680 0.0086 442.0474 0.0169
6.0
1.0 0.7468 0.0010 1328.3472 0.0738 0.7748 0.0058 756.8342 0.0200 0.7709 0.0062 616.8350 0.0162
1.5 0.7425 0.0019 944.1416 0.0634 0.7765 0.0079 619.3243 0.0163 0.7751 0.0083 515.2152 0.0119
2.0 0.7522 0.0025 960.5269 0.0518 0.7752 0.0099 584.2426 0.0147 0.7724 0.0103 471.4537 0.0105
2.5 0.7542 0.0032 908.1526 0.0476 0.7755 0.0112 556.7644 0.0172 0.7735 0.0103 421.7765 0.0101
Page 42
Color variation characteristic of Maillard reaction
- 30 -
Table 2-2 (h) The fitted parameters (Ep. 1) at fast reaction of 0°C
Reactant concentration Red Green Blue
Xylose Glycine Na2HPO4 Δ𝐶v rmax Tinf RMSE Δ𝐶v rmax Tinf RMSE Δ𝐶v rmax Tinf RMSE
1.0
1.0
0.2 0.4634 0.0040 866.9949 0.0196 0.6438 0.0034 1132.1817 0.0154 0.7614 0.0038 1081.8533 0.0141
0.3 0.5326 0.0043 684.3034 0.0192 0.6833 0.0034 889.4234 0.0157 0.7772 0.0035 802.0874 0.0149
0.4 0.5378 0.0035 582.9577 0.0181 0.6927 0.0031 791.7180 0.0153 0.7745 0.0035 698.1458 0.0137
1.5
0.2 0.5707 0.0051 538.7579 0.0196 0.7095 0.0040 702.7796 0.0149 0.7710 0.0038 657.1471 0.0133
0.3 0.5759 0.0055 493.7328 0.0205 0.7259 0.0036 610.3937 0.0179 0.7675 0.0043 576.1694 0.0148
0.4 0.6022 0.0053 453.9569 0.0188 0.7352 0.0041 566.0574 0.0152 0.7753 0.0043 495.5155 0.0146
2.0
0.2 0.5929 0.0059 475.7623 0.0225 0.7353 0.0043 593.5710 0.0161 0.7669 0.0047 572.0363 0.0130
0.3 0.6018 0.0076 534.8237 0.0180 0.7464 0.0057 634.3520 0.0168 0.7724 0.0058 563.1273 0.0132
0.4 0.6467 0.0070 501.0574 0.0230 0.7698 0.0056 559.3273 0.0200 0.7820 0.0061 485.4049 0.0167
1.5
1.0
0.2 0.6076 0.0056 645.9290 0.0195 0.7353 0.0040 808.5274 0.0178 0.7771 0.0045 787.6146 0.0171
0.3 0.6156 0.0064 600.7011 0.0196 0.7336 0.0053 776.6590 0.0187 0.7743 0.0054 718.9052 0.0168
0.4 0.6506 0.0064 517.9504 0.0182 0.7479 0.0053 648.0126 0.0162 0.7793 0.0048 555.4647 0.0153
1.5
0.2 0.6476 0.0081 487.7281 0.0201 0.7524 0.0049 550.8597 0.0211 0.7674 0.0054 552.2985 0.0179
0.3 0.6696 0.0084 442.7378 0.0190 0.7629 0.0050 476.5228 0.0232 0.7740 0.0055 464.3010 0.0181
0.4 0.6732 0.0090 405.5330 0.0192 0.7583 0.0053 431.4832 0.0216 0.7650 0.0068 434.7460 0.0173
2.0
0.2 0.6705 0.0085 414.8358 0.0187 0.7651 0.0053 441.5004 0.0215 0.7723 0.0059 446.3259 0.0168
0.3 0.7074 0.0099 383.9335 0.0163 0.7742 0.0073 427.7799 0.0168 0.7785 0.0084 428.1144 0.0158
0.4 0.7244 0.0090 357.1561 0.0206 0.7815 0.0085 425.1354 0.0175 0.7861 0.0075 371.3537 0.0196
2.0
1.0
0.2 0.6391 0.0068 577.0308 0.0228 0.7415 0.0059 733.2820 0.0221 0.7713 0.0060 700.5174 0.0181
0.3 0.6619 0.0087 527.0500 0.0175 0.7534 0.0058 625.2491 0.0145 0.7765 0.0066 608.8025 0.0128
0.4 0.6745 0.0071 413.5848 0.0177 0.7549 0.0054 521.7036 0.0134 0.7780 0.0062 514.8500 0.0110
1.5
0.2 0.7013 0.0080 339.3014 0.0174 0.7722 0.0060 412.5409 0.0135 0.7872 0.0053 381.6601 0.0148
0.3 0.6967 0.0093 336.9961 0.0190 0.7709 0.0062 396.8703 0.0151 0.7805 0.0065 399.3849 0.0128
0.4 0.7313 0.0099 285.2890 0.0147 0.7812 0.0059 287.2349 0.0152 0.7889 0.0054 253.0047 0.0165
2.0
0.2 0.7026 0.0087 318.9290 0.0136 0.7764 0.0063 367.2964 0.0133 0.7836 0.0054 321.6730 0.0141
0.3 0.7270 0.0121 317.5727 0.0121 0.7785 0.0089 357.5872 0.0137 0.7822 0.0084 341.9841 0.0108
0.4 0.7469 0.0146 302.7532 0.0133 0.7839 0.0104 329.2602 0.0136 0.7855 0.0113 325.4385 0.0118
2.5
1.0
0.2 0.6331 0.0081 535.8071 0.0214 0.7450 0.0064 682.9248 0.0198 0.7682 0.0069 660.2187 0.0178
0.3 0.7013 0.0075 349.3218 0.0199 0.7636 0.0058 456.6406 0.0168 0.7817 0.0052 425.4764 0.0192
0.4 0.7028 0.0089 375.2098 0.0201 0.7638 0.0063 456.2721 0.0188 0.7786 0.0060 417.8602 0.0173
1.5
0.2 0.6877 0.0090 350.4145 0.0188 0.7661 0.0054 383.7610 0.0188 0.7731 0.0057 389.9034 0.0171
0.3 0.7136 0.0101 273.3493 0.0206 0.7693 0.0061 296.2431 0.0187 0.7711 0.0058 281.8035 0.0183
0.4 0.7201 0.0121 270.9616 0.0168 0.7666 0.0076 302.1722 0.0182 0.7698 0.0068 271.2079 0.0153
2.0
0.2 0.6988 0.0097 301.5605 0.0157 0.7734 0.0069 340.2633 0.0162 0.7745 0.0072 340.4388 0.0139
0.3 0.7336 0.0138 282.7717 0.0147 0.7748 0.0106 323.6261 0.0149 0.7775 0.0099 314.1579 0.0138
0.4 0.7537 0.0148 255.6587 0.0183 0.7808 0.0129 296.2761 0.0144 0.7818 0.0121 286.0655 0.0130
Page 43
Color variation characteristic of Maillard reaction
- 31 -
Table 2-2 (i) The fitted parameters (Ep. 1) at fast reaction of 5°C
Reactant concentration Red Green Blue
Xylose Glycine Na2HPO4 Δ𝐶v rmax Tinf RMSE Δ𝐶v rmax Tinf RMSE Δ𝐶v rmax Tinf RMSE
1.0
1.0
0.2 0.4941 0.0127 243.0964 0.0235 0.6819 0.0060 329.9472 0.0232 0.7607 0.0068 335.1708 0.0168
0.3 0.5314 0.0111 217.1586 0.0224 0.7100 0.0064 305.2161 0.0223 0.7671 0.0068 273.3710 0.0179
0.4 0.5286 0.0102 205.6395 0.0280 0.7254 0.0054 270.4912 0.0251 0.7651 0.0088 278.0963 0.0189
1.5
0.2 0.6242 0.0128 211.5125 0.0182 0.7552 0.0102 261.3598 0.0156 0.7823 0.0116 260.3671 0.0134
0.3 0.6508 0.0112 182.9002 0.0197 0.7684 0.0108 246.3681 0.0146 0.7844 0.0131 243.5026 0.0147
0.4 0.6481 0.0099 186.6289 0.0214 0.7654 0.0115 256.7826 0.0167 0.7782 0.0125 228.3292 0.0194
2.0
0.2 0.6099 0.0109 170.9390 0.0230 0.7530 0.0101 232.1800 0.0173 0.7709 0.0107 216.4497 0.0148
0.3 0.6629 0.0093 131.5546 0.0203 0.7686 0.0106 196.5043 0.0162 0.7744 0.0118 182.2135 0.0170
0.4 0.6775 0.0111 147.2109 0.0247 0.7779 0.0084 151.7965 0.0213 0.7786 0.0114 154.0142 0.0180
1.5
1.0
0.2 0.5985 0.0180 198.2604 0.0241 0.7419 0.0111 267.9100 0.0238 0.7710 0.0103 243.2826 0.0165
0.3 0.6364 0.0201 191.0109 0.0240 0.7517 0.0110 226.0983 0.0218 0.7682 0.0121 215.8257 0.0170
0.4 0.6261 0.0202 194.0911 0.0252 0.7490 0.0105 218.5819 0.0246 0.7632 0.0115 202.3933 0.0211
1.5
0.2 0.6461 0.0170 163.3540 0.0238 0.7649 0.0115 201.3174 0.0195 0.7736 0.0121 193.3095 0.0161
0.3 0.6831 0.0175 148.2311 0.0177 0.7707 0.0109 168.8395 0.0139 0.7768 0.0131 182.7833 0.0139
0.4 0.6993 0.0170 127.0765 0.0180 0.7730 0.0119 154.9566 0.0121 0.7792 0.0105 119.9339 0.0170
2.0
0.2 0.6595 0.0214 146.7722 0.0251 0.7682 0.0124 156.8831 0.0202 0.7716 0.0133 156.8420 0.0165
0.3 0.7067 0.0282 144.1511 0.0221 0.7659 0.0265 170.5216 0.0218 0.7690 0.0232 154.4378 0.0161
0.4 0.7137 0.0287 134.8982 0.0203 0.7608 0.0228 145.0785 0.0170 0.7633 0.0237 138.6131 0.0156
2.0
1.0
0.2 0.6253 0.0246 183.3830 0.0286 0.7475 0.0121 207.7657 0.0231 0.7653 0.0115 198.2910 0.0169
0.3 0.6569 0.0177 144.0808 0.0228 0.7649 0.0088 160.7099 0.0193 0.7717 0.0123 188.6412 0.0158
0.4 0.6860 0.0200 142.9688 0.0223 0.7665 0.0145 181.8280 0.0195 0.7745 0.0160 181.5255 0.0163
1.5
0.2 0.6703 0.0195 145.4334 0.0186 0.7677 0.0124 165.2933 0.0142 0.7755 0.0109 150.4541 0.0194
0.3 0.7045 0.0231 119.6138 0.0199 0.7717 0.0138 132.5913 0.0162 0.7759 0.0124 123.1392 0.0167
0.4 0.7272 0.0216 110.3619 0.0159 0.7707 0.0164 128.2957 0.0145 0.7731 0.0175 127.9853 0.0130
2.0
0.2 0.6875 0.0201 128.9213 0.0262 0.7603 0.0184 147.5784 0.0178 0.7610 0.0165 131.5654 0.0176
0.3 0.7131 0.0282 110.2270 0.0184 0.7608 0.0227 122.8579 0.0137 0.7608 0.0209 120.7228 0.0178
0.4 0.7371 0.0330 105.7903 0.0157 0.7649 0.0240 107.1808 0.0117 0.7663 0.0223 98.8728 0.0134
2.5
1.0
0.2 0.6579 0.0245 162.6130 0.0221 0.7681 0.0118 181.8285 0.0195 0.7757 0.0134 191.0768 0.0151
0.3 0.7073 0.0219 122.7375 0.0193 0.7764 0.0148 155.9945 0.0175 0.7837 0.0162 166.8684 0.0165
0.4 0.7217 0.0243 113.8374 0.0173 0.7754 0.0144 123.9649 0.0187 0.7853 0.0136 110.0284 0.0163
1.5
0.2 0.7007 0.0267 130.8986 0.0198 0.7719 0.0176 143.3444 0.0151 0.7803 0.0122 108.7594 0.0146
0.3 0.7231 0.0237 101.2667 0.0190 0.7761 0.0169 122.0662 0.0161 0.7828 0.0140 109.3071 0.0142
0.4 0.7466 0.0342 104.6469 0.0153 0.7761 0.0200 102.9129 0.0122 0.7705 0.0194 116.3832 0.0130
2.0
0.2 0.7166 0.0238 110.7068 0.0198 0.7698 0.0184 116.4049 0.0130 0.7784 0.0282 107.7412 0.0115
0.3 0.7441 0.0331 90.4569 0.0153 0.7744 0.0293 105.8400 0.0107 0.7818 0.0289 79.9418 0.0092
0.4 0.7580 0.0354 72.8238 0.0146 0.7738 0.0292 80.8831 0.0108 0.7607 0.0068 335.1708 0.0168
Page 44
Color variation characteristic of Maillard reaction
- 32 -
Table 2-2 (j) The fitted parameters (Ep. 1) at fast reaction of 10°C
Reactant concentration Red Green Blue
Xylose Glycine Na2HPO4 Δ𝐶v rmax Tinf RMSE Δ𝐶v rmax Tinf RMSE Δ𝐶v rmax Tinf RMSE
1.0
1.0
0.2 0.6084 0.0181 123.8143 0.0161 0.7306 0.0115 141.4427 0.0148 0.7917 0.0100 125.7707 0.0204
0.3 0.6282 0.0213 121.8804 0.0169 0.7409 0.0157 148.7797 0.0188 0.7767 0.0156 131.7251 0.0131
0.4 0.6031 0.0247 137.7211 0.0203 0.7450 0.0136 150.6331 0.0197 0.7799 0.0156 136.1829 0.0154
1.5
0.2 0.6655 0.0228 109.9505 0.0119 0.7640 0.0180 125.1263 0.0145 0.7859 0.0172 112.8593 0.0116
0.3 0.6766 0.0247 108.5113 0.0119 0.7664 0.0197 122.7213 0.0146 0.7810 0.0208 115.3214 0.0107
0.4 0.6972 0.0286 111.3824 0.0185 0.7759 0.0239 120.4338 0.0175 0.7851 0.0223 99.1215 0.0123
2.0
0.2 0.6699 0.0227 97.6774 0.0180 0.7634 0.0189 110.0923 0.0168 0.7758 0.0178 94.0895 0.0153
0.3 0.7112 0.0299 98.8558 0.0201 0.7775 0.0230 99.3256 0.0190 0.7808 0.0232 88.5914 0.0147
0.4 0.7242 0.0319 101.9608 0.0227 0.7763 0.0263 97.6248 0.0166 0.7791 0.0267 83.8348 0.0136
1.5
1.0
0.2 0.6356 0.0239 120.9017 0.0209 0.7501 0.0194 157.5346 0.0217 0.7709 0.0218 152.1555 0.0191
0.3 0.6568 0.0319 111.6022 0.0177 0.7519 0.0186 119.6693 0.0234 0.7626 0.0224 118.3662 0.0178
0.4 0.6895 0.0324 106.6224 0.0197 0.7607 0.0273 126.3429 0.0205 0.7745 0.0223 102.0896 0.0158
1.5
0.2 0.6963 0.0336 97.6722 0.0159 0.7705 0.0294 114.6458 0.0164 0.7775 0.0347 116.9632 0.0123
0.3 0.7323 0.0456 88.0419 0.0145 0.7781 0.0294 87.9000 0.0160 0.7847 0.0290 82.2515 0.0125
0.4 0.7349 0.0462 84.8860 0.0158 0.7713 0.0359 89.2236 0.0136 0.7786 0.0302 74.2815 0.0118
2.0
0.2 0.7220 0.0386 87.4981 0.0144 0.7739 0.0278 85.7088 0.0175 0.7765 0.0314 88.2961 0.0148
0.3 0.7255 0.0478 76.8529 0.0165 0.7608 0.0373 80.0740 0.0172 0.7629 0.0359 75.5560 0.0173
0.4 0.7465 0.0514 71.9975 0.0150 0.7702 0.0407 72.4891 0.0148 0.7740 0.0431 72.5083 0.0122
2.0
1.0
0.2 0.6711 0.0325 92.9121 0.0135 0.7578 0.0182 98.2849 0.0187 0.7700 0.0208 105.8627 0.0170
0.3 0.6998 0.0357 85.1290 0.0156 0.7664 0.0221 91.9033 0.0195 0.7715 0.0256 93.3844 0.0158
0.4 0.7191 0.0419 87.0842 0.0175 0.7676 0.0306 97.3367 0.0176 0.7761 0.0265 84.5226 0.0161
1.5
0.2 0.7234 0.0387 80.2599 0.0124 0.7764 0.0311 86.5872 0.0135 0.7813 0.0306 83.3303 0.0112
0.3 0.7458 0.0549 73.7779 0.0131 0.7756 0.0410 76.8872 0.0124 0.7793 0.0382 75.0732 0.0118
0.4 0.7594 0.0557 69.7021 0.0135 0.7808 0.0432 71.8458 0.0129 0.7848 0.0329 59.0094 0.0158
2.0
0.2 0.7231 0.0412 71.9177 0.0168 0.7672 0.0338 73.9054 0.0168 0.7698 0.0324 70.0965 0.0157
0.3 0.7538 0.0617 65.7329 0.0144 0.7738 0.0476 66.4874 0.0126 0.7759 0.0510 68.7772 0.0119
0.4 0.7557 0.0647 58.0373 0.0121 0.7685 0.0622 64.9764 0.0109 0.7727 0.0522 60.3601 0.0121
2.5
1.0
0.2 0.6901 0.0326 86.5614 0.0167 0.7669 0.0268 107.1372 0.0193 0.7776 0.0247 100.9958 0.0173
0.3 0.7327 0.0448 76.5861 0.0168 0.7791 0.0315 85.3688 0.0219 0.7860 0.0305 83.3346 0.0180
0.4 0.7406 0.0500 72.4114 0.0151 0.7776 0.0301 73.0325 0.0180 0.7854 0.0297 67.8700 0.0159
1.5
0.2 0.7326 0.0412 72.2618 0.0178 0.7771 0.0376 83.3487 0.0143 0.7797 0.0438 89.0612 0.0120
0.3 0.7590 0.0657 63.7741 0.0142 0.7810 0.0402 59.8712 0.0192 0.7849 0.0432 66.2639 0.0151
0.4 0.7651 0.0714 59.8533 0.0128 0.7786 0.0528 61.3727 0.0136 0.7866 0.0460 58.4489 0.0142
2.0
0.2 0.7497 0.0506 70.1632 0.0179 0.7780 0.0521 74.8254 0.0109 0.7805 0.0471 71.6491 0.0120
0.3 0.7706 0.0566 55.4944 0.0197 0.7794 0.0691 63.0505 0.0123 0.7851 0.0558 59.0827 0.0112
0.4 0.7744 0.0715 48.8218 0.0114 0.7810 0.0525 48.7635 0.0139 0.7887 0.0573 52.5929 0.0096
Page 45
Color variation characteristic of Maillard reaction
- 33 -
Table 2-2 (k) The fitted parameters (Ep. 1) at fast reaction of 15°C
Reactant concentration Red Green Blue
Xylose Glycine Na2HPO4 Δ𝐶v rmax Tinf RMSE Δ𝐶v rmax Tinf RMSE Δ𝐶v rmax Tinf RMSE
1.0
1.0
0.2 0.6294 0.0237 61.6370 0.0231 0.7508 0.0222 78.9779 0.0166 0.7673 0.0314 79.3556 0.0128
0.3 0.6840 0.0287 68.1534 0.0280 0.7699 0.0232 64.8973 0.0157 0.7767 0.0244 46.1884 0.0141
0.4 0.7129 0.0300 70.3867 0.0257 0.7718 0.0297 66.2046 0.0144 0.7754 0.0348 55.5759 0.0132
1.5
0.2 0.7069 0.0353 56.5745 0.0239 0.7806 0.0296 54.7544 0.0164 0.7847 0.0344 52.5073 0.0145
0.3 0.7379 0.0416 56.1547 0.0233 0.7751 0.0452 58.0558 0.0142 0.7789 0.0416 45.5154 0.0134
0.4 0.7501 0.0509 60.3123 0.0229 0.7795 0.0470 54.8370 0.0177 0.7800 0.0545 47.2951 0.0120
2.0
0.2 0.7208 0.0327 48.4930 0.0245 0.7672 0.0368 49.4615 0.0192 0.7682 0.0417 45.6197 0.0159
0.3 0.7523 0.0450 45.2980 0.0219 0.7735 0.0513 45.6493 0.0161 0.7762 0.0443 33.8320 0.0154
0.4 0.7559 0.0643 47.7282 0.0173 0.7705 0.0561 40.2560 0.0164 0.7726 0.0611 35.1134 0.0118
1.5
1.0
0.2 0.7084 0.0429 66.1029 0.0284 0.7744 0.0362 69.6424 0.0187 0.7809 0.0329 52.7200 0.0199
0.3 0.7238 0.0427 59.8497 0.0236 0.7661 0.0470 66.1754 0.0166 0.7683 0.0464 55.5712 0.0151
0.4 0.7412 0.0517 53.9244 0.0233 0.7692 0.0543 58.3569 0.0160 0.7732 0.0511 47.3864 0.0147
1.5
0.2 0.7312 0.0592 54.3028 0.0206 0.7747 0.0614 58.8837 0.0122 0.7777 0.0569 51.4011 0.0117
0.3 0.7566 0.0716 44.2248 0.0163 0.7801 0.0575 41.3392 0.0156 0.7847 0.0489 33.0607 0.0166
0.4 0.7573 0.0739 41.3691 0.0141 0.7740 0.0762 44.4173 0.0097 0.7781 0.0650 34.1184 0.0125
2.0
0.2 0.7502 0.0517 45.2520 0.0182 0.7765 0.0583 47.3502 0.0128 0.7785 0.0531 40.1982 0.0163
0.3 0.7545 0.0814 34.8145 0.0173 0.7667 0.0644 29.6439 0.0242 0.7704 0.0702 29.5591 0.0199
0.4 0.7592 0.0903 32.9221 0.0165 0.7681 0.0962 35.1267 0.0146 0.7707 0.0728 25.6120 0.0188
2.0
1.0
0.2 0.7252 0.0481 43.4765 0.0239 0.7683 0.0474 50.6022 0.0163 0.7725 0.0444 44.6858 0.0142
0.3 0.7485 0.0669 43.8183 0.0206 0.7732 0.0516 42.1750 0.0142 0.7770 0.0457 34.8340 0.0157
0.4 0.7582 0.0682 40.2188 0.0165 0.7770 0.0671 45.0609 0.0109 0.7800 0.0594 36.1677 0.0114
1.5
0.2 0.7496 0.0606 34.0604 0.0205 0.7763 0.0625 37.6352 0.0143 0.7799 0.0520 32.1028 0.0143
0.3 0.7552 0.0866 33.8481 0.0140 0.7701 0.0650 30.3270 0.0179 0.7743 0.0705 31.1463 0.0134
0.4 0.7649 0.0949 30.3283 0.0159 0.7764 0.0919 34.0425 0.0127 0.7782 0.0728 25.7030 0.0172
2.0
0.2 0.7441 0.0893 35.2964 0.0197 0.7638 0.0676 30.5397 0.0211 0.7653 0.0734 32.0622 0.0188
0.3 0.7582 0.1018 27.5582 0.0168 0.7672 0.0796 21.2227 0.0206 0.7692 0.0835 21.7597 0.0169
0.4 0.7605 0.0878 23.3940 0.0198 0.7669 0.1102 25.6869 0.0154 0.7702 0.0808 17.6074 0.0207
2.5
1.0
0.2 0.7536 0.0695 41.8462 0.0211 0.7805 0.0655 46.9640 0.0140 0.7858 0.0580 41.5936 0.0128
0.3 0.7663 0.0777 32.1052 0.0179 0.7823 0.0718 36.5769 0.0147 0.7877 0.0581 31.1796 0.0139
0.4 0.7684 0.0894 33.4583 0.0136 0.7818 0.0647 31.4380 0.0144 0.7881 0.0732 31.8500 0.0114
1.5
0.2 0.7600 0.0904 32.1121 0.0184 0.7783 0.0879 35.3157 0.0137 0.7835 0.0700 31.3384 0.0156
0.3 0.7695 0.0965 27.3073 0.0140 0.7797 0.0936 31.8775 0.0107 0.7848 0.0758 25.2047 0.0147
0.4 0.7687 0.0790 23.6567 0.0237 0.7726 0.0932 20.0992 0.0214 0.7808 0.0983 21.2551 0.0137
2.0
0.2 0.7667 0.0780 29.2041 0.0150 0.7772 0.0936 29.3733 0.0119 0.7812 0.0757 22.6387 0.0173
0.3 0.7705 0.1343 19.3433 0.0183 0.7775 0.1247 21.9314 0.0164 0.7831 0.0916 16.6915 0.0180
0.4 0.7673 0.1409 16.5749 0.0187 0.7743 0.1205 19.8304 0.0159 0.7822 0.0854 11.6480 0.0168
Page 46
Color variation characteristic of Maillard reaction
- 34 -
Table 2-2 (l) The fitted parameters (Ep. 1) at fast reaction of 20°C
Reactant concentration Red Green Blue
Xylose Glycine Na2HPO4 Δ𝐶v rmax Tinf RMSE Δ𝐶v rmax Tinf RMSE Δ𝐶v rmax Tinf RMSE
1.0
1.0
0.2 0.7138 0.0569 49.3226 0.0235 0.7767 0.0549 54.1167 0.0154 0.7821 0.0559 47.0276 0.0082
0.3 0.7420 0.0699 45.6177 0.0184 0.7823 0.0676 48.3236 0.0133 0.7855 0.0673 40.7550 0.0068
0.4 0.7609 0.0711 39.0126 0.0170 0.7868 0.0702 40.6675 0.0115 0.7875 0.0695 32.7911 0.0061
1.5
0.2 0.7551 0.0827 41.1864 0.0189 0.7811 0.0862 42.8141 0.0115 0.7782 0.0884 39.3676 0.0066
0.3 0.7679 0.1075 36.0083 0.0130 0.7790 0.1071 36.7197 0.0088 0.7748 0.1027 32.1613 0.0065
0.4 0.7735 0.1225 33.0516 0.0103 0.7804 0.1204 33.4635 0.0075 0.7780 0.1030 27.1862 0.0092
2.0
0.2 0.7640 0.1000 34.7045 0.0166 0.7765 0.1051 35.3003 0.0101 0.7733 0.0994 31.5549 0.0084
0.3 0.7752 0.1271 31.5223 0.0098 0.7793 0.1223 31.4287 0.0086 0.7781 0.1131 27.7553 0.0074
0.4 0.7842 0.1538 27.1724 0.0058 0.7861 0.1490 27.3138 0.0062 0.7860 0.1233 22.3158 0.0078
1.5
1.0
0.2 0.7643 0.0686 37.4153 0.0178 0.7771 0.0760 42.4518 0.0081 0.7785 0.0676 35.1961 0.0079
0.3 0.7700 0.0908 35.0618 0.0108 0.7765 0.0884 37.4505 0.0073 0.7763 0.0853 32.4795 0.0072
0.4 0.7620 0.1042 32.4525 0.0104 0.7663 0.1051 34.9767 0.0109 0.7638 0.0964 28.9300 0.0126
1.5
0.2 0.7574 0.1013 33.2306 0.0190 0.7845 0.0964 35.0861 0.0132 0.7838 0.1021 33.3339 0.0088
0.3 0.7623 0.1293 30.4966 0.0153 0.7762 0.1332 33.0295 0.0107 0.7748 0.1159 29.1045 0.0058
0.4 0.7569 0.1521 28.3631 0.0107 0.7659 0.1417 29.5910 0.0075 0.7669 0.1268 25.5381 0.0051
2.0
0.2 0.7714 0.1130 30.6265 0.0159 0.7852 0.1326 32.8609 0.0109 0.7844 0.1198 29.8328 0.0077
0.3 0.7781 0.1627 27.2236 0.0124 0.7846 0.1586 28.3180 0.0075 0.7817 0.1394 25.5040 0.0052
0.4 0.7785 0.2000 24.2952 0.0085 0.7812 0.1885 25.2397 0.0063 0.7794 0.1634 22.2552 0.0065
2.0
1.0
0.2 0.7645 0.0890 36.8189 0.0164 0.7724 0.0892 39.0592 0.0096 0.7708 0.0841 35.0284 0.0088
0.3 0.7671 0.1280 31.0215 0.0114 0.7709 0.1111 32.1702 0.0115 0.7710 0.0976 27.1722 0.0119
0.4 0.7731 0.1398 30.4780 0.0083 0.7751 0.1294 32.0800 0.0079 0.7741 0.1414 30.3930 0.0071
1.5
0.2 0.7483 0.1328 29.5683 0.0155 0.7668 0.1312 31.5187 0.0101 0.7653 0.1161 28.9043 0.0059
0.3 0.7695 0.1611 24.7549 0.0103 0.7787 0.1446 26.0720 0.0069 0.7785 0.1269 23.0798 0.0054
0.4 0.7636 0.1913 22.7034 0.0058 0.7681 0.1706 23.8186 0.0048 0.7708 0.1477 20.6621 0.0048
2.0
0.2 0.7731 0.1583 25.3098 0.0137 0.7814 0.1658 26.4207 0.0097 0.7801 0.1275 22.7654 0.0117
0.3 0.7784 0.2142 22.0585 0.0099 0.7815 0.1998 22.9183 0.0084 0.7801 0.1553 20.1688 0.0078
0.4 0.7816 0.2352 19.6608 0.0067 0.7831 0.2125 20.4982 0.0064 0.7826 0.1819 18.2973 0.0062
2.5
1.0
0.2 0.7757 0.1178 31.0509 0.0100 0.7802 0.1101 32.8568 0.0069 0.7803 0.0955 29.7047 0.0059
0.3 0.7829 0.1485 26.2011 0.0048 0.7841 0.1371 28.1140 0.0050 0.7844 0.1222 25.2955 0.0054
0.4 0.7844 0.1614 23.6508 0.0053 0.7850 0.1426 25.0288 0.0057 0.7858 0.1255 21.3360 0.0067
1.5
0.2 0.7702 0.1399 21.3869 0.0099 0.7809 0.1352 23.2740 0.0063 0.7835 0.1050 19.5901 0.0064
0.3 0.7803 0.1874 19.9068 0.0061 0.7829 0.1717 21.2495 0.0052 0.7829 0.1464 19.1840 0.0047
0.4 0.7845 0.2012 17.8665 0.0099 0.7859 0.1874 19.3157 0.0089 0.7877 0.1552 16.3200 0.0091
2.0
0.2 0.7792 0.1867 20.7033 0.0106 0.7849 0.1745 21.4201 0.0076 0.7838 0.1528 19.7337 0.0077
0.3 0.7852 0.2565 18.0193 0.0053 0.7866 0.2189 18.5993 0.0050 0.7867 0.1802 16.4933 0.0060
0.4 0.7661 0.2158 13.9151 0.0191 0.7673 0.2119 15.1743 0.0166 0.7727 0.1779 12.2998 0.0152
Page 47
Color variation characteristic of Maillard reaction
- 35 -
Table 2-2 (m) The fitted parameters (Ep. 1) at fast reaction of 25°C
Reactant concentration Red Green Blue
Xylose Glycine Na2HPO4 Δ𝐶v rmax Tinf RMSE Δ𝐶v rmax Tinf RMSE Δ𝐶v rmax Tinf RMSE
1.0
1.0
0.2 0.7701 0.1048 28.4317 0.0170 0.7830 0.1219 28.7775 0.0070 0.7830 0.1219 24.4785 0.0055
0.3 0.7786 0.1329 25.8446 0.0120 0.7858 0.1451 25.7733 0.0064 0.7847 0.1379 21.3892 0.0071
0.4 0.7842 0.1545 20.7365 0.0075 0.7883 0.1686 21.3222 0.0052 0.7884 0.1516 16.2017 0.0068
1.5
0.2 0.7732 0.1523 22.4158 0.0111 0.7855 0.1668 22.7712 0.0066 0.7884 0.1546 19.3723 0.0076
0.3 0.7798 0.1915 18.9127 0.0053 0.7862 0.2085 19.7393 0.0060 0.7881 0.1710 15.3787 0.0109
0.4 0.7803 0.2191 17.9856 0.0051 0.7851 0.2103 17.8063 0.0072 0.7861 0.1854 13.4785 0.0093
2.0
0.2 0.7726 0.1854 21.1672 0.0087 0.7794 0.2242 21.5680 0.0058 0.7793 0.1824 18.2084 0.0086
0.3 0.7760 0.2452 17.8954 0.0059 0.7788 0.2530 17.9868 0.0073 0.7790 0.2121 14.6997 0.0094
0.4 0.7840 0.2778 16.0822 0.0048 0.7856 0.2793 16.1496 0.0059 0.7861 0.2514 13.0479 0.0070
1.5
1.0
0.2 0.7685 0.1494 21.1231 0.0128 0.7845 0.1507 22.2135 0.0071 0.7855 0.1449 19.2573 0.0077
0.3 0.7646 0.1849 19.5859 0.0103 0.7749 0.1940 20.7328 0.0088 0.7744 0.1861 18.1661 0.0090
0.4 0.7673 0.2046 17.8647 0.0098 0.7763 0.2212 18.8728 0.0102 0.7796 0.1928 15.3012 0.0108
1.5
0.2 0.7526 0.2108 15.3882 0.0091 0.7725 0.2191 16.5304 0.0080 0.7869 0.1836 14.2057 0.0104
0.3 0.7609 0.2733 14.2850 0.0118 0.7728 0.2662 14.7739 0.0127 0.7810 0.2189 12.2027 0.0130
0.4 0.7568 0.3170 14.1695 0.0109 0.7688 0.3094 14.6508 0.0100 0.7733 0.2784 12.3833 0.0078
2.0
0.2 0.7563 0.2666 14.9696 0.0100 0.7731 0.2618 15.1598 0.0122 0.7771 0.2408 13.7216 0.0111
0.3 0.7673 0.3566 13.4248 0.0097 0.7762 0.3454 13.6774 0.0099 0.7773 0.3049 12.1258 0.0094
0.4 0.7672 0.4182 13.1809 0.0104 0.7743 0.4407 13.6931 0.0118 0.7767 0.3290 11.4651 0.0121
2.0
1.0
0.2 0.7636 0.1809 19.6258 0.0119 0.7754 0.1922 20.7968 0.0092 0.7756 0.1678 18.1781 0.0115
0.3 0.7718 0.2179 16.6978 0.0101 0.7779 0.2252 17.9060 0.0085 0.7782 0.1886 15.1164 0.0108
0.4 0.7716 0.2959 15.2743 0.0068 0.7754 0.2738 15.7832 0.0081 0.7760 0.2433 13.4493 0.0087
1.5
0.2 0.7469 0.2755 14.8551 0.0115 0.7701 0.2689 15.4952 0.0110 0.7748 0.2299 13.8731 0.0116
0.3 0.7699 0.3668 13.1658 0.0091 0.7806 0.3428 13.7133 0.0080 0.7805 0.3117 12.3832 0.0057
0.4 0.7769 0.3935 11.0208 0.0059 0.7834 0.3577 11.4132 0.0066 0.7888 0.2995 9.5052 0.0094
2.0
0.2 0.7630 0.3375 13.1048 0.0087 0.7802 0.3354 13.3414 0.0076 0.7803 0.3011 12.1903 0.0070
0.3 0.7741 0.4212 11.2537 0.0060 0.7813 0.3914 11.4136 0.0069 0.7817 0.3440 10.2944 0.0094
0.4 0.7770 0.4849 10.7883 0.0077 0.7816 0.4613 11.1038 0.0080 0.7820 0.3737 9.7126 0.0108
2.5
1.0
0.2 0.7729 0.2288 15.5931 0.0086 0.7798 0.2198 16.5555 0.0082 0.7797 0.2096 15.0919 0.0084
0.3 0.7817 0.2766 13.3088 0.0060 0.7845 0.2544 14.0723 0.0065 0.7853 0.2237 12.0574 0.0075
0.4 0.7800 0.3099 11.7110 0.0060 0.7810 0.2770 12.2371 0.0071 0.7858 0.2282 9.5491 0.0092
1.5
0.2 0.7710 0.3217 11.4520 0.0085 0.7823 0.2813 11.7079 0.0080 0.7875 0.2251 9.9735 0.0115
0.3 0.7802 0.3840 10.1206 0.0058 0.7861 0.3557 10.7152 0.0060 0.7862 0.2958 9.1869 0.0081
0.4 0.7818 0.4690 9.3822 0.0062 0.7840 0.3886 9.4242 0.0094 0.7885 0.3263 7.7654 0.0115
2.0
0.2 0.7735 0.3905 10.8161 0.0073 0.7824 0.3708 11.0090 0.0075 0.7823 0.3286 10.2265 0.0065
0.3 0.7812 0.4952 9.2747 0.0061 0.7841 0.4695 9.7244 0.0075 0.7841 0.3882 8.5471 0.0076
0.4 0.7781 0.5980 8.3360 0.0084 0.7786 0.4990 8.4247 0.0104 0.7821 0.4090 7.0199 0.0123
Page 48
Color variation characteristic of Maillard reaction
- 36 -
2.3.3. Effect of reactant concentration and temperature on color change
The observed color change kinetics was influenced by reactant concentration and
reaction temperature, with representative relationships shown in Fig. 2-7 (a ~ d). At the
Fig. 2-7 (a), (b), (c), (d) compared difference of reaction rate by reaction conditions of
D-xylose, glycine, Na2HPO4, and reaction temperature, respectively. For all conditions,
increasing the substrate concentration and temperature resulted in a faster reaction.
However, the reaction rate did not significantly change at higher concentrations. In
contrast, the reaction rate markedly increased with increasing temperature, with
observable color changes detected even at temperatures as low as 5 and 0 °C. These
results that reaction rate is influenced by temperature and concentration conditions
allowed flexibility about the reaction completion time. The completion times by
reaction shown in the Table 2-3. But the empty space in Table have very long reaction
time of over than 1 years, or unexpressed the threshold values.
The completion times at normal reaction were 236–415, 138–424, 60–415, 29–316,
15–242, and 10–121 days at 5, 10, 15, 20, 25 and 30 °C, respectively. And the
completion times at fast reaction were 8–61, 7–21, 4–14, 2–10, 1–4, and 0.5–2 days at 0,
5, 10, 15, 20 and 25 °C, respectively.
Although a large number of TTIs have been proposed so far, most of the existing
ones are limited by narrow temperature ranges, reaction reliability and stability, safety
of used materials, etc. In particular, a number of applications cannot be realized due to
the fact that most existing TTIs are intended for chilled food distribution. In contrast,
the color variation rate of the Maillard reaction described herein allows the reaction
time to be adjusted from 12 h to 1 years by controlling reaction temperature and reactant
concentrations. Thus, Maillard reaction-based TTIs can potentially not only indicate the
Page 49
Color variation characteristic of Maillard reaction
- 37 -
shelf life of various types of foods, including those stored chilled and at ambient
temperature, but also help to establish optimum ripening times of fruits and/or
vegetables. Furthermore, the harvest time of fruits and/or vegetables during cultivation
periods can also be optimized based on accumulation temperature.
Fig. 2-7 Representative B value variations as a function of reaction time and
concentrations of D-xylose (a), glycine (b), Na2HPO4 (c), and temperature
(d)
Page 50
Color variation characteristic of Maillard reaction
- 38 -
Table 2-3(a) The completion times at normal Maillard reaction
Reactant concentration Completion times (d)
Xylose Glycine 5 10 15 20 25 30
1.0
1.0 242 121
1.5 316 149 87
2.0 415 233 113 71
2.5 331 163 82 55
1.5
1.0 406 189 108
1.5 221 113 73
2.0 307 159 81 50
2.5 226 113 59 39
2.0
1.0 585 310 153 98
1.5 361 170 92 73
2.0 237 120 63 49
2.5 171 84 43 37
2.5
1.0 479 259 138 77
1.5 282 145 76 53
2.0 424 195 99 52 32
2.5 562 310 149 72 36 25
3.0
1.0 439 224 117 72
1.5 521 243 122 64 45
2.0 360 165 85 45 26
2.5 518 274 123 61 30 22
3.5
1.0 374 197 103 63
1.5 450 229 110 56 41
2.0 308 143 73 38 24
2.5 415 247 111 54 26 19
4.0
1.0 356 175 95 58
1.5 391 178 96 38 34
2.0 281 127 65 34 22
2.5 395 218 96 47 23 17
4.5
1.0 320 167 88 53
1.5 354 173 86 41 30
2.0 265 114 60 30 20
2.5 356 183 85 39 21 16
5.0
1.0 277 148 81 50
1.5 315 155 67 37 27
2.0 448 241 106 55 28 18
2.5 303 167 75 36 19 13
5.5
1.0 252 142 72 37
1.5 298 150 73 34 25
2.0 408 112 103 50 25 16
2.5 280 164 73 37 17 12
6.0
1.0 250 131 66 34
1.5 544 284 137 68 33 22
2.0 389 189 93 46 23 15
2.5 273 147 66 33 17 11
7.0
1.0 236 118 48 38
1.5 503 262 122 60 31 20
2.0 419 189 78 41 20 14
2.5 236 138 60 29 15 10
Page 51
Color variation characteristic of Maillard reaction
- 39 -
Table 2-3(b) The completion times at fast Maillard reaction
Reactant concentration Completion times (d)
Xylose Glycine Na2HPO4 0 5 10 15 20 25
1.0
1.0
0.2 11.0 4.3 2.0
0.3 7.5 3.5 1.7
0.4 6.5 3.0 1.4
1.5
0.2 21.0 11.0 5.5 2.9 1.5
0.3 20.0 10.0 5.0 2.4 1.3
0.4 60.0 20.0 9.0 4.5 2.1 1.1
2.0
0.2 61.5 21.0 10.0 5.0 2.4 1.3
0.3 52.5 18.0 8.0 4.0 2.1 1.1
0.4 42.5 16.0 8.0 3.5 1.8 1.0
1.5
1.0
0.2 14.0 5.5 3.1 1.5
0.3 61.0 21.5 12.0 5.0 2.6 1.3
0.4 49.0 24.0 9.0 4.0 2.3 1.2
1.5
0.2 47.0 19.0 8.5 4.0 2.4 1.1
0.3 40.5 14.0 7.0 3.0 2.2 1.0
0.4 34.0 14.0 6.5 3.0 2.0 0.9
2.0
0.2 34.0 14.0 7.0 3.5 2.1 1.0
0.3 30.5 11.5 6.0 2.5 1.8 0.8
0.4 29.0 11.5 5.0 2.5 1.5 0.8
2.0
1.0
0.2 54.0 21.5 9.5 5.0 2.7 1.3
0.3 44.0 19.5 8.0 4.0 2.2 1.1
0.4 41.0 14.0 7.0 3.0 2.0 1.0
1.5
0.2 33.0 14.0 7.0 3.0 2.2 1.0
0.3 30.5 13.0 5.0 2.5 1.7 0.8
0.4 25.5 11.5 5.0 2.5 1.5 0.7
2.0
0.2 30.5 13.0 6.0 3.0 1.7 0.8
0.3 25.0 10.0 4.5 2.0 1.4 0.7
0.4 21.0 8.0 4.0 2.0 1.3 0.6
2.5
1.0
0.2 47.0 16.5 8.5 3.5 2.3 1.1
0.3 33.5 13.0 6.5 2.5 1.8 0.9
0.4 33.0 11.5 6.0 2.5 1.6 0.8
1.5
0.2 32.0 13.0 6.0 2.5 1.6 0.8
0.3 25.5 11.5 4.5 2.0 1.4 0.7
0.4 25.5 9.0 3.5 2.0 1.2 0.6
2.0
0.2 27.0 10.0 5.0 2.0 1.4 0.7
0.3 21.5 7.0 3.5 1.5 1.2 0.6
0.4 18.5 6.5 3.5 1.5 1.0 0.5
Page 52
Color variation characteristic of Maillard reaction
- 40 -
The reaction rate of all conditions was shown temperature dependence according to
the Arrhenius relationship. A relationship between reaction rate (r𝑚𝑎𝑥) and temperature
(1/T) expressed by Arrhenius function showed high association of R2 > 0.9503. Figure 8
shows representative Arrhenius plot for concentration conditions of Xy = 2.0 M, Gl =
2.0 M, and DH = 0.3 M. The reaction rate was increased as increasing of reaction
temperature and concentration of reactant. Additionally, the range of 𝐸𝑎 at each color
channel (Red, Green, Blue) was 80–145 kJ/M, 79–117 kJ/M, 86–106 kJ/M, respectively.
And the all parameter of the Arrhenius functions summarized in Table 2-4.
These 𝐸𝑎 values are similar to the reported 𝐸𝑎values for each food quality losses.
The typical 𝐸𝑎 values for food quality losses were 41.84–104.60, 83.68–125.52, and
83.68–251.04 kJ/M for lipid oxidation, nutrient loss, and microbial growth, respectively
(Labuza 1982). The Eα values for Br.thermosphacta, Enterobacteriaceae, and lactic
acid bacteria in modified atmosphere packed beef were 85.69, 92.78, and 106.90 kJ/M,
respectively (Vaikousi et al. 2009). And the typical 𝐸𝑎 value for respiration rates
occurring in fruits and vegetables was 29–79 kJ/M (Poças et al. 2008). Thus, these
similar 𝐸𝑎 values between the measured color change and the reported food quality
losses show that the color change in Maillard reaction-based TTI can be applied to show
the temperature history in the food quality change such as lipid oxidation, nutrient loss,
and microbial growth.
Page 53
Color variation characteristic of Maillard reaction
- 41 -
Fig. 2-8 Arrhenius plot at 2.0 M D-xylose, 2.0 M glycine, and 0.3 M Na2HPO4
Page 54
Color variation characteristic of Maillard reaction
- 42 -
Table 2-4 (a) The parameters of Arrhenius function (Ep. 2-3) at normal Maillard
reaction
Reactant
concentration Red Green Blue
Xylose Glycine Ea (kJ/M) A (×1015) R2 Ea (kJ/M) A (×1015) R2 Ea (kJ/M) A (×1015) R2
1.0
1.0 94.23 2.2 0.9814
1.5 145.63 1.66 0.9853 117.29 19562.85 0.996 107.96 983.22 0.9918
2.0 106.74 394.66 0.9791 102.4 63.74 0.9948 99.67 54.83 0.9884
2.5 99.87 21.28 0.9862 98.16 15.98 0.996 92.05 3.05 0.9896
1.5
1.0 106.26 386.79 0.9955
1.5 101.37 32.22 0.9999 90.17 0.38 0.9903 105.83 500.41 0.99
2.0 93.69 1.93 0.9881 98.1 16.06 0.9999 96.02 16.41 0.9833
2.5 100.58 39.71 0.9797 91.45 1.32 0.9821 96.16 20.66 0.9791
2.0
1.0 110.6 1201.47 0.9821 79.12 0 0.9643 90.43 0.77 0.9985
1.5 99.8 15.81 0.9874 86.3 0.1 0.9791 71.62 0 0.8518
2.0 77.08 0 0.9738 84.83 0.09 0.9737 85.83 0.3 0.9466
2.5 90.81 0.93 0.9718 94.35 5.97 0.983 94.58 12.51 0.967
2.5
1.0 103 54.7 0.9933 78.66 0 0.9906 99.71 39.89 0.993
1.5 84.56 0.05 0.9853 92.24 1.55 0.9926 95.8 12.63 0.988
2.0 95.83 7.01 0.9951 93.47 3.67 0.9896 86.34 0.4 0.9666
2.5 98.02 23.9 0.9976 93.49 5.09 0.9876 90.07 2.45 0.9593
3.0
1.0 94.01 1.35 0.971 80.46 0.01 0.9774 95.72 8.02 0.9809
1.5 88.44 0.26 0.9906 88.47 0.4 0.9943 94.39 8.49 0.9652
2.0 88.64 0.43 0.9943 99.5 50.11 0.9849 81.06 0.05 0.9564
2.5 96.08 11.76 0.9955 89.09 0.93 0.9846 87.42 0.9 0.975
3.5
1.0 94.11 1.74 0.9865 80.19 0.01 0.9829 66.02 0 0.8116
1.5 90.17 0.55 0.9525 89.28 0.61 0.9914 88.46 0.74 0.9684
2.0 95.62 8.59 0.9953 96.61 16.43 0.9496 81.81 0.07 0.9571
2.5 92.06 2.31 0.9837 90.51 2.11 0.9855 76.97 0.01 0.9353
4.0
1.0 87.43 0.12 0.9861 86.29 0.11 0.9931 97.46 18.98 0.9789
1.5 104.77 308.56 0.9787 97.1 18.23 0.9854 90.87 2.29 0.981
2.0 92.14 2.4 0.9932 101.33 129.37 0.9845 88.19 1.05 0.9709
2.5 94.08 6.69 0.9768 93.69 9.31 0.9774 77.31 0.02 0.9671
4.5
1.0 94.22 2.42 0.9957 88.46 0.3 0.9948 98.34 34 0.9947
1.5 106.55 643.27 0.9926 96.85 16.96 0.9875 88.66 1.01 0.9666
2.0 97.79 27.05 0.9935 99.12 67.46 0.9935 95.08 21.54 0.9921
2.5 91.13 2.2 0.9737 89.59 1.75 0.9805 85.8 0.61 0.9855
5.0
1.0 82.89 0.03 0.9999 87.24 0.21 0.9996 93.41 5.25 0.9861
1.5 97.66 20.07 0.9751 93.51 5.27 0.992 96.02 26.39 0.9503
2.0 91.81 2.49 0.9924 102 257.02 0.9872 85.78 0.56 0.9837
2.5 91.68 3.44 0.9837 93.25 9.55 0.996 93.3 15.31 0.994
5.5
1.0 89.33 0.35 0.9471 92.21 1.85 0.9771 92.37 3.34 0.9973
1.5 92.55 2.42 0.9909 100.41 85.47 0.9925 86.86 0.61 0.9709
2.0 90.95 2.1 0.9454 87.97 0.91 0.9649 78.92 0.04 0.9656
2.5 95.73 17.42 0.9575 89.75 2.2 0.9838 98.02 126.9 0.9982
6.0
1.0 93.71 2.3 0.9903 102.39 117.41 0.9974 90.42 1.54 0.9871
1.5 98.92 33.91 0.9894 92.53 3.53 0.9894 88.89 1.48 0.9734
2.0 96.42 19.31 0.9945 90.76 2.73 0.9934 93.22 14.31 0.9897
2.5 92.41 4.77 0.9823 96.52 38.23 0.9915 88.25 1.99 0.9852
7.0
1.0 98.67 18.08 0.943 95.05 6.44 0.9769 97.21 23.53 0.9782
1.5 102.24 154.53 0.9943 100.78 128.71 0.9969 99.25 111 0.9965
2.0 110.75 7225.69 0.9809 99.72 125.54 0.9982 99.19 163.37 0.9988
2.5 98.74 75.34 0.9923 97.13 52.62 0.9747 99.77 284.54 0.9888
Page 55
Color variation characteristic of Maillard reaction
- 43 -
Table 2-4(b) The parameters of Arrhenius function (Ep. 2-3) at fast reaction
Reactant concentration Red Green Blue
Xylose Glycine Na2HPO4 Ea (kJ/M) A (×1015) R2 Ea (kJ/M) A (×1015) R2 Ea (kJ/M) A (×1015) R2
1.0
1.0
0.2 81.71 0.02 0.9657 97.25 11.41 0.9885 95.78 6.62 0.9806
0.3 88.98 0.49 0.9863 101.01 63.76 0.9872 99.43 33.01 0.9914
0.4 96.75 13.12 0.9795 109.85 2654.58 0.9936 99.99 47.42 0.9976
1.5
0.2 89.00 0.58 0.9920 98.79 31.47 0.9880 98.15 24.55 0.9879
0.3 97.05 19.15 0.9958 108.33 2043.75 0.9963 97.86 25.13 0.9902
0.4 103.45 306.92 0.9948 105.96 825.42 0.9964 101.06 103.02 0.9940
2.0
0.2 93.63 4.26 0.9832 106.08 780.09 0.9921 99.96 58.49 0.9945
0.3 99.03 50.68 0.9741 104.71 528.83 0.9958 98.35 34.53 0.9956
0.4 104.38 554.92 0.9920 112.07 12261.43 0.9888 102.89 264.26 0.9981
1.5
1.0
0.2 81.35 0.02 0.9734 95.10 6.78 0.9948 90.87 1.12 0.9937
0.3 83.92 0.09 0.9726 97.52 21.83 0.9948 93.93 4.99 0.9983
0.4 88.10 0.54 0.9831 101.77 149.14 0.9982 99.54 53.72 0.9990
1.5
0.2 86.07 0.24 0.9978 101.41 130.46 0.9935 95.05 9.14 0.9884
0.3 92.33 4.02 0.9933 108.43 2709.98 0.9985 98.71 43.25 0.9971
0.4 96.16 21.58 0.9948 110.40 7137.54 0.9954 103.62 381.24 0.9922
2.0
0.2 86.97 0.39 0.9807 105.74 889.34 0.9998 99.23 57.32 0.9976
0.3 91.71 3.86 0.9901 97.44 37.13 0.9773 92.79 5.06 0.9916
0.4 99.02 90.55 0.9905 104.19 742.22 0.9967 97.67 41.92 0.9897
2.0
1.0
0.2 79.99 0.02 0.9598 94.16 5.46 0.9901 90.25 1.03 0.9977
0.3 87.88 0.57 0.9995 103.23 264.45 0.9912 91.20 1.71 0.9979
0.4 96.82 26.64 0.9924 104.48 561.68 0.9984 99.39 65.08 0.9949
1.5
0.2 92.61 4.34 0.9941 103.64 386.28 0.9991 102.52 213.77 0.9963
0.3 95.57 19.44 0.9921 106.83 1689.59 0.9936 104.33 563.43 0.9926
0.4 98.67 76.22 0.9968 109.68 6365.84 0.9948 105.82 1081.45 0.9942
2.0
0.2 97.76 44.51 0.9989 105.08 847.47 0.9955 104.95 725.65 0.9938
0.3 94.13 12.90 0.9971 100.37 147.14 0.9955 97.19 35.91 0.9933
0.4 91.69 4.99 0.9851 101.01 228.93 0.9964 93.72 9.21 0.9952
2.5
1.0
0.2 85.79 0.24 0.9844 97.82 30.79 0.9960 92.13 2.71 0.9962
0.3 94.31 9.78 0.9911 102.25 225.65 0.9977 98.99 52.45 0.9924
0.4 93.17 6.82 0.9929 102.85 292.49 0.9997 99.96 81.70 0.9958
1.5
0.2 91.62 3.44 0.9876 103.93 502.82 0.9863 98.10 37.34 0.9753
0.3 96.07 26.53 0.9894 108.92 4622.67 0.9963 105.69 1052.03 0.9914
0.4 91.73 4.79 0.9697 104.44 803.37 0.9946 105.43 1056.07 0.9890
2.0
0.2 97.03 36.59 0.9937 105.70 1296.62 0.9917 99.85 102.01 0.9926
0.3 96.44 39.07 0.9974 99.16 113.71 0.9921 94.57 13.89 0.9914
0.4 95.20 24.94 0.9908 96.88 42.90 0.9965 90.69 2.81 0.9905
Page 56
Color variation characteristic of Maillard reaction
- 44 -
2.3.4. Development of a model for predicting color variation
The fitted parameters (rmax, Tinf, and ∆color change) of Eq. 1 were successfully
described as functions of reactant concentrations and temperatures by Eq. 2-4, with the
corresponding fitted parameters and fit quality indices (𝑅2) summarized in Table 2-5.
Thus, developed prediction formula (Eq. 2-4) allowed us to comprehensively and
accurately predict Maillard reaction-induced color changes, as exemplified by the
accurate (𝑅2 = 0.99) prediction of reaction completion times (Fig. 2-7).
At the results in prediction of completion time, the difference of between observed
time and predicted time were increased at the lower temperature condition. But the
completion time of color variation at the lower temperature is longer and slower. For
this reason, the give considering to increased time at low temperature might not have a
significant effect on the practical prediction. Actually, the average differences between
observed and predicted completion times at normal reaction equaled 40, 19, 8, 4, 5, and
4 d at 5, 10, 15, 20, 25 and 30 °C, respectively. And, at fast reaction, the average
differences show 42, 16, 9, 9, 5, and 3 h at 0, 5, 10, 15, 20, and 25 °C, respectively.
Page 57
Color variation characteristic of Maillard reaction
- 45 -
Table 2-5 (a) The Results of regression analysis for normal reaction (Ep. 2-4)
Parameter
Coefficients
R2
𝑎0 𝑎1 𝑎2 𝑎3 𝑎4 𝑎5
ΔColor
value
Red 79.5222 -27.9568 0.0244 -0.0060 2.4484 -0.0060 0.1755
Green 4.2406 -1.5442 -0.0191 -0.0037 0.1327 0.0110 0.1157
Blue 27.0873 -9.5134 -0.0152 -0.0070 0.8276 0.0081 0.1683
rmax
Red -2201.7538 734.7414 0.4183 1.2939 -61.2422 0.1541 0.9666
Green -2520.2952 847.8908 0.7744 1.3954 -71.2882 0.0497 0.9815
Blue -1374.5975 445.7797 0.5711 1.3620 -35.9799 0.0641 0.9692
Tinf
Red 3567.8837 -1217.5584 -0.8855 -1.4507 103.9525 0.0016 0.9888
Green 2875.7518 -974.7261 -0.9508 -1.4879 82.6412 0.0513 0.9900
Blue 1032.4524 -323.3430 -0.9267 -1.3319 25.0602 0.0974 0.9632
Completion time 3082.8463 -1046.3278 -0.7671 -1.3710 88.8526 -0.0394 0.9906
Table 2-5 (b) The Results of regression analysis for fast reaction (Ep. 2-5)
Parameter
Coefficients
R2
𝑏0 𝑏1 𝑏2 𝑏3 𝑏4 𝑏5 𝑏6
ΔColor
value
Red -263.5575 91.0739 0.1894 0.1016 0.0708 -7.8743 -0.0698 0.7503
Green -106.2071 37.0490 0.0449 0.0294 0.0148 -3.2388 -0.0155 0.4900
Blue 66.6571 -23.7712 -0.0160 0.0002 0.0048 2.1114 0.0239 0.3190
rmax
Red -276.3945 57.2439 1.2787 0.6071 0.3435 -1.5823 -0.4556 0.9857
Green -677.5012 194.8310 1.0268 0.7398 0.3617 -13.3730 -0.3025 0.9915
Blue -1054.8547 330.3389 0.8177 0.6317 0.3419 -25.5333 -0.2591 0.9911
Tinf
Red 6807.4487 -2369.2676 -0.3854 -0.5600 -0.3005 206.2232 -0.3101 0.9933
Green 7508.3625 -2615.2808 -0.5159 -0.6626 -0.3430 227.8113 -0.2122 0.9948
Blue 7988.2403 -2783.6476 -0.4293 -0.6703 -0.4290 242.5704 -0.2838 0.9938
Completion time 4785.0001 -1648.7689 -0.7919 -0.7956 -0.4509 142.0808 -0.0595 0.9951
Page 58
Color variation characteristic of Maillard reaction
- 46 -
2.3.5. Development of an application for predicting color variation
Although the color change in TTI is visible to the naked eyes, confirmation of the
color change in TTI using only eyes have some limits such as perception difference by
personal gap and absence of prediction information about color change. For this reason,
the using of application for widely deployed smart-phone was considered as a method
for confirmation with ease and precision about color change in TTI. Therefore,
application of prototype was produced, and examined about usability. An application
was produced using XCODE (8.2) as integrated development environment and Swift3.3
as programing language.
(a) Capture section (b) Analysis section
Fig. 2-9 A developed prototype smart-phone application to
analysis of TTI color
Page 59
Color variation characteristic of Maillard reaction
- 47 -
A developed application for smartphone recognizes a concentration condition and a
appeared color in TTI, and then predicts about subsequent color change based on
inputted temperature condition. In application, the OCR (Optical Character Recognition)
was used for recognition of concentration condition in TTI, and the rate of progression
in color change and the time remaining to reaction completion were calculated by
developed prediction formula.
Therefore, a developed application was utilized at recognition and analysis of a
made TTI with concentration conditions of Xy = 1.5 M, Gl = 1.5 M, and DH = 0.3 M
for actual possibility verification. The executed application takes a picture of TTI (Fig
1-a), and shows the recognized information of TTI (The upper side of Fig 1-b) and the
predicted values (The underside of Fig 1-b). Therefore, an application screen provide
various information such as the concentration conditions and the currently color in TTI
without prior information about TTI. Moreover, the users can see that if the TTI had
been exposed to 10 °C, the currently color of TTI was progressed 79% and the predicted
remaining to reaction completion was 48 hours. Thus, a prototype application for
smartphone using developed numerical model had sufficient possibility as a method for
recognition and prediction to assist the naked eyes about the color changes in TTI.
Page 60
Color variation characteristic of Maillard reaction
- 48 -
2.4. Conclusion
Color variations observed in the Maillard reaction between D-xylose, glycine, and
Na2HPO4 (reaction accelerator) were investigated at various temperatures and reactant
concentrations for novel TTI development. The reaction completion time decreased with
increasing temperature and reactant concentration, revealing that Maillard reaction-
based TTIs with high reaction time flexibility can be realized by adjusting the latter
parameter. Moreover, the reaction completion time and color variation could be
accurately predicted by the developed numerical model. Additionally, a developed
application was designed to recognition and change prediction of color in TTI had
sufficient possibility as assistance method to naked eyes.
Page 61
Application of a developed TTI into ripening and storage for melon
- 49 -
Chapter 3 Application of a developed TTI into ripening and storage
for melon
3.1. Introduction
Muskmelon (Cucumis melo L.) originated in Africa and southwest Asia, is one of
the most popular dessert fruit worldwide due to its unique fragrance and high sugar
content (Oh et al. 2011). In addition, because melon is a ripening fruit, the quality easily
decreases by proceeding of metabolism even under postharvest period. There have been
many reports on the quality changes in various melon species to investigate the effect of
production, storage, and distribution. Vito and Mikal (1995) reported on the effect of
storage temperature for six inodorus melon cultivars (cv. Amarelo, Golden Casaba,
Honeydew, Honey Loupe, Juan Canary, and Paceco). Yang et al. (2003) studied the
storage quality potential of three main Hami melon cultivars (cv. New Queen, 8601, and
Kalakusai). Youn et al. (2009) investigated the effects of temperature variations during
storage on the quality characteristics of muskmelons (Cucumis melo L.).
Although many studies on quality change of melon during storage and ripening,
determination of melon quality is still difficult without destruction. Because melon
shows very little change even on thick rind, various nondestructive techniques for
determination of the internal quality of melon have been reported such as acoustic
technology, dynamic technology, electrical and magnetic technology, X-ray and
computed tomography, and near infrared (NIR) spectroscopy, etc. (Sun et al. 2010).
Those methods, however, are also difficult to use in a real site, because those
methods need special and expensive equipment. Novel technologies for determining
and/or estimation of internal quality of melon without destruction have been demanded
for long time. To overcome the problem, we have focused on a relationship between
Page 62
Application of a developed TTI into ripening and storage for melon
- 50 -
changes in melon quality and exposed integrated temperature during growing and
distribution. Since Time-Temperature Integrator/Indicator (TTI) using Maillard reaction
studied in this study has high flexibility on reaction time, this TTI would be able to use
for indication of quality change during storage and ripening of melon. In this chapter,
we aimed to investigate the relationship between quality change of melon during
storage and ripening and color change in the developed TTI for clarifying the
availability of the TTI at the storage and ripening process of melon.
Page 63
Application of a developed TTI into ripening and storage for melon
- 51 -
3.2. Materials and methods
3.2.1. Materials
Melons (Red-113, harvested at Furano in Hokkaido) having similar sizes and weights
harvested on early September of 2016 and 2017 was purchased from producing district. The
melons were harvested at commercial maturity of 55-60 days after anthesis. The average
weight and equatorial diameter of the harvested melons in 2016 (M2016) was 2183.5 ±
157.0 g and 50.1 ± 1.3 cm, respectively. The average weight and equatorial diameter of the
melons harvested in 2017 (M2017) were 2445.8 ± 133.5 g and 52.2 ± 1.2 cm, respectively.
3.2.2. Pretreatment of melon
All melon was treated by the washing with hot water and used MA (modified
atmosphere) packaging storage. First of all, the pollutant such as soil or dust was removed
from the melon using tap water. Then, the melons were washed by the hot water (60 °C) for
30 sec. After hot water treatment, to remove excessive water from the surface of the melon,
the melons were wiped with the clean paper towel. The dried melons were stored in the
modified atmosphere/modified humidity (MA/MH) packaging plastic bags (Xtend, 815-
CN51, StePac Ltd., Israel). Xtend® films are characterized by high moisture vapor
transmission rates (MVTR) in comparison to conventional polyethylene and polypropylene
films (Porat et al. 2009). Figure 3-1 shows representative melons during storage and ripening.
Page 64
Application of a developed TTI into ripening and storage for melon
- 52 -
3.2.3. Temperature conditions
Temperature conditions were selected taking into considerations of real situation of
storage and ripening. The melons harvested in 2016 were stored at 5°C for 1, 2, 3, and 4
weeks, and then ripened at 25 °C for 2-8 days by shifting from the cold chamber of 5°C at
each week. The melons harvested in 2017 were stored at 4°C for 2, 4, 6, 7, and 8 weeks, and
ripened at 20°C for 2-8 days. As control samples, the melons harvested in 2016 and in 2017
were stored at 25°C and 20°C, respectively, for only ripening.
Fig. 3-1 The appearance of the melons during MA storage
Page 65
Application of a developed TTI into ripening and storage for melon
- 53 -
3.2.4. Weight loss
Weight loss of whole melons was determined by the comparison between the initial
weight and the weight after ripening. The weight loss was calculated as percentage loss of
initial weight (Eq. 3-1).
where 𝑊𝑖 and 𝑊𝑓 denote initial weight and weight after storage and ripening,
respectively.
3.2.5. Color of the pulp
Color value of the stored melon pulp was determined by the colorimeter (Minolta CR-
400 chroma meter, Konica Minolta Sensing, Inc., Japan) using the CIE scale L* (Lightness),
a* (Red-Green), and b
* (Yellow-Blue). Melons were longitudinally cut into 2 halves. Seeds
were removed, and remaining pulp was then cut into 8 equal segments. The color was
determined with random four positions in pulp and the average of the measurement values
was used. The color difference (∆E) was defined by Ep. 3-2 as the visible difference of color
(Thatyane et al. 2012; Zhou et al. 2016).
where ∆𝐿∗, ∆𝑎∗, and ∆𝑏∗ is difference of measurement values and initial values.
Weight loss (%) =𝑊𝑖 − 𝑊𝑓
𝑊𝑖× 100 (Eq.3-1)
∆E = √(∆𝐿∗)2 + (∆𝑎∗)2 + (∆𝑏∗)2 (Eq.3-2)
Page 66
Application of a developed TTI into ripening and storage for melon
- 54 -
3.2.6. Soluble solids contents (SSC)
Melons for measurement were longitudinally cut into 2 halves. Seeds were removed, and
remaining pulp was then cut into 8 equal segments. And then, the 3 segments chose randomly.
The soluble solids contents (SSC) of the melon was determined for squeezed juice from the
three positions of top, middle, and bottom in each chosen segments by using a Pocket
Refractometer (Pal-1, Atago Co., Tokyo, Japan; unit = % Brix). The top, middle and bottom
represented near the connection point with the stem, equatorial position, and near the blossom
end, respectively.
3.2.7. Firmness
The firmness of the melon pulp was determined for the three position of top, middle,
and bottom as well as the determination of the SSC. The firmness of the pulp melon was
expressed as the force in Newton (N) applied by a flathead probe of 10 mm in diameter with
the crosshead speed set at 0.5 mm/s using a Rheo Meter (NRM-2002J, Rheotech Corp.,
Japan). The firmness was determined three positions for each part, and the average of the
triplicate measurement values was used.
3.3.8. Temperature dependence of quality change for melon
The temperature dependence of quality change for melon was expressed by Arrhenius
function (Eq. 2-3 in Chapter 2). A k value is slope (a) in the fitted results of each quality
change by a linear equation (Eq. 3-3).
Quality change = a × Time + b Eq. 3-3
Page 67
Application of a developed TTI into ripening and storage for melon
- 55 -
3.2.9. Time-temperature indicator (TTI)
PET (poly ethylene terephthalate) film was used as a material for making TTI. PET
film is a safe material which is normally used for various food packaging. Moreover, PET
film has high strength, crystal clarity, moisture and solvent resistance, and the barrier against
oxygen and water vapor, etc. (Thomas et al., 2011). For this reason, PET was considered
suitable material for the TTI. Two different size (35 × 25 mm and 50 × 35 mm) of the PET
film pouches were prepared by using poly sealing apparatus (PC-200, Fuji Impulse, Japan).
In the small pouch, an acrylic panel (5 × 20 mm) was attached and sealed with D-xylose
solution (0.75 mL). The small pouch was inserted into the large pouch, and then the large
pouch was sealed with glycine solution (0.75 mL). The schematic representation of
preparation of the TTI was shown in Fig. 3-2.
3.2.10. Statistical analysis
SPSS (IBM SPSS Statistics 20, IBM, USA) was used to analyze the significance using
one-way ANOVA. Significant differences among storage conditions were determined by
Tukey’s post hoc comparison test (P < 0.05).
2.5 cm
3.5 cm
3.5 cm
5 cm
Into the large bag Acrylic
panel
Fig. 3-2 Schematic representation of preparation of the TTI
Small bag Large bag
Page 68
Application of a developed TTI into ripening and storage for melon
- 56 -
3.3. Results and discussion
3.3.1. Changes in the appearance of the melon pulp during ripening period
Table 3-1(a) and 3-1(b) shows the changes in the appearance of the melon during
ripening period for the trial in 2016 and the trial in 2017, respectively. The degradation of the
appearance of the melon harvested in 2016 showed at the ripening conditions of 6 days at
25°C after 2 weeks at 5°C, 2 days at 25°C after 3 weeks at 5°C, and all melons after 4 weeks
at 5°C. And the degradation of the appearance of the melon harvested in 2017 showed at the
ripening conditions of 2 days at 20°C after 7 weeks for 4°C and all melons after 8 weeks for
4°C. Apparent degradation of the appearance exhibited on the 160°C·days and 220°C·days as
integrated temperature for the melon harvested in 2016 and in 2017, respectively.
Page 69
Application of a developed TTI into ripening and storage for melon
- 57 -
Table 3-1 (a) Changes in the appearance of the melon harvested in 2016 during ripening
Only 25°C
0 days
2 days (48°C·day)
4 days (95°C·day)
6 days (138°C·day)
8 days (182°C·day)
1 Weeks
at 5°C
0 days (44°C·day)
3 days (112°C·day)
6 days (179°C·day)
8 days (222°C·day)
2 Weeks
at 5°C
0 days (79°C·day)
2 days (127°C·day)
4 days (177°C·day)
6 days (226°C·day)
3 Weeks
at 5°C
0 days (116°C·day)
2 days (164°C·day)
5 days (241°C·day)
4 Weeks
at 5°C
0 days (162°C·day)
1 days (188°C·day)
2 days (214°C·day)
Page 70
Application of a developed TTI into ripening and storage for melon
- 58 -
Table 3-1 (b) Changes in the appearance of the melon harvested in 2017 during ripening
Only 20°C
0 days
2 days (40°C·day)
4 days (80°C·day)
6 days (120°C·day)
8 days (160°C·day)
2 Weeks
at 4°C
0 days (60°C·day)
2 days (100°C·day)
4 days (140°C·day)
4 Weeks
at 4°C
0 days (116°C·day)
2 days (156°C·day)
4 days (196°C·day)
6 Weeks
at 4°C
0 days (168°C·day)
1 days (188°C·day)
2 days (208°C·day)
7 Weeks
at 4°C
0 days (195°C·day)
1 days (215°C·day)
2 days (235°C·day)
8 Weeks
at 4°C
0 days (224°C·day)
1 days (244°C·day)
Page 71
Application of a developed TTI into ripening and storage for melon
- 59 -
3.3.2. Weight loss
Weight loss by transpiration during ripening period was observed for all conditions. The
weight loss rate was increased by the longer ripening period and the higher temperature. Fig.
3-3 shows weight loss of the melon harvested in M2016 (a) and harvested in M2017 (b). The
increase of the weight loss at higher temperature was considered by increase in the
transpiration under high temperature (Jamal and Chieri 2006). While the weight loss during
ripening period at 20 and 25°C was increased significantly, the weight loss after storage at
5°C did not show significant difference among the storage period of 1-4 weeks. In contrast,
the melon stored at 4°C showed significant difference in the weight loss between 4 weeks and
6 weeks.
Moisture loss of crops is a major cause of postharvest deterioration and weight loss and
lead to the economic loss if the commodity is sold by weight. Thus, sometimes weight loss is
used as index of quality deterioration by nondestructive method. In wide range of
horticultural crops, in general, weight loss of 3% to 10% may render unmarketable (Nunes
and Emond 2007; Kasim and Kasim 2014). But weight loss does not correspond with quality
deterioration. The melon harvested in 2017 showed degradation of the appearance despite
weight loss in all conditions did not exceed either 3%. The degradation of the appearance of
the melon harvested in 2016 was shown even at the around 1% of weight loss like in a
ripened melon during 4 weeks at 5°C. Thus, TTI is able to useful for the decision of quality
deterioration using the nondestructive method because the use of weight loss as index of
quality deterioration is difficult.
Page 72
Application of a developed TTI into ripening and storage for melon
- 60 -
Fig. 3-3 The weight loss during ripen period at M2016 (a) and M2017 (b)
0.0
0.5
1.0
1.5
2.0
2.5
3.0
3.5
4.0
4.5
0 2 4 6 8 10
We
igh
t lo
ss
(%
)
Ripening period at 25 C (d)
(a)
Only 25°C
1 weeks at 5°C
2 weeks at 5°C
3 weeks at 5°C
4 weeks at 5°C
0.0
0.5
1.0
1.5
2.0
2.5
3.0
3.5
4.0
4.5
0 2 4 6 8 10
We
igh
t lo
ss
(%
)
Ripening period at 20 C (d)
(b)Only 20°C 6 weeks at 4°C
2 weeks at 4°C 7 weeks at 4°C
4 weeks at 4°C 8 weeks at 4°C
Page 73
Application of a developed TTI into ripening and storage for melon
- 61 -
3.3.3. Color of the pulp
Fig. 3-4, 3-5, 3-6, and 3-7 shows changes in the color value of lightness (L*), redness
(a*), yellowness (b
*), and color difference (∆E), respectively. As shown in the Fig. 3-4, L
*
values did not show significant variation (p > 0.05) by ripening period. In contrast, the a* (Fig.
3-5) and b* (Fig. 3-6) value significantly decreased during ripening period.
While the ∆E of the melons harvested in 2016 during ripening period at 25°C was
increased, the ∆E during storage period at 5°C did not show the significant difference. The
increase in the ∆E value at the higher temperature was attributed by the increase in the
activity of polyphenol oxidase (PPO) and peroxidase (POD) (Chisari et al. 2008). Although
the ∆E value increased with the longer period of storage and ripening, apparent difference
was not recognized by naked eyes as shown in Table 3-1.
The changes in the a*, b
* and ∆E value as a function of integrated temperatures are
shown in Fig.3-8. The trend of the changes in the color values was described as a linear
equation for a* and b* value, and a cubic equation for ∆E value. The a*, b* and ∆E values
were decreased as the integrated temperature increased.
Page 74
Application of a developed TTI into ripening and storage for melon
- 62 -
Fig. 3-4 The lightness (L) value variation by ripen period at M2016 (a) and
M2017 (b)
0
10
20
30
40
50
60
70
0 2 4 6 8 10
L (
-)
Ripening period at 25 C (d)
(a)
Only 25°C 1 weeks at 5°C
2 weeks at 5°C 3 weeks at 5°C
4 weeks at 5°C
0
10
20
30
40
50
60
70
0 2 4 6 8 10
L (
-)
Ripening period at 20 C (d)
(b)
Only 20°C 6 weeks at 4°C
2 weeks at 4°C 7 weeks at 4°C
4 weeks at 4°C 8 weeks at 4°C
Page 75
Application of a developed TTI into ripening and storage for melon
- 63 -
Fig. 3-5 The redness (a*) value variation by ripen period at M2016 (a) and
M2017 (b)
0
2
4
6
8
10
12
14
0 2 4 6 8 10
a*
(-)
Ripening period at 20 C (d)
(b)
Only 20°C 6 weeks at 4°C
2 weeks at 4°C 7 weeks at 4°C
4 weeks at 4°C 8 weeks at 4°C
0
2
4
6
8
10
12
14
0 2 4 6 8 10
a*
(-)
Ripening period at 25 C (d)
(a)
Only 25°C 3 weeks at 5°C
1 weeks at 5°C 4 weeks at 5°C
2 weeks at 5°C
Page 76
Application of a developed TTI into ripening and storage for melon
- 64 -
Fig. 3-6 The yellowness (b*) value variation by ripen period at M2016 (a) and
M2017 (b)
0
10
20
30
40
50
0 2 4 6 8 10
b*
(-)
Ripening period at 25 C (d)
(a)
Only 25°C 3 weeks at 5°C
1 weeks at 5°C 4 weeks at 5°C
2 weeks at 5°C
0
10
20
30
40
50
0 2 4 6 8 10
b*
(-)
Ripening period at 20 C (d)
(b)
Only 20°C 6 weeks at 4°C
2 weeks at 4°C 7 weeks at 4°C
4 weeks at 4°C 8 weeks at 4°C
Page 77
Application of a developed TTI into ripening and storage for melon
- 65 -
0
2
4
6
8
10
12
14
16
0 2 4 6 8 10
Co
lor
dif
fere
nc
e -
∆E
(-)
Ripening period at 20 C(d)
(b)Only 20°C 6 weeks at 4°C
2 weeks at 4°C 7 weeks at 4°C
4 weeks at 4°C 8 weeks at 4°C
0
2
4
6
8
10
12
14
16
0 2 4 6 8 10
Co
lor
dif
fere
nc
e -
∆E
(-)
Ripening period at 25 C (d)
(a)Only 25°C 3 weeks at 5°C
1 weeks at 5°C 4 weeks at 5°C
2 weeks at 5°C
Fig. 3-7 The color difference (∆E) value variation by ripen period at M2016 (a)
and M2017 (b)
Page 78
Application of a developed TTI into ripening and storage for melon
- 66 -
3.3.4. Soluble solids content (SSC)
The soluble solids content (SSC) decreased after storage and ripening. The SSC at the
end of storage and ripening period was 9.4-14.0 %, while the initial value of SSC was 13.0-
15.9 %. Fig. 3-8 shows changes in the SSC of different storage and ripening conditions. At
M2016 by storage for 5°C and ripening for 25°C, significant difference in SSC was not
shown between the only ripened melon without storage and the ripened melon after storage
during 1 week. These decreases of SSC during storage or ripening was attributed by the
transformation of high molecular substances such as carbohydrate to sugar with tissue
softening or the decomposition (Youn et al. 2009).
There was significant difference in SSC among the measurement position of the melon.
The lowest value of SSC was shown at top position (Fig. 3-9), which was averagely 0.39-
0.90 lower than those of other positions. This result was reported in Mizuno et al. (1971) and
Nakayama (1968), also, that the lowest SSC was at top position (near the connection point
with the stem), and the highest SSC was at middle position (equatorial position).
Fig. 3-10 shows the relationship between SSC that represents mean values of three
different positions and integrated temperature. The linear relationship between the integrated
temperature and SSC value was small as R2 of 0.2869, despite the showing tendency of
decrease at higher integrated temperature.
Page 79
Application of a developed TTI into ripening and storage for melon
- 67 -
Fig. 3-8 The soluble solids contents (SSC) of middle position by ripen period at
M2016 (a) and M2017 (b)
0
2
4
6
8
10
12
14
16
18
0 2 4 6 8 10
SS
C -
Mid
dle
(%
)
Ripening period at 25 C (d)
(a)
Only 25°C 3 weeks at 5°C
1 weeks at 5°C 4 weeks at 5°C
2 weeks at 5°C
0
2
4
6
8
10
12
14
16
18
0 2 4 6 8 10
SS
C -
Mid
dle
(%
)
Ripening period at 20 C (d)
(b)
Only 20°C 6 weeks at 4°C
2 weeks at 4°C 7 weeks at 4°C
4 weeks at 4°C 8 weeks at 4°C
Page 80
Application of a developed TTI into ripening and storage for melon
- 68 -
Fig. 3-9 The difference of soluble solids contents (SSC) by measurement position
at M2016 (a) and M2017 (b)
0
2
4
6
8
10
12
14
16
18
0 1 2 3 4 5
SS
C (
%)
Ripening period at 25 C (d)
(a)
Top Middle Bottom
0
2
4
6
8
10
12
14
16
18
0 1 2 3
SS
C (
%)
Ripening period at 20 C (d)
(b)
Top Middle Bottom
Page 81
Application of a developed TTI into ripening and storage for melon
- 69 -
Fig 3-10 The relationship between SSC that represents mean values of three
different positions and integrated temperature
y = -0.01x + 14.735R² = 0.2869
0
2
4
6
8
10
12
14
16
18
0 50 100 150 200 250 300
SS
C (
%)
Integrated temperature (°C·d)
Page 82
Application of a developed TTI into ripening and storage for melon
- 70 -
3.3.5 Firmness
The firmness of fresh fruit is an important quality parameter for determination of
the storage period after harvesting. The firmness of the melon gradually decreased
during progress of ripening at all conditions. Average firmness of all measurement
values was 4.24 N at initial, and decreased until 1.02-2.41 N after finish of storage and
ripening. The changes in the firmness on the middle position in each condition shows in
Fig. 3-11. The decrease of the firmness would be attributed by the transformation of
pectin and hemi-cellulose(Oh et al. 2011).
There was significant difference in the firmness of the melon among the
measurement position (Fig. 3-12). While the firmness of the melon was the highest in
the top position, the firmness of the middle and bottom position showed similar values
(Fig. 3-12). Paris et al. (2003) reported that firmness of melon differed among the
measurement positions and was the highest at near stem end.
The changes in the firmness of the melon decreased as the integrated temperature
increased (Fig. 3-13). In particular, when the integrated temperature increased by
100 °C·d, the decrease rate of the firmness slowed and the significant difference among
the firmness was disappeared. Therefore, when the integrated temperature reached
around 100 °C·d, ripening period would be finished.
Page 83
Application of a developed TTI into ripening and storage for melon
- 71 -
Fig. 3-11 The firmness variation of middle position by ripen period at M2016 (a)
and M2017 (b)
0
1
2
3
4
5
0 2 4 6 8 10
Fir
mn
es
s -
Mid
dle
(N
)
Ripening period at 25 C (d)
(a)Only 25°C 3 weeks at 5°C
1 weeks at 5°C 4 weeks at 5°C
2 weeks at 5°C
0
1
2
3
4
5
0 2 4 6 8 10
Fir
mn
es
s -
Mid
dle
(N
)
Ripening period at 20 C (d)
(b)Only 20°C 6 weeks at 4°C
2 weeks at 4°C 7 weeks at 4°C
4 weeks at 4°C 8 weeks at 4°C
Page 84
Application of a developed TTI into ripening and storage for melon
- 72 -
0
1
2
3
0 1 2 3 4 5
Firm
ness
(N
)
Ripening period at 20 C (d)
(b)Top Middle Bottom
0
1
2
3
4
5
6
7
0 2 4 6 8 10
Firm
ness
(N
)
Ripening period at 25 C (d)
(a)Top Middle Bottom
Fig. 3-12 The difference of firmness by measurement position at M2016 (a) and
M2017 (b)
Page 85
Application of a developed TTI into ripening and storage for melon
- 73 -
Fig. 3-13 The relationship between firmness that represents mean values of
three different positions and integrated temperature
y = 4*10-5x2 - 0.0208x + 4.1558R² = 0.6582
0
1
2
3
4
5
0 50 100 150 200 250 300
Fir
mn
es
s (
N)
Integrated temperature (°C·d)
Page 86
Application of a developed TTI into ripening and storage for melon
- 74 -
3.3.6. Temperature dependence of quality change for melon
The temperature dependence was examined about only weight loss and firmness,
because significant difference by ripening temperature had at those qualities.
Additionally, the slope of firmness quality change was calculated in the range from start
day of storage to an initial measured day of firmness less than 2N, because significant
difference by temperature condition among the firmness less than 2N was disappeared.
The quality change of weight loss and firmness was shown temperature
dependence according to the Arrhenius relationship. A relationship between weight loss
and ripening temperature (1/T) expressed by Arrhenius function showed high
association of R2 0.9887 (Fig. 3-14). And a relationship between firmness and ripening
temperature expressed also high association of R2 0.9463 (Fig. 3-15). Moreover, 𝐸𝑎 at
weight loss and firmness A were 85.23 kJ/M and 55.67 kJ/M, respectively. Those 𝐸𝑎
values was similar with the range of 𝐸𝑎 about color channel (Red, Green, Blue) of
Chapter 2 such as 80–145 kJ/M, 79–117 kJ/M, 86–106 kJ/M, respectively. Thus, this
similar 𝐸𝑎 values between the quality change and the measured color change show that
the color change in Maillard reaction-based TTI can be applied to show the quality
change of weight loss and firmness.
Page 87
Application of a developed TTI into ripening and storage for melon
- 75 -
Fig. 3-14 Arrhenius plot between weight loss and ripening temperature
Fig. 3-15 Arrhenius plot between firmness and ripening temperature
Page 88
Application of a developed TTI into ripening and storage for melon
- 76 -
3.3.7. Application of TTI (Time-Temperature Indicator)
The TTIs for estimation of the storage and ripening process of melon were
developed as a decision support tool for determination of appropriate eating timing. The
observed color variations of the TTIs during storage of melon were shown in Table 3-2.
The TTI was developed on the basis of the quality change of the melons harvested in
2016, and applied for the melons harvested in 2017. The changes in the firmness were
the most important parameter for determination of appropriate eating timing during
storage period. Based on the changes in the firmness of melon during storage and
ripening period, such as storage at 5 °C for 2-3 weeks and then ripening at 25 °C for 3-4
days (Fig. 3-12), the concentration of the Maillard-reaction based TTIs was determined
as follows : (1) D-xylose 1.5 mol/L, glycine 1.0 mol/L, and Na2HPO4 0.2 mol/L, (2) D-
xylose 1.0 mol/L, glycine 1.0 mol/L, and Na2HPO4 0.2 mol/L.
The developed TTIs clearly showed the color change. The color changes in the
TTI appropriately reflected the changes in firmness of the melon during storage and
ripening (Table 3-2). In addition, the brown color of TTI could reflect the weight loss of
around 2 % and decrease the firmness by 2 N. The light blue and light brown before
showing brown color allows to confirm and predict the quality change of the melon
during storage and ripening. The colors of the TTIs enable users to choose fruits by
personal preference. For example, those people who prefer softer texture could choose a
melon with the TTI indicating brown color, and those people who prefer harder texture
could choose a melon with the TTI indicating light blue or light brown color.
Page 89
Application of a developed TTI into ripening and storage for melon
- 77 -
Table 3-2 The color variation in a made TTI (Time-Temperature indicator)
Only 20°C
Initial TTI
2 days
4 days
6 days
8 days
After
2 weeks
at
4°C 0 days at 20°C
2 days at 20°C
4 days at 20°C
After
4 weeks
at
4°C 0 days at 20°C
2 days at 20°C
4 days at 20°C
After
6 weeks
at
4°C 0 days at 20°C
1 days at 20°C
2 days at 20°C
After
7 weeks
at
4°C 0 days at 20°C
1 days at 20°C
2 days at 20°C
After
8 weeks
at
4°C 0 days at 20°C
1 days at 20°C
Page 90
Application of a developed TTI into ripening and storage for melon
- 78 -
3.4. Conclusion
The relationship between quality change of melon and color change in the made TTI
was investigated for availability test of TTI at the storage and ripening process of melon.
Therefore, the appeared brown color in TTI can express the weight loss of around 2 % and
the firmness decrease to 2 N. Additionally, the quality change during storage and ripening of
melon can be able to confirm and predict through the color change from light blue to light
brown in TTI. Therefore, the actual made TTI (Time-Temperature Indicator) can be applied
to show the quality change at the storage and ripening process of melon.
Page 91
Application of a developed TTI into shipping and storage for vacuum-packaged beef
- 79 -
Chapter 4 Application of a developed TTI into shipping and storage
for vacuum-packaged beef
4.1. Introduction
Consumption of beef in Japan is currently (in 2017) around 6 kg per person every
year since 2010. Beef is domestically produced around 5 million ton and imported
around 7 million ton every year. In particular, the beef imported from Australia
dominates more than 50% in total import volume of beef. Most of the beef imported
from Australia are shipped as chilling meats with vacuum-packaging for increase of
shelf-life and shipping efficiency.
Seideman and Durland (1983) reported that vacuum-packaging was verified as a
means of prolonging the shelf-life and palatability of beef. Lee and Yoon (2001)
reported that growth of aerobic microorganism and discoloration in beef was inhibited
by vacuum-packaging, and the shelf-life of the stored beef at 0°C with vacuum-
packaging was 66 days by sensory evaluation score. Hernández-Macedo et al. (2011)
also reported that while vacuum-packaging increased shelf-life and shipping efficiency,
might be induced quality degradation and/or spoilage by the anaerobic microorganism.
As described above, although vacuum-packaging improve quality and shelf-life of
beef, the quality of the beef gradually degrades. Furthermore, vacuum-packaging is
difficult to know spoilage state before packaging is opened. Thus, a special unique
method is need for determination of the shelf-life or the progress of spoilage of beef.
The spoilage of beef is appeared by various parameters such as pH, microorganism,
color of flesh, odor, and storage condition, etc. (Hernández-Macedo et al. 2011).
Although those parameters are determined for estimation of the shelf-life or the state of
spoilage of beef, the shelf-life is mostly determined by odor and flesh color because the
Page 92
Application of a developed TTI into shipping and storage for vacuum-packaged beef
- 80 -
pH and the number of microorganism could not confirm by human sense. However,
even the decisions by odor and/or flesh color have the personal difference, and can’t
predict remaining shelf-life or confirm temperature history.
For this reason, TTIs have been studied as a valuable tool for judging quality
degradation and shelf-life of beef. Shin et al. (2006) studied a freshness indicator using
change in pH on the flesh surface of beef and pork products during storage at 2°C.
HarikliaVaikousi et al. (2009) reported that a developed microbial TTI can be used as an
effective tool for monitoring microbial quality of fresh ground meat stored under
modified atmosphere packaging (MAP) conditions. Ellouze and Augustin (2010)
reported that a biological TTIs (eO)® could be applied as a quality management tool for
a ground beef and a spiced cooked chicken slices packed under modified atmosphere.
Kim et al. (2012) reported that a microbial TTI can be used in an intelligent packaging
technology for representing some selected quality indices of ground beef. There were
consistent relationships between changes in titratable acidity and corresponding quality
indices, such as aerobic mesophilic bacterial counts, lactic acid bacterial counts, and
freshness, regardless of storage temperature.
Although many types of TTIs have already been developed, the existing TTIs will
be insufficient for long-term storage of beef under chilled temperature. There has not
been developed any TTI that corresponds to changes in the quality of vacuum-packed
beef during shipment at around 0°C. In this chapter, we aimed to investigate the
applicability of the Maillard reaction based TTI for determination and/or estimation of
the changes in quality of vacuum-packed chilled beef during shipping and storage. The
color change in the Maillard reaction based TTI aimed to synchronize the changes in the
shelf life of vacuum-packed chilled beef.
Page 93
Application of a developed TTI into shipping and storage for vacuum-packaged beef
- 81 -
4.2. Materials and methods
4.2.1. Materials
The fresh vacuum packed beef samples that were striploin part were imported from
Longford abattoir located in northern Tasmania, Australia. The vacuum packed beefs
were shipped from Longford in Tasmania to Sapporo in Japan. The samples were stored
at -0.5 °C during shipment with a temperature recorder (RS-14, ESPEC MIC Corp,
Japan) and a trial Maillard reaction based TTI (Fig. 4-1). The shipping test was
conducted twice and the samples after arriving at Sapporo were stored at -0.5 and 4 °C
in our laboratory. Triplicate samples were used for each sampling time for determination
of the beef quality. The initial properties of beef shows in Table 4-1.
Fig. 4-1 State of packing after arrival to Sapporo
Page 94
Application of a developed TTI into shipping and storage for vacuum-packaged beef
- 82 -
Table 4-1 The initial properties of beef
Shipping
period
Storage
temperature
(°C)
Number
Average
Weight
(g)
Average
surface area
(cm2)
pH Microbiological
(log CFU/cm2)
Group A
16-12-16
~
17-01-24
(39 days)
-0.5 24 2438.03
± 374.84
1326.53
± 242.10 5.68 1.79
Group B
17-02-15
~
17-03-27
(40 days)
4 22 1927.74
± 265.71
930.37
± 128.24 5.64 1.54
4.2.2. Drip loss
The drip loss was determined by the ratio of the total weight of sample package
and the difference between the total weight and meat weight. The drip loss was defined
as follows:
where 𝑊0 is total weight and 𝑊𝑚 is sample meat weight.
4.2.3. pH
The pH was determined on the three lean spots for each meat sample using pH
meter (D-51, HORIBA, Japan) with ISFET (ion-sensitive field-effect transistor) pH
electrode (0040-10D, HORIBA, Japan).
Drip loss = 𝑊0 − 𝑊𝑚
𝑊0× 100 (Eq.4-1)
Page 95
Application of a developed TTI into shipping and storage for vacuum-packaged beef
- 83 -
4.2.4. Color of flesh surface
Meat samples after opening the vacuum pack were exposed to ambient air
condition for 10 min prior to analysis. The color value was determined on the lean
surface by the colorimeter (Minolta CR-400 chroma meter, Konica Minolta Sensing,
Inc., Japan) using the CIE scale L* (Lightness), a
* (Red-Green), and b
* (Yellow-Blue).
The color difference (∆E) was defined as follows: (Rowe et al. 2004)
where 𝐿0∗ , 𝑎0
∗ , and b0∗ as initial value that meant the first sample.
4.2.5. Microbiological analysis
Mesophilic viable count on the surface of the meat was determined by the whole
surface of each beef sample. The sample taken out from vacuum pack was transferred to
a sterile plastic bag and was massaged with 50 mL of 1% peptone water for 1 min.
Appropriate serial dilutions (1:10) were performed with sterile 0.1% peptone water and
were plated on duplicate tryptic soy agar (TSA) plates. The plates were then incubated
at 20°C for 5 days. All counts were expressed as log colony forming units per surface
area of beef (log CFU/cm2).
∆E = √(𝐿∗ − 𝐿0∗ )2 + (𝑎∗ − 𝑎0
∗)2 + (𝑏∗ − 𝑏0∗)2 (Eq. 4-2)
Page 96
Application of a developed TTI into shipping and storage for vacuum-packaged beef
- 84 -
4.2.6. Shear force
The specimens (rectangular shape of 2×3×1 cm) were removed from each sample.
Each specimen was sheared by three times perpendicular to the muscle fiber direction
using a rheometer (NRM-2002J, FUDOH, Japan) with a straight-edged blade (0.35 mm
thickness). The straight-edged blade compressed perpendicular to the muscle fiber
direction and with a crosshead speed of 30 cm/min (Nihimura et al. 2008). The
maximum peak force recorded was determined as the shear force.
4.2.7. Amount of 2-thiobarbituric acid reactive substance (TBARS)
Amount of 2-thiobarbituric acid reactive substance (TBARS) which is a byproduct
of lipid peroxidation was determined by the procedure of Witte et al. (1970). A portion
of 5 g sample meat was homogenized by the homogenizer (HG-92G, TAITEC, Japan)
with pure water 15 mL. After filtration using Whatman filter paper No. 1, 1 mL of the
filtrate was mixed with 2 mL of 20 mM 20% trichloroacetic (TCA) solution in 2-
thiobarbituric acid (TBA), and was reacted at 100°C in a water bath for 15 min for color
development. The solution after the color reaction was filtered by 0.45 μm syringe filter
(25AS045AN, ADVANTEC, Japan). The purified solution was dispensed into a 96 well
microplate. The color was deteimned at 530 nm in a microplate absorbance reader
(iMark, BIORAD, USA). The TBA value was defined as mg malonaldehyde (MDA)
per kg of meat.
Page 97
Application of a developed TTI into shipping and storage for vacuum-packaged beef
- 85 -
4.2.8. Cooking loss
The meat specimen (ca. 200 g) with the thickness for 15 mm was cooked in an
oven at 230 °C until the internal temperature reached by 70 °C. K-type thermocouple
connected with a data-logger (MCR-4TC, T&D Corp., Japan) was placed in the center
of specimen to monitor the internal temperature. The weight of each sample was
recorded before and after cooking. Cooking loss was defined as the percentage of the
difference in weight (Mcardle et al. 2010).
4.2.9. Sensory evaluation
The sensory evaluation was examined for drip volume, vacuum state, odor, and
appearance (color) (Shang 2016). Each sensory attribute was scored by a 4-point
descriptive scale. The sensory assessment form used in the present study was shown in
Table 2. In particular, odor and appearance were evaluated in right after opening the
package and 10 min after opening, because persistent odor and color bloom should be
taken into consideration. Furthermore, the appearance was compared with the AUS-
MEAT beef meat standard color (Aus-Meat 2005).
Page 98
Application of a developed TTI into shipping and storage for vacuum-packaged beef
- 86 -
Table 4-2 Sensory assessment form
Date :
Age :
Name :
Drip Vacuum
Odor Appearance
Initial After 10 min Initial After 10 min
4) None 4) Complete 4) Fresh,
no off odor
4) Fresh,
no off odor
4) Very fresh,
Deep red
4) Very fresh,
Deep red
3) Slight 3) Good
vacuum 3) Slight sour 3) Slight sour 3) Light red 3) Light red
2) Acceptable 2) Moderate
vacuum
2) Moderate
sour
2) Moderate
sour
2) Slight
discolouration
2) Slight
discolouration
1) Heavy 1) Poor
vacuum 1) Strong sour 1) Strong sour 1) Poor 1) Poor
0) Extreme 0) No vacuum 0) Off odor 0) Off odor 0) Severe
discolouration
0) Severe
discolouration
Sample 1
Sample 2
Sample 3
Comment
Page 99
Application of a developed TTI into shipping and storage for vacuum-packaged beef
- 87 -
4.2.10. Time-temperature indicator (TTI)
The TTI examined in this study was designed on the basis of the methods for the
Maillard-type TTI developed by Yamamoto and Isshiki (2012) (fig. 4-2). The plastic
pouch is divided into two sections, one of which contains D-xylose solution and another
one contains glycine solution with K2HPO4. Since the separation of two section was
sealed weakly, pushing the both sides strongly to break the seal and mix the both
solutions to start Maillard reaction.
In addition, the concentration of TTIs for shipping was designed on the basis of
storage period for 77 days at 0°C. The 77 day is the expiration date of the vacuum
packaged chilled beef imported from Australia (All Japan Meat Industry Cooperative
Associations 2015). The concentration of D-xylose, glycine, and Na2HPO4 for a TTI
was followed Table 4-3.
Fig. 4-2 A sample time temperature integrator/indicator (TTI)
based on Maillard reaction proposed by Yamamoto
and Isshiki (2012)
Page 100
Application of a developed TTI into shipping and storage for vacuum-packaged beef
- 88 -
Table 4-3 The concentration of reactant for TTIs
Reactant Shipping Storage at -0.5℃ Storage at 4℃
① ② ① ② ① ②
Xylose
(mol/L) 1.0 5.0 1.0 3.0 7.0 1.0
Glycine
(mol/L) 1.0 2.0 2.0 2.5 2.5 1.0
Na2HPO4
(mol/L) 0.2 0.02 0.1 0.01 0.0 0.2
4.2.11. Statistical analysis
SPSS (IBM SPSS Statistics 20, IBM, USA) was used to analyze the significance
using one-way ANOVA. Significant differences among storage conditions were
determined by Tukey’s post hoc comparison test (P < 0.05).
Page 101
Application of a developed TTI into shipping and storage for vacuum-packaged beef
- 89 -
4.3. Results and discussion
4.3.1. Changes in quality of beef after shipping
Aerobic plate count (APC) and pH of the beef samples significantly increased
during shipping. Table 4-4 shows the results of determination of beef quality after
shipping of group A and group B. Although the pH value of the beef surface increased
from 5.68 to 5.94 after shipping, there was no significant difference (p-value > 0.05)
before and after shipping.. The APC value also increased after shipping even under
temperature of -0.5 °C. Since the APC of beefs distributed in Japan in 2011 was
reported 5.61-6.22 log CFU/cm2 in average
(Morita and Kobayashi 2016), which was
higher than those of the measurement value. Moreover, the Microbiological self-
management standard of Japanese Consumers Co-operative Union (JCCU, CO-OP)
(2016) defines the criteria as less than APC of 7.00 log CFU/cm2. Therefore, the beef of
both the group A and B after shipping would arrive without microbiological degradation.
It was considered that group A and group B can be used as the comparison sample
for measurement of quality difference by temperature during storage because the
significant difference does not show between the group A and the group B (p-value >
0.05) at the quality after shipping.
TTIs exhibited arrival without microbiological degradation of beef the change to
light yellow during shipping (Fig. 4-3). This change in light color expresses that the
temperatures during shipping were constant with sufficiently low (Fig 4-4). In case of
the changed of TTI color after shipping to brown or dark brown is mean that beef was
exposed high-temperature and shipped with microbiological degradation.
Page 102
Application of a developed TTI into shipping and storage for vacuum-packaged beef
- 90 -
Table 4-4 The quality value after shipping
Shipping
period
Drip loss
(%) pH
Microbiological
(log CFU/cm2)
Shear force
(N)
TBARS
(mg MDA/kg)
Cooking
Loss
(%)
Group A
16-12-16
~
17-01-24
(39 days)
3.98
± 0.35
5.87
± 0.12
4.88
± 0.49
14.33
± 1.39
1.87
± 0.23
17.86
± 1.55
Group B
17-02-15
~
17-03-27
(40 days)
3.95
± 0.29
6.01
± 0.09
5.09
± 0.26
14.02
± 0.97
1.74
± 0.25
16.82
± 1.82
p-value 0.92 0.14 0.60 0.91 0.29 0.57
Group A
Group B
Fig. 4-3 The TTIs after shipping
Page 103
Application of a developed TTI into shipping and storage for vacuum-packaged beef
- 91 -
Fig. 4-4 The temperature variation during shipping period
-5
-4
-3
-2
-1
0
1
2
3
4
5
0 5 10 15 20 25 30 35 40
Tem
pera
ture
( C
)
Shipping period (d)
Group A
Group B
Page 104
Application of a developed TTI into shipping and storage for vacuum-packaged beef
- 92 -
4.3.2. Drip loss
The drip loss of vacuum-packaging beef increased as the storage period and the
temperature increased (Fig. 4-5). Additionally, the changes in drip loss during storage at
-0.5 and 4°C showed the maximum value of 8.07% at day 86 and 6.69% at day 21,
respectively.
The increase in drip loss as the storage period prolonged was also reported by
various studies such as Lagerstedt et al. (2011), Laroque et al. (2008), and Payne et al.
(1998). The increase in drip loss would be due to the decrease in the water-holding
capacity of the muscle fiber structure and/or the denaturation of the proteins (Leygonie,
Britz, and Hoffman 2012). In addition, the increase in drip loss at a higher temperature
would be due to progress in proteolysis at higher storage temperature (Hertog-Meischke
et al. 1998).
Page 105
Application of a developed TTI into shipping and storage for vacuum-packaged beef
- 93 -
0
1
2
3
4
5
6
7
8
9
10
0 25 50 75 100 125 150 175 200
Dri
p l
oss (
%)
Storage period (d)
4 °C
- 0.5 °C
Fig. 4-5 Drip loss variation during storage period. Error bars indicate standard
error (n=3)
Page 106
Application of a developed TTI into shipping and storage for vacuum-packaged beef
- 94 -
4.3.3. pH, Color, TBARS
The pH, color values (L*, a*, and b*) and TBARS value showed no significant
changes in all storage conditions (p-value > 0.05).
Ko and Yang (2001) reported that the increase of pH values during the progress of
storage period is occurred because of accumulation of proteolytic products by enzymes
and microorganisms in muscle. But the vacuum-packaging inhibits proliferation of the
aerobic bacteria and the spoilage bacteria by lack oxygen (Beebe et al. 1976; Ercolini et
al. 2011). Thus, the insignificant variation of the pH values was considered by the
production inhibition of the proteolytic products and the aerobic bacteria under a
vacuum-packaging.
The changes in color of meat during storage would be occurred by various
parameters such as pH, temperature, oxygen tension, lipid oxidation, and stress before
slaughter etc. (Bala et al. 1977; Jeong et al. 2006). The insignificant variation of color
value was considered by inhibition those parameters under storage using vacuum-
packaging and low-temperature around 0°C. In fact, Lee and Yoon (2001) and Moon
(2005) reported about the insignificant variation of color value for the beef stored in
0°C with vacuum-packaging. In addition, Samouris et al. (2002), Cayuela et al. (2004),
and Popova et al. (2009) reported as no statistically significant differences in TBARS
values of the vacuum-packaged meats between the first and last days of storage. This
result is because that the low levels of oxygen by vacuum-packaging inhibit lipid
oxidation (Smiddy et al. 2002; Cayuela et al. 2004)
Page 107
Application of a developed TTI into shipping and storage for vacuum-packaged beef
- 95 -
Fig. 4-6 pH value variation during storage period. Error bars indicate standard
error (n=3)
5.0
5.5
6.0
6.5
7.0
0 25 50 75 100 125 150 175 200
pH
(-)
Storage period (d)
- 0.5 °C
4 °C
Fig. 4-7 TBARS(2-thiobarbituric acid reactive substance) variation during
storage period. Error bars indicate standard error (n=3)
0.0
0.5
1.0
1.5
2.0
2.5
3.0
3.5
0 25 50 75 100 125 150 175 200
TB
AR
S (
mg
MD
A /
kg
)
Storage period (d)
- 0.5 °C
4 °C
Page 108
Application of a developed TTI into shipping and storage for vacuum-packaged beef
- 96 -
0
2
4
6
8
10
12
14
16
18
0 25 50 75 100 125 150 175 200
b*
(-)
Storage period (d)
- 0.5 °C
4 °C
0
5
10
15
20
25
30
0 25 50 75 100 125 150 175 200
a*
(-)
Storage period (d)
- 0.5 °C
4 °C
Fig. 4-8 Color variations during storage period. Error bars
indicate standard error (n=3)
0
5
10
15
20
25
30
35
40
45
50
0 25 50 75 100 125 150 175 200
L (
-)
Storage period (d)
- 0.5 °C
4 °C
Page 109
Application of a developed TTI into shipping and storage for vacuum-packaged beef
- 97 -
4.3.4. Microbiological analysis
The aerobic plate counts (APC) of vacuum-packaging beef increased by almost
7.00 log CFU/cm2 for 85 days storage at -0.5°C (6.95 log CFU/cm
2) and for 21 days
storage at 4°C (Fig. 4-9). The APC of 7.00 log CFU/cm2 is supposed to be occurrence of
odor (Meat and livestock Australia 2014) and is used the criterion for microbiological
management (All Japan Meat Industry Cooperative Associations 2015; Japanese
Consumers Co-operative Union 2016). Therefore, storage for 85 days at -0.5°C and for
21 days at 4°C were considered to be storage limits for vacuum-packaging beef.
The maximum population density of the APC during storage was around 8.00 log
CFU/cm2. This result was agrees with previous studies on vacuum-packaging beef such
as Seideman and Durland (1983), Bożena et al. (2011), Ercolini et al. (2011), and
Hernández-Macedo et al. (2011).
Page 110
Application of a developed TTI into shipping and storage for vacuum-packaged beef
- 98 -
Fig. 4-9 The microbiological variation during storage period. Error bars
indicate standard error (n=3)
0
1
2
3
4
5
6
7
8
9
10
0 25 50 75 100 125 150 175 200
Ae
rob
ic p
late
co
un
ts (
log
CF
U/c
m2)
Storage period (d)
-0.5°C
4°C
Page 111
Application of a developed TTI into shipping and storage for vacuum-packaged beef
- 99 -
4.3.5. Shear force
Shear force of beef decreased as the storage period prolonged, in particular the
decrease was remarkable at higher (4°C) storage temperature (Fig. 4-10). The decrease
of shear force was also reported by Lee and Yoon (2001) and Moon (2005). The
decrease would be attributed by moisture contents, degeneration of protein or lipid
(Park et al. 2016).
However, the shear force would be an inappropriate criterion for determining
shelf-life, because there might be a possibility of decrease in shear force even after
spoilage. In fact, the decomposed sample stored at -0.5°C for 118 days did not show any
irregular value of shear force unlike the drip loss, pH, and APC. In addition, the shear
force of the samples stored at 4°C continuously decreased without particular trend.
Page 112
Application of a developed TTI into shipping and storage for vacuum-packaged beef
- 100 -
Fig. 4-10 The shear force variation during storage period. Error bars indicate
standard error (n=3)
4
6
8
10
12
14
16
18
0 25 50 75 100 125 150 175 200
Sh
ea
r fo
rce
(N
)
Storage period (d)
- 0.5 °C
4 °C
Page 113
Application of a developed TTI into shipping and storage for vacuum-packaged beef
- 101 -
4.3.6. Cooking loss
Cooking loss of beef represented the amount of decrease of meat juice during
cooking process at 230°C. Although the beef stored at -0.5°C did not show significant
changes in cooking loss during 21-96 days(p = 0.648), the amount of cooking loss
rapidly increased after 118 days storage. Furthermore, the cooking loss of the beef
stored at 4°C rapidly increased from 17.08 % to 22.52 %after 21 days storage (Fig. 4-
11). Bhattacharya and Hanna (1989), Farouk et al. (2004), and Ko and Yang (2001) also
reported that the cooking loss increased as the storage period prolonged. The cause of
increase in cooking loss would be related to the decrease in water holding capacity of
beef muscle in common with the phenomena of drip loss. Rapid increase in the cooking
loss appeared on 111 days at -0.5°C and 21 days at 4°C might be attributed to protein
denaturation induced by spoilage with bacterial growth.
The trend of the changes in drip loss, APC, and cooking loss was similar as such
the maximum value appeared on 111 days storage at -0.5°C and on 21 days storage at
4°C. Therefore, these storage periods at each temperature would be considered as a
criterion of shelf life of beef, which will be corresponded to color change in TTI for the
vacuum-packaging beef
Page 114
Application of a developed TTI into shipping and storage for vacuum-packaged beef
- 102 -
Fig. 4-11 Cooking loss variation during storage period. Error bars indicate
standard error (n=3)
0
5
10
15
20
25
30
35
0 25 50 75 100 125 150 175 200
Co
ok
ing
lo
ss
(%
)
Storage period (d)
- 0.5 °C
4 °C
Page 115
Application of a developed TTI into shipping and storage for vacuum-packaged beef
- 103 -
4.3.7. Sensory evaluation
The results of sensory evaluation were shown in Fig. 4-12 (a)-(d). The most
important aspect of the sensory evaluation for judgement of the shelf life of beef is
score of odor and appearance. Off-odors and discoloration are typical criterion for
decision of food spoilage or shelf-life (Blixt and Borch 1999). The both odor and
appearance score of the beef stored at -0.5°C rapidly decreased after 86 days storage.
Moreover, the odor and appearance score of the beef stored at 4°C decreased after
21days storage. Thus, the storage at -0.5°C for 111 days and the storage at 4°C for 21
days would be considered as a criterion of shelf-life for vacuum-packaging beef.
Page 116
Application of a developed TTI into shipping and storage for vacuum-packaged beef
- 104 -
Fig. 4-12 Sensory score variation during storage period. Error bars indicate standard error (n=3)
0
1
2
3
4
0 25 50 75 100 125 150
Se
ns
ory
sc
ore
-D
rip
(-)
Storage period (d)
(a)
- 0.5 °C
4 °C
0
1
2
3
4
0 25 50 75 100 125 150
Sen
so
ry s
co
re -
Va
cu
um
(-)
Storage period (d)
(b)
- 0.5 °C
4 °C
0
1
2
3
4
0 25 50 75 100 125 150
Sen
so
ry s
co
re -
Od
ou
r (-
)
Storage period (d)
(c)
-0.5°C-Initial 4°C-Initial
-0.5°C-After 10 min 4°C-After 10 min0
1
2
3
4
0 25 50 75 100 125 150
Se
ns
ory
sc
ore
-A
pp
ea
ran
ce
(-)
Storage period (d)
(d)
-0.5°C-Initial 4°C-Initial
-0.5°C-After 10 min 4°C-After 10 min
Page 117
Application of a developed TTI into shipping and storage for vacuum-packaged beef
- 105 -
4.3.8. Application of TTI
The quality of vacuum packing beef stored at -0.5°C and 4°C significantly changed
for 86-111 days and 21-28 days, respectively, as described in the previous sections.
Based on these results, we assumed that the shelf-life of beef with vacuum-packaging
was 111 days at -0.5°C (150 days including shipping period) and 28 days at 4°C (68
days including shipping period).
Meanwhile, the changes in color of the examined TTI appropriately reflected the
shelf-life of beef with vacuum-packaging (Table 4-5). The brown and yellow color of
the examined TTI for stored beef at -0.5°C was clearly appeared on 111 days storage.
Moreover, the color of the examined TTI for stored beef at 4°C was clearly appeared on
28 days storage. The changes in the TTI’s colors from colorless, light blue, to light
brown appeared before 111 and 28 days storage at -0.5°C and 4°C, respectively. These
color change allows to estimate the safety of vacuum-packaging beef or to confirm and
predict the shelf-life of the beef. Furthermore, the color such as dark brown or dark
yellow appeared after 111 or 28 days storage would enable to indicate the quality
degradation or the spoilage of beef.
However, the concentrations of reactant in the examined TTI would be needed to
adjust for more suitable color change for the shelf-life of vacuum-packaging beef,
because the examined TTIs in this study were developed on the basis of on 77 days for
0°C or 30 days for 5°C, which are current guidelines for beef distribution.
The examined TTIs did not provide exact remaining shelf-life and quality
degradation level, because the TTIs showed just only the color. To recognize remaining
shelf-life and quality degradation level from the color change of TTI, a dedicated
method or tool for color recognition will be necessary for offering various information.
Page 118
Application of a developed TTI into shipping and storage for vacuum-packaged beef
- 106 -
Table 4-5 The color variation in a made TTI (Time-Temperature indicator)
-0.5 °C
21 days
41 days
57 days
86 days
111 days
161 days
4 °C
7 days
14 days
21 days
28 days
35 days
42 days
Page 119
Application of a developed TTI into shipping and storage for vacuum-packaged beef
- 107 -
4.4. Conclusion
The relationship between the quality change of vacuum-packaged beef during
shipping and storage and the color change in the developed TTI was investigated for
clarifying the availability of the examined TTI for a real shipping and storage site of
vacuum-packaged beef.
The TTIs examined for shipping appeared light yellow when arrival. The light
yellow indicated that the temperatures during shipping were overall constant with
sufficiently low. In addition, the color of the examined TTIs appropriately indicated for
the shelf-life of the stored beef with vacuum-packaging. However, the TTI can be
improved for more suitable color change corresponding to the shelf-life of vacuum-
packaging beef.
Page 120
Application of a developed TTI for visualization of heating state of processed foods
- 108 -
Chapter 5 Application of a developed TTI for visualization of
heating state of processed foods
5.1. Introduction
Most consumers are demanding safer and higher quality raw and processed foods.
To correspond to the consumers’ demands and also complicated distribution chain, food
processors and distributors are focusing on quantitative monitoring and controlling
critical points throughout food chain. In response to such demands, food industry began
to seek solutions through an effective food safety management system (FSMS) that is
based on controlling, monitoring, and recording the critical parameters (Lim et al. 2014;
Nychas et al. 2016). One of the most successful representative system is Hazard
Analysis and Critical Control Points (HACCP) (Kafetzopoulos et al. 2013; Khandke
and Mayes 1998). In addition, concepts of the appropriate level of protection (ALOP)
and the food safety objective (FSO) have been proposed (FAO/WHO 2014; ICMSF
2002) to establish a link between public health outcomes and metrics in the food chain
(Koutsoumanis and Gougouli 2015). Although systems for ensuring food safety
mentioned above have been proposed so far, there are occasional failures to prevent
microbial and/or chemical contamination of food products, which leads to reduced
confidence among consumers (Nychas et al. 2016).
Escherichia coli O157:H7 outbreaks have mainly been associated with the
consumption of undercooked ground beef patties (Rhee et al. 2003; Nair et al. 2016).
Since E. coli O157:H7 is not highly thermal resistant, certain cooking to meet a
recommend internal temperature would be able to ensure the safety of food product.
However, attainment of the recommended cooking temperature might be difficult. For
example, Bogard et al. (2013) reported that a majority (77%) of managers of the 385
Page 121
Application of a developed TTI for visualization of heating state of processed foods
- 109 -
restaurants did not always measure the final cook temperatures of hamburgers with a
thermometer, and twelve percent of the hamburgers were undercooked (cooked to
68.3°C). A survey by the United States Department of Agriculture (USDA) on
hamburger cooking practices revealed that 20% of the participants cooked patties rare
or medium rare (USDA 2002), which could result in the survival of E. coli O157:H7
(Nair et al. 2016). The use of thermometers to determine meat temperature during
cooking of beef patties has been limited (National Cattlemen’s Beef Association, 1999)
due to the inconvenience and uncertainly about the value of the procedure USDA 2002).
Even though predictive microbiology models describing thermal death behaviors of
pathogenic microorganisms in foods could make easier setting of thermal cooking
condition, proper thermal management is not necessarily performed based on the
predictive model prediction. One of the reason would be due to lack of appropriate
temperature monitoring procedure. Thus, a development of hardware has been needed
to simply and visually monitor temperature history during thermal processing
(Koutsoumanis and Gougouli, 2015).
Time temperature integrators/indicators (TTIs) are one of the promising
technologies for monitoring temperature history of food products (Koutsoumanis and
Gougouli 2015). Thus, we designed the present study to develop a TTI for monitoring
thermal management during cooking. Japanese Ministry of Health, Labour and Welfare
(JMHLW) have been proposed that a core temperature of meat products at least 75 °C is
reached and holding for more than 1 min. In the present study, we targeted this criterion
for evaluation of thermal processing. To develop TTIs for monitoring thermal
management during cooking, following problems should be solved; (1) TTIs are
applicable for the various temperature conditions and rising temperature. (2) The
Page 122
Application of a developed TTI for visualization of heating state of processed foods
- 110 -
changes in color of TTIs can be easily evaluated. (3) Predictions of changes in color of
TTIs can be obtained both at constant and fluctuating temperature.
Maillard-reaction based TTI would have a possibility to solve the above
problems. For temperature management during cooking, Maillard-reaction based TTI
has following some advantages;
・Consumer-friendly tool to monitor
・No need to keep the TTI cool before use (Rokugawa and Fujikawa, 2015)
・Adjustable the kinetics of the color change by changing the concentrations of
both the reducing sugar and amino acid solutions for the TTI
・Enabling to predict the changes in color by kinetic models
The objective of this study was to develop a Maillard-reaction based TTI for
monitoring temperature history during cooking. In particular, to ensure sufficient
heating of internal temperature of a meat product such as hamburger, we targeted a
criterion of 75°C for more than 1 min suggested by JMHLW.
We investigated conditions of Maillard reaction which show obvious color change
at 75°C for 1 min in water bath. In hamburgers, the color variation of TTI was evaluated
in a real heating process. In addition, the changes in color were analyzed quantitatively
and developed a predictive model for color changes as a function of temperature and
time. The performance of the developed models was validated under fluctuating
temperature conditions in water bath and also in hamburgers.
Page 123
Application of a developed TTI for visualization of heating state of processed foods
- 111 -
5.2. Materials and methods
5.2.1. Chemicals for Maillard reaction
As per Yamamoto and Isshiki (2012) and Laroque et al. (2008), we used
combinations of D-xylose and glycine (both from Nacalai Tesque, Inc., Kyoto, Japan) or
D-ribose and L-lysine (both from Wako Pure Chemical Industries, Ltd., Osaka, Japan),
respectively, to create highly reactive Maillard reaction systems and investigated the
effects of the concentration of both the reducing sugar (1.0 to 7.0 M) and the amino acid
(1.0 to 3.0 M) on the color variation of the reaction. In addition, 0.5 M dipotassium
phosphate (K2HPO4; Kanto Chemical Co., Inc., Tokyo, Japan) was used to achieve a
suitable reaction rate. These concentrations were based on the solubility of each reagent
and the aforementioned studies.
5.2.2. Changes in color by Maillard reaction under heating conditions
The solution of the reducing sugar and the solution containing the amino acid and
K2HPO4 were placed in separate glass tubes and heated in a water bath consisting of a
styrofoam box (240 mm × 156 mm × 170 mm) and a heater (Thermo-Mate BF400,
Yamato Scientific Co., Ltd., Tokyo Japan). Aliquots of the solutions (500 μL of each)
were pipetted and mixed in another glass test tube placed in the water bath, thus
initiating the Maillard reaction at the set temperature.
Page 124
Application of a developed TTI for visualization of heating state of processed foods
- 112 -
5.2.3. Monitoring of the color variation of the Maillard reaction at constant
temperatures
To establish the temperature dependency of the color variation in the Maillard
reaction, we examined changes in color under isothermal conditions at various
temperatures (45, 55, 65, 75, 85, and 90°C). Color variations were recorded by
automatically taking pictures at intervals of 2 s using the built-in digital camera
(resolution, 1920 × 1080 pixels; aperture, f/2.2; focal length, 4.00 mm) of an iPhone 5s
(Apple, Inc., Cupertino, CA, USA) that had been fitted on the lid of the water bath. Use
of the lid was necessary in order to block off environmental light. The camera was set at
optimized exposure conditions to obtain the best determination performances, i.e.,
automatic white balance and automatic sensitivity (ISO speed, 160).
5.2.4. Analysis and prediction of color variation
Color variations recorded by the digital camera were analyzed and expressed in the
RGB color system for objective assessment. It is easy to obtain RGB data from digital
pictures, avoiding the use of color-measuring instruments such as L*a
*b
* colorimeters.
Image analysis was performed using the R statistical environment (v3.2.0) running in R
studio (v1.0.44). Color variation (Red, Green, or Blue value) at a constant temperature
was described as a modified logistic equation as follows:
where 𝐶𝑣 is the color in the RGB system (R, G, or B value), Δ𝐶𝑣 is the difference
𝐶𝑣 [𝑅, 𝐺, 𝐵] = −∆C𝑣
1 + exp (−µmax(𝑡 − Tinf)) (Eq.5-1)
Page 125
Application of a developed TTI for visualization of heating state of processed foods
- 113 -
between the maximum and the minimum value of 𝐶𝑣, 𝜇𝑚𝑎𝑥 is the maximum change
rate (of R, G, or B), t is time elapsed (s), and 𝑇𝑖𝑛𝑓 is the time of the inflection point of
the kinetics (s).
Each parameter obtained by fitting the data of the process to Eq. 5-1 was described
by multiple regression analysis as a function of the concentration of the reactants and
the reaction temperature as follows:
where Conc is the concentration of the reactants and Temp is the reaction
temperature. Accordingly, changes in 𝐶𝑣 at fluctuating temperature, which must be
taken into account when considering temperature history, can be numerically calculated
by substituting the corresponding parameter in Eq. 5-1 with Eq. 5-2.
5.2.5. Color variation in Maillard reaction under rising temperature conditions
To confirm the predictions of the mathematical model regarding the color changes
of a Maillard reaction in a real heating process, the color variation was monitored
during heating at rising temperature (20–90°C), using the equipment described in
section 5.2.3. The temperature in a test tube containing both the reducing sugar and the
amino acid was monitored by using a type K thermocouple connected to a data logger
(Multichannel Recorder MCR-4TC; T&D Corporation, Nagano, Japan). Color
variations were analyzed as described in section 5.2.4.
𝑃𝑎𝑟𝑎𝑚𝑎𝑡𝑒𝑟[𝐶𝑣, 𝑇𝑖𝑛𝑓 , 𝜇𝑚𝑎𝑥]
= 𝑎0 + 𝑎1 × 𝑇𝑒𝑚𝑝 + 𝑎2 × 𝐶𝑜𝑛𝑐 + 𝑎3 × 𝑇𝑒𝑚𝑝 × 𝐶𝑜𝑛𝑐 (Eq.5-2)
Page 126
Application of a developed TTI for visualization of heating state of processed foods
- 114 -
5.2.6. Practical application of Time-temperature indicator (TTI) in hamburger cooking
In order for a TTI to be suitable for thermal monitoring during cooking, its color
changes should take place on a time scale relevant to the cooking process. Therefore,
the time necessary for switching between TTI color variations was determined in an
actual hamburger cooking process. All the ingredients used to prepare the patties (Table
5-1) were purchased from a local retailer. They were placed in a sterile stainless bowl,
where they were folded 50 times and mixed 300 times using a rubber spatula. Afterward,
the mix was divided into 100-g portions, which were shaped into patties (ca. 2.0 cm in
thickness, 8 cm in diameter).
Table 5-1 Composition of examined hamburger
Ingredient Weight (g)
Ground beef and pork 200.00
Chopped onion 100.00
Milk 20.00
Egg 20.00
Breadcrumbs 20.00
Salt 2.00
Pepper 0.02
The TTI examined in this study was based on the principles of the Maillard-type
TTI developed by Yamamoto and Isshiki (2012) and consisted of two sterile transparent
pouches (both 15 mm × 25 mm × 1 mm), one of which (A) contained 100 μL of the
d-ribose solution, while the other (B) had 100 μL of the l-lysine/K2HPO4 solution. All
the solution was filter-sterilized (pore size 0.22 μm) before placing into the pouch. The
Page 127
Application of a developed TTI for visualization of heating state of processed foods
- 115 -
reaction was initiated by manually breaking the seal between the pouches.
Patties were held at 20 °C in an incubator. A type K thermocouple (connected with
MCR-4TC Multichannel Recorder) and the Maillard-type TTI were inserted into the
center of the hamburger patty, and the patties were cooked individually in a steam
convection oven (HEALSIO AX-CX3; SHARP, Tokyo, Japan) at 230 °C. The center of
the hamburgers was heated at 75 °C for 1 min. Immediately after the 1-min stand, the
color variation of the indicator was observed with the naked eye and photographed with
the digital camera.
5.2.7. Thermal inactivation of Escherichia coli O157:H7 in hamburgers
We used four strains of E. coli O157:H7 (RIMD 0509939, RIMD 05091896,
RIMD 05091897, and HIPH 12361) in this study that were kindly provided by the
Research Institute for Microbial Diseases (RIMD) of Osaka University and the
Hokkaido Institute of Public Health (HIPH). The strains were maintained at − 80 °C in
tryptic soy broth (TSB) containing 10% glycerol. A platinum loop was used to streak
bacteria from the frozen bacterial cultures on tryptic soy agar (TSA) plates. The
inoculated plates were incubated at 37 °C for 24 h, and then, an isolated colony of each
bacterium was transferred to fresh 5 ml TSB in a sterile plastic tube. The cultures were
transferred using loop inoculation through two successive 24-h intervals to obtain more
homogeneous and stable cell populations. Grown cells were collected by centrifugation
(3000×g, 10 min), and the resulting pellets were washed with sterile 0.1% peptone
water to remove traces of the TSB medium. After the wash, bacteria were resuspended
in peptone water to a concentration of 8~9 log CFU/mL. The resuspensions of the four
strains were mixed to prepare culture cocktails that were used for inoculations.
Page 128
Application of a developed TTI for visualization of heating state of processed foods
- 116 -
Hamburger samples were prepared as described in section 2.6 and divided into
300-g batches. Each batch was inoculated with 3 mL of E. coli O157:H7 cocktail,
resulting in a bacterial density of 6~7 CFU/g, mixed 150 times using a rubber spatula in
a sterile stainless bowl, and then divided into three hamburger patties, which were
cooked as described in section 2.6. Immediately after the 1-min hold at the target
internal temperature of 75 °C, hamburgers were immediately placed into sterile plastic
bags and plunged into a water/ice mixture to cool. Afterward, they were divided into
25-g samples that were suspended in 225 mL of 0.1% peptone water and homogenized
by a stomacher (Stomacher 400-T; Seward, Worthing, UK) for 60 s. Serial 10-fold
dilutions of the suspended samples were prepared in 0.1% peptone water, and 100-μL
aliquots were spread on duplicate (TSA) plates, which were incubated at 37 °C for 24 h
and then examined for the presence of colonies. The experiment was conducted in
triplicate.
Page 129
Application of a developed TTI for visualization of heating state of processed foods
- 117 -
5.3. Results and discussion
5.3.1. Selection of Maillard reaction substrates
Measuring the internal temperature of a food product is not sufficient for
evaluating the effectiveness of a thermal cooking process, as it does not guarantee that
the product remained at an adequately high temperature for sufficient time to ensure
safe consumption. Thus, we need a procedure that not only monitors temperature but
also indicates temperature history during cooking. A TTI showing an easily measurable,
time- and temperature-dependent change reflecting the full or partial temperature
history of a food product would be ideal for the thermal monitoring of the cooking
process (Koutsoumanis and Gougouli 2015). As mentioned above, clear color change
when heated at 75 °C for 1 min was set as the criterion for choosing a Maillard reaction
system for use in the evaluation of food thermal processing. Fig. 5-1 shows the temporal
changes in the color of a reaction system consisting of 7.0 M D-xylose, 3.0 M glycine,
and 0.5 M K2HPO4. As the color of the solution did not display considerable change
after 1 min at 75 °C (the change was not very intense even after 2 min), we abandoned
D-xylose/glycine reaction systems as a potential base for our TTI.
Fig. 5-1 Temporal color changes in a Maillard reaction system containing 7.0 M
D-xylose, 3.0 M glycine, and 0.5 M K2HPO4, placed in a water bath at 75 °C
Page 130
Application of a developed TTI for visualization of heating state of processed foods
- 118 -
We repeated the test with a Maillard reaction system consisting of 7.0 M D-ribose,
3.0 M L-lysine, and 0.5 M K2HPO4. As seen in Fig. 5-2, the color of the solution
displayed obvious changes after 1 min at 75 °C. For this reason, D-ribose/L-lysine
systems were chosen for further analysis, namely the evaluation of the most suitable
combination of substrate concentrations. First, we examined the effect of the
concentration of D-ribose (1.0–7.0 M) on the reaction time it takes for the solution to
turn brown (R < 0.6, G < 0.3, and B < 0.1 in the RGB color system) at 75 °C, in the
presence of 3.0 M L-lysine and 0.5 M K2HPO4. As shown in Fig. 5-3, increasing the
concentration of D-ribose above 3.0 M did not lead to considerable higher reaction
rates; thus, this concentration of ribose was adopted.
Next, we examined the effect of various concentrations of L-lysine (1–3 mg/kg) on
the temporal changes in color observed at 75 °C in the presence of 3.0 M D-ribose and
0.5 M K2HPO4. As shown in Fig. 5-4, the changes in color were L-lysine
concentration-dependent, with 3.0 M L-lysine giving the clearest color differences
under the specified conditions. Therefore, we decided to adopt a Maillard reaction
system of 3.0 M D-ribose, 3.0 M L-lysine, and 0.5 M K2HPO4, as it provides clear
visual information for the achieving the desired thermal condition.
Page 131
Application of a developed TTI for visualization of heating state of processed foods
- 119 -
Fig. 5-2 Temporal changes of color in a Maillard reaction system containing 7.0 M
D-ribose, 3.0 M L-lysine, and 0.5 M K2HPO4, placed in a water bath at
75 °C
Fig. 5-3 Effect of D-ribose concentration (1.0–7.0 M) on the reaction time
needed for a solution containing 3.0 M L-lysine and 0.5 M K2HPO4 to
turn brown (R < 0.6, G < 0.3, and B < 0.1 in the RGB color system) at
75 °C
0
50
100
150
200
0 1 2 3 4 5 6 7 8
Tim
e t
o b
row
nin
g(s
)
Ribose concentration (M)
Page 132
Application of a developed TTI for visualization of heating state of processed foods
- 120 -
Fig. 5-4 Temporal changes of color in Maillard reaction systems containing 3.0
M D-ribose, 1.0–3.0 M L-lysine, 0.5 M K2HPO4, and various
concentrations of lysine (1.0–3.0 M) at 75 °C
Page 133
Application of a developed TTI for visualization of heating state of processed foods
- 121 -
5.3.2. Color change kinetics analysis
We performed a kinetics analysis of the color displayed by the adopted Maillard
reaction system (3.0 M D-ribose, 3.0 M L-lysine, and 0.5 M K2HPO4) when heated at a
constant temperature by taking digital photographs and using them to express the colors
in the RGB system. The tested temperatures were 45, 55, 65, 75, 85, and 90 °C. The
obtained color variations at all temperatures were accurately described by a modified
logistic equation (Eq. 5-1), regardless of the tested conditions, as indicated by the low
value (< 0.06) of the small root mean squared error (RMSE). Since the fitted parameters,
T𝑖𝑛𝑓, and µ𝑚𝑎𝑥 changed exponentially with temperature, their logarithmic values were
used for multiple regression analysis as described in Eq. 5-2. The multiple regression
parameters for T𝑖𝑛𝑓 and µ𝑚𝑎𝑥 are summarized in Table 5-2. The logarithmic values of
both T𝑖𝑛𝑓 and µ𝑚𝑎𝑥 had a high goodness-of-fit under the tested temperature
conditions, as indicated by their R2 values (> 0.98). The fitted parameter (∆𝐶𝑣) was
almost constant at these temperatures, with an average value of 0.75 ± 0.03. Replacing
the parameters in Eq. 5-1 with Eq. 5-2 allows describing the color as a function of
temperature and reagent concentration.
Page 134
Application of a developed TTI for visualization of heating state of processed foods
- 122 -
Table 5-2 Estimated model parameters for the logarithms of 𝛍𝒎𝒂𝒙
and 𝐓𝒊𝒏𝒇 in
the modified logistic equation describing the color variation of a Maillard
reaction system consisting of 7.0 M D-ribose, 3.0 M L-lysine, and 0.5 M
K2HPO4 at constant temperature (45–90 °C). R2, correlation coefficient
Color Parameter
Coefficients
R2
a0 a1 a2 a3
R
µmax -12.2672 0.091844 0.356467 0.004103 0.990261
Tinf 13.97426 -0.09929 -0.476 -0.0000865 0.99616
G
µmax -12.1821 0.099285 0.48146 0.000472 0.989732
Tinf 13.54573 -0.10227 -0.4955 0.001048 0.994449
B
µmax -11.8926 0.106592 0.721061 -0.00395 0.991147
Tinf 12.23882 -0.09626 -0.44248 -0.00013 0.994835
Fig. 5-5 A representative plot of the predicted (solid lines) and the observed
(dashed lines) temporal changes in the R, G, and B values (colored red,
green, and blue, respectively) of a Maillard reaction system containing
7.0 M D-ribose, 3.0 M L-lysine, and 0.5 M K2HPO4 at a constant
temperature of 75 °C
Page 135
Application of a developed TTI for visualization of heating state of processed foods
- 123 -
5.3.3. Experimental validation of the developed model
We tested the accuracy of the developed model in predicting temporal color
changes. Figure 5-6 shows the observed and the predicted color changes of a Maillard
reaction performed at rising temperature in test tubes, both expressed as RGB values.
Overall, there was a good agreement between the predicted and the observed RGB
values (RMSE < 0.009). We conclude that the developed model can indeed predict the
changes in the color of a Maillard reaction performed under arbitrary heating
conditions.
Fig. 5-6 A plot of the predicted (solid lines) and the observed (dashed lines)
reductions in the R, G, and B values (colored red, green, and blue,
respectively) in a Maillard reaction system containing 7.0 M D-ribose,
3.0 M L-lysine, and 0.5 M K2HPO4, placed in a water bath at rising
temperature (20 to 90 °C). The black solid line shows the temperature
history during the heating process
Page 136
Application of a developed TTI for visualization of heating state of processed foods
- 124 -
Using a real heating process, we demonstrated that the color change of the
Maillard reaction in a D-ribose/L-lysine system provides clear visual information for
evaluating thermal processes. By optimizing various parameters that are known to affect
the Maillard reaction, such as the type and concentrations of sugar and amino acid
(Laroque et al. 2008), the pH (Martins et al. 2000), and metal ions (Ramonaitytė et al.
2009), we developed a TTI based on a D-ribose/L-lysine Maillard reaction system for
the evaluation of thermal processes.
5.3.4. Performance of the Maillard eaction as a TTI for hamburger cooking
To validate the performance of the Maillard reaction-based TTI for the thermal
evaluation of an actual cooking process, we examined its color change while cooking
hamburgers. The TTI satisfied the set criterion, as its color clearly changed from light
yellow to brown during the 1-min hold at 75 °C (Fig. 5-7). Thus, our Maillard-based
TTI can successfully provide visual information for evaluation of thermal processes. In
addition to observation with the naked eye, we analyzed the digital photographs of the
TTI shown in Fig. 5-7 to quantitatively evaluate the color changes of the TTI in the
hamburger during the cooking process. By the time that the internal temperature of the
hamburger reached the target temperature of 75 °C, no significant changes in the color
of the TTI had yet been observed, either with the naked eye or by analysis of the RGB
values from the digital pictures (changes in RGB values were lower than 0.04). In
contrast, color changed significantly after 1 min at 75 °C (R: 0.18, G: 0.40, B: 0.34).
Notably, as shown in Table 5-3, there was a significant discrepancy between the
predicted and the observed color at the end of the 1-min hold at 75 °C.
Page 137
Application of a developed TTI for visualization of heating state of processed foods
- 125 -
Table 5-3 Comparison between the RGB values observed in a Maillard-based TTI
consisting of 7.0 M D-ribose, 3.0 M L-lysine, and 0.5 M K2HPO4 that was
placed in the core of a hamburger during the cooking process and those
predicted by the developed mathematical model
Reached at 75℃ After 1 min holding at 75℃
Observed Predicted Observed Predicted
R 0.74 0.79 0.60 0.78
G 0.74 0.76 0.34 0.74
B 0.50 0.52 0.04 0.38
Images
Fig. 5-7 Colors of the Maillard-based TTI at the beginning and the
end of the 1-min hold at 75 °C, during a hamburger’s
cooking process
Page 138
Application of a developed TTI for visualization of heating state of processed foods
- 126 -
The most important advantage of our TTI is that it enables the user to easily
quantify the integrated time-temperature effect without the need for special instruments,
as shown in Fig. 5-6. However, measurable values are required for the objective
evaluation of color changes. Thus, we used digital photos taken by a smartphone camera
to express the color variations in the RGB color system. The kinetics of color changes
are usually evaluated in the CIE L*a*b* color space (Mendoza et al., 2006; Vaikousi et
al. 2009; Rokugawa and Fujikawa 2015). However, it is difficult to relate L*a*b*
values with images observed with the naked eye. Another disadvantage is the need for a
dedicated colorimeter. These factors, combined with our objective of developing a
smartphone application for evaluating the appropriateness of the cooking process by
analyzing digital photos, made us choose the RGB system.
5.3.5. Confirmation of thermal inactivation E. coli O157:H7 in hamburgers
The initial bacterial load of the inoculated hamburgers was 6.09 ± 0.08 log CFU/g.
After 1 min at 75 °C, the bacterial load in all patties, including those that had been
inoculated, had fallen below the detectable level (< 1 log CFU/g). With respect to E.
coli O157:H7 strains, no viable cells were found in any of the cooked patties, even in
those that had been inoculated. We conclude that heating the hamburgers at 75 °C for 1
min was indeed sufficient for eliminating E. coli O157:H7 (Cassin et al. 1998;
Amalaradjou et al. 2010).
The most important characteristic of our TTI is that it does not change color while
being heated to 75 °C, but only after spending 1 min at that temperature. Thus, our
system allowed verification of both reaching the targeted temperature and being
subjected to it long enough for microbial inactivation to occur. Indeed, E. coli O157:H7
Page 139
Application of a developed TTI for visualization of heating state of processed foods
- 127 -
in inoculated hamburgers was eliminated after cooking at 75 °C for 1 min. This finding
indicates that our TTI has the potential of improving the microbiological safety of
thermally processed foods.
There was a significant difference between the observed and predicted values of
the TTI color in hamburgers (Table 5-3). This may be attributed to (1) errors in
modeling and prediction and/or (2) the differences in heat transfer characteristics of
water and the patty porousness and materials such as fat and/or protein. However, since
the prediction error of our mathematical model was significantly lower than those of the
observed values, this error could be considered fail-safe. Although more accurate
predictive model will be needed to establish for a commercial application of TTI, the
Maillard-based TTI could be applicable in cooking temperature management for
ensuring microbial safety.
Page 140
Application of a developed TTI for visualization of heating state of processed foods
- 128 -
5.4. Conclusion
All in all, the results of the present study demonstrate that the Maillard
reaction-based TTI we developed allows appropriate management and evaluation of
temperature history during thermal processing. Moreover, it can be adjusted to various
temperature-time combinations by modifying the types of reactants and their
concentrations. Importantly, this technology allows managing the thermal cooking
process at the individual food product level; hence, it may contribute to achieving more
accurate and reliable microbiological control of this process. Further investigation to
correspond to the other temperature and holding time conditions should be conducted
for various thermal treatments of processed foods in the future. However, the present
prototype is impractical as it must be inserted into the center of the hamburger patty.
Thus, its design will have to be improved in order for it to become an easy-to-use,
commercial product. Further investigation will be aimed at increasing the practicality
and availability of the TTI system.
Page 141
Summary
- 129 -
Chapter 6 Summary
Maillard reaction-based TTIs were examined for development of flexible TTIs
under various agricultural and food processes such as distribution, storage, ripening and
the cooking.
The color variations of Maillard reaction by D-xylose, glycine, and Na2HPO4
were investigated by various conditions of reaction temperatures and reactant
concentrations. The color changes were easily recognized by naked eyes. The reaction
rate increased with decreasing temperature and reactant concentration. As a
consequence, the color variation rate of the Maillard reaction allows the reaction time to
be adjusted from 12 h to 1 years by controlling reaction temperature and reactant
concentrations. Furthermore, the reaction completion time and color variation could be
accurately predicted by the developed mathematical model. Thus, Maillard reaction-
based TTIs exhibits higher flexibility of reaction time by adjusting the reaction related
parameters.
In addition, the examined TTI developed on the basis of the investigated data was
verified the usefulness for distribution, storage, ripening and cooking process. In
concrete, the examined TTIs allow to indicate the quality change during storage and
ripening process of melon, and appropriately indicate the shelf-life of vacuum packed
chilled storage beef. Moreover, the examined TTI demonstrated the applicability for
evaluation of sufficiency of thermal cooking processes in various foods.
In conclusion, the studied TTIs based on Maillard reaction exhibited high
applicability for various agricultural and food processes. However, there are still
issues to be solved for more suitable color change and also the shape of TTI.
Furthermore, additional studies will be needed to enhance the usefulness of the TTIs
Page 142
Summary
- 130 -
corresponding to quality change of various foods.
Page 143
- 131 -
References
3M United States. 2017. 3MTM MonitorMarkTM Time Temperature Indicators.
https://www.3m.com/3M/en_US/company-us/all-3m-products/~/MONMARK-3M-
MonitorMark-Time-Temperature-Indicators/?N=5002385+3293785721&rt=rud
(December 27, 2017).
Aberoumand, Ali. 2013. Impact of Freezing on Nutritional Composition of Some Less
Known Selected Fresh Fishes in Iran. International food research journal 20(1):
347–350.
All Japan Meat Industry Cooperative Associations(JMICA). 2015. Handbook of the
Meat. Tokyo, Japan.
Amalaradjou, Mary Anne Roshni et al. 2010. Enhancing the Thermal Destruction of
Escherichia Coli O157:H7 in Ground Beef Patties by Trans-Cinnamaldehyde. Food
Microbiology 27(6): 841–844.
Ames, Jennifer M. 1990. Control of the Maillard Reaction in Food Systems. Trends in
Food Science & Technology 1: 150–154.
Ames, Jennifer M. 1998. Applications of the Maillard Reaction in the Food Industry.
Food Chemistry 62(4): 431–39.
Aus-Meat. 2005. Handbook of Australian Meat 7th Edition (International Red Meat
Manual). Australia
Bala, K, R T Marshall, W C Stringer, and H D Naumann. 1977. Changes of Color of
Aqueous Beef Extract Caused by Pseudomonas Fragi. Journal of Food Protection
40(12): 824–827.
Barbosa-Canovas, Gustavo V., Bilge. Altunakar, and Danilo J. Mejia-Lorio. 2005.
Freezing of Fruits and Vegetables : An Agribusiness Alternative for Rural and
Semi-Rural Areas. Rome, Italy.
Bartzanas, T., T. Boulard, and C. Kittas. 2002. Numerical Simulation of the Airflow and
Temperature Distribution in a Tunnel Greenhouse Equipped with Insect-Proof
Page 144
- 132 -
Screen in the Openings. Computers and Electronics in Agriculture 34(1–3): 207–
221.
Beebe, S. D. et al. 1976. ffect of Initial Internal Temperature and Storage Temperature
on the Microbial Flora of Vacuum Packaged Beef. Journal of Milk and Food
Technology 39(9): 600–605.
Bell, Leonard N. 1997. Maillard Reaction as Influenced by Buffer Type and
Concentration. Food Chemistry 59(1): 143–147.
Benzing-Purdie, Laure M., John A. Ripmeester, and Christopher I. Ratcliffe. 1985.
Effects of Temperature on Maillard Reaction Products. Journal of Agricultural and
Food Chemistry 33(1): 31–33.
Bhattacharya, M., and M.A. Hanna. 1989. Kinetics of Drip Loss, Cooking Loss and
Color Degradation in Frozen Ground Beef during Storage. Journal of Food
Engineering 9(2): 83–96.
Blixt, Ylva, and Elisabeth Borch. 1999. Using an Electronic Nose for Determining the
Spoilage of Vacuum-Packaged Beef. International Journal of Food Microbiology
46(2): 123–134.
Boekel, M.A.J.S. 2006. Formation of Flavour Compounds in the Maillard Reaction.
Biotechnology Advances 24(2): 230–33.
Bogard, April K. et al. 2013. Ground Beef Handling and Cooking Practices in
Restaurants in Eight States. Journal of Food Protection 76(12): 2132–2140.
Bożena, Danyluk, Bilska Agnieszka, and Kowalski Ryszard. 2011. Microbiological
Stability of Selected Beef Elements, Subjected to Technological Processes and
Stored under Aerobic and Vacuum Conditions at 5°C. Acta Scientiarum
Polonorum : Technologia Alimentaria 10(3): 375–385.
Cassin, Lammerding, Todd, Ross, and Mccoll. 1998. Quantitative Risk Assessment for
Escherichia Coli O157:H7 in Ground Beef Hamburgers. International Journal of
Food Microbiology 41(1): 21–44.
Cayuela, Maria, Gil, Banon, and Garrido. 2004. Effect of Vacuum and Modified
Page 145
- 133 -
Atmosphere Packaging on the Quality of Pork Loin. European Food Research and
Technology 219(4): 316–20.
Chisari, Marco, Riccardo N. Barbagallo, and Giovanni Spagna. 2008. Characterization
and Role of Polyphenol Oxidase and Peroxidase in Browning of Fresh-Cut Melon.
Journal of Agricultural and Food Chemistry 56(1): 132–138.
Duffy, Geraldine et al. 2006. A Review of Quantitative Microbial Risk Assessment in
the Management of Escherichia Coli O157:H7 on Beef. Meat Science 74(1): 76–
88.
Echavarría, Pagán, and Ibarz. 2012. Melanoidins Formed by Maillard Reaction in Food
and Their Biological Activity. Food Engineering Reviews 4(4): 203–23.
Eden, Tareke et al. 2002. Analysis of Acrylamide, a Carcinogen Formed in Heated
Foodstuffs. J. Agric. Food Chem. 50(17): 4998–5006.
Ellis, G. P. 1959. The Maillard Reaction. Advances in Carbohydrate Chemistry 14(C):
63–134.
Ellouze, M., and J-C. Augustin. 2010. Applicability of Biological Time Temperature
Integrators as Quality and Safety Indicators for Meat Products. International
Journal of Food Microbiology 138(1–2): 119–129.
Ercolini, Danilo, Ferrocino, Ilario, Nasi, Antonella, Ndagijimana, Maurice, Vernocchi,
Pamela, La Storia, Antonietta, Laghi, Luca, Mauriello, Gianluigi, Guerzoni, M
Elisabetta, and Villani, Francesco. 2011. Monitoring of Microbial Metabolites and
Bacterial Diversity in Beef Stored under Different Packaging Conditions. Applied
and environmental microbiology 77(20): 7372–7381.
FAO/WHO. 2014. FAO/WHO Risk Assessment of Listeria Monocytogenes in
Ready-to-Eat Foods Microbiological Risk Assessment Series 5, Technical Report.
Rome.
Farouk, M.M., K.J. Wieliczko, and I. Merts. 2004. Ultra-Fast Freezing and Low Storage
Temperatures Are Not Necessary to Maintain the Functional Properties of
Manufacturing Beef. Meat Science 66(1): 171–179.
Page 146
- 134 -
HarikliaVaikousi, Costas G.Biliaderis, and Konstantinos P.Koutsoumanis. 2009.
Applicability of a Microbial Time Temperature Indicator (TTI) for Monitoring
Spoilage of Modified Atmosphere Packed Minced Meat. International Journal of
Food Microbiology 133(3): 272–278.
Hattori, Keita et al. 2010. Field Measurement and Numerical Prediction of Airflow and
Temperature Distribution in Large Scale Green House. The Society of Heating,
Air-Conditioning & Sanitary Engineers of Japan 35(162): 25–34.
Hernández-Macedo, Maria Lucila, Giovana Verginia Barancelli, and Carmen Josefina
Contreras-Castillo. 2011. Microbial Deterioration of Vacuum-Packaged Chilled
Beef Cuts and Techniques for Microbiota Detection and Characterization: A
Review. Brazilian journal of microbiology : [publication of the Brazilian Society
for Microbiology] 42(1): 1–11.
Hertog-Meischke, Marjan J A den, Frans J M Smulders, and Jan G van Logtestijn. 1998.
The Effect of Storage Temperature on Drip Loss from Fresh Beef. Journal of the
Science of Food and Agriculture 78(4): 522–526.
Hodge, John E. 1953. Dehydrated Foods, Chemistry of Browning Reactions in Model
Systems. Journal of agricultural and food chemistry 1(15): 928–943.
International Commission on Microbiological Specifications for Foods(ICMSF), and R.
B. (R. Bruce) Tompkin. 2002. Microbiological Testing in Food Safety
Management. New York, USA.
Jamal, Javanmardi, and Kubota Chieri. 2006. Variation of Lycopene, Antioxidant
Activity, Total Soluble Solids and Weight Loss of Tomato during Postharvest
Storage. Postharvest Biology and Technology 41(2): 151–155.
Japanese Consumers Co-operative Union (Co-op). 2016. Product Guide. 20th ed. Tokyo,
Japan.
Jeong, Geun-Gi, Na-Young Park, and Shin-Ho Lee. 2006. Quality Characteristics of
High and Low Grade Hanwoo Beef During Storage at 1℃. Korean journal of food
science and technology 38(1): 10–15.
Page 147
- 135 -
Kafetzopoulos, Dimitrios P., Evangelos L. Psomas, and Panagiotis D. Kafetzopoulos.
2013. Measuring the Effectiveness of the HACCP Food Safety Management
System. Food Control 33(2): 505–513.
Kasim, Rezzan, and Kasim. 2014. Biochemical and Color Changes of Fresh-Cut Melon
(Cucumis Melo L. Cv. Galia) Treated with UV-C. Food Science and Technology
34(3): 547–51.
Khandke, S.S., and T. Mayes. 1998. HACCP Implementation: A Practical Guide to the
Implementation of the HACCP Plan. Food Control 9(2–3): 103–109.
Kim, Ghafoor, Ahn, Shin, Lee, Shahbaz, Shin, Kim, and Park. 2016. Kinetic Modeling and
Characterization of a Diffusion-Based Time-Temperature Indicator (TTI) for
Monitoring Microbial Quality of Non-Pasteurized Angelica Juice. LWT - Food
Science and Technology 67: 143–150.
Kim, Kim, and Lee. 2012a. New Enzymatic Time-Temperature Integrator (TTI) That
Uses Laccase. Journal of Food Engineering 113(1): 118–123.
Kim, Jung, Park, Chung, and Lee. 2012b. Application of a Prototype of Microbial Time
Temperature Indicator (TTI) to the Prediction of Ground Beef Qualities during
Storage. Korean Journal for Food Science of Animal Resources 32(4): 448–457.
Ko and Yang. 2001. Effect of Wrap and Vacuum Packaging on Shelf Life of Chilled
Pork. The Korean Journal of Food And Nutrition 14(3): 255–262.
Koutsoumanis, Konstantinos, and Gougouli. 2015. Use of Time Temperature Integrators
in Food Safety Management. Trends in Food Science & Technology 43(2): 236–
244.
Kuswandi., Bambang, Wicaksono, Jayus, Abdullah, Lee, and Ahmad. 2011. Smart
Packaging: Sensors for Monitoring of Food Quality and Safety. Sensing and
Instrumentation for Food Quality and Safety. 5(3-4): 137-146.
Kuswandi., Bambang, Chrysnanda Maryska, Aminah, and Lee. 2013. Real Time
on-Package Freshness Indicator for Guavas Packaging. Journal of Food
Measurement and Characterization 7(1): 29–39.
Page 148
- 136 -
Lagerstedt, Å sa, Maria, and Kerstin. 2011. Vacuum Skin Pack of Beef - A Consumer
Friendly Alternative. Meat Science 88(3): 391–396.
Laguerre, Hoang, and Flick. 2013. Experimental Investigation and Modelling in the
Food Cold Chain: Thermal and Quality Evolution. Trends in Food Science &
Technology 29(2): 87–97.
Laroque, Inisan, Berger, Vouland, Dufossé, and Guérard. 2008. Kinetic Study on the
Maillard Reaction. Consideration of Sugar Reactivity. Food Chemistry 111(4):
1032–1042.
Lee and Yoon. 2001. Quality Changes and Shelf Life of Imported Vacuum-Packaged
Beef Chuck during Storage at 0°C. Meat science 59(1): 71–77.
Lee and Lee. 1998. Quality Changes of Vacuum Packaged Hanwoo Beef during Cold
Storage. Korean Society of Animal Science and Technology. 40(6): 651–660.
Leygonie, Coleen, Britz, and Hoffman. 2012. Impact of Freezing and Thawing on the
Quality of Meat: Review. Meat Science 91(2): 93–98.
Lim, Antony, and Albliwi. 2014. Statistical Process Control (SPC) in the Food Industry
– A Systematic Review and Future Research Agenda. Trends in Food Science &
Technology 37(2): 137–151.
Luo, Qunying. 2011. Temperature Thresholds and Crop Production: A Review. Climatic
Change 109(3–4): 583–598.
Maillard. 1912. Comptes Rendus de l’Académie des Sciences Action Des Acides
Aminés Sur Les Sucres; Formation Des Mélanoïdines Par Voie Méthodique.
Faculté de Médecine de Paris. Paris, France.
Martins, Sara, Jongen, and Boekel. 2000. A Review of Maillard Reaction in Food and
Implications to Kinetic Modelling. Trends in Food Science & Technology 11(9–10):
364–373.
Mcardle, Kerry, and Mullen. 2010. Monitoring the Effects of High Pressure Processing
and Temperature on Selected Beef Quality Attributes. Meat Science 86(3): 629–
634.
Page 149
- 137 -
Meat and livestock Australia. 2014. Shelf Life of Australian Red Meat. North
Sydney,NSW, Australia.
Mendoza, Welt, Otwell, Teixeira, Kristonsson, and Balaban. 2006. Kinetic Parameter
Estimation of Time-Temperature Integrators Intended for Use with Packaged Fresh
Seafood. Journal of Food Science 69(3): 90-96
Mercier, Samuel, Sebastien Villeneuve, Martin Mondor, and Ismail Uysal. 2017.
Time-Temperature Management Along the Food Cold Chain: A Review of Recent
Developments. Comprehensive Reviews in Food Science and Food Safety 16(4):
647–667.
Miura, Masayo, and Toshiharu. 1982. Formation of Blue Pigment in the Earlier Stage of
Browning a System Composed of D-Xylose and Glycine. Nippon Nōgeikagaku
Kaishi 56(6): 417–425.
Mizuno, Kato, Harada, Myajima, and Suzuki. 1971. Studies on the Free Sugars and
Amino Acids in a Fruit of Muskmelon. Nippon Shokuhin Kagaku Kogaku Kaishi.
18(7): 319–325.
Moon. 2005. Aging Effect of Vacuum-Packaged Beef Loins with a Long Chilling Period.
Korean Journal for Food Science of Animal Resources 25(2): 127–133.
Morita, Yukio, and Mitsushi. 2016. Historical Status of Meat Hygiene in Japan. Journal
of the Japan Veterinary Medical Association 69(11): 695–701.
Mottram, Donald, Wedzicha, and Dodson. 2002. Food Chemistry: Acrylamide Is
Formed in the Maillard Reaction. Nature 419(6906): 448–449.
Murakami, Hiroki, Kogure, Sakai, and Isshiki. 2012. Development of a Food-Dye
Indicator That Warns of Rising Temperature in Food Products. Japanese Journal of
Food Chemistry and Safety 19(2): 119–123.
Nakayama. 1968. Studies on Sugar Contents in Muskmelon. Journal of Home
Economics of Japan 19(2): 85–88.
Nassos, King, Stafford, and Stafford. 1983. Relationship between Lactic Acid
Concentration and Bacterial Spoilage in Ground Beef. Applied and environmental
Page 150
- 138 -
microbiology 46(4): 894–900.
Nihimura, Fang, Ito, Wakamatsu, and Takahashi. 2008. Structural Weakening of
Intramuscular Connective Tissue during Postmortem Aging of Pork. Animal
Science Journal 79(6): 716–721.
Nopwinyuwong, Atchareeya, Trevanich, and Suppakul. 2010. Development of a Novel
Colorimetric Indicator Label for Monitoring Freshness of Intermediate-Moisture
Dessert Spoilage. Talanta 81(3): 1126–1132.
Nunes and Emond. 2007. Relationship between weight loss and visual quality of fruits
and vegetables. Proceedings of the Florida State Horticultural Society, 120, 235–
245.
Nychas, Panagou, and Mohareb. 2016. Novel Approaches for Food Safety Management
and Communication. Current Opinion in Food Science 12: 13–20.
Oh, Bae, and Lee. 2011. Current Status of the Research on the Postharvest Technology
of Melon(Cucumis melo L.). Korean Journal of Food Preservation 18(4): 442–458.
Ohta Yamazaki, Kawai, Kogure, Futase, and Isshiki. 2008. Development of the
indicator to warn deviant temperature raise in cold chain. Japanese Journal of Food
Chemistry 15(1): 18–22.
Paris, Staub, and Mccreight. 2003. Determination of Fruit Sampling Location for
Quality Measurements in Melon (Cucumis melo L.). Cucurbit Genetics Cooperati
ve Report 26: 12–17.
Park, Kim, and Lee. 2013. Adjustment of Arrhenius activation energy of laccase-based
time-temperature integrator (TTI) using sodium azide. Food Control 32(2): 615–
620.
Park, Joo, Hwang, Na, Kim, Choi, and Cho, M. S. (2016). Effects of freezing storage
temperature on the storage stability of beef. Korean Journal of Food Science and
Technology 48(4): 301–305.
Paull. 1999. Effect of temperature and relative humidity on fresh commodity quality.
Postharvest Biology and Technology 15(3): 263–277.
Page 151
- 139 -
Pavelková. (2013). Time temperature indicators as devices intelligent packaging. Acta
Universitatis Agriculturae et Silviculturae Mendelianae Brunensis 61(1): 245–251.
Payne, Durham, Scott, and Devine. 1998. The effects of non-vacuum packaging systems
on drip loss from chilled beef. Meat Science 49(3): 277–87.
Poças, Delgado, and Oliveira. 2008. Smart Packaging Technologies for Fruits and
Vegetables. In Smart Packaging Technologies for Fast Moving Consumer Goods
(pp. 151–166). Chichester, UK: John Wiley & Sons, Ltd.
Popova, Marinova, Vasileva, Gorinov, and Lidji, 2009. Oxidative changes in lipids and
proteins in beef during storage. Archiva Zootechnica 12(3): 30–38.
Porat, Weiss, Fuchs, Sandman, Ward, Kosto, and Agar. 2009. Modified atmosphere/
modified humidity packaging for preserving pomegranate fruit during prolonged
storage and transport. Acta Horticulturae 818: 299–304.
Rhee, Lee, Dougherty, and Kang. 2003. Antimicrobial effects of mustard flour and
acetic acid against Escherichia coli O157:H7, Listeria monocytogenes, and
Salmonella enterica serovar Typhimurium. Applied and Environmental
Microbiology 69(5): 2959–2963.
Rokugawa, H., & Fujikawa, H. (2015). Evaluation of a new Maillard reaction type
time-temperature integrator at various temperatures. Food Control, 57, 355–361.
https://doi.org/10.1016/j.foodcont.2015.05.010
Rowe, Maddock, Lonergan, and Huff-Lonergan. 2004. Influence of early postmortem
protein oxidation on beef quality. Journal of Animal Science 82(3): 785.
Samouris, Kaniou, and Zantopoulos. 2002. Lipid peroxidation of fresh unpacked and
vacuum-packed beef during storage at 4°C. Archiv Fur Lebensmittelhygiene 53:
41–42.
Sandwick, Johason, and Breure. 2005. Maillard Reactions of Ribose 5-Phosphate and
Amino Acids. Annals of the New York Academy of Sciences 1043(1): 85–96.
Seideman and Durland. 1983. Vacuum packaging of fresh beef: A review. Journal of
Food Quality 6(1): 29–47.
Page 152
- 140 -
Shang. 2016. Spoilage dynamics of vacuum packed (VP) lamb. University of Tasmania.
Sharma, Tiwari, and Sorayan. 1999. Temperature distribution in different zones of the
micro-climate of a greenhouse: a dynamic model. Energy Conversion and
Management 40(3): 335–348.
Shin, Ku, Park, and Song. 2006. Use of Freshness Indicator for Determination of
Freshness and Quality Change of Beef and Pork during Storage. Korean Journal of
Food Science and Technology 38(3): 325–330.
Smiddy, Fitzgerald, Kerry, Papkovsky, Sullivan, and Guilbaul. 2002. Use of oxygen
sensors to non-destructively measure the oxygen content in modified atmosphere
and vacuum packed beef: impact of oxygen content on lipid oxidation. Meat
Science 61(3): 285–290.
Stadler, Blank, Varga, Robert, Hau, Guy, and Riediker. 2002. Food chemistry:
Acrylamide from Maillard reaction products. Nature 419(6906): 449–450.
Sun, Huang, Xu, and Ying, 2010. Research advances in nondestructive determination of
internal quality in watermelon/melon: A review. Journal of Food Engineering
100(4): 569–577.
Surendran, Lau, Belskie, Fancher, Chen, Karumathil, and Venkitanarayanan. 2016.
Potentiating the Heat Inactivation of Escherichia coli O157:H7 in Ground Beef
Patties by Natural Antimicrobials. Frontiers in Microbiology 7: 15.
Tamanna and Mahmood. 2015. Food Processing and Maillard Reaction Products: Effect
on Human Health and Nutrition. International Journal of Food Science 2015: 1–6.
Taoukis, and Labuza. 2003. Time-temperature indicators (TTIs). In R. Ahvenainen (Ed.),
Novel food packaging techniques (pp. 103–126). Cambridge, United Kingdom:
Woodhead Publishing Ltd.
Terajima. 2016. Bacterial Food Poisoning. Surface Science for Safe Society 37(8): 392–
393.
Thatyane, Mayra, Ana, Miranda, Fabiano, and Sueli. 2012. Power ultrasound processing
of cantaloupe melon juice: Effects on quality parameters. Food Research
Page 153
- 141 -
International 48(1): 41–48.
Thomas. 2011. Handbook of engineering and specialty thermoplastics. Vol. 3,
Polyethers and polyesters. Wiley.
Timestrip UK Ltd. (2017). Timestrip Complete Vaccine Monitoring - Timestrip.
Retrieved December 27, 2017, from https://timestrip.com/articles/timestrip
-complete-vaccine-monitoring/
United States Department of Agriculture (USDA). 2002. Consumer Food Safety
Behavior: A Case Study in Hamburger Cooking and Ordering.
Vaikousi, Biliaderis, and Koutsoumanis. 2009. Applicability of a microbial Time
Temperature Indicator (TTI) for monitoring spoilage of modified atmosphere
packed minced meat. International Journal of Food Microbiology 133(3): 272–278.
Van. 2006. Formation of flavour compounds in the Maillard reaction. Biotechnology
Advances 24(2): 230–233.
Vito and Mikal. 1995. Influence of storage period and temperature on the postharvest
characteristics of six melon (Cucumis melo L., Inodorus Group) cultivars.
Postharvest Biology and Technology 5(3): 211–219.
Wang, Qian, and Yao. 2011. Melanoidins produced by the Maillard reaction: Structure
and biological activity. Food Chemistry 128(3):, 573–584.
Wang, Liu, Yang, Zhang, Xiang, and Tang. 2015. Review of Time Temperature
Indicators as Quality Monitors in Food Packaging. Packaging Technology and
Science 28(10): 839–867.
Wanihsuksombat, Hongtrakul, and Suppakul. 2010. Development and characterization
of a prototype of a lactic acid-based time-temperature indicator for monitoring
food product quality. Journal of Food Engineering 100(3): 427–434.
Witte, Krause, and Bailey. 1970. A new extraction method for determining 2‐
thiobarbituric acid values of pork and beef during storage. Journal of food Science,
35(5): 582-585.
Page 154
- 142 -
Yamamoto and Isshiki. 2012. Development of the indicator using Maillard reaction to
warn against the temperature rise of the chilled food. Japanese Journal of Food
Chemistry 19(2): 84–87.
Yang, Shiping, Hongxia, Jie, Jiankang, Yongcai, and Weiyi. 2003. Effect of temperature
on chilling injury, decay and quality of Hami melon during storage. Postharvest
Biology and Technology 29(2): 229–232.
Youn, Kwon, Kim, and Kim. 2009. Changes in Quality of Muskmelon (Cucumis melo
L.) during Storage at Different Temperatures. Korean Journal of Food Science and
Technology 41(3): 251–257.
Zhou, Kawamura, Koseki, and Kimura. 2016. Comparative Quality Changes of
Fresh-cut Melon in Bio-based and Petroleum-based Plastic Containers during
Storage. Environment Control in Biology 54(2): 93–99.
Page 155
Development of Maillard reaction based
time-temperature indicator/integrator for application
of agricultural and food process engineering
March, 2018
Lee JungHyun
Laboratory of Agricultural and Food Process Engineering
Division of Bio-systems Sustainability
Graduate School of Agricultural Science, Hokkaido University
Kita-9, Nishi-9, Kita-ku, Sapporo, Hokkaido, Japan
Tel. and Fax.: +81-11-706-2552