18
Development of Multispecies Models of Fish Community Dynamics on Georges Bank William T. Stockhausen Michael J. Fogarty Northeast Fisheries Science Center NOAA Fisheries Woods Hole, MA
| Date post: | 01-Jan-2016 |
| Category: |
Documents |
| Upload: | martin-simon |
| View: | 214 times |
| Download: | 2 times |

Development of Multispecies Models of Fish Community Dynamics on Georges Bank
William T. Stockhausen
Michael J. Fogarty
Northeast Fisheries Science CenterNOAA FisheriesWoods Hole, MA
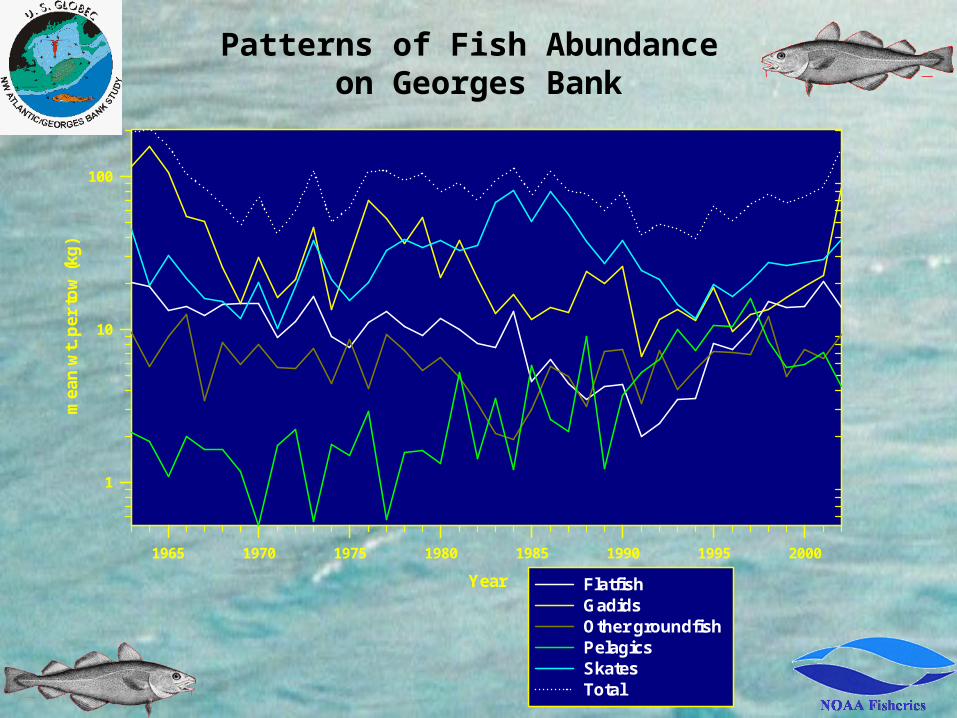
Patterns of Fish Abundance on Georges Bank
Year
1965 1970 1975 1980 1985 1990 1995 2000
mea
n w
t. p
er t
ow
(kg
)
1
10
100
FlatfishGadids Other groundfish Pelagics Skates Total

Approach to Modeling
• Construct energy flow models– Network analysis– Static picture: assumed equilibrium, linear processes– Underlying dynamic processes recognized
• Different time periods ↔Different environmental conditions
• Develop dynamic models– Represent change in the system– Accommodate nonlinear processes– Focus on components:
• Take advantage of differences in connectivity within/between trophic levels

Overlapping Data Requirements
• Dynamic models: time series of – Abundance (biomass) for each species
– Catch (biomass) for each species
• Energy flow models: estimates of– Average production for species groups
• Prod = Time-averaged biomass x P/B
– Averaged consumption for species groups• Cons = Time-averaged biomass x C/B
– Average total harvest for species groups

Multispecies Production Models for the Fish Community
• Develop multispecies production models for the fish community
• Primary objective is to test for species interactions
• Model incorporates– Competitive interactions– Predator-prey interactions (Type I functional response)
• Parameter estimation will be done in a Bayesian context (using WinBUGS)
ts
Br
tsts CeBB jtjjss
,
1
,1,
,,

Initial Multispecies Matrix
Cod HaddockSilver Hake
Yellowtail Flounder
Winter Flounder
Winter Skate
Little Skate
Herring Mackerel
CodPred
CompComp Pred Pred
Haddock Comp Comp Comp Comp
Silver Hake
Comp Pred Pred
Yellowtail Flounder
Comp Comp Comp Comp
Winter Flounder
Comp Comp Comp Comp
Winter Skate
Comp Comp Comp Comp Comp Pred Pred
Little Skate
Comp Comp Comp Comp
Herring Prey Prey Prey Comp
Mackerel Prey Prey Prey Comp

Stock Assessment Biomass
Year
1965 1970 1975 1980 1985 1990 1995 2000
Bio
mas
s (M
T x
10-3
)
1
10
100
1000
Haddock Atlantic Cod Yellowtail flounder
Estimating Biomass Time Series

Estimating Biomass Time Series
• Results from stock assessments generally inappropriate– Spatial coverage
– Temporal coverage
– Not available for all species

Estimating Biomass Time Series:NEFSC Bottom Trawl Survey Data
• 40 year dataset
• Semiannual surveys (Spring, Fall)
• Cape Hatteras to Gulf of Maine
• Nearshore to continental shelf break
• Stratified random survey design
• Standardized gear, procedures
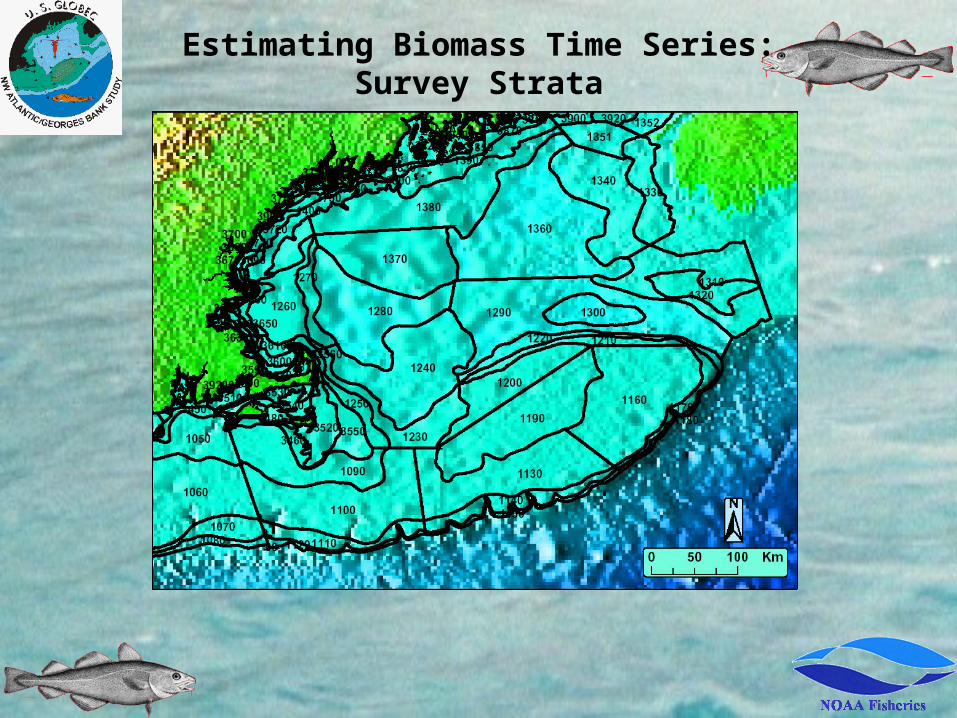
Estimating Biomass Time Series:Survey Strata

Estimating Biomass Time Series:Survey Indices
Spring Survey Indices
Year
1970 1975 1980 1985 1990 1995 2000
mea
n c
atch
per
to
w (
kg)
1
10
100Haddock Atlantic Cod Yellowtail flounder
Estimating Biomass Time Series:Issues with using trawl survey data
• Unequal catchabilities among species
• High sampling variability

Adjusting for Catchabilities
• Species-specific catchability factors based on – Published literature
• Visual observations and acoustic measurements
• Comparisons between survey and assessment results
• Meta-analysis of assessment-based catchabilities
– Analysis of trawl survey data• Day/night correction factor for individual
net tows
z
z
snszs
ssnszs
zs
rawtzs
tzs
ss
ss
e
ecq
cq
q
CaAB
1ˆ
ˆ
ˆˆ
,
,
,
,,,,
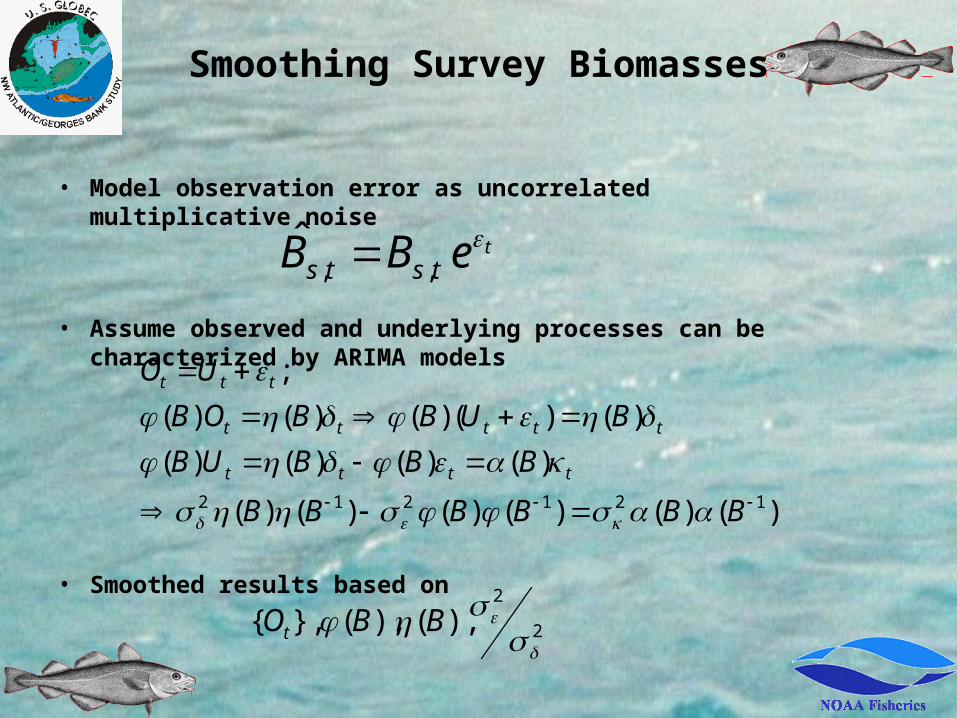
Smoothing Survey Biomasses
• Model observation error as uncorrelated multiplicative noise
• Assume observed and underlying processes can be characterized by ARIMA models
• Smoothed results based on
)()()()()()(
)()()()(
)()()()()(
;
121212
BBBBBB
BBBUB
BUBBOB
UO
tttt
ttttt
ttt
teBB tsts
,,ˆ
2
2
),(),(},{
BBOt

Smoothed Biomass Time Series
Atlantic Cod Biomass
Year
1970 1975 1980 1985 1990 1995 2000
Bio
mas
s (M
T x
10-3
)
10
100
Spring trawl surveyARIMA-smoothed resultsAssessment biomass

Smoothed Biomass Time Series
Haddock Biomass
Year
1965 1970 1975 1980 1985 1990 1995 2000
Bio
mas
s (M
T x
10-3
)
10
100
Spring trawl surveyARIMA-smoothed resultsAssessment biomass

Estimates of Production and ConsumptionFor the Energy Flow Models
Production
1960's 1970's 1980's 1990's
Pro
du
ctio
n (
kcal
m-2
yr-1
)
0.0
0.5
1.0
1.5
2.0
2.5
3.0
Atlantic codHaddock
Consumption
Time Period
1960's 1970's 1980's 1990's
Co
nsu
mp
tio
n (
kcal
m-2
yr-1
)
0
2
4
6
8
10
12

Summary
• Multspecies production models will provide dynamic counterpoints to static, equilibrium-based energy flow models
• Procedures developed for estimating time series of species biomass from NEFSC Bottom Trawl Survey data– provide biomass time series for the production models– provide production/consumption estimates for energy flow
models


