Development of on-demand critically evaluatedthermophysical properties data in processsimulation*
Suphat Watanasiri
Aspen Technology, Inc., 200 Wheeler Road, Burlington, MA 01803, USA
Abstract: Accurate thermophysical properties are essential to the development of high-qual-ity process simulation models of chemical processes. Therefore, process-modeling software(simulator) must provide accurate, reliable, and easily accessible property data and models toenable efficient and robust process design. Property data and parameters for components ofinterest are generally available in the databases of the simulator. For components that are notin the databases, their property data must be supplied by the user. The number of componentsavailable in a typical simulator is about 1700. The number and types of components availablein the simulator limit the scope and accuracy of process models that can be developed.
In this paper, we review past practice in obtaining the necessary property data requiredin developing a process model and describe a new methodology that can be used to overcomethe shortcomings of the current method. The new method is based on the dynamic data eval-uation concept that combines the experimental data obtained from a comprehensive elec-tronic database with structure-based property estimation system and data analysis and regres-sion programs to generate critically evaluated property data. The concept and necessarysoftware have been implemented in a process simulator, resulting in a new workflow thatenables high-fidelity process models to be developed more easily and efficiently.
Keywords: critically evaluated property data; dynamic data evaluation; process simulation;ThermoData Engine; thermophysical properties.
INTRODUCTION
The 21st century is proving difficult for companies in the continuous processing industries (CPIs) dueto wild fluctuations in energy, raw material and capital costs, globalization of markets, and the chal-lenging economic environment. In response, chemical manufacturers are increasing their focus on pro-duction of higher-value specialty chemicals and intermediates. Pharmaceutical companies are develop-ing synthesis routes for a wide slate of products while reducing production costs for their drugs. Newprocesses are being developed to manufacture biofuel and to synthesize liquid fuel from natural gas andsynthesis gas from coal, coke, oil sands, and biomass. Oil companies are working to improve yieldsthrough better characterization and “molecule management” in their facilities.
In addressing these challenges, the industries are increasingly relying on process modeling toolsto design, operate, and optimize chemical processes to maximize yields, minimize energy and capitalcosts, and ensure environmental compliance. These software tools combine basic engineering princi-
*Paper based on a presentation made at the 21st International Conference on Chemical Thermodynamics (ICCT-2010), Tsukuba,Japan, 1–6 August 2010. Other presentations are published in this issue, pp. 1217–1281.
ples (e.g., mass and energy balances, phase and chemical equilibria, and reaction kinetics) with sophis-ticated computer algorithms to enable engineers to predict or simulate the behavior of chemicalprocesses. One such tool is a process simulator such as Aspen Plus® [1].
Accurate thermophysical properties are keys to generating simulation results that can be usedwith confidence. Inaccurate or incorrect physical properties lead to poor design or plants that do notoperate as expected resulting in enormous economic loss and environmental harm. Therefore, processsimulator must provide accurate, reliable, and easily accessible property methods and data to enableefficient and robust process design. The problem is more challenging when dealing with new chemicalswhere no or little property information is known.
Property data and parameters for components of interest in the process model are generally avail-able in the databases that are supplied with the simulator. The number of components available can berelatively small compared to the tens of thousands of compounds that may be of interest to the processindustries. For components that are not available, their property data must be supplied by user. This canbe accomplished using a combination of experimental data (from the literature or from their own meas-urements), estimation from group-contribution methods [2] and data regression [3]. However, this exer-cise requires significant know-how and can incur significant costs. It is evident that the number andtypes of components available in the simulator limit the scope and accuracy of process models that canbe developed. Therefore, it is important to increase the scope of the components and mixtures availablein the process simulator.
A property database is traditionally created by physical property experts who developed the dataover an extended period of time, and the data are then deployed in a static database. The database maybe updated periodically as resources allow. To significantly increase the scope of the components andmixtures available for process design and development, this static approach is not practical due to anumber of serious shortcomings. The time and effort required to collect, analyze, fill gaps, and evalu-ate the data is very significant. The expertise required is limited to a small number of groups (universi-ties and research institutions, large industrial companies, government laboratories). There is also a sig-nificant lag between the time the static database is developed and when it is available in the simulator.
In this work, a new method is developed to help overcome these shortcomings. It is based on thedynamic data evaluation concept [4] developed at the Thermodynamic Research Center (TRC), whichis part of the U.S. National Institute of Standards and Technology (NIST). The concept combines theexperimental data obtained from a comprehensive, evergreen electronic database with structure-basedproperty estimation system and data analysis and regression programs to generate critically evaluatedproperty data. The concept and necessary software have been implemented in Aspen Plus [1] and aredescribed in detail in this paper. The new technology enables creation of critically evaluated propertiesrequired in simulation based on the current state of the data and process requirements. This technologyis a result of a government/industry cooperation that leveraged more than a decade of research anddevelopment work performed at NIST-TRC. Combined with many years of development efforts at theauthor’s company, the technology is available to a very large number of process simulation users world-wide.
THERMOPHYSICAL PROPERTY DATA AND PROCESS SIMULATION
Process modeling uses the laws of thermodynamics and chemistry and chemical engineering principlesto carry out mass and energy balances for each unit of equipment in a plant. The fundamental equationsused to predict phase equilibrium or to size and rate equipment require reliable thermophysical prop-erty data of the chemical components and mixtures that are involved. For example, phase equilibrium,which dictates the distribution/separation of species in distillation columns, depends on the compo-nent’s vapor pressures and activity coefficients (or fugacity coefficients), while heat transfer depends onthe component’s thermal conductivity and heat capacity. The accuracy (or fidelity) of the process sim-ulation models is directly related to the accuracy of the underlying thermophysical property informa-
tion. Poor data, poorly estimated property parameters, or inappropriate model can lead to very largeerrors in the calculated capital costs of the plant, which in turn can lead to poor investment decisions.For example, a 20 % error in thermal conductivity can lead to a 13 % error in capital cost, while 20 %error in density can lead to 16 % error in capital cost [5]. For phase equilibrium property, such as activ-ity coefficients, the impact can be even larger, depending on the characteristic of the system involved,for example, the relative volatility of the key components. Consider a close boiling system, with rela-tive volatility of 1.10. In order to separate the two components via distillation, a large number of stagesare required. Assuming a total reflux and a purity specification, the minimum number of stages can bedetermined. For this system, a column consisting of 140 stages is required with an estimated capital costof USD 18 million. Figure 1 shows a sensitivity study relating the error in the relative volatility to theminimum number of stages required to achieve the same purity specification. An error of –5 % canresult in a doubling of the number of stages required [6]. This very simplified example illustrates thepotential high costs of inattention to the accuracy of the physical property model used to design anyprocess.
In addition to the direct effect on capital costs, a model based on inaccurate or incorrect physicalproperties could lead to infeasible process designs, poor plant operability, or unsafe plants. Thus, it isabsolutely essential that process simulation models are based on accurate thermophysical property data.Finally, chemical industry trends toward new chemicals and new chemical families present an enormouschallenge to providing the necessary property information in a timely and cost-effective manner.
Figure 2 shows schematically the relationships between the thermophysical property database, thephysical property calculation engine, and the process simulator engine. These are highly complex com-ponents, therefore, only the essential elements will be briefly described here to provide context.
Critically evaluated data in process simulation 1257
Fig. 1 Effect of error in relative volatility on the minimum number of stages for a distillation column required toachieve a desired separation of a close boiling mixture (with baseline relative volatility = 1.10). Adapted from [6].
The process simulator engine comprises algorithms to solve the distillation column; performcompressor, heat exchanger, and other unit operations calculations; tear and converge recycle streams;and optimize the process subject to constraints, including economic (e.g., equipment costs) constraints.The simulator requires thermophysical properties, which are supplied by the physical property calcula-tion engine. The simulator provides the process conditions (temperature, pressure, flow rates, and com-ponents involved), property requests (properties and phase of interest), and the methods and models(correlations) to be used, such as a specific equation-of-state model to the property calculation engine.The property calculation engine in turn calculates and returns the requested properties.
The property calculation engine calculates the requested properties using the specified methodsand models. The key properties needed by the simulator are fugacity coefficients, enthalpy (and heatcapacity), entropy, Gibbs free energy, molar volume, viscosity, thermal conductivity, surface tension,and diffusion coefficients. The property engine must also calculate derivatives of these properties withrespect to temperature, pressure, and composition in order to support Newton-based algorithms. For anequation-based simulator (such as [1]), analytical derivatives of properties are essential. In order toserve a wide range of industries (oil and gas, chemicals, petrochemicals, pharmaceuticals, specialtychemicals, polymers, etc.), a wide variety of models capable of representing the components and com-plex mixtures present in these diverse processes must also be available. The models include a largenumber of equations of state, activity coefficients, corresponding-states, and empirical models. Theproperty engine also includes flash (phase equilibrium) calculations that can handle vapor, liquid, andsolid phases, including occurrence of multiple liquid phases and solid solution. In many applications,such as electrolytes or reactive distillations, both phase and chemical equilibria must be consideredsimultaneously.
Property models require property data and/or parameters as input. For example, thePeng–Robinson equation of state [7] requires critical temperature, critical pressure, and acentric factorof pure components and a binary interaction parameter for each component pair. Pure-component prop-erty such as vapor pressure depends only on temperature and is calculated using correlations, such asthe Antoine [8] or Wagner [9] equations. The Antoine equation depends on three compound-specific
Fig. 2 Simplified diagram showing relationships among property database, property calculation engine, and processsimulator engine, which constitute the process simulation domain (shaded area). The static data evaluation processresides outside the process simulation domain, resulting in inefficiency in providing the thermophysical propertydata needed in process simulation.
constants, while the Wagner equation depends on the critical temperature and critical pressure as wellas four compound-specific constants.
These pure-component critical properties and correlation constants, and binary interaction param-eters are stored in the thermophysical property database of the simulator. It is important to note that ingeneral, this type of database does not contain the “raw” experimental data—just the evaluated corre-lation constants and model parameters.
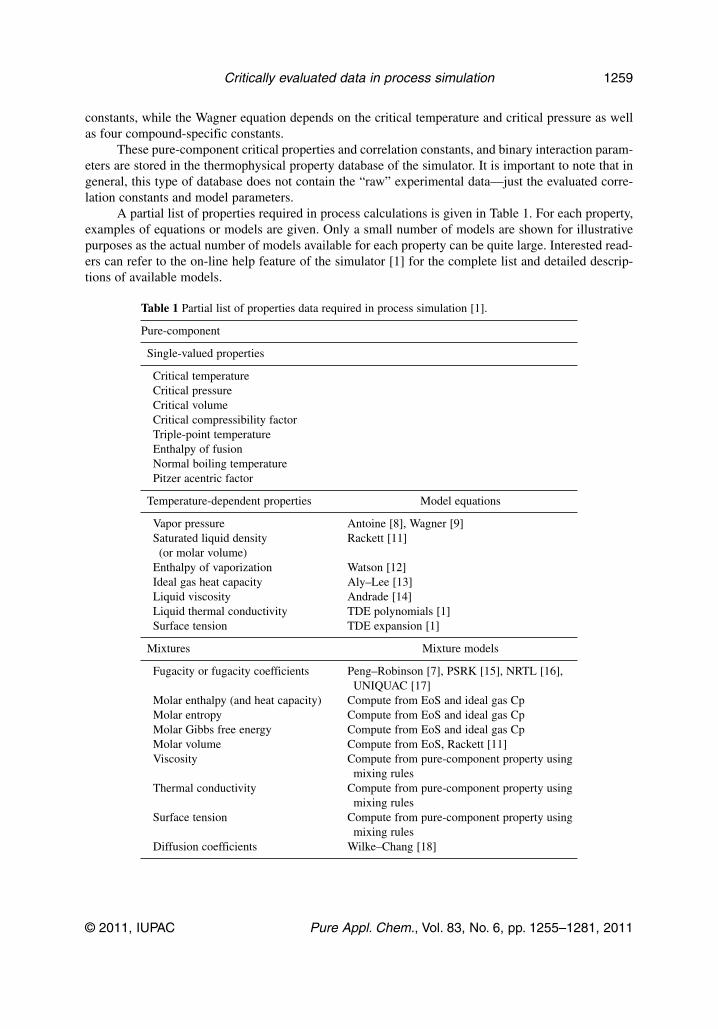
A partial list of properties required in process calculations is given in Table 1. For each property,examples of equations or models are given. Only a small number of models are shown for illustrativepurposes as the actual number of models available for each property can be quite large. Interested read-ers can refer to the on-line help feature of the simulator [1] for the complete list and detailed descrip-tions of available models.
Table 1 Partial list of properties data required in process simulation [1].
Molar enthalpy (and heat capacity) Compute from EoS and ideal gas CpMolar entropy Compute from EoS and ideal gas CpMolar Gibbs free energy Compute from EoS and ideal gas CpMolar volume Compute from EoS, Rackett [11]Viscosity Compute from pure-component property using
mixing rulesThermal conductivity Compute from pure-component property using
mixing rulesSurface tension Compute from pure-component property using
Critically evaluated data in process simulation 1259
The number of components available in a typical simulator is relatively small (~1700 [10]) com-pared to the tens of thousands of compounds that may be of interest to the process industries. AspenPlus version 2006 [1] (before the implementation of the technology described in this work) contains arelatively larger set of compounds as shown in Table 2. However, that is still insufficient for many appli-cations.
Table 2 Databases available in Aspen Plus version 2006 [1] prior toimplementation of the technology described in this work.
Data in the database Source of data
1972 organic components DIPPR® [19] and in-house development2477 inorganic components Barin [20]3462 solids Wagman et al. [21]800 ions Wagman et al. [21]Binary interaction parameters Various literature sources [22,23] andfor ~4000 unique mixtures in-house development
Property databases are traditionally created by physical property experts [19–23]. A comprehen-sive review of the developments of factual databases was given by Rarey and Gmehling [24]. Thesedatabases are developed over an extended period of time (years) by collecting experimental data fromthermodynamic journals, reference books, and open and/or private on-line databases. For many com-pounds considered, there are only limited experimental data available. As a result, the missing data mustbe estimated from molecular structure using group-contribution or other methods [2]. The experimen-tal and estimated “data” are evaluated for consistency to produce recommended values (see “Pure-com-ponent properties” section for more information on consistency checks). For temperature-dependentproperties, the data are then fitted to the appropriate equations using data regression. This exercise istime-consuming and requires significant know-how. The expertise required is limited to a small num-ber of groups (universities and research institutions, large industrial companies, government laborato-ries). In addition, experienced property evaluators continue to become rarer, particularly as the baby-boomer generation has reached retirement age.
There are no comprehensive libraries of binary interaction parameters that are publicly available.These parameters are generally developed in-house or collected from various literature sources (e.g.,[22,23,25,26]). The efforts to develop binary interaction parameters in-house are very significant. Ourexperience with such development consumed over 10 person-years. The resultant library covers about4000 unique binary mixtures and includes binary interaction parameters for the NRTL [16], Wilson[27], and UNIQUAC [17] models with three combinations of vapor-phase equations of state (ideal gas,Redlich–Kwong [28] and Hayden–O’Connell [26]). This results in about 36 000 sets of binary param-eter values [1]. There is no doubt as to the necessity and benefits of such efforts and investments.However, this example underscores the magnitude of the work required for such an undertaking and thevery large gaps that currently exist—considering that there are vapor–liquid equilibrium (VLE) data forabout 30000 unique binary mixtures in the NIST SOURCE Data Archive (as of 30 June 2010; see also“Experimental data section”). Any efforts to systematically analyze such data with the aim to developa library of binary interaction parameters will be very extensive and costly. In addition, other data suchas excess enthalpy and infinite-dilution activity coefficients should also be included in the parameteroptimization process, thus increasing the scope of the work further. The database of binary interactionparameters is not limited to VLE systems for activity coefficient models. Binary interaction parametersfor liquid–liquid equilibrium (LLE) applications, equation-of-state models, and Henry’s law constantsare also available [1]. These databases should also be extended to make use of the currently availableexperimental data. Such systematic and inclusive efforts, if executed manually, currently appear imprac-
tical and will inevitably result in a certain number of systems having been poorly determined or over-fitted, as pointed out by Rarey and Gmehling [24].
Property databases discussed above are delivered with the process simulator as static databases.Some of the databases may be updated with each new release of the software, but many are not due tothe limitations discussed above. There is also a significant lag between the time the static database isdeveloped and when it is available in the simulator, thus delaying its availability for industrial use. Thestatic data evaluation process shown in Fig. 2 depicts the crucial property evaluation process to resideoutside the domain of the process simulator resulting in inefficiencies.
Static data evaluation is also used to supply property data directly to the property calculationengine as shown in Fig. 2. This occurs when components present in the simulation are not available inthe library so the user has to supply the data needed. This task has traditionally been performed by ther-modynamics experts within the company and to an increasing extent by other users of the program. Thesame methodology employed by database developers is also used here. However, an additional imped-iment in this case lies in the accessibility to experimental data due to the high costs involved as well asto the lack of awareness of the available resources. In addition, most users are not thermodynamicsexperts; they lack the knowledge and confidence to perform the evaluation. As a result, the propertydata supplied to the simulator may contain errors or can be inconsistent. Given the increasing impor-tance of new materials and processes, this challenge must be addressed.
From the preceding discussion, it is clear that the number and types of components available inthe simulator limit the scope and accuracy of process models that can be developed. Therefore, it isimportant to increase the scope of the components and mixtures available as well as to improve the abil-ity to handle new components that are not present in the database. However, it is also evident that thestatic evaluation approach alone is not sufficient and practical. Therefore, we proposed to address theproblems in two ways: (1) by implementing the dynamic data evaluation concept and associated soft-ware, and (2) by greatly expanding the static database for pure components using the experimental dataand evaluation tools developed for dynamic data evaluation.
DYNAMIC DATA EVALUATION
An alternative to the static evaluation approach lies in the concept called dynamic data evaluation [4]developed at NIST and in bringing both the experimental data and dynamic data evaluation inside theprocess simulation domain, as shown in Fig. 3. The new methodology solves the primary deficienciesof the static approach by (1) removing the impediment to accessing experimental data by providingthem directly within the process simulator, (2) offsetting the lack of data evaluation expertise by pro-viding software that captured such expertise and using it to perform data evaluation, and (3) enablingthe user to initiate data evaluation as needed, dynamically—on demand when developing the propertydata for a process model. The data evaluation results can be used directly in property calculations asshown in Fig. 3. Over time, as results are validated in the field, the data and parameters can also be per-manently stored in the database.
The three key elements of dynamic data evaluation are described in the following sections.
Critically evaluated data in process simulation 1261
Experimental data
Implementation of the dynamic data evaluation concept has required the development of a large elec-tronic database storing essentially all experimental thermodynamic data known to date with detaileddescriptions of relevant metadata and uncertainties. The assessment and storage of the uncertainties areessential to the success of the dynamic approach. This database is referred to as the NIST SOURCE DataArchive (or SOURCE in the remainder of this paper). The current state of SOURCE is shown in Table 3.Experimental data are continually and systematically collected and evaluated at the NIST TRC’s DataEntry Facility in Boulder, Colorado, USA. The staff of this facility, working in conjunction with theUniversity of Colorado and the Colorado School of Mines, gathers property data from contemporaryand historical scientific journals from around the world. The data are captured and uncertainties areassessed with the aid of an expert system called the Guided Data Capture program [29]. This expertsystem checks the data using various thermodynamic relationships to ensure the assessed uncertaintiesare reliable and that the data are accurate and self-consistent. This process eliminates many of the tran-scription errors associated with traditional property data collection, and ensures the integrity ofSOURCE that underlies the dynamic data evaluation approach. Approximately 500000 data points areadded to the database annually.
The SOURCE database can be integrated into the process simulator domain as depicted in Fig. 3.However, due to the nature of the software release cycle (typically annually), SOURCE that is beingused in the simulator is not always up to date. NIST has developed a web-based data deployment mech-anism, which allows data to be updated daily [4]. In principle, the process simulator can take advantageof this web-based update mechanism to keep SOURCE up to date for the users. However, such anupdate mechanism from the NIST web site introduces security risks and can incur high administrativecosts related to entitlement verification. As a result, it was not adopted in this work. An alternativeapproach was therefore developed. The most current SOURCE data are provided to the users via anupdate posted to the company customer support web site every three months. Interested users with cur-rent software support entitlement can download and install the SOURCE database quarterly. This prac-tical compromise provides relatively up-to-date data to the users at minimum cost.
Fig. 3 Schematic diagram showing the key elements of dynamic data evaluation. The dynamic data evaluationprocess resides within the process simulation domain (shaded area on the left of the figure); it uses an extensivedatabase of experimental data together with expert software (shaded area on the right) to provide evaluated propertyparameters required in a particular process simulation project. The data evaluation is initiated by the user whenneeded—on demand.
Table 3 Status of experimental data stored in the SOURCE data archive, asof 30 June 2010. A data point refers to a measured property of interest, e.g.,mixture liquid viscosity at a given temperature, pressure, and composition.
Data description No. of data points
VLE 817568LLE 142394Activity coefficients at infinite dilution in pure solvents 26636Activity coefficients at infinite dilution in mixtures 5169Critical data of mixtures 14121SLE 110330Azeotropic data 4942Excess enthalpies 263541Excess heat capacities 46913Excess volumes 693379Pure-component data 1196181Reaction heats 5662Reaction equilibrium data 8229Mixture transport properties 258284Mixture surface tension, refraction, speed of sound 213862Total number of data points 4025274
Dynamic data evaluation software
The dynamic data evaluation concept was implemented in the software program NIST ThermoDataEngine (TDE) and had been described in details in refs. [4,30,31]. As discussed earlier, the goal is toalleviate the lack of data evaluation expertise by providing software that captured such expertise andusing it to perform data evaluation. TDE makes use of the experimental and metadata from SOURCEtogether with software heuristics to evaluate the data for consistency, estimate missing properties to fillgaps, and fit the data to produce critically evaluated properties and parameters that can be used directlyin process calculations as shown schematically in Fig. 3. Dynamic data evaluations for pure componentsand binary mixtures are described in the following sections.
Pure-component propertiesPure-component properties of interest in process simulation are listed in Table 1. The algorithm used inpure-component property evaluation is shown in Fig. 4 and is described in details in ref. [4]. A briefdescription of the algorithm is given below.
Experimental pure-component property data are retrieved from the database and are divided intoblocks or types: phase diagram (e.g., phase boundary pressure, critical temperature), volumetric (e.g.,density, molar volume, critical density), energetic (e.g., enthalpy of vaporization or sublimation, heatcapacity at constant pressure), and other (e.g., viscosity, surface tension). Phase diagram properties areused to delineate the phase regions and their boundaries. The phase diagram, volumetric and energeticproperties are tied by thermodynamic consistency conditions—that is, they are related through mathe-matical thermodynamic identities. Properties in the “other” block have no influence on the first threeblocks of properties and are processed last.
Normalization refers to the process of combining closely related properties into single properties.For example, specific density, molar volume, and compressibility factor are combined into one prop-erty. This eliminates the complexity and confusion that will be caused by applying separate equationsfor each of these related properties.
For each block, after normalization, missing properties are added from predictions based ongroup-contribution, corresponding-states, and other methods; appropriate methods are selected based
Critically evaluated data in process simulation 1263
on the nature of the chemical system and property; data are fitted to the selected equations; and consis-tency within block is enforced. When all three blocks are processed, then inter-block consistency isenforced. Finally, the “other” properties, which depend on the first three blocks, are processed.
Three levels of consistency enforcement are used: single-property enforcement, in-block enforce-ment, and inter-block enforcement [4]. Single-property enforcement constrains a single fitting equationto be consistent with other properties. This is used to ensure that saturated vapor pressures are consis-tent with heat capacity differences between the liquid and gas phases at low pressures and to ensure thatcondensed-state phase boundary lines converge at triple points. In-block procedures are used for allvapor and sublimation pressures as well as for saturated liquid and gas densities and single-phase andsaturated gas densities. An inter-block procedure refines the gas density and enthalpy of vaporizationthrough improved consistency with vapor pressures and liquid densities [4].
Table 4 lists the estimation methods used in TDE. The methods range from the familiar Joback[35] and Benson [45] group-contribution methods to the work by Nannoolal and co-workers [34] andthe recent quantitative structure–-property relationship (QSPR) work of Kazakov and co-workers [37].Most of these methods are group-contribution-based, which require functional groups for the com-pounds to be known. TDE contains an algorithm that automatically maps the molecular structureobtained from SOURCE (or supplied by user) into the functional groups for the different estimationmethods involved.
For compounds for which limited or no experimental data are available, the thermodynamic con-straints and property evaluation procedure described above still apply. However, group-contribution andcorresponding-state methods are relied upon to provide the required information, instead of the exper-imental data. As a result, the uncertainties of the evaluated properties are relatively larger.
For pure-component properties, dynamic data evaluation can be performed unattended, withoutuser intervention. This is possible because (1) the rules involved in performing thermodynamic consis-tency test have been implemented and refined over many years of field use, (2) automatic generation ofgroups from molecular structure has been successfully implemented, (3) extensive estimation methods
Binary mixture propertiesExperimental property data of binary mixtures are needed in the development and validation of mixtureproperty models (correlations) used in process simulation. The most important properties are phase-equilibrium properties—VLE, LLE, and solid–liquid equilibrium (SLE) data. These data are used todetermine binary interaction parameters for either an activity coefficient or an equation-of-state model.Excess enthalpy and infinite-dilution activity coefficients data are also often used to improve the qual-ity and extend the application range of these models. The need for experimental data is not limited tothose related to phase equilibrium. To develop an accurate model for other properties such as liquid vis-cosity, binary liquid viscosity data are required. Mixture properties available in SOURCE are shown inTable 3.
Dynamic data evaluation of binary mixture data follows similar steps as those described in Fig. 4for pure components—that is, retrieval of the data from SOURCE, assessment of data quality, andfinally fitting the data to an appropriate mixture model. However, due to the large amount of data andthe complexity involved in fitting nonlinear mixture model to data, especially when more than one typeof data are involved (i.e., multi-property regression analysis), dynamic data evaluation cannot be per-formed automatically (i.e., unattended). User intervention is required. After retrieval of the binary data,quality of the VLE data can be assessed (see “Quality assessment of binary VLE data” section). Forother types of data, their quality beyond the uncertainty cannot yet be assessed. Finally, appropriate dataare used to determine binary interaction parameters of mixture model via regression.
Quality assessment of binary VLE data The most important data for vapor–liquid processes are binary VLE data. As shown in Table 3, currentlythere are more than 800000 VLE data points in SOURCE. These data comprise about 30000 uniquebinary mixtures. The challenge facing dynamic data evaluation of binary VLE data is how to deal withthis very large amount of data that are of varying quality and sometimes conflicting.
Critically evaluated data in process simulation 1265
Kang and co-workers [46] developed a quality assessment algorithm for binary VLE data basedon thermodynamic consistency tests. The algorithm combines four widely used tests of VLE consis-tency based on the requirements of the Gibbs–Duhem equation: Herrington or area test [47,48], pointor differential test [49,50], infinite dilution test [49,50], and Van Ness modeling test [51,52], with acheck of consistency between the binary VLE data and the pure-compound vapor pressures.Mathematical details of all tests are described fully in [46].
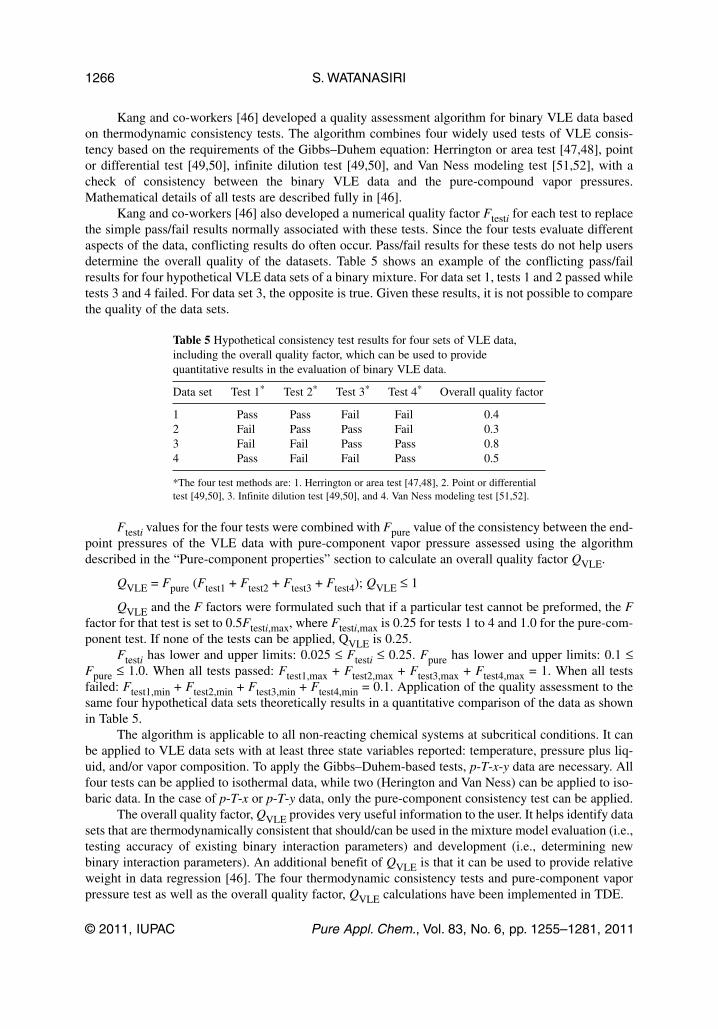
Kang and co-workers [46] also developed a numerical quality factor Ftesti for each test to replacethe simple pass/fail results normally associated with these tests. Since the four tests evaluate differentaspects of the data, conflicting results do often occur. Pass/fail results for these tests do not help usersdetermine the overall quality of the datasets. Table 5 shows an example of the conflicting pass/failresults for four hypothetical VLE data sets of a binary mixture. For data set 1, tests 1 and 2 passed whiletests 3 and 4 failed. For data set 3, the opposite is true. Given these results, it is not possible to comparethe quality of the data sets.
Table 5 Hypothetical consistency test results for four sets of VLE data,including the overall quality factor, which can be used to providequantitative results in the evaluation of binary VLE data.
Data set Test 1* Test 2* Test 3* Test 4* Overall quality factor
*The four test methods are: 1. Herrington or area test [47,48], 2. Point or differentialtest [49,50], 3. Infinite dilution test [49,50], and 4. Van Ness modeling test [51,52].
Ftesti values for the four tests were combined with Fpure value of the consistency between the end-point pressures of the VLE data with pure-component vapor pressure assessed using the algorithmdescribed in the “Pure-component properties” section to calculate an overall quality factor QVLE.
QVLE and the F factors were formulated such that if a particular test cannot be preformed, the Ffactor for that test is set to 0.5Ftesti,max, where Ftesti,max is 0.25 for tests 1 to 4 and 1.0 for the pure-com-ponent test. If none of the tests can be applied, QVLE is 0.25.
Ftesti has lower and upper limits: 0.025 ≤ Ftesti ≤ 0.25. Fpure has lower and upper limits: 0.1 ≤Fpure ≤ 1.0. When all tests passed: Ftest1,max + Ftest2,max + Ftest3,max + Ftest4,max = 1. When all testsfailed: Ftest1,min + Ftest2,min + Ftest3,min + Ftest4,min = 0.1. Application of the quality assessment to thesame four hypothetical data sets theoretically results in a quantitative comparison of the data as shownin Table 5.
The algorithm is applicable to all non-reacting chemical systems at subcritical conditions. It canbe applied to VLE data sets with at least three state variables reported: temperature, pressure plus liq-uid, and/or vapor composition. To apply the Gibbs–Duhem-based tests, p-T-x-y data are necessary. Allfour tests can be applied to isothermal data, while two (Herington and Van Ness) can be applied to iso-baric data. In the case of p-T-x or p-T-y data, only the pure-component consistency test can be applied.
The overall quality factor, QVLE provides very useful information to the user. It helps identify datasets that are thermodynamically consistent that should/can be used in the mixture model evaluation (i.e.,testing accuracy of existing binary interaction parameters) and development (i.e., determining newbinary interaction parameters). An additional benefit of QVLE is that it can be used to provide relativeweight in data regression [46]. The four thermodynamic consistency tests and pure-component vaporpressure test as well as the overall quality factor, QVLE calculations have been implemented in TDE.
Dynamic data evaluation is initiated as needed by the user as shown in Fig. 3, usually at the start of aproject. The most current experimental data are available through SOURCE for evaluation of built-inproperty models available in the simulator as well as for developing the pure-component and mixturemodels. TDE is the enabling technology that makes it possible to develop critically evaluated proper-ties and data quickly by encapsulating the expert data-evaluation knowledge in the software. Thedynamic nature of the data evaluation also means that the required thermophysical properties are devel-oped as needed and only for the systems of interest, thus making the problem more manageable. Thisis in contrast to the daunting task of developing the static database in anticipation of all possible needsand broad requirements as described in the preceding section.
The combined pure-component and binary interaction parameters constitute the critically evalu-ated properties and data that can be used directly to calculate the physical properties required by thesimulator (see Fig. 3).
IMPLEMENTATION IN THE PROCESS SIMULATOR
The static database for pure-component properties has been greatly expanded by using TDE and a scriptthat enables automatic evaluations of all pure components available in the SOURCE database. Thenumber of components increased from approximately 9000 to more than 30000 [1] over the last sev-eral years.
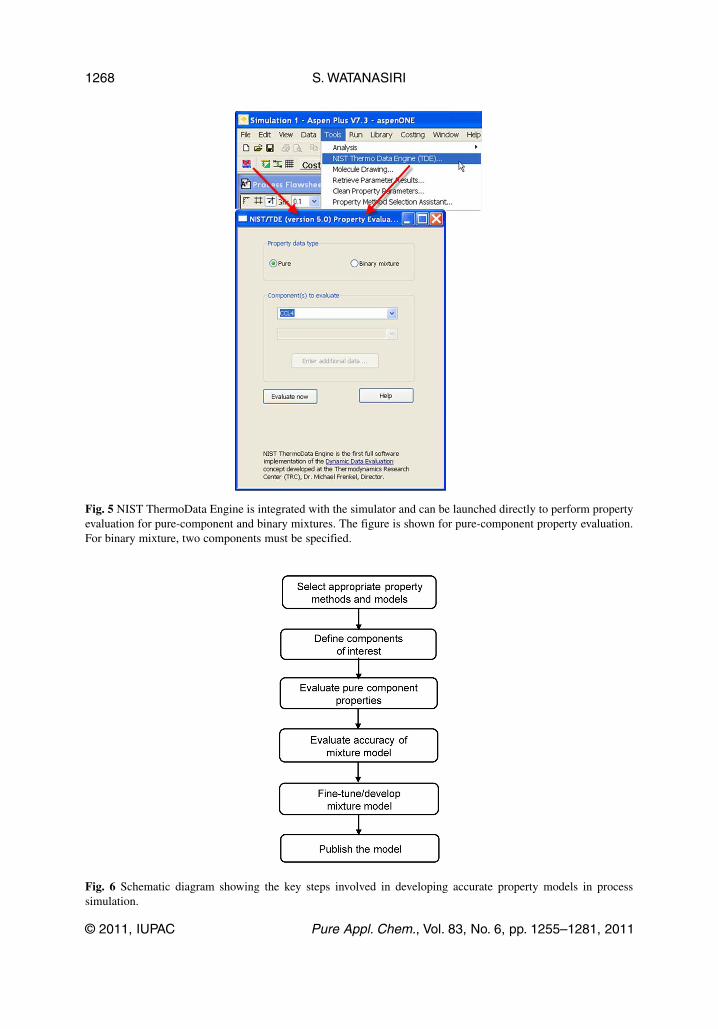
The dynamic data evaluation concept has been implemented in a process simulator, Aspen Plus[1], by integrating the essential elements of the TDE software using dynamic link library (DLL) and bydelivering a snapshot of the SOURCE database with the product. The SOURCE database is kept up todate by an automatic update that can be obtained from the company customer support web site on aquarterly basis. TDE is integrated seamlessly into the user interface and the workflow of process modeldevelopment. It can be accessed using either a menu option or a toolbar button as shown in Fig. 5.Availability of comprehensive experimental data in process simulator is a new development and, webelieve, is currently unique among the major process simulation programs.
This section describes the new workflow resulting from the implementation of this new technol-ogy. The workflow follows the steps shown in Fig. 6 to develop critically evaluated property datarequired for a process model—normally at the beginning of a project. These are recommended steps orbest practices that serve to illustrate how the new technology can be applied and is not meant to be arecipe. The user can deviate from the sequence as needed. It is also important to remember that dynamicdata evaluation can be initiated by the user at any time. Finally, this section aims to provide an overviewof the new technology, therefore, it does not describe many of the features of the physical property sys-tem of the simulator. Interested readers should refer to the online help feature of the simulator.
Fig. 5 NIST ThermoData Engine is integrated with the simulator and can be launched directly to perform propertyevaluation for pure-component and binary mixtures. The figure is shown for pure-component property evaluation.For binary mixture, two components must be specified.
Fig. 6 Schematic diagram showing the key steps involved in developing accurate property models in processsimulation.
Select property methods and models
Property methods and models most appropriate for the process of interest must be selected. Propertymethod in this simulator refers to a collection of calculation procedures that is used to calculate all therequired properties (see Table 1). For a given property, one or more specific models may be used. ThePeng–Robinson equation of state is an example of a model and it is used to calculate fugacity coeffi-cients, molar volume, enthalpy, entropy, and Gibbs free energy. One or more methods may be requiredto be able to model the entire process. For example, in the low-pressure section of the process, a prop-erty method based on an activity coefficient model may be used while in the high-pressure section, aproperty method based on an equation of state is more appropriate.
Property method selection is an important task that can be daunting for new users or for users whoare not familiar with thermodynamics, especially when there are a large number of methods and mod-els to choose from. For the simulator described in this work, there are more than 90 built-in methodsand several hundreds models. To assist the users, the simulator offers a Property Method SectionAssistant, which is rule-based software that provides suggestions of possible property methods to beused based on the answers that the user provided to a series of questions. For example, for generalchemical processes, the assistant will recommend that an activity coefficient-based method, such asNRTL [16], Wilson [27], or UNIQUAC [17] can be used. However, if the process is at high pressures(e.g., >10 bar), an equation of state with advanced mixing rules, such as predictiveSoave–Redlich–Kwong (PSRK) [15] should be used. If two liquid phases exist, a model capable of rep-resenting phase splitting must be used, such as an activity coefficient model (NRTL [16] or UNIQUAC[17]), or an equation-of-state model with advanced mixing rules (PSRK [15] or many others).Additional help is available for specific processes, such as azeotropic separations or those involving car-boxylic acids or hydrogen fluoride. For carboxylic acids, the assistant will recommend that an activitycoefficient model be used together with an equation of state that accounts of the effect of vapor-phaseassociation such as Nothnagel [53] or Hayden-O’Connell [26]. For electrolytic systems, phase andchemical equilibrium must be considered, and an electrolyte model, such as the electrolyte NRTLmodel [54], is recommended.
Define components of interest
The user has access to a library of over 30000 components as a result of the expansion of the static data-base described earlier. Flexible search helps locate the components quickly.
Evaluate pure-component properties
TDE can be used to evaluate properties of pure components. TDE is integrated with the simulator andcan be launched directly using either a menu option or a toolbar button as shown in Fig. 5. The com-ponent of interest is then selected for evaluation.
Results of the evaluation include the recommended property parameters, the underlying experi-mental data, and the estimated properties that were used. Results of dynamic data evaluation fortrimethylamine are shown in Fig. 7. The evaluated properties are shown on the left-hand side of theform. For each property, the critically evaluated parameter values are shown on the right-hand side.Figure 7 shows the parameter values of the Wagner equation for vapor pressure.
Evaluation results also include all the available experimental data, predicted values, and evaluatedresults. An example of the experimental data is shown in Fig. 8 for vapor pressure. Experimental val-ues are shown with uncertainty and literature citation. Data uncertainty and citation provide a measureof quality and traceability to the original source. The form also indicates whether or not a data point isaccepted or rejected by the evaluation algorithm. The experimental data and parameters can be savedwith the simulation case file using the Save button.
Fig. 7 Results of pure-component properties evaluation performed by TDE. Critically evaluated parameters for thevapor pressure model (Wagner [9]) for trimethylamine are shown. Results also include all available experimentaldata, predicted values used to fill gaps of experimental data, and evaluated results.
Fig. 8 Results of pure-component properties evaluation performed by TDE. Experimental vapor pressure data oftrimethylamine are shown.
Model prediction can be compared against experimental data. Figure 9 shows a typical plot of theproperty vs. temperature. In this case, the natural logarithm of vapor pressure of trimethylamine is plot-ted vs. inverse temperature. Accepted experimental data, those that were rejected, predicted data, andthe evaluation results (best fit to the Wagner equation) are shown.
As discussed earlier, it is important to improve the ability to handle new compounds that are notin the database. TDE can use molecular structure information imported from an MDL MOL file ordrawn using a molecular drawing tool. The drawing tool was developed and included with the AspenPlus simulator and can be invoked as shown in Fig. 10. As a result, in principle, TDE can be used toestimate the properties for any organic compound (including those which contain sulfur, fluorine, chlo-rine, bromine, and iodine), thus providing direct access to property values for literally millions of com-pounds, all with reliable and conservative estimates of uncertainty.
Critically evaluated data in process simulation 1271
Fig. 9 Vapor pressure of trimethylamine as a function of temperature. �: accepted experimental data; �: rejecteddata; �: predicted data using Ambrose–Walton method [40]; —: evaluation results (best fit to the Wagner equation[9]).
Evaluate accuracy of mixture model
After evaluation of pure components has been completed, the user can start the evaluation of mixtureproperties, which is a more complex task. As discussed earlier and shown in Table 2, the simulator con-tains a large number of built-in binary interaction parameters. It is important to ascertain whether or notthe binary interaction parameters are available for the components of interest. And if they are available,whether or not they are appropriate for the process conditions (temperature, pressure, composition) andtypes of phase equilibrium (VLE, LLE, SLE) under development. If the binary interaction parametersare not available, then they must be determined, subject to the degree of importance of the binary pairto the modeling problem at hand (e.g., whether they constitute key components, trace components thataffect product specification, or trace components with no important consequence).
To evaluate the accuracy of built-in binary interaction parameters or to develop new ones, exper-imental mixture data are required. For a component pair for which no experimental data are available,methods such as UNIFAC [55] can be used to fill the gaps. However, it must be emphasized that forfinal design and for key components, binary interaction parameters based on experimental data, evenlimited ones, are essential.
The TDE dialog box shown in Fig. 5 can be used to select the two components of interest tosearch for any available experimental mixture data. As an example, the binary mixture water and NMP(N-methyl-2-pyrrolidone) will be used. All available experimental data for the selected binary mixturefrom SOURCE are located and displayed on the results form as shown in Fig. 11. The data are catego-rized and displayed in a tree view on the left-hand side for convenience and easy access. For this sys-tem, binary diffusion coefficient, VLE, density, excess enthalpy, heat capacity at constant pressure, sur-face tension, and viscosity data are available. On the right-hand side, an overview of each data set isshown, including the number of data points, year of publication, temperature range, and pressure range.The temperature and pressure ranges are particularly useful as they can be used to identify the data setsmost appropriate for the process conditions of interest. Fitting data that are well beyond the tempera-ture and pressure ranges of the process can lead to a sub-optimum model, resulting in unnecessary sac-rifice of accuracy. However, these “extra” data can be used to test the extrapolation capability of the
Fig. 10 Molecular structure can be drawn and provided to TDE for use in pure-component property evaluation.Atomic connectivity information is used by TDE to automatically generate functional groups required by theappropriate estimation methods.
model, which is always a good practice. In many instances, overfitting the data (i.e., using more param-eters than is necessary) can result in poor extrapolation behavior.
Figure 12 displays isobaric data for NMP–water at 0.5332 bar from Golubkov et al. [56]. The datacan also be shown graphically by clicking on the Plot button. See Fig. 13 for T-x-y plot of the selectedNMP–water data, labeled binary VLE 007 in Fig. 12.
As discussed in the “Quality assessment of binary VLE data” section, it is useful to performthermo dynamic consistency tests for the VLE data. The overall quality assessment results can help theuser make informed decision regarding the data sets to use as well as the weighting factors to assign tothem when performing data regression, especially when there are many data sets available. The ther-modynamic consistency test is initiated by clicking on the Consistency button (see Fig. 12). Consistencytest results are displayed in the summary view (see Fig. 14) with the overall data quality (QVLE) andresults for each test. For this system, the overall data quality for the available data sets is relatively poor.Most of the isobaric data do not cover the entire composition range, similar to the data set shown in Fig.13. Nevertheless, the quality of one data set relative to another can still be inferred using QVLE.
Given experimental data (e.g., VLE, LLE, excess enthalpy), it is possible to verify the accuracyof the mixture model—provided that built-in binary interaction parameters exist. For the NMP–watersystem, their NRTL binary interaction parameters are available in the simulator as shown in Table 6.Only VLE data were used to determine these binary interaction parameters. The data covered a widetemperature range (293–451.49 K) and pressures up to atmospheric. As an illustrative example, the twosets of VLE data with the highest overall data quality (sets labeled binary VLE 007 and binaryVLE 008, in Fig. 12) will be used to verify the accuracy of the built-in binary interaction parameters.Binary VLE 007 is at 0.5332 bar, while binary VLE 008 is at 1.0132 bar with a combined temperature
Critically evaluated data in process simulation 1273
Fig. 11 The main TDE results form for binary mixture data. Data shown are for NMP–water. All availableexperimental data are shown together with the number of data points, year of publication, and temperature andpressure ranges. These information can help quickly identify data sets that should be further evaluated forsuitability in the application of interest.
Fig. 12 Experimental VLE data of NMP–water at 0.5332 bar from Golubkov et. al. [56]. The data can be plottedusing the Plot button. VLE data can also be evaluated for thermodynamic consistency using the Consistency button.Data sets of interest can be saved to the simulation case file using the Save to Form button.
Fig. 13 T-x-y diagram of NMP–water data at 0.5332 bar [56].
range of 357–433 K. In addition, excess enthalpy data of Kuramaki et al. [57] and Noll et al. [58] willalso be used. These data cover a temperature range of 298.15–416.15 K. Both types of data are wellwithin the valid temperature and pressure ranges of the built-in binary interaction parameters.
Table 6 Binary interaction parameters for the NRTL model [16]* for the water (1)–NMP(2) mixture.
The NRTL model with built-in binary parameters represents the VLE data quite well, as shownin Fig 15. Results for excess enthalpy are shown in Fig. 16. Significant deviations exist, especially at298.15 K for water mole fraction less than 0.6. Deviation on a percentage basis is very large (up to100 %) for both temperatures. This is not too surprising since excess enthalpy data were not used in theoriginal data regression work. However, considering the very large deviation, it is useful to explore thepossibility of improving the representation of excess enthalpy while maintaining the accuracy of VLEprediction.
Fig. 15 Comparison between NRTL model prediction using binary interaction parameters from Table 6 andexperimental VLE data of NMP–water binary mixture. Data from Golubkov et. al. [56]; 0.5332 bar (�); 1.0132 bar(�). NRTL results are shown as lines. – - –: built-in binary interaction parameters; —: regressed binary interactionparameters determined in this work; – –: extrapolation to 5.0 bar using the regressed parameters.
Fig. 16 Comparison between NRTL model prediction using binary interaction parameters from Table 6 andexperimental excess enthalpy data of NMP–water binary mixture. Data: 298.15 K (�) [57]; 416.15 K (�) [58].NRTL results are shown as lines. – - –: built-in binary interaction parameters; —: regressed parameters determinedin this work; – –: extrapolation to 500 K using the regressed parameters.
Fine-tune/develop mixture model
The NRTL model can be further improved by performing data regression—in this example, using bothVLE and excess enthalpy data. The same four sets of data used in the previous step are used here.Significantly higher weight was given to the two sets of VLE data. This corresponds to the higherimportance of phase equilibrium data.
Data regression can be initiated using the Data Regression button shown in Fig. 12. The newbinary interaction parameters are reported in Table 6. Results of the data regression for VLE and excessenthalpy are shown in Figs. 15 and 16, respectively. As can be seen (solid lines in the figures), VLE andexcess enthalpy data are adequately correlated. The excess enthalpy representation was significantlyimproved while maintaining the accuracy of VLE.
To further ascertain that the revised binary interaction parameters are reasonable, they are used topredict VLE and excess enthalpy at other conditions. VLE calculations are made at 5 bar and results areadded to Fig. 15. For excess enthalpy, the extrapolation is performed at 500 K. Results are shown inFig. 16. These results do not show any unusual behavior.
Since transport properties also have significant impact on process design and the associated cap-ital costs as discussed earlier, it is important to develop and improve transport property models.Unfortunately, this is an area where insufficient attention had been paid thus far. As an illustrative exam-ple, liquid viscosity of the NMP–water system is studied. As shown in Fig. 11, liquid viscosity data areavailable for this binary mixture. The experimental data of Henni et al. [59] are compared against themodel developed by Song and co-workers [60]. This model uses two binary interaction parameters (onesymmetric and another antisymmetric) to capture the nonlinear mixing behavior of liquid viscosity. Thebinary interaction parameters are also temperature-dependent, which provides better fit of experimen-tal data over a wide temperature range. First, calculations are made using the model at 298, 323, and343 K without the use of binary interaction parameters. Results are very poor when compared withexperimental data as shown in Fig. 17. Temperature-dependent binary interaction parameters are then
Critically evaluated data in process simulation 1277
Fig. 17 Comparison between prediction using the Song model [60] and experimental liquid viscosity data for theNMP–water binary mixture. Data of Henni et. al. [59] at 298 K (�), 323 K (�), and 343 K (�) are used. Modelresults are shown as lines. – - –: zero binary interaction parameters; —: regressed parameters shown in Table 7.
obtained by regression using the available experimental data; results are reported in Table 7. The pre-dicted liquid viscosity values are also compared against experimental data in Fig. 17. As shown, themodel can adequately correlate the very nonlinear, unsymmetric liquid viscosity data of this system.
Table 7 Binary interaction parameters for theliquid viscosity model [60]* for the water(1)–NMP (2) mixture.
Finally, the critically evaluated property data and parameters can be used with confidence in the simu-lation. After further validation in the field, the evaluated data can also be permanently stored in the data-base (see Fig. 3). In some organizations, property data developed for a project or process are packagedand deployed using a secured database [1] when working with a 3rd party vendor or joint venture. Thesecured database possesses unique characteristics in that the property data that are stored in the data-base can be used in the process calculations but cannot be viewed or altered. This helps facilitateexchange of process simulation files and enforce physical property standards while protecting the com-panies’ intellectual property. As a result of increasing globalization, the need to cooperate with 3rd partyvendors and joint ventures in other countries also increases. At the same time, companies recognize theneed to be more vigilant about their intellectual property, such as proprietary thermophysical propertydata and parameters.
LIMITATIONS AND FUTURE PLANS
Dynamic data evaluation is currently applicable to non-reacting chemical systems. It cannot be used forelectrolyte and polymer systems. Experimental data available in the SOURCE database are primarilyfor organic compounds. The estimation methods available for filling the gaps of experimental data ofpure components are also for those containing C, H, N, O, S, F, Cl, Br, I, and P atoms only.
Although TDE makes it possible to develop critically evaluated properties quickly and confi-dently, it is ultimately the responsibility of the engineer to ascertain that the resultant properties meetthe needs of the process model under development. TDE is an enabling technology, not a panacea, andshould be used in conjunction with scientific and engineering judgment.
The software technology related to the evaluation of pure-component properties is relatively welldeveloped. Much work remains on the evaluation of binary mixture properties as significant user inter-actions and expertise are still required. Future work will continue to be carried out in cooperation withour colleagues at TRC. The plan will be focused on improving data analysis, quality assessment, andregression of nonlinear models using multi-property data regression analysis with the aim to increasethe level of automation for critical evaluation of binary mixture data. The quality assessment algorithmwill be enhanced to handle binary VLE mixtures containing supercritical components, binary LLE, andother types of data. In addition, the extensive pure-component experimental data can be used to furtherrefine and extend the group-contribution methods to improve the accuracy as well as the type of atomsand functional groups that can be handled. Results of this research can also be used to further fine-tunethe heuristics used in the selection of the best method for estimating a given property for a given class
of compound. The ability to easily compare properties of compounds within a homologous series willalso be a very useful addition. TDE is expected to be extended to cover ternary data.
Finally, for completeness, we would like to note that other valuable tools exist that provide struc-ture-based estimation, experimental data access and analysis, and process synthesis tools, for example,DDB Software Package DDBSP [24] and DECHEMA DPP [61]. However, they are not available withinthe domain of the process simulator and therefore lack close interoperability and, to some extent, com-patibility. More importantly, these software are separately licensed at significant cost relative to the costof the simulator, thus they are not accessible to the majority of the users unlike the technology describedin this work, which is provided by default as an integral part of the simulator.
CONCLUSIONS
In this paper, we described the important role thermophysical properties play in the development ofprocess simulation models, reviewed past practice in obtaining the necessary property data, and intro-duced a new technology that can be used to overcome the shortcomings of the current method. The newtechnology is software that implements the dynamic data evaluation concept, which makes use of exper-imental thermophysical property data, structure-based property estimation system, data analysis, andregression algorithms to generate critically evaluated property data and parameters. The implementa-tion of the new technology in a process simulator, Aspen Plus, has been described and illustrated viaexamples.
Direct access to the “raw” experimental data is a fundamental shift in the process simulation mar-ket. The enabling technology, NIST ThermoData Engine, allows the required thermophysical proper-ties to be obtained “on-demand” with confidence. Engineers can more easily develop accurate mixturemodels based on experimental data that cover conditions relevant to the process of interest—with fulltraceability of data and parameters to the original source. The technology helps accelerate processmodel development and ensures higher-quality models. The resulting models also help companies opti-mize operating conditions and run their processes with greater agility, helping them stay profitable in avolatile market.
ACKNOWLEDGMENTS
The author wishes to acknowledge the technical cooperation and supports of the members of the TRCof NIST. Special thanks go to Dr. Michael Frenkel, director of TRC whose leadership, vision, and stead-fast support make this work possible. The author also wishes to thank his colleagues at AspenTechnology: Dr. Maohua Cao and Dr. Shu Wang for developing the software integration between AspenPlus and TDE; Dr. Vikas Dhole, Dr. Chau-Chyun Chen, Mr. David Tremblay, and Mr. Willie Chanwhose management support and encouragement are critical to the successful introduction of the tech-nology into our software.
REFERENCES
1. Aspen Plus® Versions 2006, 2006.5, V7, V7.1, and V7.2. Aspen Technology, Inc. Burlington,MA, USA.
2. B. E. Poling, J. M. Prausnitz, J. P. O’Connell. The Properties of Gases and Liquids, 5th ed.,McGraw-Hill, New York (2001).
3. H. I. Britt, R. Luecke. Technometrics 15, 233 (1973).4. M. Frenkel, R. D. Chirico, V. Diky, X. Yan, Q. Dong, C. Muzny. J. Chem. Inf. Model 45, 816
(2005).5. J. R. Fair. Advanced Process Engineering, AIChE Monogram Series 13, 76 (1980).
Critically evaluated data in process simulation 1279
6. R. Dohrn, O. Pfohl. Presented at the 17th European Symposium on Applied Thermodynamics,Vilamoura, Portugal (1999).
7. D. Y. Peng, D. B. Robinson. Ind. Eng. Chem. Fundam. 15, 59 (1976).8. (a) C. Antoine. C. R. Hebd. Séances Acad. Sci. 107, 681 (1888); (b) C. Antoine. C. R. Hebd.
Séances Acad. Sci. 107, 778 (1888); (c) C. Antoine. C. R. Hebd. Séances Acad. Sci. 107, 836(1888).
9. W. Wagner. Cryogenics 13, 470 (1973).10. Aspen HYSYS® Version V7.1. Aspen Technology, Inc. Burlington, MA, USA.11. H. G. Rackett. J. Chem. Eng. Data 15, 514 (1970).12. R. E. Thek, L. I. Stiel. AIChE J. 13, 626 (1967).13. F. A. Aly, L. L. Lee. Fluid Phase Equilib. 6, 169 (1981).14. E. N. da C. Andrade. Nature 125, 309 (1930).15. T. Holderbaum, J. Gmehling. Fluid Phase Equilib. 70, 251 (1991).16. H. Renon, J. M. Prausnitz. AIChE J. 14, 135 (1968). 17. D. S. Abrams, J. M. Prausnitz. AIChE J. 21, 116 (1975).18. P. Chang, C. R. Wilke. J. Phys. Chem. 59, 592 (1955).19. W. V. Wilding, R. L. Rowley, J. L. Oscarson. Fluid Phase Equilib. 150–151, 413 (1998).20. I. Barin. Thermochemical Data of Pure Substances, VCH, Weinheim (1989).21. D. D. Wagman, W. H. Evans, V. B. Parker, R. H. Schumm, I. Halow, S. M. Bailey, K. L. Churney,
R. L. Nuttall. J. Phys. Chem. Ref. Data 11, Suppl. 2 (1982).22. J. Gmehling, U. Onken, W. Arlt, P. Grenzheuser, B. Kolbe, U. Weidlich, J. Rarey. Vapor-Liquid
Equilibrium Data Collection, 31 parts, DECHEMA Chemistry Data Series, Frankfurt(1977–1978).
23. H. Knapp, R. Doring, L. Oellrich, U. Plocker, J. M. Prausnitz, R. Langhorst, S. Zeck. Vol. VI:Vapor-Liquid Equilibrium for Mixtures of Low Boiling Substances, DECHEMA Chemistry DataSeries, Frankfurt (1982).
24. J. Rarey, J. Gmehling. Pure Appl. Chem. 81, 1745 (2009).25. S. Watanasiri, M. R. Brule, K. E. Starling. AIChE J. 28, 626 (1982).26. J. G. Hayden, J. P. O’Connell. Ind. Eng. Chem. Process Des. Dev. 14, 209 (1975).27. G. M. Wilson. J. Am. Chem. Soc. 86, 127 (1964).28. O. Redlich, J. N. S. Kwong. Chem. Rev. 44, 233 (1949).29. V. Diky, R. D. Chirico, R. C. Wilhoit, Q. Dong, M. Frenkel. J. Chem. Inf. Comput. Sci. 43, 15
(2003).30. V. Diky, C. Muzny, E. Lemmon, R. D. Chirico, M. Frenkel. J. Chem. Inf. Model. 47, 1713 (2007).31. V. Diky, R. D. Chirico, A. F. Kazakov, C. Muzny, M. Frenkel. J. Chem. Inf. Model. 49, 503
(2009).32. L. Constantinou, R. Gani. AIChE J. 40, 1697 (1994). 33. J. Marrero-Morejon, E. Pardillo-Fontdevila. AIChE J. 45, 615 (1999). 34. Y. Nannoolal, J. Rarey, D. Ramjugernath, W. Cordes. Fluid Phase Equilib. 226, 45 (2004).35. K. G. Joback, R. C. Reid. Chem. Eng. Commun. 57, 233 (1987). 36. G. M. Wilson, L. V. Jasperson. AIChE Meeting, New Orleans, LA (1996). 37. A. Kazakov, C. D. Muzny, V. Diky, R. D. Chirico, M. Frenkel. Fluid Phase Equilib. 298, 131
(2010).38. (a) L. Riedel. Chem.-Ing.-Tech. 26, 259 (1954); as modified in (b) J. L. Hales, R. Townsend. J.
Chem. Thermodyn. 4, 763 (1972). 39. B. E. Poling, J. M. Prausnitz, J. P. O’Connell. The Properties of Gases and Liquids, 5th ed.,
p. 6.22, McGraw-Hill, New York (2001). 40. D. Ambrose, J. Walton. Pure Appl. Chem. 61, 1395 (1989).
41. B. E. Poling, J. M. Prausnitz, J. P. O’Connell. The Properties of Gases and Liquids, 5th ed., p. 9.9,McGraw-Hill, New York (2001).
42. S. R. S. Sastri, K. K. Rao. Chem. Eng. J. 50, 9 (1992). 43. T. H. Chung, L. L. Lee, K. E. Starling. Ind. Eng. Chem. Fundam. 23, 8 (1984). 44. T. H. Chung, M. Ajlan, L. L. Lee, K. E. Starling. Ind. Eng. Chem. Res. 27, 671 (1988). 45. B. E. Poling, J. M. Prausnitz, J. P. O’Connell. The Properties of Gases and Liquids, 5th ed.,
Section 3-5, McGraw-Hill, New York (2001). 46. J. W. Kang, V. Diky, R. D. Chirico, J. W. Magee, C. D. Muzny, I. Abdulagatov, A. F. Kazakov,
M. Frenkel. J. Chem. Eng. Data 55, 3631 (2010).47. E. F. G. Herington. J. Inst. Pet. 37, 457 (1951). 48. J. Wisniak. Ind. Eng. Chem. Res. 32, 1531 (1993).49. K. Kojima, H. M. Moon, K. Ochi. Fluid Phase Equilib. 56, 269 (1990). 50. K. Kurihara, Y. Egawa, K. Ochi, K. Kojima. Fluid Phase Equilib. 219, 75 (2004). 51. H. C. Van Ness, S. M. Byer, R. E. Gibbs. AIChE J. 19, 238 (1973). 52. P. L. Jackson, R. A. Wilsak. Fluid Phase Equilib. 103, 155 (1995).53. K.-H. Nothnagel, D. S. Abrams, J. M. Prausnitz. Ind. Eng. Chem. Process Des. Dev. 12, 25
(1973).54. C. C. Chen, H. I. Britt, J. F. Boston, L. B. Evans. AIChE J. 28, 588 (1982).55. A. Fredenslund, R. L. Jones, J. M. Prausnitz. AIChE J. 21, 1086 (1975).56. Y. V. Golubkov, T. G. Repneva, L. M. Raginskaya. Prom-st. Sint. Kauch. 7, 1 (1975).57. S. Murakami, R. Tanaka, R. J. Fujishiro. Solution Chem. 3, 71 (1974).58. O. Noll, K. Fischer, J. Gmehling. J. Chem. Eng. Data 41, 1434 (1996).59. A. Henni, J. J. Hromek, P. Tontiwachwuthikul. J. Chem. Eng. Data 49, 231 (2004).60. Y. Song, P. M. Mathias, D. Tremblay, C. C. Chen. Ind. Eng. Chem. Res. 42, 2415 (2003).61. U. Westhaus, R. Sass. Fluid Phase Equilib. 49, 222 (2004).


![Critically Evaluated Energy Levels and Spectral Lines of ... · Sansonetti and Martin [6] re-analyzed the fine-structure data of Paschen and Campbell together with Bhatia’s observations](https://static.documents.pub/doc/80x56/5eb5eb4aefb69b0cd30adb32/critically-evaluated-energy-levels-and-spectral-lines-of-sansonetti-and-martin.jpg)


