The Journal of Neuroscience, December 1993, f3(12): 5251-5262 Development of Orientation Selectivity in Ferret Visual Cortex and Effects of Deprivation Barbara Chapman and Michael P. Stryker W. M. Keck Foundation Center for Integrative Neuroscience, Department of Physiology, University of California, San Francisco, California 94143-0444 The orientation selectivity of cells in ferret primary visual cortex was studied during normal development and in ani- mals deprived of vision or of visual cortical activity. In normal animals from the age when visual responses were first re- corded (postnatal day 23) through postnatal week 5, only about 25% of cells showed orientation-selective responses. By postnatal week 7, cortical responses had matured to an adult-like state, with approximately 75% of cells clearly se- lective for orientation. This development of orientation se- lectivity was not merely a reflection of the development of cortical cell responsiveness: at all ages studied, there was no correlation between responsiveness and selectivity. In- fusion of TTX into visual cortex to silence neuronal activity completely blocked the maturation of orientation selectivity. Visual deprivation by bilateral lid suture impaired but did not completely block the normal development of orientation se- lectivity. We conclude that the maturation of orientation-se- lective responses in ferret primary visual cortex requires cortical neuronal activity, and that normal development re- quires visually driven activity. [Key words: orientation column, TTX, activity, visual de- privation, plasticity, responsiveness, area 171 Neurons in the primary visual cortex of higher mammals re- spond best to stimuli containing light/dark borders presented at particular angles in the visual field. The development of this cortical orientation specificity has been widely studied, with somewhatconflicting results reported in the literature. Orien- tation-specific responses appear to be present at birth in the macaque monkey (based on a small number of cells in one animal; Wiesel and Hubel, 1974). In the cat, there is some disagreement as to the degree of orientation specificity exhibited by striate cortex cells in very young individuals. In kittens stud- ied near the end of the first postnatal week, before the time of natural eye-opening, the reported percentages of orientation- selective cells range from zero (Barlow and Pettigrew, 1971; Pettigrew, 1974),through 25-30% (Blakemoreand Van Sluyters, 1975; Buisseretand Imbert, 1976; Fregnac and Imbert, 1978; Albus and Wolf, 1984) to 100% (Hubel and Wiesel, 1963). These discrepancies may be due to the difficulties involved in electrophysiologicalrecording in suchyoung animals. The cells in area 17 of 1 -week-old kittens have low spontaneous activity, Received Jan. 4, 1993; revised June 3, 1993; accepted June 15, 1993. This work was supported by NIH Grant EY02874 and by an award from the Human Frontiers Science Program. Correspondence should be addressed to Barbara Chapman, Beckman Institute, Mail Code 139-74, Caltech, Pasadena, CA 9 I 125. Copyright 0 1993 Society for Neuroscience 0270-6474/93/135251-12$05.00/O respond sluggishly to stimulation, and habituate rapidly (Hubel and Wiesel, 1963). These response characteristicsmake it dif- ficult to determine a cell’s orientation specificity. An additional problem in recording from young animals is the fragility of the preparation. The specificity of responses of kitten visual cortical neurons is dependent on the physiological condition of the an- imal: smallchanges in blood pressure or expired carbon dioxide levels can make a previously orientation-selective cell become nonspecific or unresponsive (Blakemore and Van Sluyters, 1975). These difficulties in recording would tend to decrease the re- ported percentage of orientation-selective cells, suggesting that studiesshowingno orientation specificity in very young kittens may be invalid (Stryker, 1977). The cat therefore has two major disadvantages as a model systemfor studying the development of cortical cell orientation selectivity. First, it is difficult to maintain young kitten visual cortex in an adequately responsivestate to judge the degree of selectivity of cortical neuron responses. Second, orientation- specific responses may already be present at birth in the cat, making it difficult to perform experimental manipulations dur- ing the time that orientation specificity is developing. These problems could potentially be avoided by studying development of orientation selectivity in the visual cortex of the pigmented ferret. The ferret visual systemis quite similar to that of the cat (Law et al., 1988), but the ferret is born approximately 3 weeks earlier in development (Linden et al., 1981). The ferret might thus provide a system in which the development of cortical orientation selectivity occursafter birth, and individuals are old enough to be relatively hardy when orientation-selective re- sponses first develop. We have studied the normal development of orientation se- lectivity in the ferret by recording the responses of primary visual cortical neurons to moving oriented bars of light in an- imals at different ages.In order to determine whether the de- velopment of orientation-selective responses wasdependenton the presence of neuronalactivity, as is the development of ocular dominance columns and normal ocular dominance character- istics (Stryker and Harris, 1986), we studied ferrets deprived of cortical neuronal activity by the infusion of the sodium-channel blocker TTX directly into area 17. To study the role of visual experience in the development of orientation selectivity, we examined animals deprived of vision by binocular lid suture from before the time of natural eye opening. Materials and Methods Animals. Pigmented ferret adults and timed-pregnant females were ob- tained from Marshall Farms (New Rose, NY). For the studies of normal cortical development, a total of 30 animals ranging in age from postnatal
Transcript
The Journal of Neuroscience, December 1993, f3(12): 5251-5262
Development of Orientation Selectivity in Ferret Visual Cortex and Effects of Deprivation
Barbara Chapman and Michael P. Stryker
W. M. Keck Foundation Center for Integrative Neuroscience, Department of Physiology, University of California, San Francisco, California 94143-0444
The orientation selectivity of cells in ferret primary visual cortex was studied during normal development and in ani- mals deprived of vision or of visual cortical activity. In normal animals from the age when visual responses were first re- corded (postnatal day 23) through postnatal week 5, only about 25% of cells showed orientation-selective responses. By postnatal week 7, cortical responses had matured to an adult-like state, with approximately 75% of cells clearly se- lective for orientation. This development of orientation se- lectivity was not merely a reflection of the development of cortical cell responsiveness: at all ages studied, there was no correlation between responsiveness and selectivity. In- fusion of TTX into visual cortex to silence neuronal activity completely blocked the maturation of orientation selectivity. Visual deprivation by bilateral lid suture impaired but did not completely block the normal development of orientation se- lectivity. We conclude that the maturation of orientation-se- lective responses in ferret primary visual cortex requires cortical neuronal activity, and that normal development re- quires visually driven activity.
Neurons in the primary visual cortex of higher mammals re- spond best to stimuli containing light/dark borders presented at particular angles in the visual field. The development of this cortical orientation specificity has been widely studied, with somewhat conflicting results reported in the literature. Orien- tation-specific responses appear to be present at birth in the macaque monkey (based on a small number of cells in one animal; Wiesel and Hubel, 1974). In the cat, there is some disagreement as to the degree of orientation specificity exhibited by striate cortex cells in very young individuals. In kittens stud- ied near the end of the first postnatal week, before the time of natural eye-opening, the reported percentages of orientation- selective cells range from zero (Barlow and Pettigrew, 1971; Pettigrew, 1974), through 25-30% (Blakemore and Van Sluyters, 1975; Buisseret and Imbert, 1976; Fregnac and Imbert, 1978; Albus and Wolf, 1984) to 100% (Hubel and Wiesel, 1963). These discrepancies may be due to the difficulties involved in electrophysiological recording in such young animals. The cells in area 17 of 1 -week-old kittens have low spontaneous activity,
Received Jan. 4, 1993; revised June 3, 1993; accepted June 15, 1993.
This work was supported by NIH Grant EY02874 and by an award from the Human Frontiers Science Program.
Correspondence should be addressed to Barbara Chapman, Beckman Institute, Mail Code 139-74, Caltech, Pasadena, CA 9 I 125. Copyright 0 1993 Society for Neuroscience 0270-6474/93/135251-12$05.00/O
respond sluggishly to stimulation, and habituate rapidly (Hubel and Wiesel, 1963). These response characteristics make it dif- ficult to determine a cell’s orientation specificity. An additional problem in recording from young animals is the fragility of the preparation. The specificity of responses of kitten visual cortical neurons is dependent on the physiological condition of the an- imal: small changes in blood pressure or expired carbon dioxide levels can make a previously orientation-selective cell become nonspecific or unresponsive (Blakemore and Van Sluyters, 1975). These difficulties in recording would tend to decrease the re- ported percentage of orientation-selective cells, suggesting that studies showing no orientation specificity in very young kittens may be invalid (Stryker, 1977).
The cat therefore has two major disadvantages as a model system for studying the development of cortical cell orientation selectivity. First, it is difficult to maintain young kitten visual cortex in an adequately responsive state to judge the degree of selectivity of cortical neuron responses. Second, orientation- specific responses may already be present at birth in the cat, making it difficult to perform experimental manipulations dur- ing the time that orientation specificity is developing. These problems could potentially be avoided by studying development of orientation selectivity in the visual cortex of the pigmented ferret. The ferret visual system is quite similar to that of the cat (Law et al., 1988), but the ferret is born approximately 3 weeks earlier in development (Linden et al., 1981). The ferret might thus provide a system in which the development of cortical orientation selectivity occurs after birth, and individuals are old enough to be relatively hardy when orientation-selective re- sponses first develop.
We have studied the normal development of orientation se- lectivity in the ferret by recording the responses of primary visual cortical neurons to moving oriented bars of light in an- imals at different ages. In order to determine whether the de- velopment of orientation-selective responses was dependent on the presence of neuronal activity, as is the development of ocular dominance columns and normal ocular dominance character- istics (Stryker and Harris, 1986), we studied ferrets deprived of cortical neuronal activity by the infusion of the sodium-channel blocker TTX directly into area 17. To study the role of visual experience in the development of orientation selectivity, we examined animals deprived of vision by binocular lid suture from before the time of natural eye opening.
Materials and Methods Animals. Pigmented ferret adults and timed-pregnant females were ob- tained from Marshall Farms (New Rose, NY). For the studies of normal cortical development, a total of 30 animals ranging in age from postnatal
5252 Chapman and Stryker * Development of Orientation Selectivity in Ferrets
day 20 (P20) through adulthood were studied. Data presented here also include results from eight additional adult ferrets from a previous study (D. M. Waitzmann and M. P. Stryker, unpublished observations). Seven additional experimental and control ferrets were used in the study of the effects ofactivity blockade on development oforientation selectivity, and seven additional ferrets were used to determine the effects of visual deprivation. One adult ferret and two postnatal week 5 ferrets were used for lateral geniculate nucleus (LGN) recordings. All ferrets were housed in the University of California at San Francisco animal care facility under a light/dark cycle of 18 hr light, 6 hr dark. One normal adult cat from the University of California colony was also studied. Ages are referred to in postnatal weeks, beginning with 1 rather than 0. Week 4 thus refers to the ages P22-P28, the week before the animal had attained 4 weeks of age.
Surgery. The techniques of surgery, anesthesia, and monitoring used on animals 6 weeks old through adult have been described previously (Chapman et al., 199 1). Certain modifications in these procedures were necessary in animals less than 6 weeks old. The young animals were initially anesthetized with an intramuscular injection of 0.04 mg/kg acepromazine and 40 mg/kg ketamine, and received 0.4 mg atropine sulfate to prevent breathing difficulties from mucous accumulation. An- esthesia was supplemented with thiopental sodium administered in some animals intravenously via a jugular cannulation or intraperitoneally in other animals (the femoral vein in young ferrets is too small to can- nulate). Tracheal cannulation, scalp incision, cistemal puncture, and craniotomy were performed as in older animals, and lidocaine was applied to all wound margins. Since the young ferrets’ skulls were not yet fully calcified, the animals could not be held by ear bars in a ste- reotaxic frame, but instead were held by a metal rod attached to the skull rostra1 to the craniotomy using self-tapping stainless steel screws (Small Parts, Inc.) and dental cement (Fastcure, Kerr Laboratory Prod- ucts). Due to the young animals’ small lung volume, peak expired carbon dioxide could not be monitored accurately. Therefore, these animals were allowed to breathe freely a mixture of 2:l nitrous oxide:oxygen, rather than being paralyzed and respirated as were older animals. This allowed for direct monitoring of anesthetic state by testing for a with- drawal reflex to a toe pinch. Heart rate was monitored throughout the experiments, and temperature was maintained at 37.5”C using a feed- back system. Atropine sulfate (2%) drops were administered to the eyes to dilate the pupils, and the eyes were covered with a thin layer of 30K silicone oil to protect the corneas. In most animals, eyes were immo- bilized using eye rings attached to the conjunctiva near the scleral margin with 8-O ophthalmic silk (Ethicon). In other animals eye movements were monitored during the recording session by watching the computer- generated raster of times of spike firings; if eye movements occur, the position of the receptive field seen in the raster moves. Data were discarded from any stimulus run during which the eyes moved.
Tetrodotoxin treatment. Seven ferrets, aged 21-23 d, were anesthe- tized with halothane (l-2%) in a mixture of 2: 1 nitrous oxide:oxygen. Under aseptic conditions, the scalp was retracted, and a 30 gauge, bev- eled, stainless steel cannula was implanted through the skull into visual cortex in one hemisphere. The cannula was located approximately 8 mm rostra1 to the caudal pole and 3 mm lateral to the midline, and was angled approximately 30”caudally in the parasagittal plane. The cannula was immobilized and attached to the skull using dental cement (Fa- stcure, Kerr Laboratory Products). Attached to the cannula was an osmotic minipump (Alzet 2002, Alza) that was implanted under the skin between the animal’s shoulder blades. The minipump delivered, at 0.5 pl/hr, 5 PM TTX (six animals) or 0.9% saline (one animal) through the cannula into visual cortex. Following surgery, the animals were returned to their mothers. The osmotic minipumps have a pumping duration of 14 d; after 12-14 d, pumps were replaced under aseptic conditions, and infusion was continued to produce a total of 23-26 d of TTX treatment. In two TTX-treated animals, electrophysiological recordings were then performed in order to determine the area of activity blockade in the cortex nroduced bv the TTX infusion. Osmotic mini- pumps were removed f;om the othkr four ferrets, and the animals sur- vived an additional 3-l d in order to allow the TTX to wear off and neuronal activity to recover before electrophysiological recordings were performed in both experimental and control hemispheres.
Binocular deprivation. Seven ferrets, aged 28-30 d, were anesthetized with halothane (l-2%) in a mixture of 2: 1 nitrous oxide:oxygen. Both eyes’ lids were gently pulled apart, the lid margins were excised, and the eyelids were sutured shut. The animals were returned to their moth- ers and allowed to mature under a normal light cycle. Sutures were removed 7 d after the surgery. Electrophysiological recordings were
performed during the 8th, 9th, 10th and 13th postnatal weeks, on P55, P56, P57, P66, P87, P88 and P90.
Electrophysiological recording. Extracellular recordings were made in ferret and cat primary visual cortex and lateral geniculate nucleus (LGN) using lacquer-coated tungsten electrodes (Hubel, 1957). Cortical micro- electrode penetrations were either radial or angled in the coronal plane. LGN penetrations were vertical. Receptive fields were first plotted by hand using a Zeiss lamp. All of the cortical units recorded in these studies had centrally located receptive fields, within 15” of area centralis. An orientation tuning histogram was compiled for each cell using a computer-driven display of moving light bars swept across the receptive field. The light bars were presented either at 12 [for four of the young animals from this study and all eight ofthe adult animals from a previous study (Waitzmann and Stryker, unpublished observations)] or at 36 (for all other animals) different orientations. There were three repetitions of each stimulus, and presentations were randomly interleaved. For each stimulus condition the average firing rate of the cell was determined across the portion of the sweep where firing rate was elevated. The spontaneous activity of each cell in the absence of visual stimulation was also determined. Electrolytic marking lesions were made along each electrode track after the recordings were completed.
Data analysis. Prior to analysis of orientation tuning, the spontaneous firing rate for each cell was subtracted from the firing rate in response to stimulation. Since orientation tuning is a circular function with a period of 180”, the orientation selectivity of a neuron can be determined by taking a Fourier transform of the data from the orientation tuning histograms and examining the amplitude of the second harmonic com- ponent (Worgotter and Eysel, 1987). The amplitude at the second har- monic (A*) was normalized by dividing by the sum of the DC level (& average elevation in firing rate of the cell produced by the stimuli) and the amplitude of the second harmonic component. This number was then multiplied by 100 to produce an orientation selectivity index (OSI) varying from 0 (no orientation specificity) to 100 (very tightly tuned for orientation). Thus, OS1 = (A,/& + AJ) x 100. The OS1 measure of orientation tuning incorporates all three conventional tuning measures: bandwidth, depth of modulation, and suppression. Thus, tuning his- tograms with smaller half-width at half-height, larger peak-to-trough ratio, or greater decrease in firing rate below spontaneous at null ori- entation, will all have higher OSIs. Examples of orientation tuning his- tograms labeled with their calculated OSIs are shown in Figure 1. Tuning curves with OSIs of less than 25 show little or no evidence of orientation specificity.
To determine whether the two different stimulus presentation para- digms used in this study affected the OS1 that would be calculated for a given cell, orientation tuning histograms from a set of 50 neurons spanning the whole range of orientation selectivity were examined. The histograms, from neurons that had originally been stimulated with 36 different orientations of moving light bars at lo” intervals, were rean- alyzed looking only at the responses to 12 orientations of stimulus at 30” intervals. The OSIs for each cell determined with these two analyses were highly correlated (P = 0.92). In no cell was the difference in the calculated index for the two conditions more than 10, and in all but 4 of the 50 cells the difference was less than 5. There was no bias toward higher numbers in either analysis. Additional evidence for the lack of effect of the stimulus presentation paradigm on the calculated degree of orientation specificity was provided by a comparison of the distribution of OSIs calculated for 80 neurons where stimuli were presented at 10” intervals in two adult ferrets with the distribution calculated for 74 neurons where stimuli were presented at 30” intervals in eight adult ferrets from a previous study (Waitzmann and Stryker, unpublished observations). These two distributions were indistinguishable from each other (Mann-Whitney U test, p = 0.26).
Histology. After the electrophysiological recording sessions, animals were given an overdose of pentobarbital (SO-100 mg/kg) administered intravenously, and were perfused intracardially with 0.9% saline fol- lowed by 10% form01 saline. The occipital cortex was removed and postfixed in 10% form01 saline. Coronal sections (50 pm) were cut on a vibratome, mounted on slides, and stained with cresyl violet in order to visualize electrode tracks and electrolytic marking lesions.
Results Normal development of orientation selectivity The earliest age at which visually evoked neuronal responses were recorded in ferret primary visual cortex was P23. In four
40-
35-
30-
25-
zo-
15-
lo-
5-
O-
35- OSI = 25 30-
25-
40- OSI = 46 35-
30-
25-
zo-
15-
lo-
5-
O-
60
30
20
10
0 i
The Journal of Neuroscience, December 1993. 73(12) 5253
40-
35-
30-
25-
zo-
15-
lo-
s-
O--
60- OSI = 37 70-
60-
50-
40-
30-
zo-
lo-
O-
35 30
25
20
animals aged P20-P22, spontaneously active cells were record- ed, but they did not respond reliably to visual stimulation under the conditions of anesthesia employed.
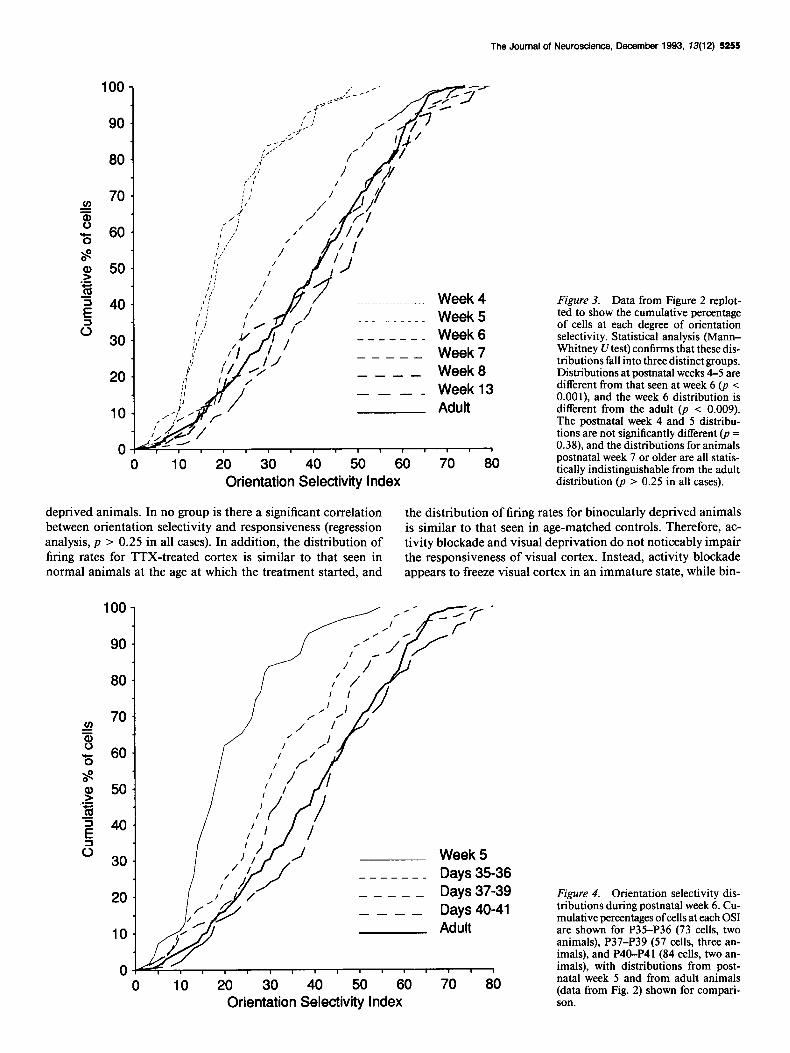
The distributions of OSIs for neurons recorded in area 17 of ferrets at different ages are shown in the histograms in Figure 2. These histograms are replotted as cumulative percentages of cells at each OS1 in Figure 3 in order to facilitate comparisons between the different distributions. In week 4 at P23, and con- tinuing through postnatal week 5, the majority of cells in area 17 were not tuned for orientation, with about 75% ofcells having
Figure 1. Orientation tuning histo- grams for eight neurons recorded in adult ferret primary visual cortex. Each histogram shows mean response of the cell (in spikes/set) to three presenta- tions of each of 36 randomly inter- leaved orientations of moving bar light stimuli swept across the cell’s receptive field: 0” represents a leftward-moving vertical bar; 90” represents a down- ward-moving horizontal bar. Error bars are SEM. Spontaneous activity level is indicated at the right ofeach histogram. The OS1 calculated from the data in each histogram is shown.
an OSIs of less than 25. Even at the age when cortex was first responsive, however, some cells showed quite strong orientation tuning (the maximum OS1 at P23 was 47). The distribution of orientation selectivity began to change during postnatal week 6. By postnatal week 7 the distribution of orientation tuning was statistically indistinguishable from that seen in adults (Mann- Whitney U test, p = 0.33). In adult ferret primary visual cortex, about 25% of cells are unselective for stimulus orientation.
The maturation of orientation selectivity that occurs during postnatal week 6 is a gradual process, as shown in Figure 4.
5254 Chapman and Stryker - Development of Orientation Selectivity in Ferrets
10 postnatal week 4 8,
6
:,11 0 1020304050607080
10
8
6
4
2
4 ,?
‘0 1020304050607080 ”
510
a 8, postnatal week 8
6
0 1020304050607080
10
I
postnatal week 5 8 61 I
HL 0 1020304050607080
10 postnatal week 7 8 6
2 II Ill1 1
‘0 1020304050607080
10 postnatal week 13 8
6 4
2
0 ” Ii ” ’ d’ II ” 0 1020304050607080
10 adult 8
6
4 2
‘0 1020304050607080 Orientation Selectivity Index
Figure 2. Distributions of orientation selectivity of neurons in primary visual cortex of ferrets of different ages. Histograms plot numbers of cells versus OS1 for each age group. The numbers of animals and cells for each group are as follows: week 4 (P22-P28), 38 cells, four animals; week 5, 55 cells, seven animals; week 6, 250 cells, seven animals; week 7. 67 cells. two animals: week 8. 61 cells, three animals; week 13. 24 cells, one animal; adult, 80 cells in two animals from this’study plus 74 cells in eight animals from a previous study (Waitzmann and Stryker, unpublished observations).
Many unoriented cells are recorded during the first 2 d of post- natal week 6, fewer are seen during the next 3 d, and by the last 2 d of week 6 the distribution of OSIs is similar to that seen in adult animals (Mann-Whitney U test, p = 0.34).
Cells in adult ferret primary visual cortex are, in general, less well tuned for stimulus orientation than are cells in adult cat area 17. As shown in Figure 5, ferrets have more cells that are nonspecific for stimulus orientation than do cats; 25% of adult ferret cortical cells have OSIs less than 25, compared to only 5% of cat cortical cells stimulated and analyzed identically.
In these experiments, we did not investigate in detail the receptive field organization of the nonoriented cells in ferret visual cortex.
Effects of activity blockade and visual deprivation In preliminary experiments in two ferrets, intracortical infusion of TTX (5 PM, 0.5 &hr) starting during postnatal week 4 and continuing through postnatal week 7 was found to silence neu- ronal action potentials in an area extending approximately 10 mm caudally from the cannula tip, with a lateral-medial extent of approximately 5 mm (data not shown). The cortical surface
within the silenced area was slightly lighter in color than the surrounding cortex, with good correspondence between the edg- es of the blanched region and the edges of the electrophysio- logically assessed activity blockade. In later experiments in four animals where the TTX infusion was stopped several days be- fore the recording session, the blanched area of cortex was still seen. In order to ensure that the cells recorded in these exper- iments had been previously silenced by the TTX treatment, all penetrations were made well within the blanched area.
TTX treatment begun during postnatal week 4 (when cortical cells are poorly selective for orientation) and continued through postnatal week 7 (when cortical cells would normally have an adult-like distribution of orientation tuning) appeared to pre- vent completely the maturation of orientation selectivity. The distribution of orientation selectivity seen in TTX-treated cor- tex was very similar to the distribution seen in normal 4-week- old animals (Fig. 6; Mann-Whitney Utest, p = 0.46). In contrast, orientation selectivity had developed normally in these animals’ opposite (untreated) cortical hemispheres and in cortex treated with 0.9% saline (Fig. 6).
Visual deprivation by binocular lid suture begun before the time of natural eye opening and continued through postnatal week 8 or longer had less severe effects on the maturation of orientation selectivity than did activity blockade. Approxi- mately 50% of cells in binocularly deprived animals were un- selective for stimulus orientation (OS1 < 25) compared to 75% untuned cells in normal 4-week-old animals and in TTX-treated animals and 25% in normal adults. The best-tuned cells in the binocularly deprived animals were, however, as well tuned as the best-tuned cells in normal adults. The distribution of ori- entation selectivity found in binocularly deprived animals is shown in Figure 6.
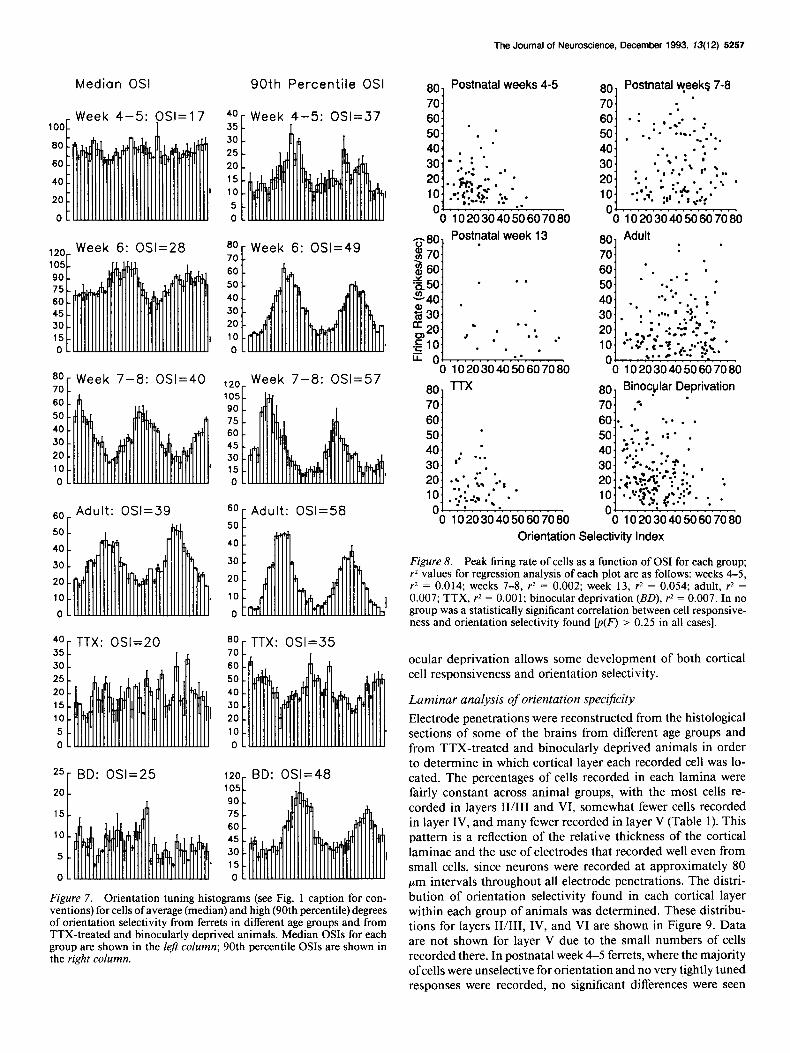
The results described above are not dependent on the partic- ular analysis of orientation tuning that we have used. The dif- ferences in orientation specificity between ages and treatment groups are evident from the tuning histograms themselves. This is illustrated in Figure 7, which presents two orientation tuning histograms from each group. One histogram represents average selectivity (median OSI) and one represents high selectivity (90th percentile OSI) for each group of animals. Both of the tuning histograms from the adult and from the postnatal week 7-8 animals show sharper orientation selectivity than do the cor- responding histograms from postnatal week 6 animals, which in turn are more tightly tuned than the histograms from post- natal weeks 4-5. Histograms from TTX-treated ferrets are sim- ilar to those from postnatal week 4-5 animals, and histograms from binocularly deprived animals are similar to those from postnatal week 6.
Since visual cortical cells are known to become poorly re- sponsive and to lose their stimulus specificity when the animal’s health is compromised or when physiological recording con- ditions are suboptimal (Blakemore and Van Sluyters, 1975), it was important to examine the responsiveness of cells in very young, TTX-treated, and binocularly deprived animals. If the lessened orientation selectivity of cells in these animals were due to lessened responsiveness (which could be caused either by unsuitable recording conditions or by possible nonspecific damage to cortical cells or their connections by the experimental treatments), then the least responsive neurons would be ex- pected to be the least well orientation tuned. This relationship was not found. Figure 8 shows each neuron’s maximum re- sponse to visual stimulation plotted against its OS1 for several age groups of ferrets and for the TTX-treated and binocularly
The Journal of Neuroscience, December 1993, 13(12) 5255
. . . . . . . . . . . . .._.___ Week 4 Figure 3. Data from Figure 2 replot- ted to show the cumulative percentage
-_-----_-_ Week 5 of cells at each degree of orientation selectivity. Statistical analysis (Mann- Whitney U test) confirms that these dis- -----
Week 6 tributions fall into three distinct groups.
---- Distributions at postnatal weeks 4-5 are
Week 13 different from that seen at week 6 (p < ---- O.OOl), and the week 6 distribution is
different from the adult (p i 0.009). The postnatal week 4 and 5 distribu- tions are not significantly different (p = 0.38), and the distributions for animals
0 10 20 30 40 50 60 70 60 postnatal week 7 or older are all statis-
Orientation Selectivity Index tically indistinguishable from the adult distribution (p > 0.25 in all cases).
deprived animals. In no group is there a significant correlation the distribution of firing rates for binocularly deprived animals between orientation selectivity and responsiveness (regression is similar to that seen in age-matched controls. Therefore, ac- analysis, p > 0.25 in all cases). In addition, the distribution of tivity blockade and visual deprivation do not noticeably impair firing rates for TTX-treated cortex is similar to that seen in the responsiveness of visual cortex. Instead, activity blockade normal animals at the age at which the treatment started, and appears to freeze visual cortex in an immature state, while bin-
100
90
80
70
60
50
40
30
20
10
0
Week 5 -_----_ Days 35-36 ----- Days 37-39 ---- Days 40-41
Figure 4. Orientation selectivity dis- tributions during postnatal week 6. Cu- mulative percentages ofcells at each OS1 are shown for P35-P36 (73 cells, two animals), P37-P39 (57 cells, three an- imals), and P40-P41 (84 cells, two an- imals), with distributions from post- natal week 5 and from adult animals (data from Fig. 2) shown for compari- son.
5256 Chapman and Stryker * Development of Orientation Selectivity in Ferrets
Figure 5. Distribution of orientation selectivity in normal adult cat com- pared to ferret. Cumulative percentages of cells at each orientation selectivity for adult cat (59 cells, one animal) are compared with those for adult ferret (data from Fig. 2).
Figure 6. Orientation selectivity of deprived ferrets compared to normal development: cumulative percentages of cells at each OS1 for cortical infusion and visual deprivation experiments. Data are shown for TTX-treated ani- mals (heavy solid line, 56 cells in four animals), control animals (light solid line, 73 cells recorded in contralateral, untreated cortex of three TTX-treated animals, plus 28 cells recorded in sa- line-treated cortex of one animal; these data are statistically indistinguishable from those seen in normal postnatal week 7-8 animals, Mann-Whitney U test, p = 0.25) and binocularly deprived animals (BD, midweight solid line, 184 cells in seven animals). Also shown are distributions of 0% for week 6 ani- mals (middle-dash line; data from Fig. 3), week 4-5 animals (short-dash line; data from Fig. 3), and week 7 through adult animals (long-dash line; data combined from the respective individ- ual distributions in Fig. 3). The distri- bution of orientation selectivity from TTX-treated animals is statistically in- distinguishable from the distribution from normal postnatal week 4 ferrets (Mann-Whitney U test, p = 0.46) but is significantly different from the dis- tribution from binocularly deprived animals (p < 0.005). Data from bin- ocularly deprived animals are also sig- nificantly different from data from nor- mal adults (p < 0.001).
Figure 7. Orientation tuning histograms (see Fig. 1 caption for con- ventions) for cells of average (median) and high (90th percentile) degrees of orientation selectivity from ferrets in different age groups and from TTX-treated and binocularly deprived animals. Median 0% for each group are shown in the left column; 90th percentile OSIs are shown in the right column.
Figure 8. Peak firing rate of cells as a function of OS1 for each group; r2 values for regression analysis of each plot are as follows: weeks 4-5, r* = 0.014; weeks 7-8, rz = 0.002; week 13, r2 = 0.054; adult, r* = 0.007; TTX, r2 = 0.001; binocular deprivation (BD), rz = 0.007. In no group was a statistically significant correlation between cell responsive- ness and orientation selectivity found [p(F) > 0.25 in all cases].
ocular deprivation allows some development of both cortical cell responsiveness and orientation selectivity.
Laminar analysis of orientation specijicity
Electrode penetrations were reconstructed from the histological sections of some of the brains from different age groups and from TTX-treated and binocularly deprived animals in order to determine in which cortical layer each recorded cell was lo- cated. The percentages of cells recorded in each lamina were fairly constant across animal groups, with the most cells re- corded in layers II/III and VI, somewhat fewer cells recorded in layer IV, and many fewer recorded in layer V (Table 1). This pattern is a reflection of the relative thickness of the cortical laminae and the use of electrodes that recorded well even from small cells, since neurons were recorded at approximately 80 pm intervals throughout all electrode penetrations. The distri- bution of orientation selectivity found in each cortical layer within each group of animals was determined. These distribu- tions for layers II/III, IV, and VI are shown in Figure 9. Data are not shown for layer V due to the small numbers of cells recorded there. In postnatal week 4-5 ferrets, where the majority of cells were unselective for orientation and no very tightly tuned responses were recorded, no significant differences were seen
5258 Chapman and Stryker l Development of Orientation Selectivity in Ferrets
Figure 9. Laminar analysis of orien- tation selectivity. Cumulative percent- ages of cells at different orientation se- lectivity in the different cortical laminae are shown for animals from different age and treatment groups. The solid lines represent cells in layers II/III, dotted lines represent layer IV, and dashed lines represent layer VI. Numbers of cells and average responsiveness for each group are shown in Table 1. BD, binocularly deprived.
loo- 90
;: 60,
2: 30
“““‘...“” 0 1020304050607080
Table 1. Laminar analysis of responsiveness
Condition Total N Layers Layer Layer Layer II/III IV V VI
Week 4-5 60 25% 25% 10% 40% 18.0 20.4 17.4 19.7
Week 6 94 31% 20% 16% 3 1% 29.8 24.3 28.4 27.7
Week 7-8 73 33% 23% 12% 32% 31.5 21.2 27.1 21.5
Adult 124 27% 25% 16% 32% 29.8 27.5 19.2 21.9
TTX 44 36% 19% 10% 36% 16.2 15.1 18.8 21.4
BD 154 30% 33% 12% 25% 26.1 25.9 23.9 27.1
For each group of animals, total number of cells whose laminar positions were reconstructed is shown. Percentages of these totals recorded in each cortical lamina are given (upper numbers). Mean responsiveness (lower numbers) is calculated as the average of the mean firing rate (in spikes/set) above spontaneous at the pre- ferred orientation of each cell. BD, binocularly deprived.
. .‘.“.“‘* 0 1020304050607080
0 1020304050607080 0 1020304050607080
10: OA-----
0 1020304050607080
Orientation Selectivity Index
among the distributions of orientation selectivity in the different laminae (Fig. 9, Week 4-5). During postnatal week 6, cells in the supragranular layers have become significantly more ori- entation selective than cells in layer IV or layer VI (Fig. 9, Week 6). By postnatal weeks 7-8 (Fig. 9, Week 7-8) and through adulthood (Fig. 9, Adult), the distribution of orientation selec- tivity found in layer VI matches that of the supragranular layers, while cells in layer IV remain relatively poorly tuned for ori- entation, with a distribution only slightly more orientation se- lective than that seen in postnatal week 4-5 animals. The dis- tribution of orientation selectivity for TTX-treated animals is similar to that in week 4-5 animals, with no significant laminar differences seen (Fig. 9, TTX). In binocularly deprived animals, orientation selectivity in layer IV appears to have developed normally, but both layers II/III and layer VI cells are less well tuned than in normal animals (Fig. 9, BD).
LGN recordings
Neurons in the LGN were studied in one adult ferret and in two ferrets during week 5. None of the LGN cells recorded showed
The Journal of Neuroscience, December 1993, 13(12) 5259
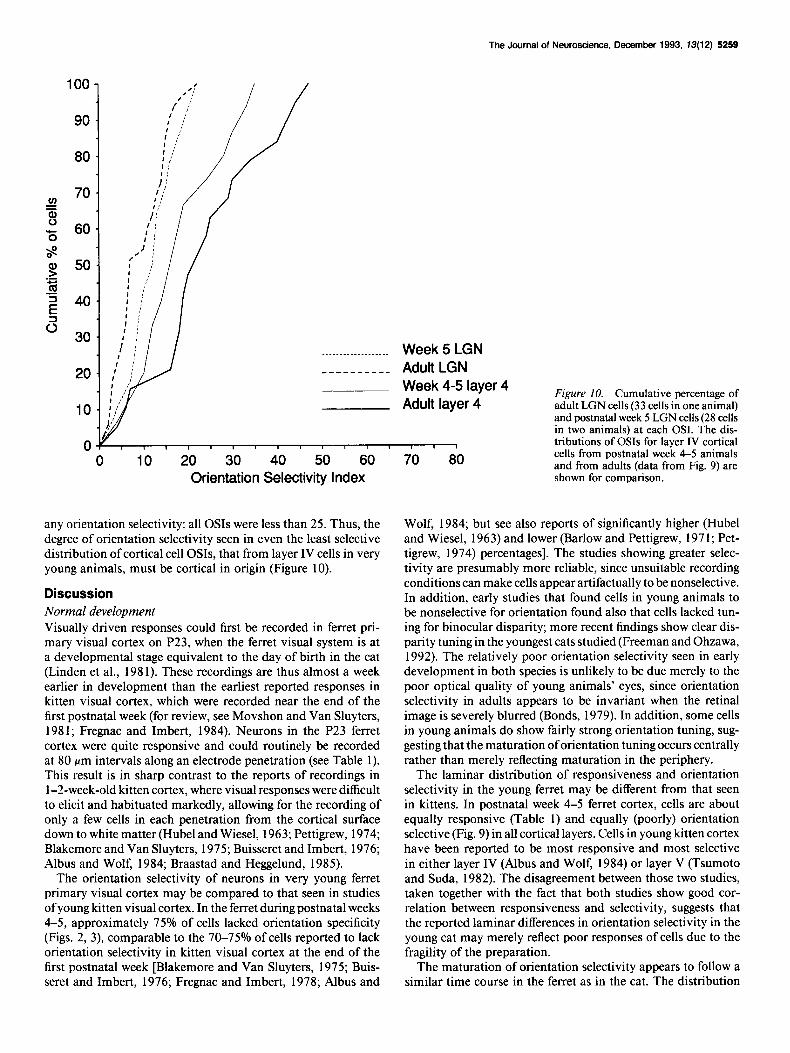
any orientation selectivity: all OSIs were less than 25. Thus, the degree of orientation selectivity seen in even the least selective distribution of cortical cell OSIs, that from layer IV cells in very young animals, must be cortical in origin (Figure 10).
Discussion Normal development Visually driven responses could first be recorded in ferret pri- mary visual cortex on P23, when the ferret visual system is at a developmental stage equivalent to the day of birth in the cat (Linden et al., 1981). These recordings are thus almost a week earlier in development than the earliest reported responses in kitten visual cortex, which were recorded near the end of the first postnatal week (for review, see Movshon and Van Sluyters, 198 1; Fregnac and Imbert, 1984). Neurons in the P23 ferret cortex were quite responsive and could routinely be recorded at 80 pm intervals along an electrode penetration (see Table 1). This result is in sharp contrast to the reports of recordings in I-2-week-old kitten cortex, where visual responses were difficult to elicit and habituated markedly, allowing for the recording of only a few cells in each penetration from the cortical surface down to white matter (Hubel and Wiesel, 1963; Pettigrew, 1974; Blakemore and Van Sluyters, 1975; Buisseret and Imbert, 1976; Albus and Wolf, 1984; Braastad and Heggelund, 1985).
The orientation selectivity of neurons in very young ferret primary visual cortex may be compared to that seen in studies of young kitten visual cortex. In the ferret during postnatal weeks 4-5, approximately 75% of cells lacked orientation specificity (Figs. 2, 3) comparable to the 70-75% of cells reported to lack orientation selectivity in kitten visual cortex at the end of the first postnatal week [Blakemore and Van Sluyters, 1975; Buis- seret and Imbert, 1976; Fregnac and Imbert, 1978; Albus and
Figure 10. Cumulative percentage of adult LGN cells (33 cells in one animal) and postnatal week 5 LGN cells (28 cells in two animals) at each OSI. The dis- tributions of OSIs for layer IV cortical cells from postnatal week 4-5 animals and from adults (data from Fig. 9) are shown for comparison.
Wolf, 1984; but see also reports of significantly higher (Hubel and Wiesel, 1963) and lower (Barlow and Pettigrew, 197 1; Pet- tigrew, 1974) percentages]. The studies showing greater selec- tivity are presumably more reliable, since unsuitable recording conditions can make cells appear artifactually to be nonselective. In addition, early studies that found cells in young animals to be nonselective for orientation found also that cells lacked tun- ing for binocular disparity; more recent findings show clear dis- parity tuning in the youngest cats studied (Freeman and Ohzawa, 1992). The relatively poor orientation selectivity seen in early development in both species is unlikely to be due merely to the poor optical quality of young animals’ eyes, since orientation selectivity in adults appears to be invariant when the retinal image is severely blurred (Bonds, 1979). In addition, some cells in young animals do show fairly strong orientation tuning, sug- gesting that the maturation of orientation tuning occurs centrally rather than merely reflecting maturation in the periphery.
The laminar distribution of responsiveness and orientation selectivity in the young ferret may be different from that seen in kittens. In postnatal week 4-5 ferret cortex, cells are about equally responsive (Table 1) and equally (poorly) orientation selective (Fig. 9) in all cortical layers. Cells in young kitten cortex have been reported to be most responsive and most selective in either layer IV (Albus and Wolf, 1984) or layer V (Tsumoto and Suda, 1982). The disagreement between those two studies, taken together with the fact that both studies show good cor- relation between responsiveness and selectivity, suggests that the reported laminar differences in orientation selectivity in the young cat may merely reflect poor responses of cells due to the fragility of the preparation.
The maturation of orientation selectivity appears to follow a similar time course in the ferret as in the cat. The distribution
5260 Chapman and Stryker - Development of Orientation Selectivity in Ferrets
of cortical cell orientation specificity has reached an adult-like level by postnatal week 7 in the ferret (Figs. 2, 3) and by post- natal week 4, the equivalent developmental stage, in the cat (Pettigrew, 1974; Blakemore and Van Sluyters, 1975). The adult ferret cortex, however, contains significantly more cells that are nonspecific for stimulus orientation than are found in the adult cat. Approximately 25% of cells in adult ferret cortex lack ori- entation specificity, compared to fewer than 10% in the adult cat (Bishop and Henry, 1972; see also Fig. 5).
In the ferret, the maturation of orientation specificity appears to occur in two temporally separated stages, with selectivity in supragranular layers reaching adult levels during postnatal week 6 while layer VI cells remain poorly orientation selective until postnatal week 7 (Fig. 7). Different results have been reported in the cat, with the maturation of orientation selectivity in su- pragranular layers lagging behind that in layers IV and VI (Albus and Wolf, 1984) or maturation of orientation selectivity in layers II/III and layer VI occurring after maturation in layer IV (Tsumoto and Suda, 1982). These results are difficult to inter- pret, however, since activity in the less orientation-selective layers was also reported to remain poor.
Neuronal activity
The maturation oforientation selectivity in ferret primary visual cortex depends on neuronal activity. Blocking activity in area 17 by infusing TTX into the cortex appears to freeze orientation selectivity in the immature state (Fig. 6).
We do not know to what to attribute the orientation selectivity of the lo-20% of cells classified as selective at P23, the earliest age at which we could elicit reliable visual responses. One pos- sibility is that the selectivity of these cells results merely from random, sparse inputs. If, for example, a cortical cell were to receive input from only two geniculate afferents with receptive fields separated in visual space, that cell would necessarily re- spond best to orientations that lay along the line connecting the receptive field centers of the two geniculate inputs. Such selec- tivity might have no relationship to the selectivity that develops later. In particular, this selectivity might not be organized in columns. It should be noted that while there is ample evidence for orientation columns in adult ferrets (Chapman et al., 199 l), we have no evidence to date on whether orientation columns are present in the youngest animals.
Alternatively, the orientation selectivity present at P23 and throughout postnatal weeks 4-5 may be the earliest expression of mechanisms that continue to operate, and may represent the initial stages of the development of orientation columns. If this is the case, we would expect the development of this early ori- entation selectivity to depend on activity, as we have shown the later development to do.
It is not clear from our results whether the initial development of orientation selectivity is activity dependent. Although some degree of orientation selectivity was clearly present in ferret cortex as early as we recorded reliably driven responses (Figs. 2, 3) it is possible that cortical cells would be responsive at an earlier age under other conditions of anesthesia, or in the awake, behaving animal. Spontaneous activity could also be involved in the establishment of the initial orientation selectivity seen in young animals. In the cat and the rat, patterned spontaneous activity is present in the retina prenatally (Maffei and Galli- Resta, 1990; Meister et al., 1991) and models have been pro- posed showing that cortical orientation selectivity could develop using the information in such spontaneous retinal activity (Mil-
ler, 1992; Miyashita and Tanaka, 1992). The hypothesis that the original establishment of orientation selectivity in ferret visual cortex depends on neuronal activity (whether spontane- ous or visually evoked) could in principle be tested by infusing TTX into visual cortex in neonatal ferrets. However, there are technical difficulties involved in attaching a drug delivery sys- tem to the small, rapidly growing, and completely noncalcified skull of a very young ferret, as well as problems in ensuring the viability of very immature animals in the presence of such an invasive procedure. The effects of cortical activity blockade on the maturation of cortical cell orientation selectivity in the cat are not known. Experiments where kittens received binocular intraocular injections of TTX beginning at 2 weeks of age, when cat cortical cells show some orientation tuning but are not yet as selective as those in the adult, show that retinal activity blockade does impede the full maturation of orientation selec- tivity, but such studies do not address the issue of earlier de- velopment (Stryker and Harris, 1986).
Visual experience
The dependence of orientation selectivity development on vi- sual experience has been widely studied in the cat, with some- what conflicting results. A few weeks of visual deprivation has been observed to freeze cat cortical cell orientation selectivity in an immature state (Pettigrew, 1974; Bonds, 1979) but has also been reported to have no effect on the development of orientation selectivity (Sherk and Stryker, 1976; Braastad and Heggelund, 1985). Longer-term deprivation appears to lead to a progressive degradation of orientation specificity in kitten vi- sual cortex (Blakemore and Van Sluyters, 1975; Buisseret and Imbert, 1976; Leventhal and Hirsch, 1977; Stryker et al., 1978). Visual deprivation in the cat does cause cortical cell responsivity to remain poor, with cells in deprived animals as poorly re- sponsive as cells in very young kittens (Pettigrew, 1974; Blake- more and Van Sluyters, 1975; Sherk and Stryker, 1976; Braastad and Heggelund, 1985). Thus, the different results reported for the effects of visual deprivation may again be explainable by differences in the responsiveness of the cortical neurons in an- imals studied in different laboratories. Visual deprivation by binocular lid suture for periods of several weeks does not appear to affect cortical cell responsiveness in the ferret (Table 1). This may be because in the ferret, unlike in the cat, even very young animals have nicely responsive cortical cells. Binocular depri- vation in the ferret does affect the development of orientation selectivity, dramatically decreasing but not abolishing the mat- uration of selective responses in layers II/III and VI, while al- lowing normal maturation of selectivity in layer IV (Fig. 9).
Hypotheses on development of circuitry The laminar specificity of the binocular deprivation effect could be explained by the different connectivities of the cortical layers. Assuming that cortical circuitry in the ferret is similar to that found in the cat (described by Gilbert and Wiesel, 198 l), layer IV cells get their primary input directly from LGN cells, supra- granular cells receive input from layer IV but also have exten- sive, orientation-specific intralaminar excitatory connections (Gilbert and Wiesel, 1989) and layer VI cells receive direct LGN input as well as inputs from supragranular layers via layer V. This pattern of cortical connectivity could account for the distributions of orientation selectivity seen in our experiments as described below.
The poor orientation selectivity of cells in layer IV of ferrets
The Journal of Neuroscience, December 1993, 13(12) 5261
of all ages might be due to layer IV cells acquiring their ori- entation selectivity only from LGN afferents whose receptive fields cover an elongated region of visual space (Hubel and Wiesel, 1962; Chapman et al., 1991), rather than from any intracortical circuitry. Models of cortical cells constructed by adding together inputs from such arrays of LGN afferents do produce fairly poorly oriented responses (Worgotter and Koch, 199 1). The poor orientation selectivity seen in normal postnatal week 4-5 ferrets might therefore indicate that at these early ages all cortical cell orientation selectivity merely reflects the ar- rangement of afferent input, and no orientation-specific intra- cortical connections are yet present. Note that in the cat at the same developmental stage the patchy cortical connections in the supragranular layers have not yet formed (Luhmann et al., 1986; Callaway and Katz, 1990).
During postnatal week 6, orientation selectivity in layers II/ III of ferret visual cortex matures, possibly reflecting the mat- uration of the patchy connections in the supragranular layers. When cortical activity is blocked by TTX infusion, the matu- ration of orientation selectivity is prevented, possibly by pre- venting the formation of specific intralaminar connections in layers II/III. During postnatal week 7, orientation selectivity matures in ferret cortical layer VI, possibly reflecting maturation of connections between supra- and infragranular layers. Without visual experience, cells in layers II/III and layer VI show some increase in orientation selectivity, but do not develop to normal adult levels of specificity. This may reflect a less than normal refinement of orientation-specific intralaminar connections.
These hypotheses regarding intracortical circuitry suggest a number of further experiments. To see whether orientation se- lectivity in young ferret visual cortex is a reflection of afferent input, the receptive fields of geniculocortical afferents to a single cortical column could be recorded in postnatal week 4-5 ferrets. These afferents would be expected to cover an elongated region of visual space, as they do in the adult (Chapman et al., 199 1). To test whether the maturation oforientation selectivity in ferret supragranular layers might be due to the development of patchy intralaminar connections between columns of like orientation preference, the normal time course of development of these connections in the ferret could be studied using anatomical trac- ers. The patchy connections could also be studied in TTX- treated and binocularly deprived animals. If the hypothesis out- lined above is correct, patchy connections should not develop in animals where cortical activity is blocked by TTX infusion, and should develop in binocularly deprived ferrets but not be- come as refined as normal, a result that has been reported in binocularly deprived kittens (Callaway and Katz, 199 1). Finally, to test whether the projections from superficial to deep layers is responsible for the developing orientation tuning in layer VI, one might compare this projection in binocularly deprived fer- rets with that in normal animals either by intracellular fills of supragranular layer cells or by DiI injections into deep layers.
References Albus K, Wolf K (1984) Early postnatal development of neuronal
function in the kitten’s visual cortex: a laminar analysis. J Physiol (Lond) 348:153-185.
Barlow HB, Pettigrew JD (197 1) Lack of specificity of neurones in the visual cortex of young kittens. J Physiol (Lond) 218:98P-1OOP.
Bishop PO, Henry GH (1972) Striate neurones: receptive field con- cepts. Invest Ophthalmol 11:346-354.
Blakemore C, Van Sluyters RC (1975) Innate and environmental fac-
tors in the development of the kitten’s visual cortex. J Physiol (Lond) 248:663-7 16.
Bonds AB (1979) Development of orientation tuning in the visual cortex of kittens. In: Developmental neurobiology of vision, Vol 27 (Freeman RD, ed), pp 3 1-41. New York: Plenum.
Braastad BO, Heggelund P (1985) Development of spatial receptive- field organization and orientation selectivity in kitten striate cortex. J Neurophysiol 53: 1158-l 178.
Buisseret P, Imbert M (1976) Visual cortical cells: their developmental properties in normal and dark-reared kittens. J Physiol (Lond) 255: 51 l-525.
Callaway EM, Katz LC (1990) Emergence and refinement of clustered horizontal connections in cat striate cortex. J Neurosci 10: 1134-l 153.
Callaway EM, Katz LC (199 1) Effects of binocular deprivation on the development of clustered horizontal connections in cat striate cortex. Proc Nat1 Acad Sci USA 88:745-749.
Chapman B, Zahs KR, Stryker MP (199 1) Relation of cortical cell orientation selectivity to alignment of receptive fields of the genicu- locortical afferents that arborize within a single orientation column in ferret visual cortex. J Neurosci 11: 1347-l 358.
Freeman RD, Ohzawa I (1992) Development of binocular vision in the kitten’s striate cortex. J Neurosci 12:4721-4736.
Fregnac Y, Imbert M (1978) Early development of visual cortical cells in normal and dark-reared kittens: the relationship between orien- tation selectivity and ocular dominance. J Physiol (I&d) 278:27-44.
Fregnac Y. Imbert M (1984) Develooment of neuronal selectivitv in p>mary’visual cortex of cat. Physiol Rev 64:325434.
Gilbert CD, Wiesel TN (198 1) Laminar specialization and intracort- ical connections in cat primary visual cortex. In: The organization of the cerebral cortex (Schmidt FO, Worden FG, Aldelman G, Dennis SG, eds), pp 163-19 1. Cambridge, MA: MIT Press.
Gilbert CD. Wiesel TN (1989) Columnar soecilicitv of intrinsic con- nections in cat visual cortex.‘J Neurosci 91-2432-2442.
Hubel DH (1957) Tungsten microelectrode for recording from single units. Science 168:869-87 1.
Hubel DH, Wiesel TN (1962) Receptive fields, binocular interaction and functional architecture in the cat’s visual cortex. J Physiol (Lond) 160:106-154.
Hubel DH, Wiesel TN (1963) Receptive fields of cells in striate cortex of very young, visually inexperienced kittens. J Neurophysiol26:994- 1002.
Law MI, Zahs KR, Stryker MP (1988) Organization of primary visual cortex (area 17) in the ferret. J Comp Neurol 278: 157-l 80.
Leventhal AC, Hirsch HVB (1977) Effects of early experience upon orientation sensitivity and binocularity of neurons in visual cortex of cats. Proc Nat1 Acad Sci USA 74: 1272-l 276.
Linden DC, Guillery RW, Cucciaro J (198 1) The dorsal lateral genic- ulate nucleus of the normal ferret and its postnatal development. J Comp Neurol 203: 189-2 11.
Luhmann HJ, Martinez Millan L, Singer W (1986) Development of horizontal intrinsic connections in cat striate cortex. Exp Brain Res 63:443448.
Maffei L, Galli-Resta L (1990) Correlation in the discharges of neigh- boring rat retina1 ganglion cells during prenatal life. Proc Nat1 Acad Sci USA 87:2861-2864.
Meister M, Wong RO, Baylor DA, Shatz CJ (199 1) Synchronous bursts of action potentials in ganglion cells in the developing mammalian retina. Science 252:939-943.
Miller KD (1992) Development of orientation columns via compe- tition between on- and off-center inputs. Neuroreport 3:73-76.
Miyashita M, Tanaka S (1992) A mathematical model for the self- organization of orientation columns in visual cortex. Neuroreport 3~69-72.
Movshon JA, Van Sluyters RC (198 1) Visual neural development. Annu Rev Psycho1 32~477-522.
Pettigrew JD (1974) The effect of visual experience on the development of stimulus specificity by kitten cortical neurones. J Physiol (Lond) 237~49-74.
Sherk H, Stryker MP (1976) Quantitative study of cortical orientation selectivity in visually inexperienced kittens. J Neurophysiol 39:63- 70.
Stryker MP (1977) The role of early experience in the development and maintenance of orientation selectivity in the cat’s visual cortex. Neurosci Res Bull 15:45a63.
Stryker MP, Harris WA (1986) Binocular impulse blockade prevents
5262 Chapman and Stryker * Development of Orientation Selectivity in Ferrets
formation of ocular dominance columns in the cat’s visual cortex. J Neurosci 6:2117-2133.
Stryker MP, Sherk H, Leventhal AC, Hirsch HVB (1978) Physiolog- ical consequences for the cat’s visual cortex of effectively restricting early visual experience with oriented contours. J Neurophysiol 41: 896-909.
Tsumoto T, Suda K (1982) Laminar differences in development of afferent innervation to striate cortex neurones in kittens. Exp Brain Res 45433-446.
Wiesel TN, Hubel DH (1974) Ordered arrangement of orientation
Worgotter F, Eysel UT (1987) Quantitative determination of orien- tational and directional components in the response of visual cortical cells to moving stimuli. Biol Cvbem 57:349-355.
Worgotter F, Koch C (199 1) A hetailed model of the primary visual pathway in the cat: comparison of afferent excitatory and intracortical inhibitory connection schemes for orientation selectivity. J Neurosci 11:1959-1979.