DEVELOPMENT OF PBI BASED MEMBRANES FOR H 2 /CO 2 SEPARATION A THESIS SUBMITTED TO THE GRADUATE SCHOOL OF NATURAL AND APPLIED SCIENCES OF MIDDLE EAST TECHNICAL UNIVERSITY BY MERVE BAŞDEMİR IN PARTIAL FULFILLMENT OF THE REQUIREMENTS FOR THE DEGREE OF MASTER OF SCIENCE IN CHEMICAL ENGINEERING JANUARY 2013
Transcript
DEVELOPMENT OF PBI BASED MEMBRANES FOR H2/CO2 SEPARATION
A THESIS SUBMITTED TO THE GRADUATE SCHOOL OF NATURAL AND APPLIED SCIENCES
OF MIDDLE EAST TECHNICAL UNIVERSITY
BY MERVE BAŞDEMİR
IN PARTIAL FULFILLMENT OF THE REQUIREMENTS FOR
THE DEGREE OF MASTER OF SCIENCE IN
CHEMICAL ENGINEERING
JANUARY 2013
Approval of the thesis:
DEVELOPMENT OF PBI BASED MEMBRANES FOR H2/CO2 SEPARATION
submitted by MERVE BAŞDEMİR in partial fulfillment of the requirements for the degree of Master of Science in Chemical Engineering Department, Middle East Technical University by,
Prof. Dr. Canan Özgen _____________________ Dean, Graduate School of Natural and Applied Sciences Prof. Dr. Deniz Üner _____________________ Head of Department, Chemical Engineering Prof. Dr. Levent Yılmaz _____________________ Supervisor, Chemical Engineering Dept., METU Assoc. Prof. Dr. Halil Kalıpçılar _____________________ Co-supervisor, Chemical Engineering Dept., METU
Examining Committee Members: Assist. Prof. Dr. Zeynep Çulfaz Emecen _____________________ Chemical Engineering Dept., METU Prof. Dr. Levent Yılmaz _____________________ Chemical Engineering Dept., METU Assoc. Prof. Dr. Halil Kalıpçılar _____________________ Chemical Engineering Dept., METU Prof Dr. Nihal Aydoğan _____________________ Chemical Engineering Dept., H.Ü. Assist. Prof. Dr. Çerağ Dilek _____________________ Chemical Engineering Dept., METU Date: 28.01.2013
iv
I hereby declare that all information in this document has been obtained and presented in accordance with academic rules and ethical conduct. I also declare that, as required by these rules and conduct, I have fully cited and referenced all material and results that are not original to this work.
Name, Last name: Merve Başdemir
Signature:
v
ABSTRACT
DEVELOPMENT OF PBI BASED MEMBRANES FOR H2/CO2 SEPARATION
Başdemir, Merve M.Sc., Department of Chemical Engineering
Supervisor : Prof. Dr. Levent YILMAZ Co-supervisor : Assoc. Prof. Dr. Halil KALIPÇILAR
January 2013, 75 pages
Recent developments have confirmed that in the future hydrogen demand in industrial applications will arise because of the growing requirements for H2 in chemical manufacturing, petroleum refining, and the newly emerging clean energy concepts. Hydrogen is mainly produced from the steam reforming of natural gas and water gas shift reactions. The major products of these processes are hydrogen and carbon dioxide. The selective removal of CO2 from the product gas is important because it poisons catalysts in the reactor and it is highly corrosive. Membrane separation processes for hydrogen purification may be employed as alternative for conventional methods such as adsorption, cryogenic distillation. Mixed matrix membranes (MMMs) are composed of an insoluble phase dispersed homogeneously in a continuous polymer matrix. They have potential in gas separation applications by combining the advantageous properties of both phases. The objective of this study is to produce neat polybenzimidazole (PBI) membranes and PBI based mixed matrix membranes for separation of H2/CO2. Furthermore, to test the gas permeation performance of the prepared membranes at permeation temperatures of 35
oC to 90
oC.
Commercial PBI supplied from both Celanese and FumaTech were used as polymer matrix. PBI was selected based on its thermal, chemical stabilities and mechanical properties and its performance as a fuel-cell membrane produced by PBI. Micro-sized Zeolite 3A and nano-sized SAPO-34 are zeolites with 0.30 nm and 0.38 nm pore size respectively have attracted considerable interest and employed as fillers in this study. Commercial Zeolite 3A and synthesized SAPO-34 by our group was used throughout the study. Membranes were prepared using N,N-dimethylacetamide as the solvent. Prepared membranes were characterized by scanning electron microscopy (SEM), differential scanning calorimetry (DSC) and thermal gravimetric analysis (TGA). The effect of annealing procedure and operating temperature on gas separation performance of resultant neat PBI, PBI/Zeolite 3A and PBI/SAPO-34 membranes were investigated by gas permeation tests. Hydrogen and carbon dioxide gases were used for single gas permeation measurements. Two different annealing strategies were utilized namely in-line annealing and in-oven annealing. In-oven annealing was performed in an oven in nitrogen atmosphere at 120
oC, 0.7 atm while in-line annealing was performed in the gas
permeation set-up by feeding helium as permeating gas at 90oC and 3 bar.
Neat PBI and PBI/ Zeolite 3A membranes were in-oven annealed. The in-oven annealed membranes showed better selectivities with lower permeabilities, but the performance results of these membranes had low repeatability. On the other hand, in-line annealed membranes showed much higher permeabilities and lower selectivities with stable performance. By
vi
changing the annealing method hydrogen permeability increased from 5.16 Barrer to almost 7.77 barrer for neat membranes and for PBI/Zeolite 3A mixed matrix membranes increased from 5.55 to to 7.69 Barrer at 35
oC. The selectivities were decreased from 6.21 to 2.31 for neat
membranes and for PBI/Zeolite 3A from 5.55 to 2.63.
Effect of increasing operating temperature was investigated by using in-line annealed membranes. Increasing temperature from 35
oC to 90
o improved the performance of the both
types of membranes and repeatable results were obtained. Besides neat PBI and PBI/Zeolite 3A, PBI/SAPO-34 membranes were prepared only via in-line annealing. The addition of nano-sized filer to the membranes provided homogeneous distribution in polymer matrix for PBI/SAPO-34 membranes. For this type of membrane hydrogen permeability increased from 8.01 to 26.73 Barrer and with no change in H2/CO2 selectivities via rising temperature. Consequently, it is better to study hydrogen and carbon dioxide separation at high temperature.
For all types of membranes hydrogen showed higher activation energies. In between all membranes magnitude of activation energies were the highest for PBI/SAPO-34 membrane which is an indication of good interaction between polymer and zeolite interface. In-line annealed membranes gave the best gas permeation results by providing repeatability of measurements. Among all studied membranes in-line annealed PBI/SAPO-34 membrane exhibited the best gas permeation results.
Keywords: Mixed Matrix Membranes, Gas Separation, PBI
Başdemir, Merve Yüksek Lisans, Kimya Mühendisliği Bölümü
Tez Yöneticisi: Prof. Dr. Levent YILMAZ Ortak Tez Yöneticisi: Doç. Dr. Halil KALIPÇILAR
Ocak 2013, 75 sayfa
En son gelişmeler kimyasal üretim, petrolün damıtılması ve yeni geliştirilen temiz enerji konseptlerinde artan ihtiyaçtan dolayı gelecekte sanayi uygulamalarında hidrojene olan talebin artacağını göstermektedir. Hidrojen başlıca buhar dönüşüm prosesi ve su gaz dönüşüm reaksiyonlarından üretilir. Bu proseslerin ana ürünleri hidrojen ve karbondioksittir. Karbondioksitin oldukça korozif oluşu ve reaktörde bulunan katalizörleri zehirlediği için seçici olarak uzaklaştırılması önemlidir. Hidrojen saflaşlaştırma işlemi için membranlar; adsorpsiyon, kriyojenik distilasyon gibi geleneksel metotlar yerine kullanılabilinir. Karışık matrisli membranlar, devamlı bir polimer matrisi içerisine çözünmeyen bir fazın homojen olarak dağıtılması ile oluşur. Bu membranlar her iki fazın avantajlı özelliklerini birleştirerek gaz ayırımında kullanılabilme potansiyeline sahiptirler. Bu çalışmanın amacı H2/CO2 ayırımı için polibenzimidazol (PBI) ve PBI bazlı karışık matrisli membranları üretmek ve aynı zamanda üretilen bu membranların gaz ayırım performanslarının 35
oC ve 90
oC aralığında test etmektir.
Ticari olarak hem Celanese hem de FumaTech firmalarından temin edilen PBI, polimer matrisi olarak kullanılmıştır. PBI sahip olduğu termal, kimyasal stabilite ve mekanik özellikleri ve yakıt-pili membranı üretiminde kullanıldığında membran olarak gösterdiği performansı baz alınarak seçilmiştir. Sırasıyla 0.30 nm ve 0.38 nm gözenek çapına sahip mikro boyutlu Zeolit 3A ve nano boyutlu SAPO-34 önemli ölçüde dikkat çekmiştir ve bu çalışmada dolgu malzemesi olarak kullanılmıştır. Ticari Zeolite 3A ve grubumuz tarafından sentezlenmiş olan SAPO-34 çalışma boyunca kullanılmıştır. Hazırlanan membranlar taramalı elektron mikroskobu (SEM), farklı taramalı kalorimetre (DSC) ve termal gravimetrik analiz (TGA) ile karakterize edilmiştir. Hazırlanan PBI, PBI/Zeolit 3A ve PBI/SAPO-34 membranları ile gaz geçirgenlik testleri yapılarak tavlama prosedürünün ve çalışma sıcaklığının gaz geçirgenliğine etkisi araştırılmıştır. Hidrojen ve karbon dioksit tek gaz geçirgenlik ölçümleri için kullanılmıştır. Doğrudan tavlama ve fırında tavlama olarak tanımlanan iki farklı tavlama stratejisi uygulanmıştır. Fırında tavlama işlemi fırın içerisinde 120
oC, 0,7 atmosferde, doğrudan tavlama işlemi ise gaz geçirgenliğinin test edildiği düzenek
içerisinde 90oC ve 3 bar basınçta helyum gazının beslenmesi ile gerçekleştirilmiştir.
PBI ve PBI/Zeolit 3A membranları fırında tavlanmıştır. Fırında tavlanan membranlar daha iyi seçicilik fakat daha düşük geçirgenlik göstermişlerdir. Diğer taraftan doğrudan tavlanan membranlar çok daha yüksek geçirgenlik ve düşük seçicilik ile birlikte stabil performans göstermişlerdir. Tavlama metodunun değiştirilmesi ile 35
oC’de PBI membranlar için hidrojen
geçrigenliği 5.16 Barrer’den 7.77 Barrer’e, PBI/Zeolit 3A membranlar için ise 5.55 Barrer’den 7.69
viii
Barrer yükselmiştir. Seçicilikler ise PBI membranlar için 6.21’den 2.31’e, PBI/Zeolit 3A membranlar için ise 5.55’ten 2.63’e düşmüştür. İşletme sıcaklığının arttırılmasının etkisi doğrudan tavlanmış membranlar kullanılarak incelenmiştir. Sıcaklığın 35
oC’den 90
oC’ye arttırdığımızda her iki tip membranın da performansı
iyileşmiştir. PBI ve PBI/Zeolit 3A membranları yanında PBI/SAPO-34 membranı sadece doğrudan tavlama yöntemi kullanılarak hazırlanmıştır. Nano boyutlu dolgu maddesinin eklenmesi PBI/SAPO-34 membranı için polimer matrisi içerisinde homojen dağılımın olmasını sağlamıştır. Bu membran tipi için hidrojen geçirgenliği artan sıcaklıkla birlikte 8.01 Barrer’den 26.73 Barrer’e çıkmıştır. H2/CO2 seçicilik değeri değişiklik göstermemiştir. Sonuç olarak, hidrojen ve karbondioksit ayrımında yüksek sıcaklıklarda çalışmak daha uygun olacaktır. Bütün membran tipleri için hidrojen en yüksek aktivasyon enerjisi göstermiştir. Tüm membranlar arasında da her iki gaz için en yüksek aktivasyon enerjileri PBI/SAPO-34 membranı için elde edilmiştir, bu da polimer-zeolit ara yüzeyinin iyi etkileşmiş olduğunun bir göstergesidir. Doğrudan tavlanan membranların sonuçların tekrar edilebilirliğini sağlayarak iyi gaz geçirgenlik sonuçlarını vermişlerdir. Çalışma boyunca kullanılan membranlar arasında en iyi gaz geçirgenlik sonuçlarını PBI/SAPO-34 membranları ile elde edilmiştir. Anahtar kelimeler: Karışık Matrisli Membran, Gaz Ayırımı, PBI
DEDICATION
ix
To My Dearest Family,
x
ACKNOWLEDGEMENTS
I wish to express my appreciations to all the people who helped me throughout this study starting from my supervisor Prof. Dr. Levent Yılmaz. I would like to thank him for his endless support, patience and academic guidance in the past 3.5 years. I would also like to thank my co-supervisor Assoc. Prof. Dr. Halil Kalıpçılar for helping me to solve the problem encountered during my study by his academic guidance. Furthermore, I want to thank to Dr. Berna Topuz for her help, suggestions and friendship. I wish to thank my collegues Eda Oral, Emre Büküşoğlu, Nilay Keser, Gökhan Sarıalp, Nihan Uzunoğlu and Aylin Önder for helping me through my laboratory studies, for their valuable suggestions to my specific problems and their enjoyable friendship. I also wish to express my special gratitudes to my friends Sena Yüzbaşı, Berk Baltacı, Gamzenur Özsin and Emre Yılmaz for being there for me throughout my master study. It is my duty to thank my friend Mustafa Yasin Aslan for his valuable friendship for the past eight years. I owe thanks to all my colleagues in AKSA Acrylic Chemical Co. I thank to Fatma Gül Güler for her friendship. I would like to express my very special thanks to my colleague Erhan Mendi for always being a big brother to me and for his endless support through my hard times. His guidance not only on work but also for life helped me to create a new point of view. Last but not least I wish to thank and express my indebtedness to my dearest family for always being around me and for their endless support and encouragement regardless of my decisions.
ÖZ .................................................................................................................................................... vii
ACKNOWLEDGEMENT ....................................................................................................................... x
TABLE OF CONTENTS ........................................................................................................................ xi
LIST OF TABLES .............................................................................................................................. xiii
LIST OF FIGURES ............................................................................................................................. xiv
LIST OF SYMBOLS AND ABBREVITIONS .......................................................................................... xvi
4.2 Effect of Preparation Methodology and Annealing on Membranes Performances ........ 32 4.3 Effect of Operating Temperature on Membranes Performance ..................................... 41
Table 4.7: The hydrogen permeabilities and ideal selectivities of the PBI membranes studied in literature ....................................................................................................................................... 40
Table 4.8: The average permeabilities and ideal selectivities of in-oven and in-line the neat PBI and mixed matrix membranes at 35
Table 4.11: Effect of operation temperature on permeabilities of in-oven annealed PBI/Zeolite 3A membranes ................................................................................................................................... 46 Table 4.12: Activation energies of membranes (kJ/mole) ............................................................. 47
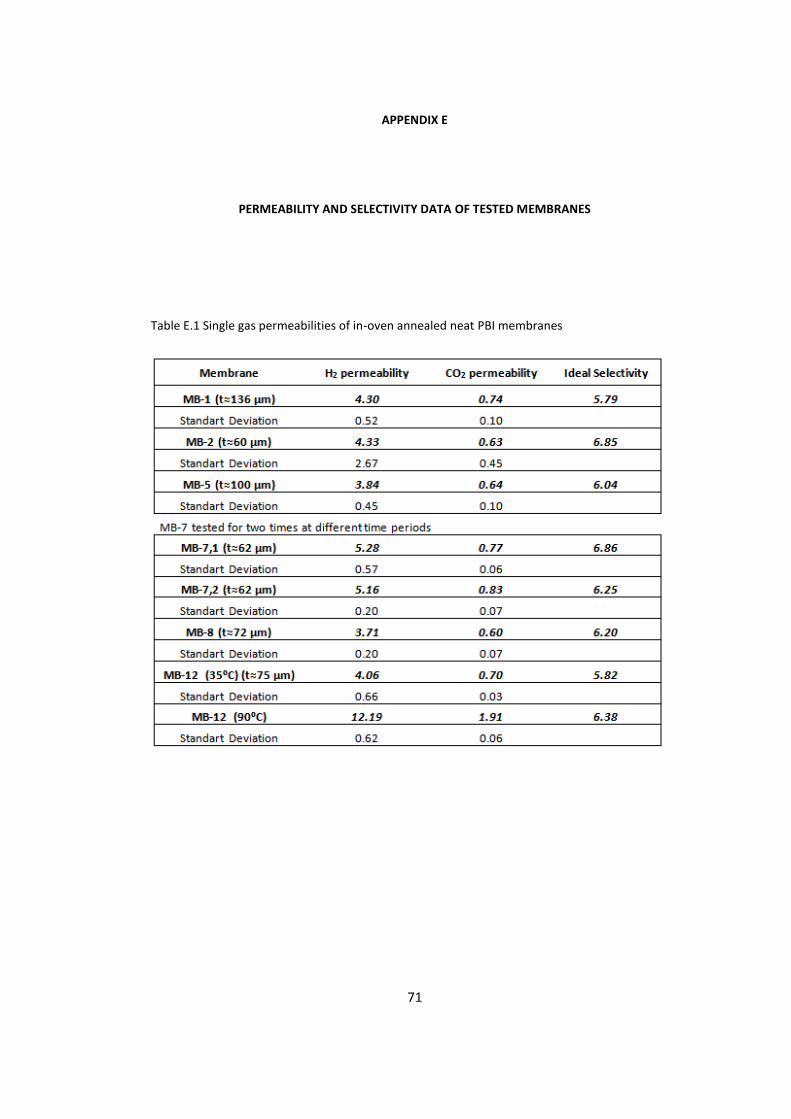
Table E.1 Single gas permeabilities of in-oven annealed neat PBI membranes ............................. 71
Table E.2 Single gas permeabilities of in-line annealed neat PBI membranes .............................. 72
Table E.3 Single gas permeabilities of mixed matrix membranes .................................................. 73
xiv
LIST OF FIGURES
FIGURES
Figure 2.1: Gas transport through dense membrane ....................................................................... 3
Figure 4.10: Effect of operation temperature on permeabilities of in-line annealed neat PBI membranes ..................................................................................................................................... 43
Figure 4.11: Effect of temperature on the ideal selectivity H2/CO2 of in-line annealed neat PBI membranes ..................................................................................................................................... 43
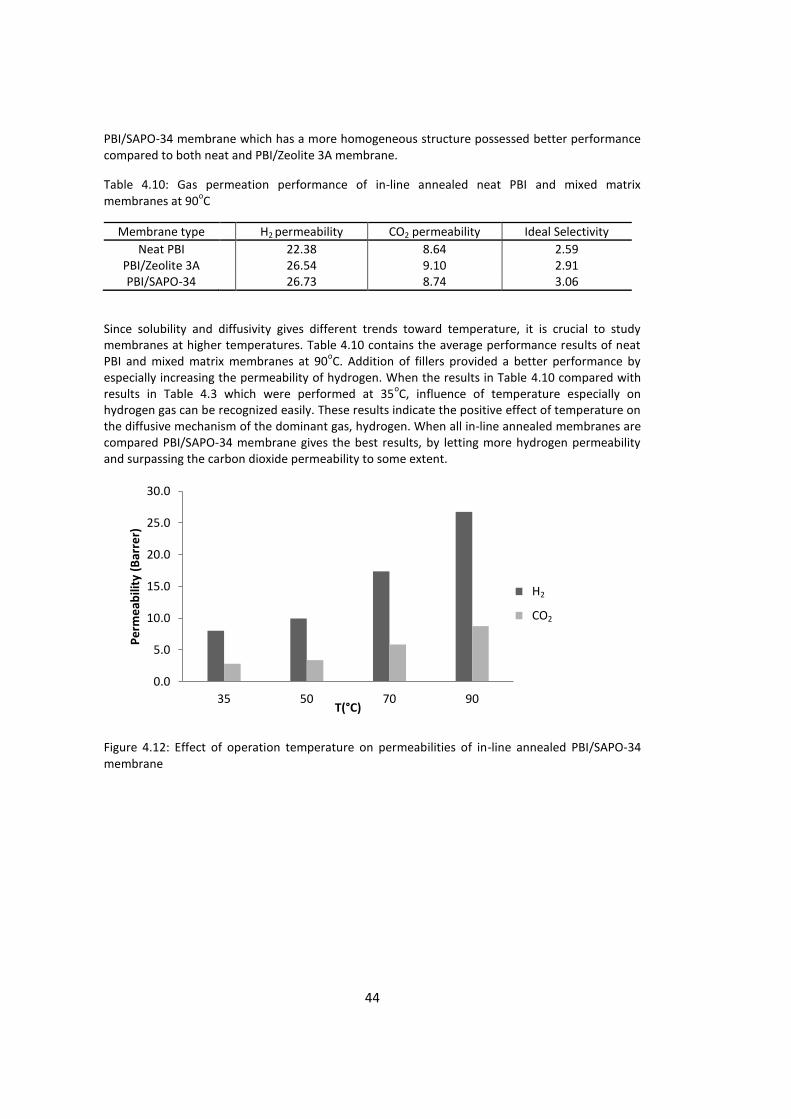
Figure 4.12: Effect of operation temperature on permeabilities of in-line annealed PBI/SAPO-34 membrane ...................................................................................................................................... 44
Figure 4.13: Effect of operation temperature on ideal selectivity of in-line annealed PBI/SAPO-34 membrane ...................................................................................................................................... 45
Figure 4.14: Effect of temperature on the permeabilities of H2/CO2 in-line annealed PBI/Zeolite3A membrane ...................................................................................................................................... 45
xv
Figure 4.15:Effect of temperature on the ideal selectivity of H2/CO2 in-line annealed PBI/Zeolite 3A membrane ................................................................................................................................. 45
Figure 4.16: Activation energy curves for in line annealed neat PBI membarane ........................ 46
Figure 4.17: Activation energy curves for in line annealed (a) PBI /SAPO-34, (b) PBI/SAPO-34 membranes .................................................................................................................................... 47
Figure A.1: Particle size distribution of SAPO-34 particle .............................................................. 59
Figure B.1: DSC diagram of Fumian AP .......................................................................................... 61
Figure C.1: (a), (b), SEM images of 25% w/w SAPO-34 loaded mixed matrix membranes ........... 63
Figure F.1: DMAc boiling point vs. pressure diagram ..................................................................... 75
xvi
LIST OF SYMBOLS AND ABBREVATIONS
A : Effective membrane area (cm2)
D: Diffusivity (10-8
cm2/s)
Ea : Activation energy of permeation (kJ/mol)
Ed: Activation energy of diffusion (kJ/mol)
Hs: Heat of sorption (kJ/mol)
J : Flux (cm3/cm
2.s)
: Thickness of the membranes (cm)
P : Permeability (Barrer)
R : Ideal gas constant
T : Temperature (°C)
Tg : Glass transition temperature (°C)
S: Solubility (cm3 (STP)/cm
3.atm)
Greek Letters
α : Selectivity
Δp :Transmembrane pressure difference (cmHg)
Abbreviations
DMAc: N,N-dimethylacetamide
HMA : 2-hydroxy 5 methyl aniline
PDMS : Poly (dimethylsiloxane)
PES : Polyethersulfone
PBI : Polybenzimidazole
PBI-1 : PBI supplied from Celanese
PBI-2 : PBI supplied from FumaTeach
pNA : p-Nitroaniline
PTMSP : Poly (1-trimethylsily-1-propyne)
ZIF-8 : Zeolitic imidazolate framework-8
1
CHAPTER 1
INTRODUCTION
Today, in modern era most of the worldwide energy demand is provided by fossil fuels. Main challenge of using fossil fuels is its end products, mainly carbon dioxide, emission and their contribution to the greenhouse effect. Therefore developing new, sustainable and clean technologies became a major concern [1-3, 15-17]. Among several energy alternatives energy carrier hydrogen, which is a ‘green’ fuel, has gained a major interest [4]. Hydrogen, one of the essential materials in chemical industrial processes [18], can be generated from primary energy sources, natural gas (48%), coal (18%), oil (30%) [5], besides renewable energy sources, biomass, wind and solar can be used to produce [6].
Most commercially significant process which needs CO2 removal is large-scale H2 production via water gas shift reaction in coal gasification process operating at high temperatures and pressures.
(SMR)
(WGSR)
This whole process consists of three main steps: catalytic reforming of methane (SMR), water gas shift reaction (WGSR) and finally hydrogen purification. Purification is required because hydrogen production comes up with CO2 co-production, besides other trace amounts of H2S, HCN, NH3, heavy metals [20]. Hydrogen obtained by this method is an important input for processes like ammonia, urea, methanol, hydrochloric acid production and hydrodesulphurization and fuel cell applications [17-20]. Therefore, production of hydrogen at desired purities is essential for downstream applications.
Different approaches can be employed for hydrogen enrichment including conventional methods like pressure swing adsorption (PSA), temperature swing adsorption and cryogenic distillation. The most commonly used method is pressure swing adsorption. This method is based on adsorbent bed that purifies the inlet gas stream at high pressure. The adsorbents hold the impurities on its surface. Purified hydrogen is released from the top of the bed and impurities are expelled by depressurization. These cycles provides continuous purified product flow. Multiple pressure swing adsorption beds can be utilized for products with higher purities. Temperature swing adsorption is quite similar to PSA. But it needs time to heat and cool the adsorbents. Another alternative, cryogenic processes require very low temperatures to operate and relatively expensive. Those three commercial methods are energetically demanding operations. But all of them are relatively expensive and highly energy consuming methods compared to membrane separations [7].
2
The attractive properties of membrane processes are their simplicity, ease of operation and versatility to large number of potential uses. Hydrogen separation is suited to membrane technology as it has a very high permeation rate relative to most other gases [8, 9].
Materials used for membrane production cover a wide range from organic polymeric materials to inorganic materials (e.g. ceramics, oxides, etc.) and dense metals [10]. For gas separation, polymers become predominant materials because of their properties like easy processing, high mechanical stabilities, low operating cost and space requirements [11, 12].
Polymeric membranes are the types of membranes that are usually studied for gas separation [10-12]. The products of water gas shift reaction leave the reactor at high temperatures and pressures. Therefore, working with membranes produced from materials which can retain their mechanical and thermal stability at harsh operating conditions is the primary factor for this specific application. Polybenzimidazole (PBI), which was used in this study, has inherent mechanical, physical and chemical stability. This material retains its robustness up to 600-630
oC
and has a high glass transition temperature (400-435oC) [39, 63]. Furthermore, high chain
packing density of this material provides diffusivity selectivity at temperatures above 150oC.
These properties and aliphatic group free structure make the polymer suitable for harsh operating conditions [48-50, 98].
For practical applications, it is important to produce polymeric membranes with suitable morphologies and enhanced gas separation performance. It is well known that polymeric membranes have a trade-off between the permeabilities and selectivities [53]. To surpass this limit and attain membranes, which are more feasible for commercial applications, as an alternative mixed matrix membranes containing zeolite fillers were produced. These two types of materials combine the prominent properties of both types of materials. Eventually, desired separation performances could be attained for particular separation [55-57].
If the aim is to obtain stable membranes at harsh industrial operating conditions, measuring the performance at only one temperature is not enough to fully elucidate the performance of a membrane. In industrial applications various temperatures are utilized and the performance of the membranes strongly affected by the temperature. Temperature dependent behavior of membrane toward gas transport should be investigated.
Within the scope of this study the effect of temperature and different annealing types on polymer and polymer-zeolite mixed matrix membranes were investigated. Polybenzimidazole was chosen as polymer matrix. Zeolite 3A and SAPO-34 particles incorporated mixed matrix membranes were produced and tested with hydrogen and carbon dioxide gases to see the influence of both temperature and annealing methodology on the membranes performances.
3
CHAPTER 2
LITERATURE SURVEY
In the last few decades energy efficient gas separation has become a significant issue. Different separation methods can be performed with regard to gases physical and chemical properties. The most important factor to determine the suitable method for any particular application is its process economics [13].
Membrane based gas separation compete with several traditional gas separation techniques. Commercialization of membranes and availability in the industrial applications can be possible by developing membranes which can operate at desired operating conditions with sufficient performance [14].
2.1 Gas Separation Membranes
Simply, membrane is a selective barrier between two phases. It can easily discriminate between molecules regarding difference in structure, shape or size [22].
Separation of molecules in the feed, having different chemical potentials like pressure or concentration, is achieved by membrane processes [23].
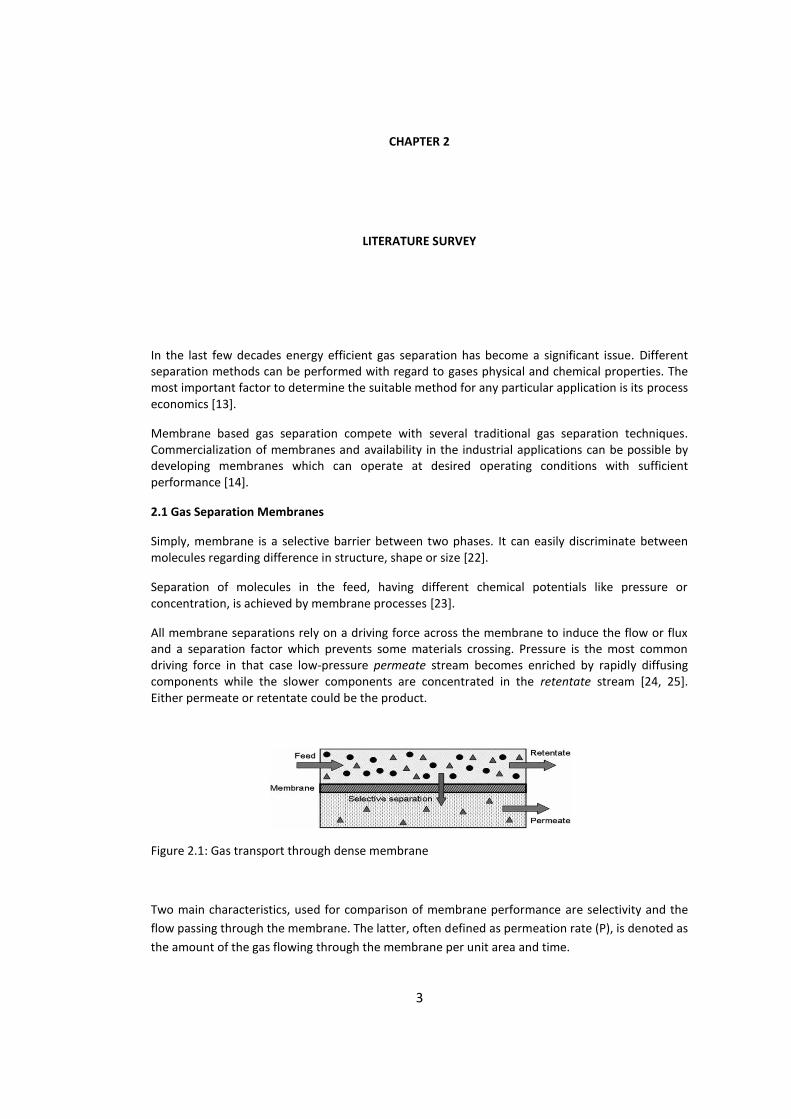
All membrane separations rely on a driving force across the membrane to induce the flow or flux and a separation factor which prevents some materials crossing. Pressure is the most common driving force in that case low-pressure permeate stream becomes enriched by rapidly diffusing components while the slower components are concentrated in the retentate stream [24, 25]. Either permeate or retentate could be the product.
Figure 2.1: Gas transport through dense membrane
Two main characteristics, used for comparison of membrane performance are selectivity and the
flow passing through the membrane. The latter, often defined as permeation rate (P), is denoted as
the amount of the gas flowing through the membrane per unit area and time.
4
Where Ji is the flux of permeating gas i, is the thickness of the particular membrane and is the effective partial pressure difference of species i across membrane meaning transmembrane pressure difference. The permeabilities are commonly defined as in the unit of Barrer:
( )
The selectivity (α) is the indication of separation ability of a membrane [14]. Ideal selectivity is the ratio of permeabilities of two single gases [24]. It depends on the experimental conditions, such as pressure differences of the applied gases [25].
Membrane selectivity towards binary gas mixtures is given as:
where and represents the concentration of components i and y in the permeate side and
and represents the concentration of the components in the feed side. These concentrations are
usually given as mole fractions.
2.1.1 Polymeric Membranes:
The membranes currently used in most commercial applications are solution-diffusion membranes. These membranes are so named because transport occurs when gas molecules dissolve into the membrane and then diffuse across it.
P=S×D
P, S and D represent permeability, solubility and diffusivity respectively. Permeability of a membrane depends upon: thermodynamic term, solubility which characterizes sorbed gas molecules under equilibrium conditions and kinetic term, diffusivity which characterizes the mobility of gases that transport through the membrane [26]. Today all of the commercial solution-diffusion membranes are produced from polymeric materials; so, these types of membranes require most of the attention [25].
Permeation coefficient of a polymer is a temperature dependent factor. It is typically modeled by Arrhenius relation for temperature ranges where a thermal transition does not occur:
(
)
On the same basis both diffusivity and solubility, which is a scale of penetrants condensability, of a polymer can be defined as:
(
)
5
(
)
where P0, D0 , S0 [Barrer] are the pre-exponential factors, R [8.314×10⁻³ kJ/mol K] is the universal gas constant. T [K] is the absolute temperature and Ea,, Ed are the activation energies for permeation and diffusion respectively. Hs [kJ/mol] is the heat of sorption.
Polymer free volume amount and its distribution are the main criteria in transport of gases. When a polymer is at temperatures above its glass transition temperature under conditions of use, this polymer is in its rubbery state. Rubbery polymers have relatively higher free volume due to mobile polymer chains; therefore rubbery polymers offer high permeabilities. But the selectivity of these polymers depends on the condensability difference of the gas species. When the polymer structure is altered by heat fluctuations, it propels sorption of gas molecules into free volume [24, 26].
On the other hand, when a polymer is at temperatures below its Tg, it is in glassy state. In this case the free volume decreases and polymer backbone has restricted co-operative movements. Due to the more restricted segmental motions, molecular interactions and molecule-chain affinities are involved in glassy polymers, these materials offer enhanced “mobility selectivity” as compared to rubbery polymers. Glassy polymers which are more common in industrial applications, offer higher gas selectivity and they have good mechanical properties [24, 28].
2.2 Hydrogen Carbon Dioxide Separation by Polymeric Membranes
Membrane gas separation has many benefits over conventional process for H2/CO2 separation either as a stand-alone process or integrated process with water gas shift reactors. It offers low investment cost, operating at high temperatures and pressures, lowers the energy cost of the process and high pressure retentate CO2 will be transport and stored without compression.
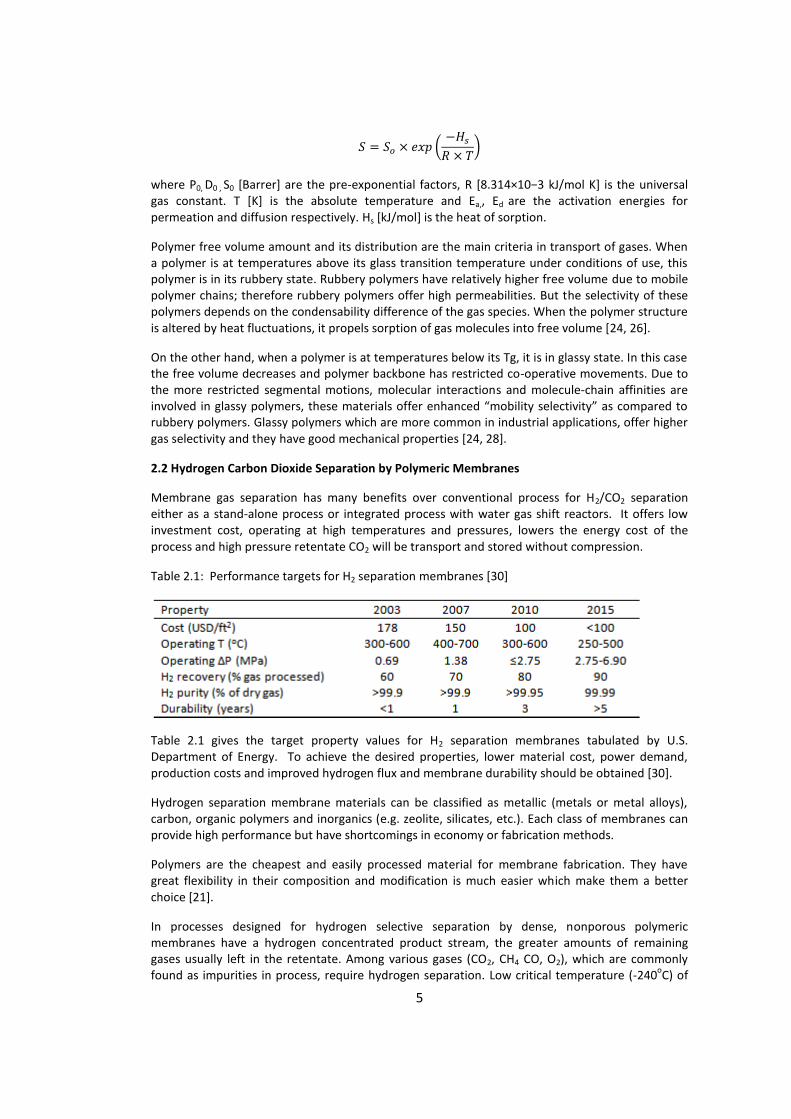
Table 2.1: Performance targets for H2 separation membranes [30]
Table 2.1 gives the target property values for H2 separation membranes tabulated by U.S. Department of Energy. To achieve the desired properties, lower material cost, power demand, production costs and improved hydrogen flux and membrane durability should be obtained [30].
Hydrogen separation membrane materials can be classified as metallic (metals or metal alloys), carbon, organic polymers and inorganics (e.g. zeolite, silicates, etc.). Each class of membranes can provide high performance but have shortcomings in economy or fabrication methods.
Polymers are the cheapest and easily processed material for membrane fabrication. They have great flexibility in their composition and modification is much easier which make them a better choice [21].
In processes designed for hydrogen selective separation by dense, nonporous polymeric membranes have a hydrogen concentrated product stream, the greater amounts of remaining gases usually left in the retentate. Among various gases (CO2, CH4 CO, O2), which are commonly found as impurities in process, require hydrogen separation. Low critical temperature (-240
oC) of
6
hydrogen is an indication of lower solubility of this gas. Low solubility combined with small kinetic diameter (0.289 µm) brings demand for diffusivity selective membranes for this application. Therefore, the current hydrogen selective membranes are fabricated in the aim of increasing the diffusivity of hydrogen [21].
Table 2.2: Gas permeabilities of some of the commercial polymeric membranes at 30oC [32]
Glassy polymers are the most frequently used materials for fabrication for hydrogen selective membrane operations [29, 31]. Table 2.2 gives performance of some of membranes which may be important in H2/CO2 separation [32].
Largest selection of polymers for H2/CO2 separation was studied by Orme and co-workers [32]. They tried to find a suitable material which can block the CO2 transport and offers high hydrogen fluxes. Among many polymers polysulfone, polystyrene, poly (methyl methacrylate) and poly (vinylidene fluoride) gave the best separation performance at 30
oC. Selectivities of the selected
membranes are 2.0, 2.3, 4.0, 2.0 respectively. They concluded that polystyrene is the best choice. It has the best combination for both high selectivity and permeabilities.
Xu et al. [33] examined the performance of fluorine containing poly(arylene ether)s with large and bulky diphenylfluorene moieties (FBP/6FPT and FBP/6FPPr). The selectivities for H2/CO2 were not so high; 1.67 for FBP/6FPT membrane and 1.54 for FBP/6FPPr membrane. But the remarkable point in the study is the high diffusivity selectivity almost 100 for hydrogen and carbon dioxide gas pair. Low overall selectivity is a result of poor solubility selectivity.
Polyimide (Matrimid) is one of the most studied polymers for hydrogen separation application. This polymer is chosen because when membranes are produced, they offer high permeability and selectivity, solvent resistance and thermal stability [34]. Smaihi et al. [35] prepared hydrogen selective polyimide membranes. Permeabilities of dense membranes were 1.14 and 3.0 Barrer for CO2 and H2 respectively at 35
oC. To improve the performance of the neat membranes they have
synthesized hybrid imide-siloxane copolymers. Membranes prepared from this copolymer showed a better performance in gas separation, H2/CO2 selectivity increased from 2.63 to 3.5 at 35
oC.
Hosseini et al. [36] tried to demonstrate the performance of polyimide polymer as a gas separation membrane. Permeability coefficients for hydrogen and carbon dioxide were 27.16 and 7.00 Barrer at 35
oC for dense polymeric membrane. The selectivity was almost 4.0.
In a study of our group Şen et al. [37] used polycarbonate membrane for gas separation. Dense polymeric membranes permeabilities for H2 and CO2 were 15.3, 8.80 Barrer respectively. But the resultant selectivity was low.
7
2.3 Polybenzimidazole Gas Separation Membranes
For carbon sequestration and capture at high temperatures with low energy by membranes has become an important issue for obtaining hydrogen.
Current processes used for CO2 sequestration require cooling of the gases to ambient temperatures [42]. The benefit of using membranes could significantly change the economy of the process. This will be done by using membranes which are stable both thermally and mechanically at high temperatures and pressures.
Aliphatic polybenzimidazole was first invented by Brinker and Robeson. Two years later, Vogel and Marvel synthesized aromatic polybenzimidazole. After taking attention from both academia and industry because of its high thermal and mechanical resistances, various polybenzimidazoles have been invented. But only a few of synthesized polymers showed desired properties. Table 2.3 summarizes the structures and thermal properties of them [38].
Table 2.3: Structural and thermal properties of PBI [38]
*: Weight loss after 1 hour at 500oC, after heating 1 hour at 400 and 450
oC
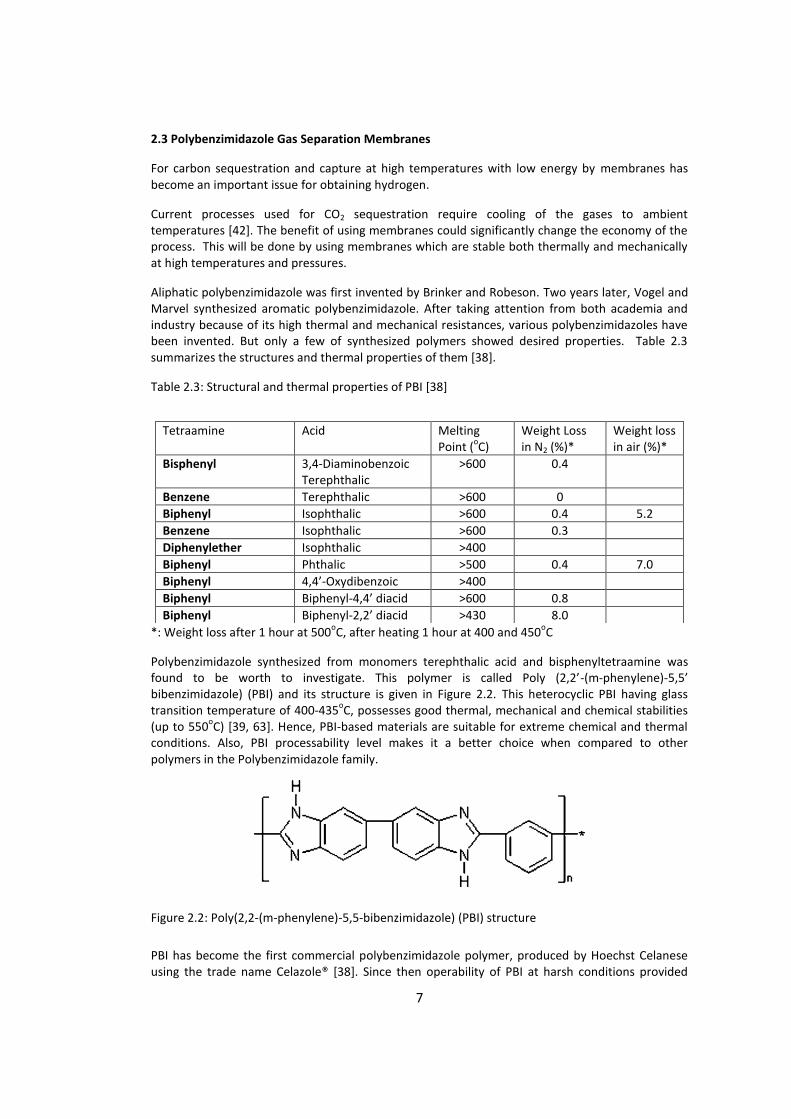
Polybenzimidazole synthesized from monomers terephthalic acid and bisphenyltetraamine was found to be worth to investigate. This polymer is called Poly (2,2’-(m-phenylene)-5,5’ bibenzimidazole) (PBI) and its structure is given in Figure 2.2. This heterocyclic PBI having glass transition temperature of 400-435
oC, possesses good thermal, mechanical and chemical stabilities
(up to 550oC) [39, 63]. Hence, PBI-based materials are suitable for extreme chemical and thermal
conditions. Also, PBI processability level makes it a better choice when compared to other polymers in the Polybenzimidazole family.
PBI has become the first commercial polybenzimidazole polymer, produced by Hoechst Celanese using the trade name Celazole® [38]. Since then operability of PBI at harsh conditions provided
Tetraamine Acid Melting Point (
oC)
Weight Loss in N2 (%)*
Weight loss in air (%)*
Bisphenyl 3,4-Diaminobenzoic Terephthalic
>600 0.4
Benzene Terephthalic >600 0
Biphenyl Isophthalic >600 0.4 5.2
Benzene Isophthalic >600 0.3
Diphenylether Isophthalic >400
Biphenyl Phthalic >500 0.4 7.0
Biphenyl 4,4’-Oxydibenzoic >400
Biphenyl Biphenyl-4,4’ diacid >600 0.8
Biphenyl Biphenyl-2,2’ diacid >430 8.0
8
usage of this material in fire controlling for asbestos replacement, ultrafiltration, reverse osmosis, hydrogen purification, fuel cells [40], electrolysis and electrochemical sensors [41]. PBI as a membrane material has received attention in the late 1960s.
To obtain a dense polymeric membrane solubility of the polymer is an essential issue. One of the drawbacks of PBI polymer is its poor solubility. It is soluble in common organic solvents only at high temperatures [38]. Klaehn et al. [43] studied on modifying PBI by N-substitution the imidazole nitrogens. Two types of modification were applied on polymer; silane and organic compounds substitution. Molecular weights of new polymers were higher than unsubstitued PBI. Using small molecule organic compounds molecular weight increased drastically. It was contributed to the crosslinking. Obtained polymers were soluable in tetrahyrofuran. But they couldn’t obtain desirable film formation properties, since films were fractured.
PBI demonstrates a selective separation of H2 from other gases present in reforming mixture. But dense structure of the polymeric material prevents high gas permeabilities of gases. To overcome the structural drawback of this polymer, coming from intermolecular hydrogen bonding and chain rigidity attempts have been done [41]. These include production of composite membranes or carbon membranes, structural modifications of membranes, and preparing supported membranes [43-49].
Han et al. [41] attempted to develop PBI membrane with higher gas permeabilities. Different synthesized precursor polymers are used to produce thermally rearranged (TR) PBI polymers. Controlled synthesis of PBI prevented the high packing density in polymer matrix. Evaluation of gas permeation performance of the prepared membranes were done using pure gas feed containing CO2, H2, O2, N2 and CH4. The permeability order of gases was H2>CO2>O2>N2>CH4. TR-PBI membranes possessed increase in gas permeabilities when compared to the precursor polymers. Furthermore, at elevated operating temperatures small gas molecules, H2 and O2, permeabilities increased but same trend couldn’t be observed for the other gases. H2 permeability didn’t show a remarkable increase in the temperature range tested, but CO2 solubility and therefore its permeability decreased. These membranes showed advantageous performance especially for H2 and CO2 separation at 120
oC.
In another study done by Pesiri and co-workers [44, 45] PBI meniscus membrane, which has a concave shape, suitable for hydrogen and carbon dioxide separation at high temperature were produced. PBI meniscus membranes span a tiny hole in the middle of the thin film. They mentioned that membranes produced from PBI polymer are poor room temperature separation membranes. Their initial focus was testing produced membranes close to temperatures in the industrial scale operations. The operating temperatures of the experiments were extended up to 340
oC. After 100
oC significant increase in permeance for both gases were observed. Both selectivity
and flux have showed a positive trend by increasing temperature for single gas experiments. During mixed gas experiment hydrogen permeance values declined after 250
oC. The selectivity
increased up to 20 for H2/CO2 until 270oC but at 320
oC it decreases to 3.0. Carbon dioxide offsets
the permeance of hydrogen.
To ameliorate the performance of PBI membranes Kumbharkar et al. [46] investigated the gas permeabilities of H2, CO2, O2, N2 and CH4 through modified PBI membranes. The aim of the study is to draw the advantage of PBI structural properties by modifying the structure. Two different PBIs one based on isophthalic acid (PBI-I) and other one based on 5-tert-butyl isophthalic acid (PBI-Bul) were used for substitution. Different N-substitutions were employed by n-butyl, methyl, 4-tert-butylbenzyl and methylene trimethylsilyl groups on PBIs which has different acid moieties. PBI-Bul showed higher permeabilites but lower selectivities than PBI-I after substituted by a particular group. Changing the substituent groups changed the diffusivities in an extended level compared to solubilities. Methyl, which is the smallest group, substitution exhibited the highest selectivity but
9
lowest permeabilities among other substituent groups. Tert-butlybenzyl group substituted PBIs showed an opposite trend. By substitution, the gas permeabilities of different gases enhanced 1.2-129 times.
Same group studied the effect of casting solvent on the same substituted polymers [47]. They claimed that performance of a membrane varies as a function of casting solvent. Viscosities of membrane preparation solutions were measured. Addition of substitution groups lowered the viscosity ascribed to the loosening intermolecular hydrogen bonding. Elimination of intermolecular bonding provided by substitution improved the solubility of PBIs. Prepared polymers were soluble in chlorinated solvents besides DMAc or NMP. To assess the effect of substitution, gas permeation tests was done using helium and argon gases. In general an increase in permeabilities was observed by substitution. The extent of the change depends on the structure of different prepared polymers [47].
Berchtold and co-workers [48] focused on producing PBI membranes which are durable at industrial operating conditions. Composite membranes were prepared by covering the surface of porous stainless steel support by PBI layer. A zirconia layer presents on the stainless steel support as an intermediate layer between steel and polymer. Obtained ideal selectivities for H2/CO2 and H2/N2 gases were 43 and 233 respectively at 250
oC and 3.5 atm. By increasing the temperature
from 150 to 250oC, selectivities of composite membranes decreased from 58 to 40. To simulate the
realistic conditions a gas mixture containing CO2: 41%, H2: 55%, CO: 1%, CH4: 1%, H2S: 1% and N2 1% at 250
oC and 3.5 atm were used. Similar selectivity results for H2/CO2 gas pair were obtained.
Presence of corrosive or plasticizer gases like H2S and CO2 didn’t have an effect on the composite membranes. The stabilities of membranes were demonstrated by long term durability tests at 250
oC for 330 days. As a result under simulated synthesis gas conditions membranes performance
didn’t change drastically.
Alternatively, Hosseini et al. [49] used blends of PBI and polyimides (Matrimid, Torlon and P84) for carbon membrane formation. The fundamental reason for this idea is to improve the resistance of brittle PBI membranes. The origin of the idea is based on the good compatibility and miscibility of PBI with some other polymers [50-51]. 50/50 wt.% blend precursors showed almost same performance as individual polymers. On the other hand, carbon membranes prepared from these blend precursors exhibited much higher permeabilities. Selectivities also showed an increase to some extent. PBI/Matrimid carbon membrane possessed the higher selectivity for most of the gas pairs, which is more evident for H2/CO2, the selectivity changed from 6.05 to 8.85 after carbonization. The results revealed that the blend precursor structure has an important contribution for the final properties of carbon membranes. Also effect of blend polymers compositions was studied. The membranes prepared by using higher amount of PBI, which has less non-carbon parts, showed much better performance. This result supports fine pore formation during carbonization. The selectivity for H2/CO2 improved from 6.84 to 9.2 for PBI/Matrimid membrane as PBI content increased from 25 to 75 wt.%.
Jorgersen et al. [52] prepared crosslinked PBI membranes supported on stainless steel substrate. Weight percent of the crosslinker α,α’dibromo-p-xylene was arranged as 10 wt.%. By rising temperature favorable permeabilities for N2, CO2, CH4 and H2 were obtained. But selectivities affected adversely except for H2 and CO2 gas pair. Selectivity almost stayed same for this pair. They concluded that this membrane may be a proper choice at elevated temperatures for H2/CO2 separation when the economics of the system is considered.
To take benefit from structural advantages of PBI and to overcome the major structural drawbacks some modifications have been done as stated in above researches. Another way of improving the performance of polymeric materials is producing inorganic incorporated polymeric membranes called Mixed Matrix Membranes.
10
2.4 Mixed Matrix Membranes
In 1991, Robeson plotted the selectivity versus permeability data for many different gas pairs tested using various polymers and found that they lay on or below a specific line which is called “Upper Bound Tradeoff Line” [53].
Figure 2.3: Upper bound line for H2 selective membranes
Figure 2.3 depicts the tradeoff between permeability and selectivity for hydrogen and carbon dioxide gas pair. The relationship between permeability and selectivity was described by Robeson as shown in below equation:
where and are parameters which were reported by Robeson for some gas pairs. On the
other hand, Freeman et al. [105] introduced a theory to explain the upper bound line. According to this theory is related to the penetrant kinetic diameters and related to condensability of
gases. It was stated that attractive region could not be reached by changing chemical structure of the polymer, since related parameters are only dependent on the gases. Attractive region for industrial applications is beyond this upper bound line as shown in Figure 2.3. A substantial effort has been made to overcome this limit. Molecular sieve membranes like carbon sieve, zeolite membranes or metal organic frameworks show performance above the upper bound line [12]. But these materials are expensive to produce and they are very brittle. Furthermore, obtaining modules with high surface area using these materials is very difficult because of their fragile nature [12, 53, 54].
Mixed matrix membranes (MMMs) became a potential approach for gas separation [65-66]. They are produced in the purpose of combining the good gas separation properties of inorganic materials and easy processability of polymeric materials to obtain more efficient membranes [55, 56]. The degree of mobility of the polymers chains often limits the size sieving abilities and most of the time at high temperatures they are not stable. On the other hand, inorganic materials offer
H2/
CO
2Id
ealS
ele
ctiv
ity
H2 Permeability (barrer)
11
high temperature resistance. Thus, inorganic materials having the unique structural and separation properties are dispersed in polymer matrix to obtain better performance than conventional polymeric membranes. As a result, the benefit of dispersed filler particles includes acting as a block for undesired gases transport, increasing permeabilities and disturbing the structure [57, 91].
Either porous or nonporous inorganic materials can be used for MMMs preparation. Porous type of fillers discriminate the molecules according to their size and shape. Hence, they have high selectivities and permeabilities above the tradeoff line. Adding porous fillers into the polymer matrix increases the overall selectivity of the membranes relative to neat membrane [58-60]. On the other hand, nonporous fillers may enhance the separation characteristics of MMMs via increasing free volume by changing distance between polymer chains. Increased tortuosity by increasing amount of filler can reduce the diffusion of large molecules [63, 64]. In contrast, nano-scale particles may disturb the chain packing of the polymer matrix and increase free volume which may result in increased diffusion of gases [61].
Glassy or rubbery polymers can be used as polymer matrix. Rubbery polymers can provide good adhesion between zeolite and polymer. But, their gas separation performances are still below compared to glassy polymers which make them less attractive candidates compared to glassy polymers.
Glassy polymers possess performances close to the upper bound line and they have higher mechanical stabilities. Thus, more researchers focused on studies employing glassy polymers as matrix [61, 67-69].
Zornoza et al. [62] prepared mixed matrix membranes by employing hollow microporous silicalite-1 spheres (HZSs). The advantage of addition of this type of filler was demonstrated by using polysulfone and polyimide. The results were promising for H2/CH4, CO2/N2, and O2/N2 gas mixtures at 8 wt.% loading for both membranes.
Zeolites are able to discriminate molecules according to their size precisely. Zeolite/polymer MMMs are candidates to appeal to the problems encountering with both polymers and zeolite membranes [104]. For suitable combination not only the polymer and filler type but also, the size and loading of the filler and membrane preparation parameters have major influence on the separation properties [61,105].
In our research group many studies for improving gas separation of polymeric membranes by producing mixed matrix membranes were investigated [37, 71-75].
Şen et al. [37] used polycarbonate (PC) as polymer matrix, Zeolite 4A as filler and p-nitroaniline (pNA) as low-molecular weight additive. Neat PC, PC/pNA, PC/zeolite 4A and PC/pNA/zeolite 4A mixed matrix membranes were produced. The additive concentration changed from 1 to 5 wt.% for pNA and filler concentration from 5 to 30 wt.% for Zeolite 4A. H2, CH4, O2, CO2, N2 gases were tested for gas permeation measurements to examine the effect of additives. The gas permeation performance of the neat PC membranes enhanced remarkably by incorporation of additives. Highest ideal selectivities were obtained for PC/pNA/zeolite 4A mixed matrix membranes. CO2/CH4 selectivity increased from 23.6 to 51.8 and for H2/CH4 increased from 40.9 to 121.3.
In a study done by our group Karatay et al. [71] prepared binary and ternary mixed matrix membranes by using SAPO-34 as filler, 2-hydroxy 5-methyl aniline (HMA) as compatibilizer and polyethersulfone (PES) as polymer matrix. Incorporation of additive to the structure may enhance the performance of MMMs by increasing the link between filler and polymer [68-70]. The lack of contact between polymer and zeolite causes dramatic decline in the performance of membranes by introducing voids for passage of molecules without any size discrimination. Test runs done by utilizing 20 wt.% SAPO-34 loaded membranes resulted in increased permeabilities. The selectivities
12
increased for specific gas pairs, the increase for H2/CO2 gas pair changed almost 2 fold, but permeabilities were declined. Among all tested membranes ternary ones gave the best results.
In another study of our group Cakal et al. [74] produced four different types of membranes to see the influence of additives on CO2/CH4 separation. For this purpose PES/SAPO-34, PES/HMA and PES/SAPO-34/HMA membranes were prepared. Also neat PES membranes were prepared to see the influence of additives more clearly. Gas mixtures containing 5 to 70 % by volume CO2 was used as feed. Highest permeability was obtained for PES/SAPO-34 membranes while highest selectivities were obtained for PES/SAPO-34/HMA membrane containing 4 wt.% HMA. The results showed that regardless of the feed composition, same gas separation selectivities for both single and mixed gas measurements can be obtained.
Furthermore, Keser et al. [75] was focused on producing mixed matrix membranes using PES, synthesized Zeolitic Imidazolate Framewok-8 (ZIF-8) and HMA. In order to demonstrate the zeolite loading influence, concentration was changed between 10 to 30 wt.%. Ternary mixed matrix membranes containing both filler and additive were fabricated. Gas separation performances of the prepared membranes were evaluated by using H2, CO2 and CH4. To elucidate the effect of pressure on these membranes, feed pressure was changed from 3-12 bar. By zeolite addition the permeabilities for all test gases were improved with a slight decrease in ideal selectivities. Incorporation of HMA ideal selectivities increased along with decrease in permeabilities. Selectivities improved from 61.8 to 103.7 for H2/CH4 gas pair. On the other hand, permeability decay for H2 from 26.3 to 13.7 Barrer was evident. Favorable increase was observed in gas separation performance for all types of membranes. It was concluded that it will be proper to work at high feed pressures by using this type of ternary membrane.
Zhang et al. [68] prepared mixed matrix membranes using Polyimide (Matrimid) and mesaporous ZSM-5 nanoparticles. Pure gas tests were employed by H2, CO2, CH4, O2, and N2 gases. Increased loading from 0 to 20 wt.% increased permeabilities of O2, CO2, H2. Size sieving ability of the mesaporous ZSM-5 was related to the polymer chain penetration into the zeolite during membrane preparation. In the scope of the same study membranes containing 10 % MCM-48 was also tested. Selectivity improved for H2/CO2 gas pair from 2.40 to 2.57 for 20 % ZSM-5 loading and from 2.40 to 2.47 for 10 % MCM-48 loading.
In a study conducted by Josephine and co-workers [69] ZIF-8 nanoparticles filled mixed matrix membranes were prepared using polyimide polymer matrix. Membranes containing higher up to 60 wt.% ZIF-8 nanoparticles were tested for gas permeations of several gases including H2, CO2, O2, N2, CH4, C3H8. Permeabilities of all gases were altered up to 40 % loading. Further loading of nanoparticles resulted in unfavorable permeabilities. This result was contributed to the more tortuous pathway of mixed matrix membrane for penetrants. Also, it was mentioned that after certain limit of loading, sieving effect of zeolite nanoparticles becomes more dominant instead of polymer free-volume transport. Ideal selectivity for H2/CO2 increased from 2.96 to 4.43 as loading increased to 60%.
Huang et al. [70] employed zeolite 4A particles for PES based MMMs. Well-distributed nano-scale zeolite particles provided increased selectivities for He/N2, H2/N2, He/CO2, and H2/CO2 gas pairs when compared to neat PES membranes. Almost 150 % improvement was observed in selectivities for certain gas pairs. The increase was 135 % for H2/CO2 selectivity.
To enhance the performance of PBI membranes Choi et al. [61] prepared composite PBI membranes with Arnhernt-3 (AHM-3). This material has a layered structure. The main reason of this choice was permeable layers of the material which provide access from all directions for especially small molecules. The effect of incorporation was tested by gas permeation experiments of hydrogen and carbon dioxide. Proton exchanged (PAHM) and swollen (SAHM) AHM-3 was added
13
to the polymer continuous phase. Permeabilities of gases were declined by increasing load of filler. Membranes prepared by addition of 3 % SMAH and 14 % PAMH almost showed same performance. This result was related to the increasing tortuosity coming from different preparation procedure of these membranes. Ideal selectivity of H2/CO2 gas pair was changed from 15 to almost 30 at 35
oC. In the scope of the same study to observe the effect of different material incorporation,
mixed matrix membranes with plate-like MCM-22 were prepared. Increasing content of MCM-22 altered the permeabilities but ideal selectivities deteriorated. This was attributed to the micro voids formed around aggregated MCM-22 particles. Subsequently, no significant improvement was observed compared to dense PBI membranes [61].
2.5 Effect of Annealing Conditions
The structure of a membrane is an important criterion in determining the right application area of use. The main aim in membrane fabrication is achieving the combination of high selectivity and high gas permeability for a particular application. Hence to make a membrane having desired properties studying formation procedures is crucial [76, 77].
Annealing is a heat-treatment which is applied on membranes to remove the residual solvent trapped within the membrane and to erase the thermal history. Type and conditions of the annealing method have different influences on membranes depending on the structure.
Annealing at different temperatures can change the intrinsic properties of membranes. Kusworo et al. [76] investigated the effect of this phenomenon by preparing polyethersulfone/polyimide blend and annealed them at temperatures both above and below the glass transition temperature of the blend. The permeabilities for O2 and N2 were declined by increasing annealing temperature. Initially, annealing at 150
oC and 240
oC were employed. But the selectivities of obtained membrane
were far lower than the unannealed membrane. Increasing the temperature up to 280oC improved
the selectivities almost by factor 5. They interpreted that annealing above Tg of the polymer was an effective method to erase the residual solvent imprints.
Macchione et al [79] studied the effect of remaining solvent on Hyflon® AD 60X membranes. They have prepared dense gas separation membranes and the membranes were heat treated under vacuum by heating from 70
oC to 200
oC slowly. They have tested both unannealed membranes and
high temperature annealed membranes using He, O2, CO2, H2 and CH4. It was concluded that the size sieving properties of membranes were improved after annealing due to reduced chain mobility. The diffusion coefficient of helium remained nearly constant but the diffusion coefficient of CH4 reduced by almost one order of magnitude.
Fu et al. [80] surveyed the influence of residual solvent on the dense polyimide membranes at both 25
oC and 150
oC under vacuum for 0.5 to 9 days. Low temperature was not enough to expel residual
solvent. They mentioned that at 150oC the mobility of the polymer chains are higher hence, the
diffusion of solvent is fast. Increasing residual solvent amount, increased the permeabilities of both N2 and O2, meaning after a critical value remaining solvent plasticizes membranes.
To demonstrate the time and temperature dependency of annealing Joly et al. [81] investigated the effect of solvent remaining in 6FDA–mPDA polyimide membranes. The prepared dense films were heat treated at 200
oC for different period of times. The thermal treatment applied at longer
periods provided lower diffusion coefficients but higher permeability and solubility coefficients for CO2 and N2 gases. At longer periods the imprint of solvent inside the membrane is eliminated. Also, in the scope of the study they studied different types of solvents for membrane fabrication. They concluded that high molar volume solvents leave imprints within the structure.
Annealing time effect on permeation of carbon dioxide, nitrogen and oxygen gases through co-extruded linear low-density polyethylene was investigated by Lopez and co-workers [82]. The time
14
and the temperature of the process changed from 0 to 24 hours and 0 to 90oC respectively.
Permeabilities increased with increasing temperature. The permeation results indicate that nitrogen is not influenced by the time compared to other gases. As the time of annealing changed from 0 to 24 hour, the diffusivity of all gases declined gradually. But the permeabilities showed an opposite trend. They related this to the melting of very small crystalline parts on the polymer chains according to the DSC diagrams.
In our group Hacarlıoğlu et al. [83] reported the effect of annealing time on dense polycarbonate membranes. Annealing was employed at 50
oC for 8, 24, 72, 154 hours. Denser structures were
obtained as a result of annealing. After 24 hours the permeabilities were declined, but selectivities increased. On the other hand, permeabilities of various gases stayed almost constant between 72 and 154 hour annealing. They concluded that 72 hour annealing was enough to destroy solvent imprints within the structure of the membrane.
Kruczek et al. [84] studied an alternative annealing method by using sulfonated polyphenylene oxide. Additional heat treatment after solvent evaporation is not a proper method for the complete removal of entrapped residual solvent in the prepared membranes because of the decomposition of the sulfonic groups at high temperatures. Therefore, they decided to remove the residual solvent by long-term permeation of CO2 gas through the membrane. The permeation rate of CO2 increased in the first 3 days of the experiment, but no change in permeation values of CO2 were observed between 3-63 days. They concluded that there was no possibility for solvent presence in the membrane structure after 63 days.
Hibshman et al. [85] investigated the effect of annealing on gas permeation performance of partially hydrolyzed polyimide membranes. Annealing at 400
oC and then decreasing the
temperature by quenching caused cross-inking within the structure. This was evident with the results of TGA-MS, FTIR-ATR. Membranes were characterized by single gas permeabilities for He, O2, N2, CH4, CO2 at 35
oC. The permeabilities increased almost 2 to 3 fold. Results were attributed to
altered local molecular motions on the polymer chain. Diffusivity dominant permeation was observed. But selectivities declined.
To determine the effect of annealing temperature on membrane performance, Koros and co-workers [86] examined synthesized fluorinated, 6FDA based polyamide–imide for the separation of CH4 from streams containing plasticizers like CO2 and H2S by dense membranes annealed at various temperatures. 200
oC was found to be the best temperature for annealing.
2.6 Effect of Operating Temperature:
Many attempts have been done to increase the performance of a membrane showing high permeability and selectivity for higher product purity. On the other hand, it is important to obtain membranes not only showing high but stable performances at harsh industrial operating conditions.
In literature most of the studies related to gas separation membranes were done at low operating temperatures. Even Robeson trade-off line was plotted using measurements carried out at temperatures between 25
oC-35
oC [53]. The effect of temperature on upper bound line has been
investigated recently [115]. If the aim is obtaining high performance membranes especially for high temperature applications, to fully explore the performance of prepared membranes, it is crucial to study at higher temperatures.
Mobility of polymer packed structure and intersegments are temperature dependent [80]. At elevated temperatures, the diffusivity of molecules and segmental motions increase, resulting in higher transportation rates. Specific gas molecules which possess higher activation energies are more influenced by the temperature [81, 83].
15
Merkel et al. [88] investigated the permeability of syngas feed containing H2, H2S, CO and CO2 at temperatures changing from room temperature up to 240
oC. The simulated feed was tested using
solubility selective rubbery poly(dimethylsiloxane) (PDMS) and glassy poly(1-trimethylsilyl-1-propyne) (PTMSP) polymers. At room temperature both membranes showed higher permeabilities for H2S and CO2. At elevated temperatures they became hydrogen selective. At higher temperatures permeability of all gases except hydrogen decreased for PTMSP polymer indicating negative activation energies. But for PDMS all gases gave positive activation energies. The calculated activation energies were highest for hydrogen and decreased according to the solubilities of gases.
Mixed matrix membranes were prepared using polysulfone acrylate-zeolite 3A and studied as a function of temperature for H2/CO2 separation. The operating temperature changed from 25
oC to
55oC. Diffusivity of both gases increased with rising temperature as a result of enhanced flexibility
within polymer chains. But CO2 permeability increase was more significant compared the H2 selectivity which in turn results in decrease in selectivity with temperature [90].
In our group Oral et al. [74] used four different membranes to investigate the effect of annealing time and temperature on performance of membranes. These membranes include neat PES and PES/SAPO-34, PES/SAPO-34/ HMA and PES/HMA mixed matrix membranes. Neat PES membrane showed stable permeation results. But same trend couldn’t be observed for other types of membranes. Therefore, post annealing was applied at 120
oC, 0.2 atm and 7-30 days. After post
annealing, membranes showed higher and stable gas permeations for all tested gases. Diaz et al. [91] worked with H2, N2, O2, CO2, CH4, C2H6 and C2H4 gases to explore the performance of poly(1,4-phenylen ether-ether-sulfone) membranes containing ZIF-8 particles as filler. For all tested gases permeabilities increased as a result of improved diffusion. Hydrogen was the only molecule which exhibited endothermic sorption process for both neat and MMMs as a result diffusion dominant permeation was observed for prepared MMMs.
Ostwal et al. [93] studied the transport properties of carbon dioxide and nitrogen with poly(fluoroalkoxyphosphazene) membranes. Increasing temperature from -15
oC to 30
oC increased
the permeability of CO2 from 142 Barrer to 336 Barrer. Ideal selectivity for CO2/N2 changed from 21 to 12 at 3 bar feed pressure. Solubility coefficient of CO2 deteriorated as temperature increase on the other hand, diffusivity coefficient showed an opposite trend.
Koros and Castello [87] investigated the change in gas permeation performance of three different polycarbonate polymers as a function of temperature. Bisphenol-A polycarbonate, tetramethyl polycarbonate, and tetramethylhexafluoro polycarbonate were tested using CO2, CH4, He and N2
between 35°C- 125°C. Permeabilities of gases were increased via operating temperature rise, but selectivities declined. The loss in CO2/CH4 and He/N2 selectivity were related to the decrease in both solubility and diffusivity selectivities. Membranes prepared by tetramethylhexafluoro polycarbonate gave the best performances.
2.7 Selection of Membranes Preparation Materials
Proper selection of materials for the fabrication of mixed matrix membranes is a crucial factor. Inorganic fillers act as molecular sieves and transport in polymers are related to the selection characteristic of the material. Therefore, both polymer and filler phase has an influence on mixed matrix membranes separation properties [58-60, 91].
In membrane separation applications it is fundamental to choose membranes which show high selectivity and permeability at the same time along with good mechanical and chemical strength, thermal stability and low manufacturing cost.
16
Since water gas shift reaction occurs at high temperatures and pressures it is beneficial to perform H2/CO2 separation at corresponding conditions. When membranes are stable at high temperatures and pressures they may selectively remove hydrogen and carbon dioxide. In this study PBI was chosen as polymer matrix. PBI which can retain its integrity at high temperature is a potentially suitable selection for gas separation purposes.
PBI polymer has some shortcoming related to its intrinsic properties. Its relatively high chain packing density provides a rigid structure which exhibits some drawbacks in gas separation. Highly packed structure of this polymer limits permeability of gases. In order to enhance the gas separation properties many attempts were used including producing mixed matrix membranes as mentioned in Section 2.3.
Suitable filler choice can provide a good interfacial contact with polymer. Contact between polymer and zeolite should be sufficient enough to eliminate gaps between two phases and not block the pores of the zeolite [61, 63]. The molecular sieve filler involved in the study were SAPO-34 and Zeolite 3A. Zeolite 3A is a kind of zeolite having pore size of 0.3 nm which can discriminate hydrogen and carbon dioxide molecules having kinetic diameters of 0.289 and 0.33 nm respectively. Synthesized SAPO-34 was used as second filler. The particle size of this zeolite may provide homogeneous distribution within the membrane [95, 96].
In this study the influence of annealing time and temperature and operating temperature on performance of neat polymeric and mixed matrix membranes are investigated systematically with single gas permeabilities of H2 and CO2 gases.
17
CHAPTER 3
EXPERIMENTAL
3.1 Materials for Membrane Preparation:
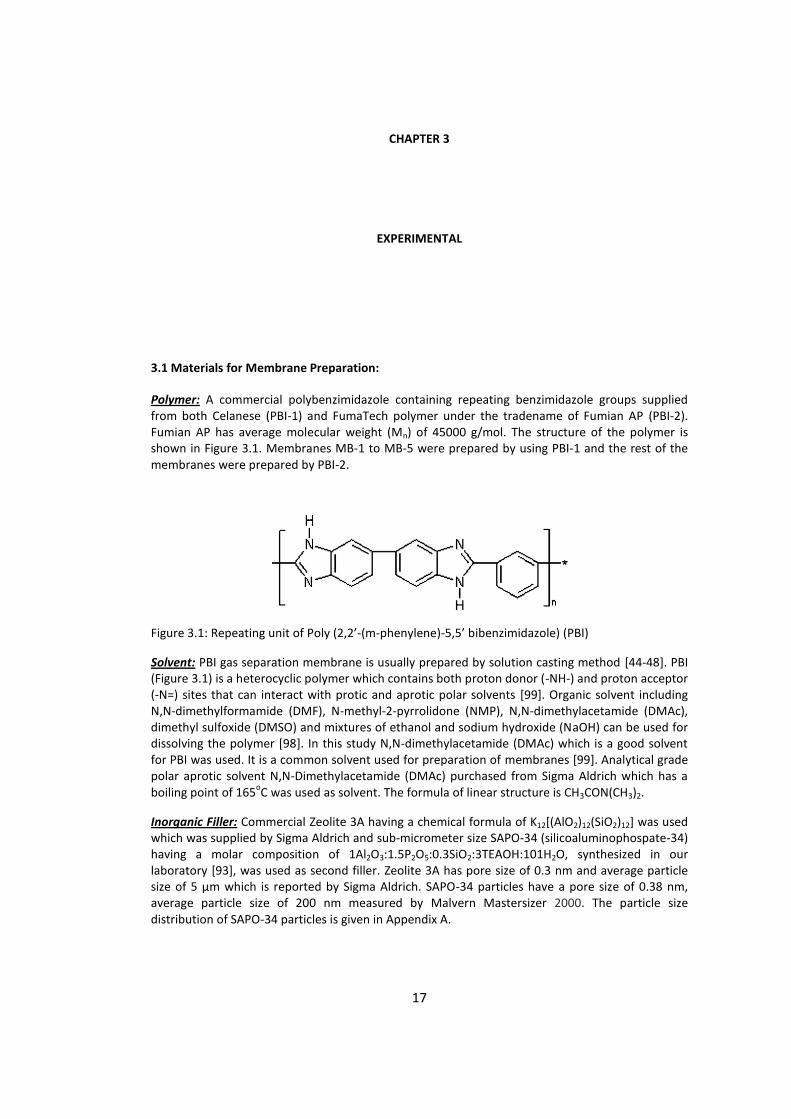
Polymer: A commercial polybenzimidazole containing repeating benzimidazole groups supplied from both Celanese (PBI-1) and FumaTech polymer under the tradename of Fumian AP (PBI-2). Fumian AP has average molecular weight (Mn) of 45000 g/mol. The structure of the polymer is shown in Figure 3.1. Membranes MB-1 to MB-5 were prepared by using PBI-1 and the rest of the membranes were prepared by PBI-2.
Figure 3.1: Repeating unit of Poly (2,2’-(m-phenylene)-5,5’ bibenzimidazole) (PBI)
Solvent: PBI gas separation membrane is usually prepared by solution casting method [44-48]. PBI (Figure 3.1) is a heterocyclic polymer which contains both proton donor (-NH-) and proton acceptor (-N=) sites that can interact with protic and aprotic polar solvents [99]. Organic solvent including N,N-dimethylformamide (DMF), N-methyl-2-pyrrolidone (NMP), N,N-dimethylacetamide (DMAc), dimethyl sulfoxide (DMSO) and mixtures of ethanol and sodium hydroxide (NaOH) can be used for dissolving the polymer [98]. In this study N,N-dimethylacetamide (DMAc) which is a good solvent for PBI was used. It is a common solvent used for preparation of membranes [99]. Analytical grade polar aprotic solvent N,N-Dimethylacetamide (DMAc) purchased from Sigma Aldrich which has a boiling point of 165
oC was used as solvent. The formula of linear structure is CH3CON(CH3)2.
Inorganic Filler: Commercial Zeolite 3A having a chemical formula of K12[(AlO2)12(SiO2)12] was used which was supplied by Sigma Aldrich and sub-micrometer size SAPO-34 (silicoaluminophospate-34) having a molar composition of 1Al2O3:1.5P2O5:0.3SiO2:3TEAOH:101H2O, synthesized in our laboratory [93], was used as second filler. Zeolite 3A has pore size of 0.3 nm and average particle size of 5 µm which is reported by Sigma Aldrich. SAPO-34 particles have a pore size of 0.38 nm, average particle size of 200 nm measured by Malvern Mastersizer 2000. The particle size distribution of SAPO-34 particles is given in Appendix A.
18
3.2 Membrane Preparation Methodology
Solvent evaporation method was utilized for preparing thin film membranes. Three kinds of membranes were prepared; neat PBI, PBI/Zeolite 3A and PBI/SAPO-34. Fillers were dried at 250
oC
for 1 day prior to membrane preparation.
Solubility of PBI polymer in common solvent is a problem for especially commercially supplied polymers [97]. Not complete but >90% solubility in DMAc was reported by FumaTech. There was no specific information about the solubility of PBI-1. Yet during casting solution preparation, for both type of polymer the amount of undissolved polymer after dissolution was measured. The results were similar.
Casting solution preparation:
Casting solution concentration has significant effect on membrane performance [83]. To determine the proper polymer concentration for membrane production, concentration was changed between 2-10 wt.%. This concentration determination study was performed by PBI-1. It was observed that for all concentrations heating at 100
oC on a hot plate with stirring for 4 days was not enough.
Hence, a new set-up shown in Figure 3.2 was installed under our laboratory conditions.
In the new set-up a flask containing polymer and solvent was placed in a silicon oil bath. This bath was on a hot plate and used for supplying a homogeneous heating. By using this system dissolution was operated at 140
oC, which is closer to the boiling point of DMAc, under stirring. The
temperature of the system was controlled by both a thermocouple and a thermometer. Continuous nitrogen feed as a sweep gas was send into the flask at very low pressures. The aim of using a sweep gas was to cut the contact of polymer solution surface with the air. Besides to prevent the boiling of solvent a condenser was used. 10±1
oC water was supplied to the condenser
by a cryostat which was utilized to recycle the evaporated solvent.
Figure 3.2: Set-up used for casting solution preparation
19
Initially this system was used for 2 wt.% casting solution. Then, 5 wt.% solution was prepared. The dissolution problem continued at all concentration range studied. Also, the undissolved part of the polymer was difficult to separate. Therefore, higher polymer concentrations were not studied. This advantageous new system provided homogeneous heating of the solution and lowered the dissolution time to 2 days for 2 wt. % casting solution.
The main reason of dissolution problem was using the commercial polymer which has a high molecular weight. Furthermore, it was decided that without changing the structure of the polymer, this problem could not be solved. For this reason, to enhance the solubility, 1 wt. % LiCl was added to the polymer solution. Obtained membranes washed with deionized water and dried at 60
oC.
Particularly, after drying, membranes lost their flat shape and became twisted. As a result this method was not applied in further studies.
After determining the optimum casting solution concentration, the amounts of components were adjusted by considering the dissolution problem of the polymer. For this purpose 2.2 w/v % percent polymer was added to cold DMAc, and the solution was prepared by dissolving the polymer at 140
oC for 48 hours under continuous stirring and nitrogen atmosphere. A simple
schematic representation of the process can be seen in Figure 3.3. The amount of solution was weighted before and after dissolution process to make sure no solvent was lost from the condenser. If any loss in solvent was observed, required amount was added and solution was stirred for two more hours. After dissolution, the polymer solution was filtered to remove the undissolved part by using Grade 41 ashless Whatmann filter paper (110 mm diameter). The amount of the undissolved, dry polymer was weighted and found to be about 10% of the initial polymer. Therefore, final composition of casting solution was 2 wt. %.
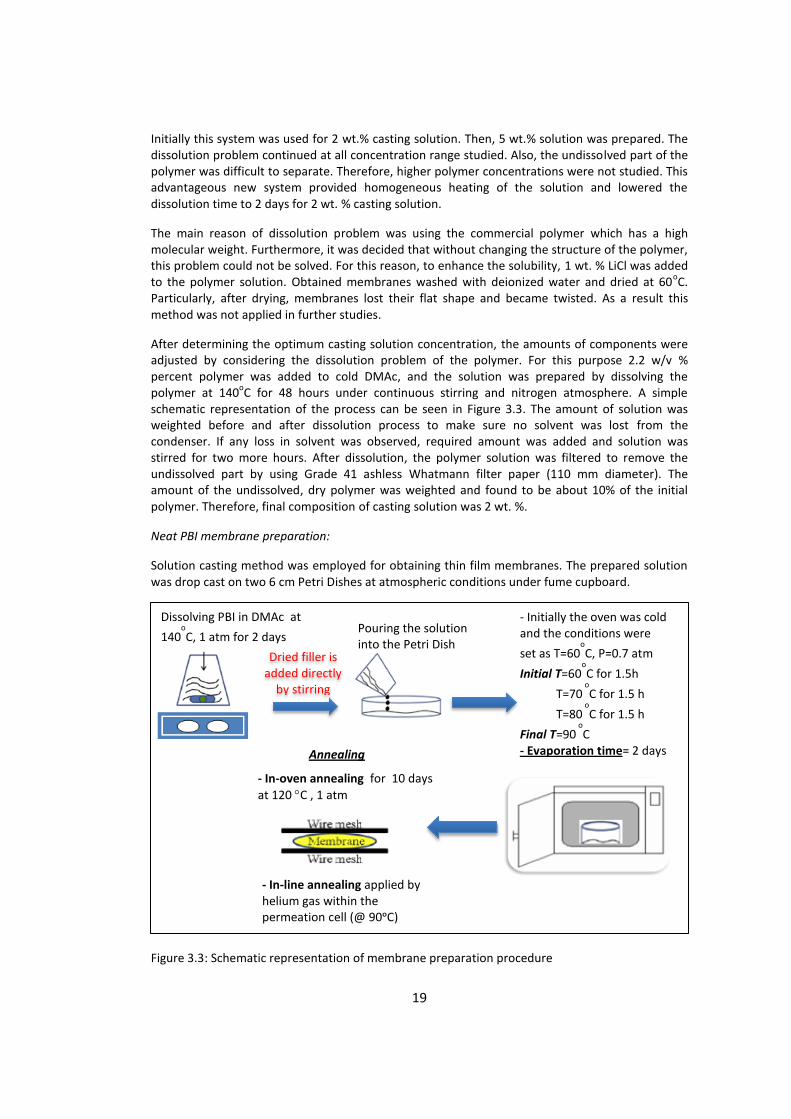
Neat PBI membrane preparation:
Solution casting method was employed for obtaining thin film membranes. The prepared solution was drop cast on two 6 cm Petri Dishes at atmospheric conditions under fume cupboard.
Figure 3.3: Schematic representation of membrane preparation procedure
Dried filler is added directly
by stirring
Dissolving PBI in DMAc at
140oC, 1 atm for 2 days
Pouring the solution into the Petri Dish
- Initially the oven was cold and the conditions were
set as T=60oC, P=0.7 atm
Initial T=60oC for 1.5h
T=70 o
C for 1.5 h
T=80 o
C for 1.5 h
Final T=90 o
C - Evaporation time= 2 days
Annealing
- In-oven annealing for 10 days
at 120 C , 1 atm
- In-line annealing applied by helium gas within the permeation cell (@ 90ᵒC)
20
In the earlier studies Petri Dishes filled with casting solution were located in an oven at 90 o
C and 120
oC at 0.2 atm vacuum. When the polymer solutions were placed in an oven at 120
oC immediate
shrinkage of the solution was observed. At 90oC a dense film was obtained but shrinkage problem
was continued. Round cut membranes could not been obtained by using these thin films. For this reason, it was decided to start evaporation at lower temperatures and increase the temperature every 1.5 hour period by 10
oC intervals at the same time applying 0.7 atm pressure.
Petri Dishes were located in an oven at 60oC, 0.7 atm N2 atmosphere for solvent evaporation as
shown in Figure 3.3. The temperature for drying was increased gradually instead of high temperature exposure at once. The temperature increased from 60
oC to 90
oC by 1.5 hours periods
and membranes were dried at 90oC for 2 days. Thicknesses of the selective membranes were
measured by a micrometer.
Mixed matrix membrane preparation:
Blending and casting was used. Prior to addition the fillers were dried at 250oC for 2 days. Same
casting method steps were followed for mixed matrix membrane preparation as neat membrane preparation except after the polymer solution were filtered, dried filler added directly to the casting solution as denoted in Figure 3.3 and 3.4. To obtain a homogenous distribution of filler particles and to prevent agglomeration, the solution was left for vigorous mixing on a magnetic stirrer for 24 hours at room temperature. Before drop casting into the Petri Dish, solution was ultrasonicated (Branson 2510, 40 kHz) for an hour to make sure that the all filler particles are dispersed homogeneously and to minimize the agglomeration of particles.
Membranes having nonuniform thicknesses were obtained by aforementioned casting procedure which was more evident for PBI/Zeolite 3A. Therefore, alternative method was utilized to eliminate the nonuniform distribution of fillers. In this method, the casting solution concentration was increased by evaporating the solvent before drop casting. Because casting solution viscosity prepared by 2wt.% polymer was low and fillers were tend to precipitate. Furthermore, when membranes peeled off from Petri Dish after evaporation, heterogeneous structures were evident. Hence, to prevent the precipitation of fillers, casting solutions were left to a controlled evaporation at 140
oC by using the set up shown in Figure 3.2, except condenser and cryostat, until the polymer
solutions concentration reached to 8 % under vigorous stirring. Then, 25 wt.% Zeolite 3A or 20 wt.% SAPO-34 filler was added and the solutions were stirred for one more day. Before drop casting, solutions were ultrasonicated for an hour. Concentrated solutions were evaporated inside a vacuum oven at 90
oC, in 0.7 atm N2 environment. Casting solutions were evaporated by
increasing the temperature step by step to 90oC from 60
oC. But after solvent evaporation no
further improvement was observed for both types of membranes especially for PBI/Zeolite 3A membrane. Even this concentrated casting solution was not enough to obtain homogenous membrane structure. As a consequence, this method was no longer used and solutions were casted by using 2wt.% solutions.
After obtaining both neat PBI and mixed matrix membranes additional heat treatment, annealing was applied on membranes. Two types of heat treatment were employed throughout the study:
1. In-oven annealing: Since when annealing was applied without metal frames, membranes twisted. Detached membrane thin films were placed between wire meshes, which were like thin metal frames, as shown in Figure 3.3. Furthermore, instant temperature changes during removing from evaporation oven, peeling and putting into annealing oven caused twisting of membranes. These metal frames act as a support for membranes throughout annealing process and its frame structure enable the residual solvent evaporation. After evaporation, peeled membranes were immediately put into an oven at 120
oC. Membranes were in-oven annealed at 1 atm for 10 days. In
order to prevent twisting of membranes, they were left cooling in oven until the temperature
21
decreases to room temperature. A desiccator was used to keep the prepared membranes at room temperature.
Even though, metal frames were used, in many cases the final product had a twisted shape. This problem could not been prevented for in-oven annealing process. Consequently, when membranes tried to be placed into membrane module (Figure 3.5), some of them were fractured even before gas permeation testing. Some membranes prepared after a long period could not been used.
A summary of membrane preparation procedure for both membranes types are given in Figure 3.4.
Figure 3.4: Flow chart of the neat PBI and PBI/filler membrane preparation procedure
2. In-line Annealing: Alternatively, in-line annealing was employed on the membranes using the experimental set-up shown in Figure 3.6. The annealing was carried out directly inside the membrane module. In this method membrane removed from evaporation oven was placed into
Polymer:
PBI 2wt.%
Solvent:
DMAc
Magnetic Stirring
Time:48 h, Temperature: 140 C
Casting Solution: PBI/DMAc Dried filler is added
directly (drying T=250oC)
Solvent casting on a Petri Dish
at room temperature
Solvent evaporation under
partially vacuum with N2
Time: 48 h, Temperature: 90C
Pressure: 0.7 atm
In-oven Annealing:
Time: 10 days
Temperature: 120 C
Pressure: 1 atm
In-line Annealing:
Temperature: 90C
Pressure: 3 atm He
(Repeatable application)
Membrane peeling
22
the module. Temperature of the system was set to 90oC. After the system was ready, vacuum was
employed on both permeate and feed sides of the system. Inert, non-interacting helium gas, which has smaller kinetic diameter (0.26 nm) compared to testing gases, was employed as feed gas at 3 atm pressure when the permeate side was at vacuum. During annealing pressure versus time data was collected. After 8 to 12 hours these data was used to calculate the permeability of helium gas. Actually, series of permeation tests were carried out by helium for long periods of time. Annealing was completed when permeations of helium gas were close in two consecutive permeability measurements.
3.3. Membrane Characterization:
3.3.1 Thermal Characterization:
Differential Scanning Calorimeter (DSC) Analysis: Thermal transition behaviors of prepared membranes were recorded on Mettler Toledo DSC 1 STAR System. A piece of membrane was placed into DSC pans and heated from 25
oC to 550
oC at a rate of 10°C/min in N2 purge. Two
consecutive runs were performed. After first heating the samples were quenched to room temperature and reheated to 550
oC. The second run was used to estimate the glass transition
temperatures of membranes via DSC.
Thermal Gravimetric Analysis (TGA) Analysis: Perkin – Elmer Pyris Thermal Gravimetry Analyzer and Mettler Toledo TGA/DCS 1 STAR System were used to determine thermal properties and the amount of entrapped solvent and water within membranes. Small piece of sample was heated from 25
oC to 975
oC at a N2 flow of 10 ml/min ramped at 10
oC/min.
3.3.2 Scanning Electron Microscopy (SEM) Characterization
Two scanning electron microscopes (FEI Quanta-400 F and Leo Supra 35 VP Field Emission SEM) were used to examine the morphology of prepared membranes. Prior to image acquirement, samples were prepared by fracturing the membranes in liquid nitrogen to keep the structure unaltered. Fractured membrane samples were placed in a sample holder by using a carbon tape and coated with gold/palladium while working with FEI Quanta-400 F and coated with carbon while working with Leo Supra 35 VP Field Emission SEM in order to produce a conductive layer. Cross sections of vertically placed membranes were analyzed.
3.3.3 Gas Permeability Measurements
Experimental Set-up
Single gas permeation measurements across the membranes were carried out using the set-ups assembled for flat sheet membranes previously by our research group [74, 75, 101] as given in Figure 3.6. Permeation cell (membrane module) sown in Figure 3.5 has two compartments which are separated by a membrane. A commercial module stainless steel Millipore filter holder (Millipore, part no. XX45 047 00) was utilized throughout the study containing double Viton O-ring seals.
Two different set-ups were used during the study which employs the same operating principle. First set-up was heated by using a wrapped heating tape (Cole Parmer, Barnstead/Thermolyne) having thermocouple to monitor the temperature. The pressure increase in the permeate side was followed by using MKS Baratron (0-100 Torr, 0.01 Torr sensitivity) pressure transducer. The dead-volume which is the volume occupied from the permeate side of the module to the pressure transducer was 22cm
3 [75].
23
In the second set-up heating was provided by placing the membrane module inside a silicone oil filled bath which was on a heater. The bath was insulated in order to keep the temperature at a constant value. A thermocouple was put into the silicone oil bath to measure the temperature. Permeate side pressure increase was measured by pressure transducer (BD Sensors, DMP331, 0.001 bar sensitivity 0–4 bar). The dead-volume was 7.1 cm
3 [74].
For both set-ups membrane module has effective membrane area of 9.6 cm2. Set-ups were
evacuated by using a vacuum pump to degasify the system. (Model E2M5, Edwards High Vacuum Pump)
In-oven annealed membranes (MB1-MB8) were tested by using first set-up and for testing the rest of the membranes second set-up was utilized.
Single gas permeabilities studies were evaluated by hydrogen and carbon dioxide gases having high purities (> 99%). These gases were supplied by OKSAN.
Figure 3.5: Schematic drawing of Millipore Filter holder
Experimental Procedure
Constant volume variable pressure method was utilized. Before a membrane was placed into the module, its average thickness was measured from different point of round cut film by a micrometer. The gas permeation measurements were conducted at 35
oC in the first set-up and
conducted in temperature range of 35-90oC in the second set-up. Both heating and cooling of the
membrane module was carried out at slow rate. Heating and cooling was applied under atmospheric pressure.
In the beginning of the experiments initially, the temperature of the measurement was set to a constant value and after the temperature had reached to the desired value both upstream and downstream compartments of the module and gas tank was evacuated by using a vacuum pump for 1 to 3 hours until a residual gas free membrane was obtained. Then, pressurized gases were fed
Feed
Retentate
Permeate
O-ring
O-ring
24
to the gas tank. Constant volume-variable pressure method relies on maintaining a higher constant pressure of upstream (feed) which was 3 atm in the experiments and measuring the gas flow through the membrane of known area and thickness. The downstream (permeate) side was kept at vacuum in the beginning of the measurements to create a transmembrane pressure difference. By the help of a needle valve the feed was sent to the module. Because of the pressure difference between feed and permeate sides, the gases began to transport through the membrane. Since a dead-end operation was applicable for the system, the gas molecules passing through the membrane was collected at the permeate side. The pressure of the permeate side was evaluated with time and this evaluation was measured by a pressure transducer and recorded via computer. The recorded raw data was put on a permeate pressure versus time plot. The steady state slope of this plot was used to determine the permeability.
The same protocol has been followed for neat and MMMs.
Figure 3.6: Schematic representation of experimental set-ups The thermal stability of the membranes was evaluated by testing gas permeation performance of membranes at different temperatures. In the first set-up the measurements were done in the order of H2 and CO2 at 35
oC and the measurements were repeated for several times until a stable
performance for both gases were achieved. Between two consecutive measurements the system was evacuated but the duration of evacuation was changed according to the time of measurement. After hydrogen tests 1 hour evacuation, after carbon dioxide tests 3 hours of evacuation was applied. In the second set-up the order of the tests was different. Tests were carried out with the same gases for several times until a stable permeation values were obtained for the specific membrane at a constant temperature. Then, the gas was exchanged and same testing protocol was followed. Only after stable permeation rates were calculated for both gases consecutive hydrogen and carbon dioxide measurements were done. If the results were consistent with the previous ones,
H2
CO2
T
Vacuum
Pump
Pressure
Transducer
Constant
Temperature
Utilizer
Membrane
Module
Gas Tank
Computer
25
temperature increased to 50oC, 70
oC and 90
oC slowly and same measurement steps were utilized
at each temperature. Permeability and Selectivity Calculations
After pressure versus experiment time data was obtained the permeabilities, selectivities, and finally, activation energies (Ea) of the experiments were established. Calculation steps for permeabilities were given in detail in previous studies of our group [74-75]. Pressure rise in the permeate side with respect to time were utilized to calculate permeability and selectivity.
Activation energies of the tested gases were obtained by;
(
)
The slope of the graph demonstrated by lnP versus 1/T data gives Ea which is reported in terms of kJ/mol.
26
27
CHAPTER 4
RESULTS AND DISCUSSION
4.1 Membrane Characterization
4.1.1 Visual Characterization
Effect of preparation parameters on the separation performances of membranes have been the focus of many researches [57, 76-83]. Casting solution concentration is one of the important factors which has to be determined carefully in the beginning of the study. Hacarlıoğlu et al. [83] investigated the effect of solution composition on gas permeation performances of polycarbonate membranes by preparing 3, 5, 7, 8.5, 10, 12, 15 w/v % casting solutions. Decline in gas permeations of all tested gases including Ar, CH4, CO2, H2, N2 and O2 were observed via increasing casting solution composition. When gas separation PBI membranes studied in literature were examined, maximum 7 wt.% casting solution was prepared in laboratory conditions [44-47, 63]. In some of the studies, higher concentration solutions were used for casting the membranes, but these solutions were received directly from suppliers [48, 61]. In this study, to elucidate the optimum polymer concentration 2, 5, 10 wt.% concentrations were tried to be prepared by PBI-1. Toward this purpose first 10 wt.% polymer solution was prepared. But, it was realized that stirring and heating under atmospheric conditions were not enough to dissolve this commercial polymer [63, 106-109]. Then it was decided to heat the solution on a hot plate to 100
oC. After 4 days no apparent dissolution was obtained. Even decreasing the
concentration to 5 wt.% was not enough. Besides, because of the high viscosities of these solutions, it was very hard to filter the undissolved polymer via filter paper. As a result the casting solution concentration was lowered to 2 wt.% concentration. Additionally, a new setup was assembled as described in the Section 3.2 to lower the dissolution time and to provide homogeneous heating. But the dissolution problem still continued at this concentration because of the structure of these commercial polymers. Yet low viscosities of the solutions prepared at this concentration provided easier filtration by filter paper. According to these observations in this study membranes were prepared by using 2 wt.% polymer. The viscosity of the solution was low. Therefore, instead of blade casting [71-75], drop casting into a Petri Dish was employed as shown in Figure 3.3. To solve the major dissolution problem, which continues even at 2 wt.% concentration, 1 wt.% LiCl was added to the solvent-polymer mixture and the same solution preparation procedure was followed as described in Section 3.2. The amount of LiCl was adjusted by examining the studies done in literature [106-108]. When LiCl is used, remaining part of the salt should be removed after obtaining the membranes. Washing with hot deionized water was utilized to remove the salt. During washing in hot deionized water, twisting of the membranes were observed. The only reason for twisting may not only be LiCl addition, because throughout the study this problem continued except for LiCl free neat membranes. Moreover, in annealing step twisting was continued. In
28
literature, it was suggested that the minor amount of this material ease the dissolution of PBI by breaking the agglomerated parts and it prevents inter and intramolecular hydrogen bonding using Cl
- ions [106-108]. During the preparation of casting solution after drying the undissolved material,
white salt particles were apparent between undissolved polymer particles. This indicated that LiCl salt did not dissociate into its ions completely to disturb the chain packing of PBI. Remaining salt particles were filtered and further washing by hot deionized water was done to remove all residual salt particles on the membranes. LiCl addition had no significant effect on polymer dissolution. Moreover, by washing and drying very fragile thin films were obtained. Consequently, these thin films could not be used as a membrane and LiCl addition method was eliminated. Another problem which was encountered during casting solution preparation for mixed matrix membrane production was based on the large particle sizes of the fillers. Two different types of fillers were used. Zeolite 3A had average particle size of 5 µm and SAPO-34 had average particle size of 200 nm. 25 wt.% Zeolite 3A and 20 wt.% SAPO-34 was added to the 2 wt.% polymer solutions. The concentration of the polymer solution was low. Consequently, even vigorous stirring was applied before drop casting, precipitation of large particle size filler at the bottom of the Petri Dish during evaporation occurred. This precipitation was visually observed especially for PBI/Zeolite 3A membranes after they were removed from Petri Dish.
Figure 4.1 shows the surface photographs of the in-oven annealed membranes. In Figure 4.1b and Figure 4.1c the twisted parts of the membranes have white bottom side, comprising the zeolite rich phase. But top of the membrane has a brown color, comprising the polymer rich phase. To overcome precipitation, instant heating in oven and casting into a larger Petri Dish were tried. It was thought that by instant heating at high temperature, solvent evaporation would be achieved faster by restraining the precipitation. High temperature exposure provided faster evaporation. But as the viscosity of the solution was increased shrinkage of the solution was evident. Possibly, removal of solvent molecules caused polymer chains to pulled back together and lost flexibility. Finally, a thin film comprising only a small part of the Petri dish was obtained. Thus, stepwise temperature increased was utilized to 90
oC from 60
oC. But employing slow solvent evaporation
increased the process duration and consequently, large zeolite particles precipitated at the bottom of the Petri Dish. Furthermore, larger Petri dish casting was employed to increase the surface for evaporation and to obtain thinner films. Same shrinkage problem was apparent. Eventually, it was decided to increase the casting solution concentration via evaporation on the hot plate before addition of fillers [109]. By this method a casting solution having higher viscosity can be obtained and during solvent evaporation the movement of fillers to the bottom may be decelerated. The PBI solution was concentrated to 8 wt.% and mixed with filler. The solution with filler was cast. A short period of time was enough to produce thin film because most of the solvent was evaporated at
(a) (b) (c)
29
pre-evaporation step. But even this amount of concentrated solution was not sufficient to obtain homogeneous membrane particularly for PBI/Zeolite 3A mixed matrix membrane. The prepared membranes were very fragile after in-oven annealing. The fractures can be seen in Figure 4.1. Metallic frames were used to prevent twisting as shown in Figure 3.3, but membranes still had tendency for bending and twisting after removed from the oven.
Alternatively, in-line annealing method was employed to prevent structural changes during the annealing and to investigate the influence of in-line annealing method on membrane performances. As shown in Figure 4.2 after solvent evaporation the obtained membranes were easier to handle. Possibly, due to softer structure coming from the residual solvent remained in the membranes. As a result, in-line annealed membranes were placed into the membrane module successfully, eliminating the issues occurring because of twisting.
Figure 4.2: In-line annealed (a) Neat PBI membrane, (b) PBI/Zeolite 3A membrane top side, (c) PBI/Zeolite 3A membrane bottom side after solvent evaporation
PBI/SAPO-34 membranes were produced only by using in-line annealing. To surpass the difficulties arisen in PBI/Zeolite 3A membrane production, smaller particle size SAPO-34 was used and the amount of filler was decreased to 20 wt.%. 4.1.2 SEM Characterization
Scanning electron microscopy (SEM) analysis was carried out to investigate the morphology of the MMMs. The SEM images of in-oven and in-line annealed PBI/Zeolite 3A and PBI/SAPO-34 are shown in Figure 4.3 to Figure 4.5 and rest of the micrographs are given in Appendix C. In Figure 4.3 left side image was obtained via carbon coating of the samples and the rest of the samples were gold/palladium coated.
Defects or huge voids were not observed in SEM images, which reveal good polymer-filler interaction. Channel like structures present in Figure 4.3 and Figure 4.3 may come from the elongation of polymer during breaking in nitrogen. Karatay et. al. [71] obtained similar observations in their study. In practice, it is desired to obtain void free structures to obtain a selective membrane.
It is evident from Figure 4.3 and 4.4 that no uniform dispersion of Zeolite 3A was obtained in PBI. Separate zeolite rich layers were observed at the bottom of the membranes and asymmetric membranes were produced. On the right sides images the upper part is the zeolite-free polymer phase and the lower part is zeolite-polymer phase. The reason of this structure could be low evaporation rates as mentioned in Section 4.1.1. Because the final evaporation temperature (90
oC)
(a) (b) (c)
30
is lower than the boiling point of the solvent DMAc (165oC). The evaporation rate may not be
enough to hinder the movement of large zeolite particles inside low viscosity casting solution to the bottom of the Petri dish during evaporation. This may lead to the precipitation of particles at the bottom [111].
Figure 4.3: SEM images of cross section of 25 wt.% loaded in-oven annealed PBI/Zeolite 3A membrane
Figure 4.4: SEM images of cross section of 25 wt.% loaded in-line annealed PBI/Zeolite 3A membrane
31
Phase separated PBI/Zeolite 3A membranes, produced by in-oven annealing, were very fragile and they disintegrated very easily upon handling which was mentioned previously in Section 4.1.1. SEM images in Figure 4.3 and 4.4 give more detailed information about this issue. Flexible polymer matrix was glassified by solvent removal but not the same change was occurred for zeolite phase as a result very fragile and twisted thin films were obtained. They were hard to manage during gas permeation measurements and finally fractured even before placing into the gas permeation set-up. Therefore, only two of the produced in-oven annealed PBI/Zeolite 3A membranes were tested.
Figure 4.5: SEM images of cross section of 20 wt.% loaded in-line annealed PBI/SAPO-34 membrane In the case of SAPO-34 addition a more homogeneous distribution was evident and particles are finely embedded in the polymer matrix (Figure 4.5). Compared to PBI/Zeolite 3A membrane this time well dispersed structure was obtained. But as observed in the figure nano-sized SAPO-34 particles were aggregated to form almost micrometer size particles that were dispersed in the polymer matrix. By examining all SEM images shown in Figure 4.3 to 4.5, it can be said that no visible, huge interfacial voids exist. A better adhesion without any need for incorporation of a compatibilizer was succeeded for both types of MMMs opposite to other studies of our group [71, 72]. 4.1.3 Thermal Analysis Results
Polymer-filler system often has a different glass transition temperature when compared to the neat polymer. By incorporation of filler into the system, improvement in separation properties with a loss in flexibility is expected for MMMs compared to polymeric membranes [12, 71, 99].
In this study DSC analysis initially carried out for polymers PBI-1 and PBI-2. Only the Tg of PBI-2 was obtained as 417
oC. This temperature was determined by taking the second derivative of the DSC
thermogram as shown in Appendix B. Tg of PBI-1 could not be determined. Secondly, Tg of neat PBI and mixed matrix membranes were analyzed. But not reliable results were obtained for both types of membranes. Even neat membranes Tg values deviated from the Tg of the polymer. Solvent molecules entrapped within the polymer chains or in the zeolites possibly caused the deviations.
SAPO-34
Agglomeration
32
Small amount of solvent molecules in the polymer chains may cause plasticization [81] or antiplasticization [80] which in turn results in reduction of Tg by decreasing interchain molecular interactions or elevation of Tg respectively. Furthermore, it was speculated that the temperature range of the analysis may be changed. Because PBI has high Tg and to achieve more clear results higher temperatures may be required. Consequently, the DSC analysis results of the membranes were not discussed.
The solvent or water entrapped in membranes after annealing affects the gas permeation performance. The imprints of solvents left in the structure may influence permeation measurements. In order to characterize the remaining solvent in the structure TGA analysis were performed. The weight losses as a function of temperature are given in Table 4.1 and a representation of thermograms is given in Figure 4.6. Rest of the thermograms of individual membranes are given in Appendix D.
PBI has a Tg of 417oC and a decomposition temperature [50] of 600-630
oC. In Table 4.1 up to 200
oC
the results show that for neat polymeric membranes, weight losses are within the range of 5-6 % but it is higher for PBI/Zeolite 3A and PBI/SAPO-34, which is almost 10 %. Underlying reason of these high values obtained for MMMs may be the hydrophilic structure of the zeolites. The total accumulated weight loss below 200
oC is probably coming from the removal of residual solvent or
water. Both types of annealing gave almost the same results which can be interpreted as efficient solvent removal for different kinds of annealing procedures. Significant weight losses were observed at temperatures between 200
oC to 550
oC for all types of membranes.
Table 4.1: Weight losses of the in-oven and in-line annealed membranes determined by TGA.
Annealing Condition Membrane Type Weight loss up to
200°C, (%) Weight loss up between
200- 550°C, (%)
In-oven annealed PBI 5.7 13.3
PBI/Zeolite 3A 6.8 12.3
In-line annealed
PBI 5.5 15.7
PBI/Zeolite 3A 9.8 13.6
PBI/SAPO-34 8.5 10.5
Mixed matrix membranes weight losses are slightly higher than neat membranes regardless of annealing type. For neat membranes weight losses have similar trends. This may be attributed to higher efficiency of solvent evaporation and annealing for neat membranes. In mixed matrix membrane case possible interface creation between polymer and zeolites were occurred. Extra surfaces were created by zeolite addition. Hence solvent and water could be adsorbed by these surfaces or entrapped within the zeolites [74]. Total weight losses of in-line annealed mixed matrix membranes up to 550
oC are slightly higher when compared to in-oven ones. Both time and
temperature of in-line annealing was lower compared to in-oven annealing. The small variations may indicate that solvent removal was achieved slightly better for in-oven annealing.
Effect of the remaining solvent on the gas permeation performance of polymeric membranes was the subject of many studies, usually in accordance with the membrane preparation conditions [47, 81-85]. The studies show that the amount of residual solvent in the membranes influences the performance of membranes. Complete removal of the remaining solvent is crucial to obtain the absolute performance of the prepared membranes. The gas permeation performance depends on the preparation method [47, 85].
4.2 Effects of Preparation Methodology and Annealing on Membranes Performances
Membrane preparation conditions have paramount importance on determining the performance of a membrane. The effect of these parameters should be investigated to obtain membranes which can operate at desired conditions. Many researchers investigated the influence of these parameters on the membrane performance including the effect of residual solvent [79-82, 86].
In this study all membranes were prepared via solvent evaporation method using a casting solution of 2 w/w % polymer/solvent because of aforementioned solubility problem. The membranes were evaporated at 90
oC, in 0.7 atm N2 environment for 48 hours. The temperature of the oven was
increased from 60oC to 90
oC slowly. Furthermore, rising temperature caused more solvent
evaporation which in turn increased the pressure in the oven. To keep the pressure at a constant value the system was evacuated during evaporation every 1.5 hour prior to temperature increase. The temperature and pressure of the operation was chosen by considering the boiling point of DMAc at that pressure (TBP, 0.7 atm = 153
oC, Appendix F). Otherwise, it was thought that evaporation
at a temperature close to the boiling point may cause bubbling of solvent and results in defects on the membrane.
During gas permeation measurements hydrogen was always the first gas utilized and carbon dioxide tests were done following hydrogen tests. The pressure of permeate side elevated steadily
60
70
80
90
100
0 50 100 150 200 250 300 350 400 450 500 550
We
igh
t lo
ss(%
)
Temperature(oC)
In-oven annealed dense membrane
In-oven annealed PBI/Zeolite 3A membrane
In-line annealed dense membrane
In-line annealed PBI/Zeolite 3A membrane
In-line annealed PBI/SAPO-34 membranes
34
for all gases. The time of the experiment varied according to the gases, system volume and membrane type. Hydrogen which is a small kinetic diameter gas compared to carbon dioxide was always faster. As shown on Figure 4.7 the experiment time was lower for this particular gas.
Figure 4.7: Pressure increase in the permeate side with time for neat PBI membrane
Permeabilities were evaluated by using the collected data via computer. The data was plotted on a pressure vs. time graph as shown in Figure 4.7. The straight line region of the slope, which was calculated by linear regression method, was used to evaluate permeabilities [37, 71-74].
Figure 4.7 represents a typical trend of single gas measurement for neat PBI membranes. As denoted in this figure in the beginning of the experiment when the time is equal to zero, permeation starts. But there is a certain time interval for carbon dioxide to travel from feed to permeate because of solution–diffusion mechanism. The trend shown in the Figure 4.7 is in agreement with the literature [37, 71-74]. The diffusion of bulkier carbon dioxide molecules in the membranes require more time compared to hydrogen. Hydrogen diffusion almost began immediately [73, 100].
Between two consecutive experiments the system was evacuated to make sure that the membrane is free of the tested gas. The duration of evacuation was changed according to the gas tested which was decided after a few gas permeation experiments. Membranes need more evacuation following carbon dioxide test, which is more condensable gas in the study. After hydrogen tests one hour evacuation was enough on the other hand, after carbon dioxide tests minimum 3 hour evacuation was required. This interval of evacuation was decided by monitoring the pressure increase after evacuation. Instead of instant gas permeation testing, system was left at vacuum for almost one hour and the degree of pressure elevation was followed. If sharp increase was observed the duration of evacuation was increased.
During membrane preparation high temperature heat treatment after solvent casting was employed on membranes to obtain the selective thin films. However, solvent molecules entrapped within the structure of the membranes cannot be removed completely. Even a very small amount of remaining solvent might change the performance of a membrane during gas permeation experiments [80, 81]. The solvent entrapped inside the membranes might be a governing factor in
0
10
20
30
40
50
60
70
0 5000 10000 15000 20000 25000 30000 35000 40000
Pre
ssu
re (
mm
Hg)
Time (min)
Carbon dioxide
Hydrogen
35
gas transport properties of membranes. Therefore, additional heat treatment called annealing was applied on membranes to extract the residual solvent.
Table 4.2: In-oven annealing conditions for some of the PBI membranes studied in literature
Reference Membranes Operation Conditions Duration of operation
Sadeghi et al.[63] PBI 100oC 24 hours
Pesiri et al. [44,45] PBI 150oC 15 minutes
Kumbharkar et al.
[39] PBI (N-substituted) 100
oC under vacuum 7 days
Choi et al. [61] PBI, PBI/nanoporous
silicate
50oC to 280
oC in
cyclic manner for four
times
-
Within the scope of this study two different types of annealing were adopted namely in-oven and in-line annealing respectively. In-oven annealing is an operation applied on the membranes in a vacuum oven at elevated temperatures. The prepared membranes regardless of its type were placed in a vacuum oven after evaporation and annealed in nitrogen atmosphere at 120
oC, 0.7 bar.
Oral et al. [74] studied the effect of post annealing on PES/SAPO-34 membranes. The membranes annealed at 120
oC, 0.2 bar for 24 hours. However, these membranes have lower reproducibilities.
Then an additional heat treatment was applied on membranes for 7 days again at 120oC and 0.2
bar. Post-annealing at high temperature for longer durations improved the performances and also stable membranes performances were obtained. For a comparison Table 4.2 depicts examples for in-oven annealed PBI membrane from the literature. The membranes usually annealed at high temperatures. Therefore, in this study the membranes were annealed for 10 days at 120
oC in the
oven.
In industrial applications membranes should show stable performances at particular operating conditions. Hence, it is essential to study the repeatability of the gas permeation performances and reproducibility of membrane manufacturing in the study.
According to aforementioned aim in this study, the reproducibility and repeatability of membranes were tested by using the membranes prepared by same preparation methodology and keeping all the experimental parameters of gas permeation measurements constant.
Table 4.3 gives the permeability and ideal selectivity results for in-oven annealed neat PBI and PBI/Zeolite 3A membranes tested at 35
oC. The data of gas permeation measurements of all tested
membranes are tabulated in Appendix E. Membranes were tested in the order of hydrogen and carbon dioxide consecutively. The differences between the first and later runs are evident at Table 4.3. The results depicted that usually, the first gas permeability measurement for both gases, especially for hydrogen, were lower than later measurements. But the standard deviations are low. After first run the performance of the membranes were stabilized and repeatable results were obtained. This may come from the trace amount of solvent entrapped in the membrane structure [80, 81] or instable membrane structure even after annealing. When all gas permeation results are examined these inferences were corroborated. Later gas permeation runs are more consistent with each other especially for neat PBI membrane (2) and PBI/Zeolite 3A membrane (1). Densification after solvent removal may cause stiffness in polymer chains and retarded segmental motions. Moreover, the difference in the consecutive gas permeation tests could be a result of nonuniform densification of membranes during in–oven annealing. This problem causes uneven thicknesses throughout produced membranes. Average values for membrane thicknesses given in table were
36
calculated by measuring the thicknesses at different parts of the round cut membranes. Consequently, eliminating the first gas permeation runs when working with in-oven annealed membranes, were found to be advantageous.
Table 4.3: Repeatability results of the in-oven annealed neat PBI and PBI/Zeolite 3A membranes tested at 35
oC
In oven annealed membranes, although same casting methods were followed, regardless of the membrane type, they showed not very stable performances. In order to overcome repeatability and reproducibility problems in-line annealing was employed.
In-line annealing is a process where membranes are annealed in the experimental set-up shown in Figure 3.6. After solvent evaporation the membranes were placed in the experimental set-up for annealing using non-interacting helium gas at 90
oC.The period of process with helium is shown in
Figure 4.8 as a pressure versus time graph. ‘V’ indicates the evacuation interval. To make sure that the annealing was completed many successive test runs for extended periods of time were done with helium gas. Since, it is possible to expect the time dependency of permeation of helium throughout the membranes containing remaining solvent. This is the result of slow leaching of the
Membrane Run H2 permeability CO2 permeability Ideal
remaining solvent using a gas [84]. The permeability of each run was calculated using the slope of every curve by linear regression method. Longer periods of time in the figure indicate the permeation during night.
Figure 4.8: In-line annealing operation period at 90oC
The calculated slopes of the curves in Figure 4.8 were given in Table 4.4. The slopes of the curves for particular neat membrane increased in the first three runs which depicts the removal of solvent by helium transport through the membrane. During these runs a competitive transport of remaining solvent and helium gas is evident. The increase in slopes depended on the release of residual solvent. After third run almost same slopes were obtained meaning the fulfillment of the annealing process. So, gas permeation measurements were utilized.
Table 4.4: Slopes of the curves given in Figure 4.8
Slope Values
α1 7.50E-05
α2 7.72E-05
α3 7.79E-05
α4 7.79E-05
α5 7.81E-05
Using in-line annealed membranes H2permeation tests were done for several times until close permeability values obtained for successive measurements as shown in Table 4.5. When the results were consistent CO2 gas was utilized for several times. After obtaining close permeability results for both gases, one more test in the order of hydrogen and carbon dioxide was done to ensure the repeatability of the results.
38
Table 4.5: Repeatability results of the in-line annealed neat PBI, PBI/Zeolite 3A, PBI/SAPO-34 membranes tested at 35
oC
Using in-line annealed membranes H2 permeation tests were done for several times until close permeability values obtained for successive measurements as shown in Table 4.5. When the results were consistent CO2 tests were utilized for several times. After obtaining close permeability results for both gases, one more test in the order of hydrogen and carbon dioxide was done to ensure the repeatability of the results.
In-line annealing was utilized for neat PBI, PBI/Zeolite 3A and PBI/SAPO-34 membranes. In the Table 4.5 permeability results are given. It is very easy to observe the stability of the
Run
H2 permeability
Run CO2 permeability Ideal
Selectivity
Neat PBI membrane (avg. thickness= 75
µm)
1 7.59
2 7.54
3 7.90
4 7.85 1 3.34 2.35
2 3.31
3 3.37
4 3.40
5 3.42
5 7.79 6 3.32 2.32
6 7.92 7 3.40 2.33
Avg. 7.77 Avg. 3.37 2.31
Std. deviati
on 0.11
Std. deviation
0.04 0.01
PBI /SAPO-34 membrane
(avg. thickness=85 µm)
1 8.2
2 8.04 1 2.52 3.2
2 2.68 2.91
3 7.8
3 2.57 3.04
Avg. 8.01 Avg. 2.59 3.09
Std. deviati
on 0.20
Std. deviation
0.08 0.15
PBI/Zeolite 3A Membrane
(avg. thickness=90 µm)
7.81 7.65
2.74 2.79
3.02
7.61
3.00 2.54
Avg. 7.69 Avg. 2.92 2.63
Std. deviati
on 0.11
Std. deviation
0.16 0.18
39
measurements. Consecutive gas permeations of the gases were almost equal to each other. Many runs with the same gas were utilized and low standard deviation from average permeations and ideal selectivity values were calculated. In literature there is one another study done by Kruczek and co-workers [84] using in-line annealed membranes. They in-line annealed their sulfonated polyphenylene oxide membranes by using CO2 gas and measured the permeabilities of nitrogen, oxygen, methane and carbon dioxide. Average permeabilities and standard deviations were reported by using the results of three membranes of one kind. The low standard deviation values indicate the repeatability of the measurements. In this study, the performance results indicate erasing the thermal history and suppressing the stress on the membranes were accomplished by in-line annealing. Furthermore, one other problem which would have arisen was the thickness determination. Because after evaporation the obtained membranes still contains some solvent inside them which makes them considered as wet. The final dry membrane thickness would deviate from the initial value [84]. But not a significant difference was observed in our case. Stable and repeatable performances were succeeded and reproducible membranes were obtained by in-line annealing regardless of membrane type.
Table 4.6: Comparison of in oven and in line annealed neat PBI and PBI/Zeolite 3A mixed matrix membranes at 35
oC
Annealing Type Membrane Type H2 permeability
(Barrer)
CO2 permeability
(Barrer)
H2/CO2
selectivity
In-oven Neat PBI
5.16 0.83 6.21
In-line 7.77 3.37 2.31
In-oven PBI/Zeolite 3A
5.55 1.00 5.55
In-line 7.69 2.92 2.63
To compare the gas separation performance results of membranes Table 4.6 was prepared by using average gas permeability ideal selectivities. This table represents the performance values for both neat PBI and PBI/Zeolite 3A membranes at 35
oC. The permeabilities and selectivities of in-line
annealed membranes are quite different from in-oven annealed membranes. The permeabilities were enhanced conversely; selectivities were decreased by switching the annealing type.
When Robeson upper bound line examined, which is shown in Figure 2.3, to reach industrially attractive region the ideal case is moving in the direction of the arrow by improving both selectivity and permeability. But alternatively, it can be reached by either increasing the permeability or selectivity. In our case by applying in-line annealing permeabilities for both types of membranes were increased, meaning an approach to the upper bound line from horizontal direction was applied as shown in Figure 4.9. The upper bound line was drawn by using data in the article of Robeson [115]. The influence of annealing type is more evident for neat PBI membranes; carbon dioxide permeability was increased by almost four fold along with a decline in ideal selectivity. Same results are applicable for PBI/Zeolite 3A membrane; in this case almost 3 fold permeability increase for carbon dioxide is apparent. The loss in selectivity and enhancement of permeability could be attributed to the structural changes occurring during in-line annealing. Chang and co-workers simulated the molecular motion changes with the temperature on polyimide membranes. They concluded that at elevated temperatures as the remaining solvent decreases, thermal motions of the chains were altered [102]. In this study at 90
oC, by inert helium permeation, the
chains of the polymer may be reorganized and the performance results could be the result of increase of free volume created by helium. Furthermore, improvement in carbon dioxide permeability may support this claim. Eventually, changing annealing type had positive influence on membrane performances.
40
Figure 4.9: Representation of permeability and selectivity data on Robeson upper bound line at 35
oC
Table 4.7: The hydrogen permeabilities and ideal selectivities of the PBI membranes studied in literature
Referance Membranes T (oC) H2 permeability Ideal Selectivity
Tsapatsis et al.
[61]
PBI (1) 35 3.0 12
PBI (2) 35 1.5 15
Lee et al. [41] PBI (Thermally
Rearranged) 23 1400 1.1
Young et al.
[52] PBI(Crosslinked) 23 11.2 16
Berhtold et. Al.
[48]
PBI/ stainless
steel composite 250 4.67 43
Table 4.7 gives information about the PBI membranes studied in literature for hydrogen and carbon dioxide separation [41, 48, 52, 61]. The structures and preparation methodologies of the membranes are different from our study. The influences of these differences are evident on the performance results. Tsapatsis et al. [61] obtained the highest selectivity for H2/CO2 separation as 14 at 35
oC by using membranes prepared via 20 wt.% casting solution. The prepared mixed matrix
membranes gave almost four times higher selectivities than our membranes. In their study, they investigated the preparation conditions including casting surface, casting solution concentration and evaporation conditions. In the study they compare their gas permeation results of neat PBI
0.1
1
10
100
1000
0.01 0.1 1 10 100 1000
α (
H2/
CO
2)
H2 Permeability
In-oven annealed
Dense Membrane
PBI/Zeolite 3A
In-line annealed
Dense Membrane
PBI/SAPO-34
PBI/Zeolite 3A
41
membranes with literature [52, 114]. Differences in both permeabilities and selectivities were evident. The different casting surfaces and evaporation conditions are considered to be the reason behind these differences. They mentioned that up to one order of magnitude difference may occur according to the evaporation temperature and casting surface. In the Table 4.7 neat membranes indicated as PBI (1) and PBI (2) showed different gas permeation results. Room temperature dried membrane PBI (1) permeability is almost 2 fold higher than 80
oC dried PBI (2) membrane.
Furthermore, by crosslinking the polymer a closer structure can be obtained and as a result formed membranes can have a denser structure. The reason of the better performance can be attributed to this denser membrane [52]. In another study done by Berhtold et al. [48] PBI composite membranes were prepared. In order to obtain the performance of the membranes high temperature permeability measurements were employed. They claimed that they produced a membrane which has a performance in the industrially attractive region of the Robeson trade-off line [53].
Table 4.8: The average permeabilities and ideal selectivities of in-oven and in-line the neat PBI and mixed matrix membranes at 35
oC
Annealing Type Membrane Type H2 permeability
(Barrer)
CO2 permeability
(Barrer)
H2/CO2
selectivity
In-oven Neat PBI 5.16 0.83 6.21
PBI/Zeolite 3A 5.55 1.00 5.55
In-line
Neat PBI 7.77 3.37 2.31
PBI/Zeolite 3A 7.69 2.92 2.63
PBI/SAPO-34 8.01 2.59 3.09
Effect of filler on both in-line and in-oven annealed membranes were investigated. Table 4.8 gives the average performance results for neat PBI and mixed matrix membranes. As can be seen from the table incorporation of large particle size Zeolite 3A into the polymer matrix increased the gas permeabilities of in-oven annealed membranes along with a slight loss in selectivity. But opposite trend was observed for in-line annealed membrane. As evident from the SEM image given in Figure 4.3 and Figure 4.4 the precipitation of Zeolite 3A particles produce a different phase and the particles acted as a separate layer. In this case permeabilities were expected to increase as the sieving effect may be dominant at the bottom of the membrane and gas transport may have facilitated. Possibly, partial blockage of zeolite particles by polymer chains in the zeolite-polymer phase caused only a slight change in gas permeation performances. But, in the case of PBI/SAPO-34 membrane improvement in both hydrogen permeability and selectivity were provided. SEM images given in Figure 4.5 indicated embedded SAPO-34 particles throughout the cross-section of the polymer. Smaller zeolite particles enables more interface between polymer and particle, hence improve the performance [12]. Yet accumulated SAPO-34 particles were observed which may have decreased the amount of desired interfaces and as a results slight improvement in permeabilities was achieved especially for hydrogen. Eventually, the transport of carbon dioxide retarded. The improvement in the performance of membranes by addition of SAPO-34 can be interpreted as creation of more tortuous pathways for gases. When effect of different filler type is considered SAPO-34 addition was more advantageous.
Aforementioned studies refers that polymer state inside the membrane is fundamentally related to the amount of remaining solvent in the membrane structure. TGA results shown in Figure 4.6 revealed good solvent removal for all membranes. Moreover, it is clear that solvent extraction depends on the annealing type, time and temperature. Therefore, it is fundamental to obtain the
42
optimum annealing conditions for prepared membranes to achieve desired gas permeation performance.
Depending on the above stated and obtained results, it can be said that our results are consistent with the literature. Choosing the suitable remaining solvent removal method, annealing, has fundamental effect on membrane gas permeation performance. Furthermore, different annealing methods influence the repeatability and reproducibility of membranes performances. Therefore, it was found that if required it is essential to change the annealing methodology. By the addition of filler the gas permeation performances were changed slightly, but it was more pronounced for in-line annealed PBI/SAPO-34 membrane. Throughout the study the best performances were obtained by using PBI/SAPO-34 membrane as shown in Table 4.5 and Figure 4.9.
4.3 Effect of Operating Temperature on Membranes Performances
Since industrial scale hydrogen and carbon dioxide separation occurs at elevated temperatures it is crucial to purify hydrogen at high temperatures to provide an integration of membranes into the system with minimum temperature penalty. The effect of operating temperatures on in-line annealed membranes was investigated by changing the temperature from 35
oC to 90
oC by using in-
line annealed membranes.
Temperature was used as tool for optimizing the membrane performance. The gas measurements were done in the order of hydrogen and carbon dioxide throughout the tests at 35
oC, 50
oC, 70
oC
and 90oC using in-line annealed membranes. When the repeatability of results was evident at one
temperature as represented in Table 4.9, further temperature increase was applied. The data of all gas permeation measurements for all in-line annealed membranes were given in Appendix E.
Table 4.9: Gas permeation performance of in line annealed neat membranes at 35oC
Membrane Run H2
permeability Run CO2 permeability
Ideal
Selectivity
Neat PBI membrane
1 10.09
2 9.49
3 9.53
1 4.01
2 4.19
3 4.05
4 9.33 4 3.95 2.36
5 9.51 5 3.88 2.45
According to the purpose the performances of neat PBI membranes were investigated. Figure 4.10 and 4.11 represents the permeabilities and selectivities of the given polymers at different temperatures respectively. Both figures have increasing trends for permeation rate and ideal selectivity. These results are consistent with the literature [27, 48, 111]. It is believed that for polymeric membranes solution-diffusion mechanism is applicable when talking about gas permeation. In glassy polymers relative to solubility mechanism diffusivity mechanism is more altered by temperature increase due to increased chain motion and associated kinetic phenomena [44, 110]. Therefore, smaller molecule hydrogen gas permeability is found to be more influenced from the temperature [110]. Rowe et al. [113] experienced the same results in their study. Furthermore, Pesiri et al. [44] increased the operating temperature up to 340
oC. For single gas
permeation measurements same behaviors was observed as our study.
43
Figure 4.10: Effect of operation temperature on permeabilities of in-line annealed neat PBI membranes
Figure 4.11: Effect of temperature on the ideal selectivity H2/CO2 of in-line annealed neat PBI membranes
Same gas permeation measurement method was followed for mixed matrix membranes. Figure 4.12 to Figure 4.15 represents the permeabilities and ideal selectivity data for PBI/Zeolite 3A and PBI/SAPO 34 membranes. By increasing temperature both permeabilities and selectivities were increased for all types of membranes. Diffusivity of gases shows an inverse trend to the size of the gas. Hence, in order to obtain a hydrogen selective membrane the dominant mechanism in the polymers should be diffusivity, which in turn act as a molecular size sieve [48]. Addition of both zeolites improved the gas permeation performance slightly by altering the size sieving mechanism.
The gas permeation results indicated no mismatch between two phases. On the contrary, Choi et al. [61] observed an opposite trend for PBI/silicalite membrane gas permeation performance. At higher temperatures, especially higher than 100
oC, decline in mixed matrix membranes
performance was obtained. This was attributed to the mismatch between two phases. In our case
0.0
5.0
10.0
15.0
20.0
25.0
35 50 70 90
Pe
rme
abili
ty (
Bar
rer)
T(°C)
H2
CO2
2.2
2.4
2.6
2.8
3
3.2
0 20 40 60 80 100
Ide
al s
ele
ctiv
ity
T(°C)
44
PBI/SAPO-34 membrane which has a more homogeneous structure possessed better performance compared to both neat and PBI/Zeolite 3A membrane.
Table 4.10: Gas permeation performance of in-line annealed neat PBI and mixed matrix membranes at 90
oC
Membrane type H2 permeability CO2 permeability Ideal Selectivity
Since solubility and diffusivity gives different trends toward temperature, it is crucial to study membranes at higher temperatures. Table 4.10 contains the average performance results of neat PBI and mixed matrix membranes at 90
oC. Addition of fillers provided a better performance by
especially increasing the permeability of hydrogen. When the results in Table 4.10 compared with results in Table 4.3 which were performed at 35
oC, influence of temperature especially on
hydrogen gas can be recognized easily. These results indicate the positive effect of temperature on the diffusive mechanism of the dominant gas, hydrogen. When all in-line annealed membranes are compared PBI/SAPO-34 membrane gives the best results, by letting more hydrogen permeability and surpassing the carbon dioxide permeability to some extent.
Figure 4.12: Effect of operation temperature on permeabilities of in-line annealed PBI/SAPO-34 membrane
0.0
5.0
10.0
15.0
20.0
25.0
30.0
35 50 70 90
Pe
rme
abili
ty (
Bar
rer)
T(°C)
H2
CO2
H2
CO2
45
Figure 4.13: Effect of temperature on the ideal selectivity H2/CO2 of in-line annealed PBI/SAPO-34 membrane
Figure 4.14: Effect of operation temperature on permeabilities of in-line annealed PBI/Zeolite 3A membrane
Figure 4.15: Effect of temperature on the ideal selectivity of H2/CO2 in-line annealed PBI/Zeolite 3A membranes
2.20
2.40
2.60
2.80
3.00
3.20
0 20 40 60 80 100
Ide
al s
elc
tivi
ty
T(°C)
0.0
5.0
10.0
15.0
20.0
25.0
30.0
35 50 70 90
Pe
rme
abili
ty (
bar
rer)
T(°C)
H2
CO2
2.20
2.40
2.60
2.80
3.00
3.20
0 20 40 60 80 100
İde
al s
ele
ctiv
ity
T(°C)
46
Same trends obtained for both gas permeabilities and selectivities for in-oven annealed membranes at 90
oC as in-line annealed membranes as indicated in Table 4.11. Hydrogen and
carbon dioxide permeabilities are increased. But it is more apparent for hydrogen which in turn enhanced the ideal selectivity of the PBI/Zeolite 3A membrane.
Table 4.11: Effect of operation temperature on permeabilities of in-oven annealed PBI/Zeolite 3A membranes
Temperature H2 permeability CO2 permeability Ideal
Selectivity
35oC 4.06 0.70 5.82
90oC 12.19 1.91 6.38
Temperature dependent permeation of a gas can be defined by using an Arrhenius type equation. The temperature dependent permeation rates were plot as shown in Figures 4.14 and 4.15. The activation energies of the particular gases were calculated and tabulated at Table 4.12.
Figure 4.16: Activation energy lines for in line annealed neat PBI membarane
For all kinds of membranes activation energies showed Arrhenius behavior which is evident when regression values are examined. Pesiri et al. [44] obtained similar results. However, at higher temperature hydrogen permeability became offset by selectivity especially, temperatures higher than 300
oC. Because they suggested that carbon dioxide permeation could have been dominant at
higher temperatures. Berchtold et al. [48] tested produced PBI composite membranes temperatures up to 250
oC. Within temperature ranges studied the consistent gas transport
mechanism was diffusivity and Arrhenius type of behavior was pronounced.
In a study of our group done by Oral et. al. [74] investigated the effect of temperature on the activation energies of H2, CO2 and CH4 by using PES based membranes. The highest kinetic energy was found for methane which has the kinetic diameter and the lowest activation energy was found for carbon dioxide which is the more condensable gas for all types of membranes studied.
In this study highest activation energies are obtained for hydrogen which means this gas is more influenced by increasing temperature as demonstrated previously by gas permeation experiments. The lowest value belongs to more condensable gas carbon dioxide. The selectivity decrease with rising temperature can be attributed to the decline in solubility of carbon dioxide gas as a function of temperature. Higher activation energy values for mixed matrix membranes shows that these membranes are more sensitive to the temperature change [81, 82]. PBI/SAPO-34 membrane was the most temperature sensitive membrane according to the activation energies.
49
CHAPTER 5
CONCLUSIONS
In this study, the dependence of gas transport to temperature and annealing methodology were investigated. The following conclusions were extracted:
1. Solution casting concentration should be determined carefully.
2. Annealing type has a great influence on the membranes. To obtain consistent gas permeation results membranes should be in-line annealed.
3. It is been known that working at high temperatures is more advantageous for hydrogen and carbon dioxide separation. As the temperatures elevated the permeabilities of both gases increased. But hydrogen was the dominant gas in permeation in high temperatures which was indicated by the improved selectivity for H2/CO2.
4. All types of membranes including neat PBI, PBI/Zeolite 3A and PBI/ SAPO-34 membranes resisted up to 90
oC. PBI/SAPO-34 membrane has higher separation performance at each
temperature and can resist up to 90 °C without any change in gas separation performance.
5. Working with smaller particle sized particles improved the performance of the membranes as a result of more homogeneous distribution.
6. Among all types of membranes PBI/SAPO-34 mixed matrix membranes had the highest activation energies. Furthermore, hydrogen had the highest activation energy regardless of membrane type.
50
51
REFERENCES
[1] Energy Information Administration (EIA), Annual energy review 2005, Accessed December 12, 2006
[2] Lattin, W.C., Utgikar, V.P., “Transition to hydrogen economy in the United States: A 2006 status report”, International Journal of Hydrogen Energy, 32, 2007, p.3230-3237.
[3] Turner, J.A., “A realizable renewable energy future” Science, 285, 1999, p. 687-689.
[4] Marbán ,G., Valdés-Solís, T., “Towards the hydrogen economy?”, International Journal of Hydrogen Energy, 32, 2007, p. 1625-1637.
[5] Lipman, T.E., “What will power the hydrogen economy?”, Analysis and report prepared for the Natural Resources Defense Council. Publication No. UCD-ITS-RR-04-10, University of California, 2004.
[6] Balat, M., “Potential importance of hydrogen as a future solution to environmental and transportation problems”, International Journal of Hydrogen Energy, 33, 2008, p. 4013-4029.
[7] Shao, L., Low, B.T., Chung, T., Greenberg, A.R., “Polymeric membranes for the hydrogen economy: Contemporary approaches and prospects for the future”, Journal of Membrane Science, 327, 2009, p. 18-31.
[8] Cui, Z.F., Muralidhara, H. S., “Membrane Technology: A Practical Guide to Membrane Technology and Applications in Food and Bioprocessing”, 1
st edition, 2010, United States of
America
[9] Howell, J.A., “The Membrane Alternative Energy Implications for Industry”, Report Number 21, London and New York, p. 79-80. [10] Phair, J.W., Badwal, S.P.S., “Materials for separation membranes in hydrogen and oxygen production and future power generation”, Science and Technology of Advanced Materials, 7, 2006, p. 792–805.
[11] Liu, C., Kulprathipanja, S., Hillock, A.M.W., Husain, S., Koros, W.J., “Chapter 30, Recent process in Mixed Matrix Membranes”, Advanced Membrane Technology and Applications, John Wiley & Sons, 2008. [12] Chung, T.S., Jiang, L.Y., Lia, Y., Kulprathipanja, S., “Mixed matrix membranes (MMMs) comprising organic polymers with dispersed inorganic fillers for gas separation”, Progress in Polymer Science, 32, 2007, p. 483–507 [13] Scott, K., “Handbook of industrial membranes” Elsevier Science Publishers, 1
st edition,
1995.
[14] Noble, R.D., Stern, S.A., “Membrane separation technology principles and applications, membrane science and technology series 2”, Elsevier Science Publishers, 1995, p. 590.
52
[15] Christopher, K., Dimitrios, R., “A review on energy comparison of hydrogen production methods from renewable energy sources”, Energy & Environmental Science, Energy and Environmental Science, 5, 2012, p. 6640.
[16] Janusz, O., Chmielniak, T., Janusz-Szymanska, K., “The influence of membrane CO2 separation on the efficiency of a coal-fired power plant”, Energy, 35, 2009 p. 841-850.
[17] Ebner, A.D., Ritter, J.A., “State-of-the-art Adsorption and Membrane Separation Processes for Carbon Dioxide Production from carbon Dioxide Emitting Industries”, Separation Science and Technology, 44, 2009 p. 1273-1421.
[18] Patel, N.P., Miller, A.C., Spontak, R.J., “Highly CO2-Permeable and Selective Polymer Nanocomposite Membranes”, Advanced Materials, 15, p. 729-733.
[19] Ritter, J.A., Ebner, A.D., “State-of-the-art Adsorption and Membrane Separation Processes for Hydrogen Production in the Chemical and Petrochemical Industries”, Separation Science and Technology, 42, 2007, p. 1123-1193.
[20] Muradav, N., “Hydrogen via methane decomposition: an application for decarbonization of fossil fuels”, International Journal of Hydrogen Energy, 26, 2001, p. 1165-1175.
[21] Ockwig, N.W., Nenoff, T.M., “Membranes for hydrogen separation”, Chemical Reviews, 107, 2007, p. 4078-4110.
[22] Mulder, M., “Basic Principles of Membrane Technology”, Kluwer Academic Publishers, Second Edition, 1997, Dordrecht.
[23] Winston W.S., Kamalesh, H., Sirkar, K., “Membrane Handbook”, Chapman Hall, 1992, p. 19.
[24] Moore, T.T, Damle, S., Wallace, D., Koros, W.J., “The Engineering Handbook”, 2nd
edition, CRC Press LLC, 2005.
[25] Osada, Y., Nakagawa, T., “Membrane Science and Technology”, Marcel Dekker, 1992, p. 242.
[26] Yampolskii Y., Freeman, B.D., Pinnau, I., “Transport of Gases and Vapors in Glassy and Rubbery polymers”, Materials Science of Membranes for Gas and Vapor Separation, 2006.
[27] Duthie, X., Kentish, S., Powell, C., Nagai, K., Qiao, G., Stevens, G., “Operating temperature effects on the plasticization of polyimide gas separation membranes”, Journal of Membrane Science, 294, 2007, p. 40-49.
[28] Bernardo, P., Drioli, E., Golemme, G., “Membrane Gas Separation: A review/state of the Art”, Industrial and Engineering Chemistry Research, 2009, 48, p. 4638-4663.
[29] Abetz, V., Brinkmann, T., Dijkstra, M., Ebert, K., Fritsch, D., Ohlrogge, K., “Developments in membrane research: from material via process design to industrial application”, Advanced Engineering. Materials, 8, 2006, p. 328-358.
[30] U.S. Department of Energy, Small Business Innovation Research Program and Small Business Technology Transfer Program FY 2005 Solicitations, Technical Topic Descriptions, 15, Materials Research, Office of Fossil Energy, 2005.
53
[31] Li, Y., Chung, T.S., “Highly selective sulfonated polyethersulfone (SPES)-based membranes with transition metal counterions for hydrogen recovery and natural gas separation”, Journal of Membrane Science, 308, 2008, p. 128-135.
[32] Orme C.J., Stone M.L., Benson M.T. and Peterson E.S., “Testing of polymer membranes for the selective permeability of hydrogen”, Separation Science and Technology, 38 (12&13), 2003, p. 3225-3238.
[33] Xu, Z.K., Dannenberg, C., Springer, J., Banerjee, S., Maier, G., “Gas separation properties of polymers containing fluorene moieties”, Chemistry of Materials, 14, 2002, p. 3271-3276.
[34] Tin, P.S, Chung, T.S, Liu Y, Wang, R., Liu, S.L, Pramoda, K.P., “Effect of crosslinking modification on gas separation performance of Matrimid membranes”, Journal of Membrane Science, 225, 2003.
[35] Smaihi, M., Schrotter, J.C., Lesimple, C., Prevost, I, Guizard, C.,“Gas separation properties of hybrid imide-siloxane copolymers with various silica contents”, Journal of Membrane Science, 161, 1999, p. 157-170.
[36] Hosseini, S.S., Teoh, M.M., Chung, T.S., “Hydrogen separation and purification in membranes of miscible polymer blends with interpenetration networks”, Polymer, 49, 2008, p. 1594-1603.
[37] Şen, D., Kalıpçılar, H., Yılmaz, L., “Development of Polycarbonate Based zeolite 4A filled mixed matrix gas separation membranes”, Journal of Membrane Science, 303, 2007, p. 194-203.
[38] Chung, T.S., “A Critical Review of Polybenzimidazoles: Historical Development and Future R&D”, Journal of membrane science, C 37(2), 1997, p. 277-301.
[39] Kumbharkar, S.C., Islam, M.N., Potrekar, R.A., Kharul, U.K., “Variation in acid moiety of polybenzimidazoles: investigation of physico-chemical properties towards their applicability as proton exchange and gas separation membrane materials”, Polymer, 50, 2009, p. 1403-1413.
[40] Li, Q., Jensen, J.O., Savinell, R.F., Bjerrum, N.J., “High temperature proton exchange membranes based on polybenzimidazoles for fuel cells”, Progress in Polymer Science, 34, 2009, p. 449-477.
[41] Han, S.H., Lee, J.E., Lee, K.J., Park, H.B., Lee, Y.M., “Highly gas permeable and microporous polybenzimidazole membrane by thermal rearrangement”, Journal of Membrane Science, 357, 2010, p. 143–151.
[42] Brunetti, A., Scura, F., Barbieri, G., Drioli, E., “Membrane Technologies for CO2 separation”, Journal of Membrane Science, 359, 2010, p. 115-125.
[43] Klaehn, J.R., Orme, C.J., Peterson, E.S., Luther, T.A., Jones, M.G., Wertsching, A.K., Urban-Klaehn, J.M., “CO2 separation Using Thermally Optimized Membranes: A Comprehensive Project Report (2000-2007)”, Idaho National Laboratory (INL).
[44] Pesiri, D.R., Jorgensen, B., Dye, R.C., “Thermal Optimization of Polybenzimidazole meniscus membranes for the separation of hydrogen, methane, and carbon dioxide”, Journal of Membrane Science, 218, 2003, p.11-18.
54
[45] Pesiri, D.R., Jorgensen, B., Dye, R.C., “Meniscus Membranes for separations”, United States Patent Application Publication, US 2004/0187558, 2004.
[46] Kumbharkar, S.C., Kharul, U.K., “Investigation of gas permeation properties of significantly modified polybenzimidazoles by N-substitution”, Journal of Membrane Science, 357, 2010, p. 134-142.
[47] Kumbharkar, S.C., Kharul, U.K., “N-substitution of polybenzimidazoles: Synthesis and evaluation of physical properties”, European Polymer Journal, 45, 2009, p. 3363-3371.
[48] Berchtold, K.A., Singh R.P., Young, J.S., Dudeck, K.W., “Polybenzimidazole composite membranes for high temperatures synthesis gas separations”, Journal of Membrane Science, 415-416, 2012, p. 265-270.
[49] Hosseini, S.S., Chung, T.S., “Carbon membranes from blends of PBI and polyimides for
N2/CH4 and CO2/CH4 separation and hydrogen purification”, Journal of Membranes Science, 328,
2009, p. 174-185.
[50] Földes, E., Fekete, E. Karasz, F.E., Pukánszky, B., “Interaction, miscibility and
phaseinversion in PBI/PI blends”, Polymer, 41, 2000, p. 975.
sieves, I. Preparation and experimental results”, Journal of Membrane Science, 211, 2003, p. 311-
334.
[56] Moore, T.T., “Effects of Materials, Processing, And Operating Conditions On The
Morphology And Gas Transport Properties Of Mixed Matrix Membranes”, PhD Thesis, The
University of Texas, December 2004.
[57] Powell, C.E., Qiao, G.G., “Polymeric CO2/N2 gas separation membranes for the capture of carbon dioxide from power plant flue gases”, Journal of Membrane Science, 279, 2006, p. 1-49.
[58] Cong, H., Radosz, M., Towler, B.F., Shen, Y., ”Polymer–inorganic nanocomposite membranes for gas separation”, Separation and Purification Technology, 55, 2007, p. 281-291.
55
[59] Jiang, L.Y., Chung, T.S., Cao, C., Huang, Z., Kulprathipanja, S., “Fundamental understanding of nano-sized zeolite distribution in the formation of the mixed matrix single and dual-layer asymmetric hollow fiber membranes”, Journal of Membrane Science, 252, 2005, p. 89-100.
polymer mixed matrix membranes for gas separation”, Separation and Purification Technology,
77, 2011, p. 137-145.
[63] Sadeghi, M., Semsarzadeh, M.A., Moadel, H., “Enhancement of the gas separation
properties of polybenzimidazole (PBI) membrane by incorporation of silica nano particles”,
Journal of Membrane Science, 331, 2009, p. 21-30.
[64] A., Juhyeon, J., Chunga, W-.J., Pinnau, I., Guiver, M.D., “Polysulfone/silica nanoparticle mixed-matrix membranes for gas separation”, Journal of Membrane Science, 314, 2008, p. 123-133.
[65] Mahajan, R., Koros, W.J., “Factors controlling successful formation of mixed-matrix gas separation materials”, Industrial Engineering and Chemistry Research, 39, 2000, p. 2692-2696.
[66] Mahajan, R., Burns, R., Schaeffer, M., Koros, W.J., “Challenges in forming successful mixed matrix membranes with rigid polymeric materials”, Journal of Applied Polymer Science, 86, 2002, p. 881-890.
[67] Li, Y., Chung, T., Cao, C., Kulprathipanja, S., “The effects of polymer chain rigidification, zeolite pore size and pore blockage on polyethersulfone (PES)-zeolite 4A mixed matrix membranes”, Journal of Membrane Science, 260, 2005, p. 45-55.
[68] Zhang, Y., Balkus Jr., K.J., Musselman, I.H., Ferraris, J.P., “Mixed-matrix membranes composed of Matrimid® and mesoporous ZSM-5 Nanoparticles”, Journal of Membrane Science,325, 2008, p. 28-39.
[69] Josephine, M., Ordonez, C., Balkus Jr., K.J., Ferraris, J.P., Musselman, I.H., “Molecular sieving realized with ZIF-8/Matrimid® mixed-matrix membranes”, Journal of Membrane Science, 361, 2010, p. 28-37.
[70] Huang, Z., Li, Y., Wen, R. ,Teoh, M.M., Kulprathipanja, S., “Enhanced Gas Separation Properties by Using Nanostructured PES-Zeolite 4A Mixed Matrix Membranes”, Journal of Applied Polymer Science, 101, 2006, p. 3800-3805.
[71] Karatay, E., Kalıpçılar, H., Yılmaz, L., “Preparation and performance assessment of binary and ternary PES-SAPO 34-HMA based gas separation membranes”, Journal of Membrane Science, 364, 2010, p. 75-81.
56
[72] Çakal U., Yılmaz, L., Kalıpçılar, H., “Effect of feed gas composition on the separation ofCO2/CH4 mixtures by PES-SAPO34-HMAmixed matrix membranes”, Journal of Membrane Science, 417–418, 2012, p. 45-51.
[73] Şen, D., Kalıpçılar, H., Yılmaz, L., “Gas Separation performance of polycarbonate membranes modified with multifunctional low-molecular weight additives”, Separation Science and Technology, 41, 2006, p. 1813-1828.
[74] Oral, E., “Effect of operating parameters on performance of additive/zeolite/polymer mixed matrix membranes”, Master Thesis, Middle East Technical University, February 2011.
[75] Keser, N., “Production and performance evaluation of ZIF-8 based binary and ternary
mixed matrix gas separation membranes”, Master Thesis, Middle East Technical University,
August 2012.
[76] Kusworo, T.D., Ismail, A.F., Mustafa, A., Matsuura, T., “Dependence of membrane morphology and performance on preparation conditions: The shear rate effect in membrane casting”, Separation and Purification Technology, 61, 2008, p. 249-257.
[77] Aroon, M.A., Ismail, A.F., Montazer-Rahmati, M.M., Matsuura, T., “Morphology and permeation properties of polysulfone membranes for gas separation: Effects of non-solvent additives and co-solvent”, Separation and Purification Technology, 72, 2010, p. 194-202.
[78] Ismail, A.F., Rahim, R.A., Rahman, W.A.W.A., “Characterization of polyethersulfone/Matrimid® 5218 miscible blend mixed matrix membranes for O2/N2 gas separation”, Separation and Purification Technology, 63, 2008, p. 200-206.
[79] Macchione, M., Jansen, J.C., Tocci, E., Drioli, E., “Influence of residual solvent on the gas transport properties of dense Hyflon® AD 60X gas separation membranes”, Desalination, 200, 2006, p. 49-51.
[80] Fu, Y.J., Hu, C.C., Qui, H.Z., Lee, K.R., Lai, J.Y., “Effects of residual solvent on gas separation properties of polyimide membranes”, Separation and Purification Technology, 62, 2008, p. 175-182.
[81] Joly, C., Cerf, D.L., Chappey, C., Langevin, D., Muller, G., “Residual solvent effect on the permeation properties of fluorinated polyimide films”, Separation and Purification Technology, 16, 1999, p. 47-54.
[82] Compan V., Andrio, A., Lopez, M.L., Alvarez, C., Riande, E., “Effect of time of annealing on gas permeation through coextruded linear low-density polyethylene (LLDPE) films”, Macromolecules, 30, 1997, p. 3317-3322.
[83] Hacarlıoğlu, P., Toppare, L., Yılmaz, L., “Effect of preparation parameters on performance of dense homogenous polycarbonate gas separation membranes”, Journal of Applied Polymer Science, 90, 2002, p. 776-785.
[84] Kruczek, B., Matsuura, T., “Development and characterization of homogeneous membranes de from high molecular weight sulfonated polyphenylene oxide”, Journal of Membrane Science, 146, 1998, p. 263-275.
[85] Hibshman, C., Cornelius, C.J., Marand, E, “The gas separation effects of annealing polyimide–organosilicate hybrid membranes”, Journal of Membrane Science, 211, 2003, p. 25-40.
57
[86] Vaughn, J.T., Koros, W.J., Johnson, J.R., Karvan, O., ”Effect of thermal annealing on a novel polyamide–imide polymer membrane for aggressive acid gas separations”, Journal of Membrane Science, 401– 402, 2012,p. 163–174.
[87] Costello, L.M., Koros, W.J., “Effect of structure on the temperature dependence of gas transport and sorption in a series of polycarbonates”, Journal of Polymer Science, 32, 1994, p.701-713.
[88] Merkel, T.C., Gupta, R.P., Turk, B.S., Freeman, B.D., “Mixed-gas permeation of syngas components in poly(dimethylsiloxane) and poly(1-trimethylsilyl-1-propyne) at elevated temperatures”, Journal of Membrane Science, 191, 2001, p. 85-94.
[89] Clarizia, G., Algieri, C., Drioli, E., “Filler-polymer combination: a route to modify gas transport properties of a polymeric membrane”, Polymer, 45, 2004,p. 5671-5681.
[90] Khan, A.L., Cano-Odena, A., Gutiérrez, B., Minguillón, C., Vankelecom, I.V.J., “Hydrogen separation and purification using polysulfone acrylate-zeolite mixed matrix membranes”, Journal of Membrane Science, 350, 2010, p. 340-346.
[91] Diaz, K., Lopez-Gonzalez, M., del Castillo, L.F., Riande, E., “Effect of zeolitic imidazolate frameworks on the gas transport performance of ZIF8-poly(1,4-phenylene ether-ether-sulfone) hybrid membranes”, Journal of Membrane Science, 383, 2011, p. 206-213.
[92] Ostwal, M., Lau, J.M., Orme, C.J., Stewart, F.F., Way, J.D., “The influence of temperature on the sorption and permeability of CO2 in poly(fluoroalkoxyphosphazene) membranes”, Journal of Membrane Science, 344, 2009, p. 199-203.
[93] Topuz, B., Yılmaz, L., Kalıpçılar, H., “Development of alumina supported ternary mixed matrix membranes for separation ofH2/light-alkane mixtures”, Journal of Membrane Science, 415-416, 2012, p. 725-733.
[94] Sadeghi, M., Semsarzadeh, M.A., Barikani, M., Chenar, M.P., “Gas separation properties of polyether-based polyurethane–silica nanocomposite membranes”, Journal of Membrane Science, 376, 2011, p. 188-195.
Angewandte Chemie International Edition, 2010, p. 9863-9866.
[96] Noble, R.D., “Perspectives on mixed matrix membranes”, Journal of Membrane Science, 378, 2011, p. 393-397.
[97] Sannigrahi, A., Arunbabu, D., Sankar, R.M., Jana, T., “Aggregation Behavior of Polybenzimidazole in Aprotic polar Solvent”, Macromolecules, 40, 2007, p. 2844-2851.
[98] Yang, J., He, R., “Preparation and characterization of Polybenzimidazole membranes prepared by gelation in phosphoric acid”, Polymer Advanced Technologies, 21, 20010, p.874-880.
[99] Chung, T., Xu, Z., “Asymmetric hollow fiber membranes prepared from miscible polybenzimidazole and polyetherimide blends”, Journal of Membrane Science, 147, 1998, p. 35-47.
[100] Mahajan, R., Burns, R., Schaeffer, M., Koros, W.J., “Challenges in forming successful mixed matrix membranes with rigid polymeric materials”, Journal of Applied Polymer Science, 86, 2002, p. 881-890.
58
[101] Sen, D., “Polycarbonate based Zeolite 4A filled mixed matrix membranes: Preparation, Characterization and gas separation performances”, PhD thesis, Middle East Technical University, 2008.
[102] Chang, K. S., Hsiung, C.C., Lin, C.C., Tung, K.L., “Residual Solvent Effects on Free Volume and Performance of Fluoinated Polyimide Membranes: A Molecular Simulation Study”, Journal of Physical Chemistry, 113, 2009, p. 10159-10169.
[103] Baker, W.R., “Future Directions of Membrane Gas Separation Technology”, Industrial and Engineering Chemistry Research, 41(6), 2002, p.1393-1411.
[104] Rezakazemi, M., Shahidi, K., Mohammadi, T., “Hydrogen separation and purification
using crosslinkable PDMS/Zeolite A nanoparticles mixed matrix membranes”, International
Journal of Hydrogen Energy, 37, 2012, p. 1-14.
[105] Freeman, B.D., “Basis of permeability/selectivity tradeoff relations in polymeric gas separation membranes”, Macromolecules, 32, 1999, p. 375-380. [106] Shogbon C.B., Brousseau, J.-L., Zhang, H., Benicewicz, B.C., Akpalu, Y.A., “Determination of the molecular parameters and studies of the chain conformation of polybenzimidazole in DMAc/LiCl”, Macromolecules, 39, 2006 p. 9409-9418. [107] Yurdakul, A.Ö., “Acid doped polybenzimidazole membranes for high temperature proton exchange membrane fuel cells”, Master Thesis, Middle East Technical University, July 2007. [108] Yulin, M., “The fundamental studies of polybenzimidazole/phosphoric acid electrolyte for fuel cells”, PhD thesis in Chemical Engineering, Case Western Reserve Unıversıty, Ohio, 2004. [109] Lin H., Yu, T.L., Chang, W., Cheng, C., Hu, C., Jung, G., “Preparation of a low proton resistance PBI/PTFE composite membrane “Journal of Power Sources, 164, 2007, p. 481-487. [110] Şener, T., Okumuş, E., Gürkan, T., Yılmaz, L., “The effect of different solvents on the performance of zeolite-filled composite pervaporation membranes”, Desalination, 261, 2010, p.181-185.
[111] Açıkalın, S., Yılmaz, L., “Effect of temperature and membrane preparation parameters on gas permeation properties of polymetacrylates”, Journal of Polymer Science, 45, 2007, p. 3025-3033.
[112] Koros, W.J., Mahajan, R., “Pushing the limits on possibilities for large scale gas separation: which strategies?”, Journal of Membrane Science, 175, 2000, p.181-196.
[113] Rowe, B.W., Robeson, L.M., Freeman, B.D., Paul, D.R., “Influence of temperature on the upper bound: Theoretical considerations and comparison with experimental results” Journal of Membrane Science, 360, 2010, p.58-69.
[114] Konduri, S., Nair, S., “A computational study of gas molecule transport in a polymer/nanoporous layered silicate nanocomposite membrane material”, The Journal of Physical Chemistry C 111, 2007, p. 2017-2024.
[115] Robeson, L.M., “Upper Bound Revisited”, Journal of Membrane Science, 320, 2008, p. 390-400.
59
APPENDIX A
PARTICLE SIZE DISTRIBUTION OF SAPO-34 PARTICLES
Figure A.1: Particle size distribution of SAPO-34 particle
0
5
10
15
20
25
10 100 1000 10000
Vo
lum
e %
Particle Size (nm)
60
61
APPENDIX B
DIFFERENTIAL SCANNING CALORIMETRY SCAN OF FUMIAN AP (PBI-2)
Figure B.1: DSC diagram of Fumian AP
62
63
APPENDIX C
SEM IMAGES
(a) (b)
Figure C.1: (a), (b) SEM images of 20 % w/w Zeolite 3A loaded mixed matrix membrane
64
65
APPENDIX D
TGA THERMOGRAMS
Figure D.1 TGA Thermogram for in-oven annealed neat PBI membrane
66
Figure D.2 TGA Thermogram for in-oven annealed PBI/Zeolite-3A membrane
67
Figure D.3: TGA Thermogram for in-line annealed neat PBI membrane