Page 1
Development of Polymer Network of Phenolic and Epoxies Resins mixed with Linseed
Oil: Pilot Study
H Ku, F Cardona, D Rogers, and J-C Munoz
Faculty of Engineering and Surveying and
Centre of Excellence in Engineered Fibre Composites,
University of Southern Queensland, Australia.
H Ku, F Cardona, D Rogers, and J-C Munoz, Development of Polymer Network of Phenolic
and Epoxies Resins mixed with Linseed Oil: Pilot Study, Journal of Materials Engineering
and Performance, 2010, Vol. 19, No. 6, pp. 912-919.
Corresponding Author:
Title : Dr.
Name : Harry Siu-lung Ku
Affiliation : Faculty of Engineering and Surveying,
University of Southern Queensland.
Tel. No. : (07) 46 31-2919
Fax. No. : (07) 4631-2526
E-mail : [email protected]
Address : Faculty of Engineering and Surveying,
University of Southern Queensland,
West Street, Toowoomba, 4350,
Australia.
Page 2
Abstract: Epoxy resin was mixed with phenolic resins in different percentages by weight.
Composite 40/60 means the proportion by weight of epoxy resin is 40 percent. It was found
that only composites 50/50 and 40/60 could be cured in ambient conditions. Dynamic
mechanical analysis showed that only these two composites form interpenetrating polymer
network. The addition of linseed oil to the two resins results also in the formation of
interpenetrating network irrespective of proportion by weight of the resins; the mechanical
properties will only be better when the percentage by weight of epoxy resin is higher; the aim
of reducing cost and at the same time maintaining the mechanical properties cannot be fully
achieved because epoxy resin is much more expensive than its counterpart.
Keywords: Epoxy resin, phenolic resin, flexural test, dynamic mechanical thermal analysis
and linseed oil.
Introduction
The emerging use of fibre composite materials and technologies in civil and structural
engineering has created opportunities in the development of ‘smarter’ composites. A
research centre in the University of Southern Queensland utilises thermosetting resins, e.g.
epoxies, vinylesters and phenolics, in nearly all of its work. While the mechanical properties
of thermosetting composites are good, their major drawback is their brittleness.
A major focus of polymer research work conducted at the centre is to improve the toughness
of thermosetting resins. There are many well-established techniques to toughen these resins –
thermoplastic modification, core-shell particle additives, rubber [CTBN (carboxyl-terminated
butadiene/acrylonitrile copolymer), ATBN (amine terminated butadiene acrylonitrile)]
Page 3
adducts, etc. These approaches are always too expensive for civil engineering applications.
The centre uses epoxy resins for many of its projects, which have no thermal resistance and
burn with ease. Phenolics resins, on the other hand, have very good thermal properties and
are fire resistant. An idea to make a composite with interpenetrating polymer network of
phenolic and epoxies resins came out from members of the centre. The ‘smart’ composite
will bring the advantages of both resins together. Mechanical and thermal tests were carried
out to characterize the behaviour of the ‘smart’ composites to see if they were useful to the
centre.
Hyrez 202 – Epoxy resin
Hyrez 202 is the name given to the epoxy resin made by the centre. It is a mixture of ‘part A’,
which is a mixture of commercial epoxy resins, and ‘part B’, which is a mixture of different
commercial hardeners. Experiments showed that the best proportion of the resin is 80% by
weight of part A and 20% by weight of part B. Hyrez 202 provides low cost epoxy resin. In
general, the physical properties of epoxy resins are density = 1100 to 1500kg/m3; tensile
modulus = 3 to 5 GPa; tensile strength = 60 to 80 MPa; flexural stress at break = 100 to 150
MPa; elongation at break = 2 to 5%; shear strength = 30 to 50 MPa and temperature of
bending (under load) = 290°C [1].
Epoxy resins are one of the most important classes of thermosetting polymers. These
networks have many desirable properties which include high tensile strength and modulus,
excellent chemical and corrosion resistance and good dimensional stability. Consequently,
these materials are widely used for many important applications such as coatings, structural
adhesives, reinforced plastics and matrix for advanced composite materials [1-4].
Page 4
Unfortunately, these highly crosslinked networks are inherently brittle and consequently have
limited applications in areas where high fracture strength or thermal resistance were required.
Epoxies are thermosetting resins based on the epoxiran groups which are able to condense
with reagents with mobile hydrogen and amine groups; crosslinking leads to a solid structure.
Phenolic resin
The centre uses Cellobond® J2027L phenolic resin. It is a brown prepolymer with a phenolic
odour. The viscosity is around 2800 cP at 25 °C. Its composition consists of
phenol/formaldehyde resin, 30 to 60%, phenol, 1 to 10%, formaldehyde, 1 to 5% and water,
30 to 60%. The polymer, based on phenolic resin, is Phenol-formaldehyde (PF). PF resins
are the major adhesives used for bonding wood panels for exterior applications. The PF
adhesive resins are used primarily in the production of soft plywood, oriented strand board,
and wafer board. The PF resins are formed by the reaction of phenol with formaldehyde. By
varying the reaction time, reaction temperature, catalyst type, and the ratio of formaldehyde
to phenol, a number of adhesive systems with different properties can be produced [5].
Phenolic resins are thermosetting polymers with high chemical resistance and thermal
stability but low toughness and mechanical strength. Moreover, phenolic resoles have
intrinsic resistance to ignition, low generation of smoke and relatively low cost. On the other
hand, they are characterized by a complex process of polymerization with the condensation of
water and formaldehyde and formation of voids. Therefore, the processing of phenolic
materials requires careful temperature control and gradual heating to allow continuous
elimination of volatiles and to reduce defects in final components. Normally, the time
required for these operations is incompatible with common industrial processes. Initially
Page 5
formaldehyde reacts with phenol to form hydroxymethyl derivatives. As the reaction
proceeds, reactions also take place between the hydroxymethyl groups and the aromatic ring
carbons of phenol or another hydroxymethyl group to form methylene linkages.
Phenolic catalysts
In general, there are three catalysts for the resin: Phencat 15, Phencat 382 and AP-3. Phencat
15 is a fast action acid catalyst. The reaction with phenolic resins is strongly exothermic. It is
toxic and causes burns if contacted. Its composition consists of xylenesulfonic acid, 70 to
90%, phosphoric acid, 10 to 20% and water, 1 to 10%. Phencat 382 is a slow action acid
catalyst. The reaction with phenolic resin is exothermic. It is toxic and dangerous. Its
composition consists of phosphoric acid, 40 to 80% and water 20 to 60%. AP-3, the exact the
composition is not known but is a commercial mixture of different acids. The reaction with
phenolic resins is strongly exothermic. It has a high toxicity and burns the skin.
Phencat 15 cures the mixture of phenolic and epoxy resins better if the percentage by weight
of epoxy resin is less. However, when the percentage of epoxy resin increases, the reaction
becomes too exothermic and fast, and ‘moss’ was formed. Moreover, there is another reaction
taking place because Phencat 15 consists of xylenesulfonic acid which reacts with epoxy
resin. There are two exothermic reactions taking place at the same time, resulting in the
formation of moss [6]. Phencat 382 is a slow phenolic catalyst so it is difficult for it to cure a
mixture with a few percentages by weight of phenolic resin; it reacts well with a mixture of
50/50 or more phenolic resin if its percentage by weight is 5% or more. In addition, it does
not contain xylenesulfonic acid and no moss was found except for composites 20/80 and
Page 6
10/90 but it could be easily controlled. On account of the above grounds, Phencat 382 was
used for this study.
Linseed oils
Linseed oil is amber in colour with a recognisable odour; it is fatty oil extracted from the
cotyledons and inner coats of the seeds of flax (linseed). The raw oil is extracted from the
seeds by pressing. In its raw form, it is light in colour, but when it is boiled it turns darker and
thicker.
Linseed oil is used to protect wood and is a major drying ingredient in high quality oil paints
and varnishes. Linseed oil is used to provide protection and finish on wooden furniture and
decks of boats. It stabilises the surface of concrete and reduces the formation of dust and
prevents corrosive breakdown of steel reinforcing rods. It is also used in the making of
linoleum, oilcloth, artist colours and some printing inks. The residue and pulp are used in
animal feeds, as a nutritional supplement that is high in omega-3 fatty acids. The oil
polymerizes or oxidises more readily when heated [1]. The iodine value related to linseed oil
is a measure of the unsaturation of the fats and the oils and is expressed in centigrams of
iodine absorbed per gram of sample (% iodine absorbed) [3].
Linseed oil is a blend of glycerin of saturated and unsaturated fatty acids. The saturated fatty
acids are not very reactive, the unsaturated one are much more reactive. The unsaturated
molecules contain double bond and there are one or more alkenes functional groups along the
chain. The molecule has two or more points in its structure which is capable of supporting
other atoms [1]. The epoxydized reaction consists of the opening of the C-C double bond and
Page 7
replacing it by a C-O-C cycle (oxirane ring). The epoxydized double bond is a pre-polymer
way of synthesis.
Experiments
Flexural test
Flexural test provides values for the modulus of elasticity in bending EB, flexural stress ζf,
flexural strain εf and the flexural stress-strain response of the material. The main advantage of
a three point flexural test is the ease of the specimen preparation and testing. However, this
method has also some disadvantages: the results of the testing method are sensitive to
specimen and loading geometry and strain rate [4, 7]. Flexural modulus is calculated from the
slope of the stress against deflection curve [7]. Flexural test is often done on relatively
flexible materials such as polymers, wood and composites. There are two types of the test: 3
point flexural test and 4 point flexural test. Three point bending test will be used in this
project. In this test, the area of uniform stress is quite small and concentrated on the centre
loading point. Consider a rectangular beam, on which a simple flexural force is exercised in
the centre of the beam with a load of P as depicted in Figure 1. The standard used is ISO
14125:1998(E) [8]. The centre uses a universal machine MTS Alliance RT/10 at 10kN
couple with the software TESTWORK 4. The dimensions of the specimens were 250 mm x
10 mm x 4 mm and tested at a crosshead of 4 mm/min.
The equation used for calculating the flexural stress,
ζf = 22
3
bh
PL (1)
The equation used for calculating the flexural strain,
Page 8
f = 2
6
L
Dh (2)
The equation used for calculating theYoung’s modulus,
EB = 3
3
4bh
mL=
strainFlexural
strengthFlexural (3)
where: ζf : stress in outer fibre at midpoint, MPa;
f : strain in the puter surface, %;
EB: modulus of elasticity in bending, MPa;
P: load at a given point on the load deflection curve, N;
L: support span, mm;
b: width of test beam, mm;
h: depth of test beam, mm;
D: maximum deflection of the centre of the beam, mm;
m: slope of the tangent to the initial straight line portion of the load deflection
curve, N/mm.
Dynamic Mechanical Thermal Analysis (DMTA)
DMTA is a technique used to study and characterize materials. It is most useful for observing
the visco-elastic nature of polymers. Two methods are currently used. One is the decay of
free oscillations and the other is forced oscillation. Free oscillation techniques involve
applying a force to a sample and allowing it to oscillate after the force is removed. In this
project, forced oscillation was employed. Forced oscillations involve the continued
application of a force to the sample. An oscillating force is applied to a sample of material
and the resulting displacement of the sample is measured. This method is the most commonly
Page 9
used one today. Samples can be either solids or melts. Most solids are tested by linearly
applying strains, and melts or liquids are normally tested in shear. The sample deforms under
the load. From this, the stiffness of the sample can be determined, and the sample modulus
can be calculated. By measuring the time lag in the displacement compared to the applied
force it is possible to determine the damping properties of the material. The time lag is
reported as a phase lag, which is an angle. The damping is called tan δ, as it is reported as the
tangent of the phase lag. Visco-elastic materials such as polymers typically exist in two
distinct states. They exhibit the properties of a glass (high modulus) at low temperatures and
those of a rubber (low modulus) at higher temperatures. By scanning the temperature during a
DMA experiment change of state, the glass transition or alpha relaxation, can be observed.
The glass transition temperature (Tg) is often measured by DSC (Differential Scanning
Calorimetry), but the DMA technique is more sensitive and yields more easily interpreted
data. DMA can also be used to investigate the frequency (and therefore time) dependent
nature of the transition. This is useful as the degree of dependence is specific to the transition
type. Tg has a strong dependence on frequency but melting is frequency independent; DMA
can also resolve sub-Tg transitions, like beta, gamma, and delta transitions as the DSC
technique is not sensitive enough to pick them up in many materials. In addition, DMA gives
modulus values. Frequency is constant and the temperature is varied [9].
In the test, an oscillating force is applied to a sample while the temperature is varied the
resulting displacement of the sample is measured. The sample dimension used in the test was
60 mm x 10 mm x 4 mm; the frequency of oscillation was 1 Hz. UNIVERSAL ANALYSIS
2000, the software used, carries out the calculations. From these experiments, graphs of
tangent delta loss and storage modulus were produced.
Page 10
Samples with different proportion of epoxy and phenolic resin were mixed in a take-away
box. Part A and part B of the Hyrez 202 were first mixed in calculated proportion by weight;
phenolic J2027L and Phencat 382 were then added and mixed with Hyrez 202 [9]. The
mixture was then cured in ambient conditions for 4 hours and then post-cured for 4 hours at
60 °C and another 4 hours at 100 °C. It is then cut and sanded to a good surface finish for
DMA (dynamic mechanical analysis) and flexural strength tests. Only one sample is required
for the DMA and 5 samples for the flexural test.
Later, Epoxydised Linseed Oil (58%) [ELO (58%)] was added to epoxy resin; when ELO
(58%) was mixed with epoxy resin, the colour changed to purple, which was a sign of
chemical reaction and the network was formed. The curing and post-curing time was 12
hours at ambient conditions followed by 4 hours at 80 °C and then heated up to 150 °C.
Table 1 illustrates composites with different percentage by weight of epoxy and phenolic
resins with linseed oil pre-mixed with epoxy resin; the weight of part A and part B of Hyrez
202 were also varied. Each time, the same weight of part B of the Hyrez 202 was maintained
to compare the action of ELO (58%) on part A.
Finally, phenolic resin was first mixed with ELO (58%) and then the catalyst was added. In
other box (container), parts A and B of Hyrez 202 were mixed. Finally, contents of the two
boxes were mixed altogether. The same curing conditions were kept. Table 2 illustrates
composites with different percentages by weight of epoxy and phenolic resins with linseed oil
pre-mixed with phenolic resin.
Page 11
Results and discussions
Table 3 shows the results of ambient cured and ambient plus post-cured of the two resins
mixed together. It can be found that mixtures with higher percentage by weight of phenolic
resin did not cure at ambient conditions and stayed as liquid. However, it was cured after
heating in an oven but bubbles were found. For samples with a lot of epoxy, moss appeared a
few minutes after mixing. It appears that only composites 50/50 and 40/60 were
homogeneous. All other samples, except the pure resins, were not good materials.
When the proportion by weight of Hyrez 202 was higher, only ‘moss’ was obtained due to
the strong catalyst, which reacted very fast and some other reactions that were not expected
might be present. When the proportion of phenolic resin by weight was higher, samples were
damaged by the appearance of bubbles. This may be due to too high curing temperature. The
evolution of water and formaldehyde during curing could promote bubbles, microcracking
and internal stresses in the final products. Therefore, the processing of phenolic materials
requires temperature control to reduce defects in the final components.
Figures 2 (a) and (b) show the results of dynamic mechanical thermal analysis (DMTA) tests,
which verify that mixture of epoxy and phenolic resins is an interpenetrating polymer
network because two peaks were found; one peak was very large which proved the presence
of a network based on epoxy (the lower temperature) and a smaller peak illustrated the
presence of a network based on phenolic (the higher temperature).
Page 12
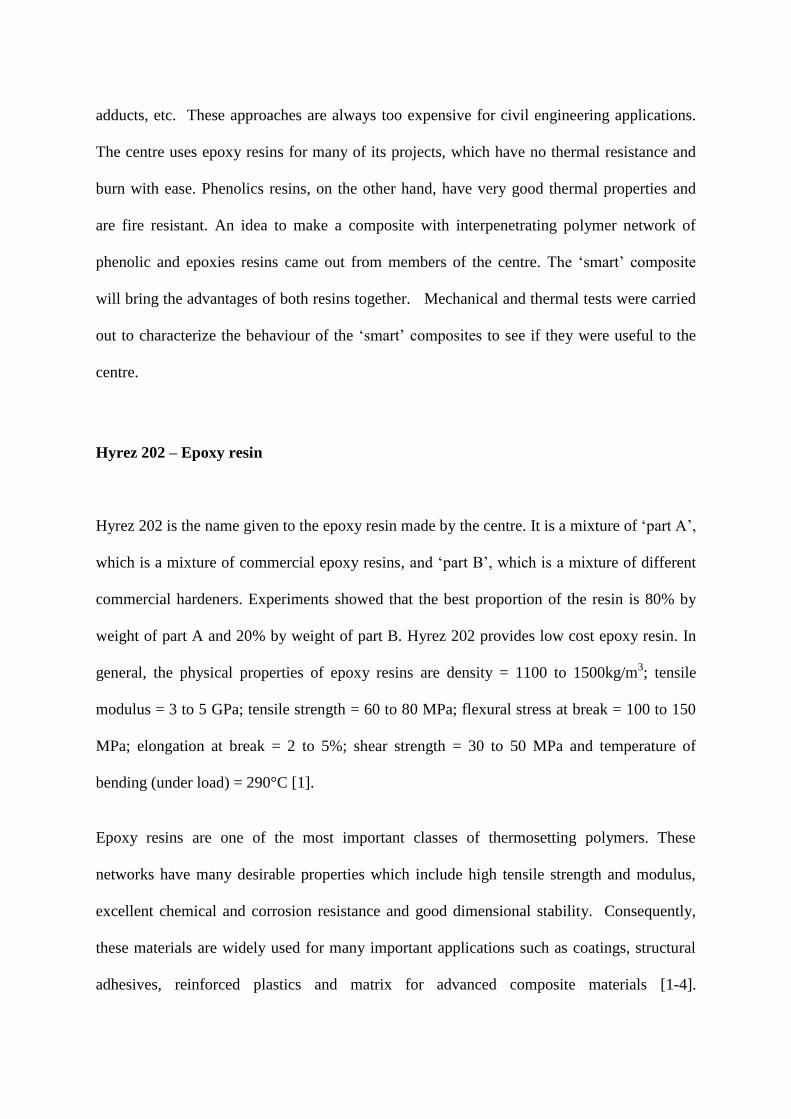
Figure 3 (a) shows the stress-train curves of Hyrez 202. The results were similar in trend
with those found by other researchers [10]. Figure 3 (b) shows composite with 80% by
weight of part A and 20% by weight of part B; it was a brittle composite, but the epoxy resin
was a ductile material [Figure 3 (b)].
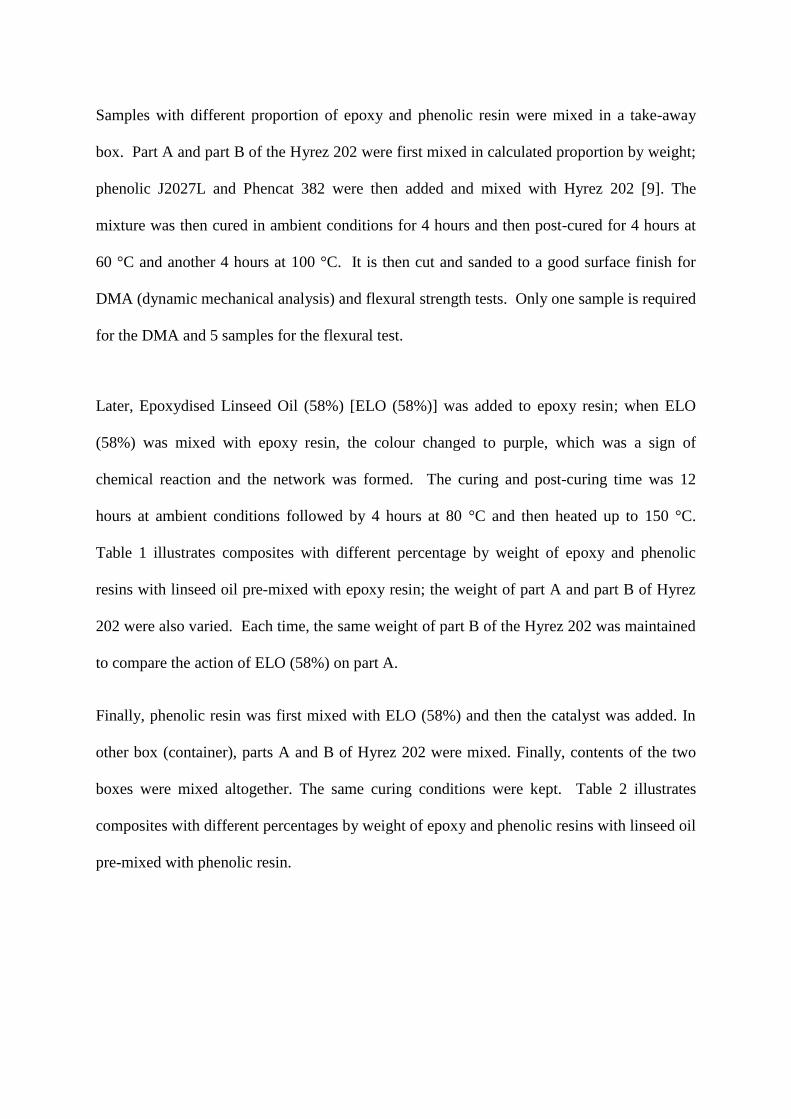
Figure 4 shows the variation of glass transition temperature (Tg) of composites of epoxy and
phenolic resins with varying percentage by weight of ELO (58%). It can be found that the Tg
is not very affected by the amount of ELO (58%). However, with composites 80/20, 70/30
and 30/70, the Tg started to decrease if the ELO (58%) by weight was more than 30%. In
another similar study, it was found that the glass transition temperature of epoxy resin
decreased with increasing amount of ELO. The lowest value was obtained when the
percentage by weight of ELO was also 30%, which was in line with the current study [11].
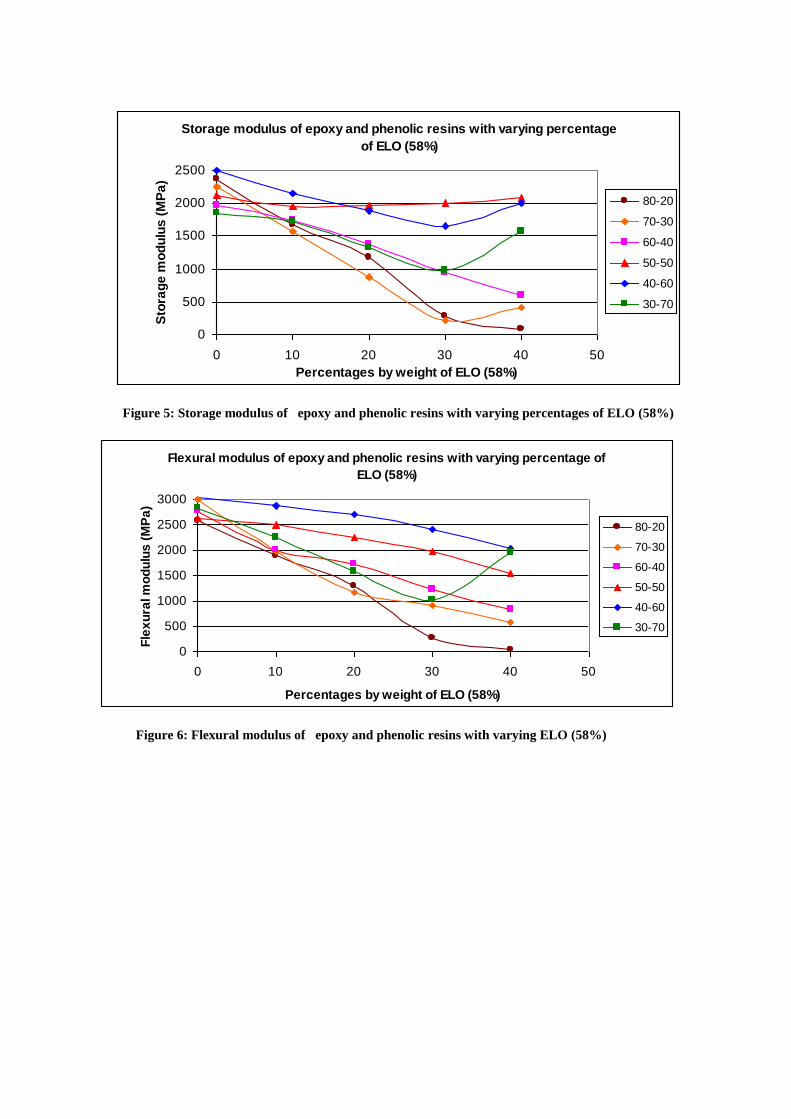
Figure 5 illustrates the decrease of storage modulus of composites of epoxy and phenolic
resins with varying percentage by weight of ELO (58%). The drop rebounded when the
percentage by weight of ELO (58%) was over 30%. The change was most significant with
the composite 70/30, the storage modulus dropped from 2260 MPa at 0% of ELO (58%) to
230 MPa at 30% of ELO (58%); the change was nearly nine times. The result agreed with the
fact that ELO (58%) acted like a plasticizer and the elastic characteristic of the material,
which traduced to storage modulus, decreased.
Figure 6 shows the decrease of flexural modulus of composites of epoxy and phenolic resins
with varying percentage by weight of ELO (58%). For all composites, the samples showed
brittle behaviour. For most of the samples, the flexural modulus decreased linearly to
Page 13
1000MPa. For the sample 60/40, the flexural modulus at 0% ELO (58%) was 2700 MPa and
it fell to 700MPa at 40% of ELO (58%), a fall of nearly four times.
Figure 7 illustrates the strain at break of epoxy and phenolic resins with varying percentage
by weight of ELO (58%). Composites 80/20, 70/30, 50/50, 30/70 showed a slight increase of
strain at break (%) with increasing percentage by weight of ELO (58%). Composites 60/40
and 40/60 showed a slight decline of strain at break (%) but the values rebounded when the
ELO (58%) was over 30%. No general trend for the curves can be traced.
Figure 8 illustrates the peak flexural stress of composites of epoxy and phenolic resins with
varying percentage by weight of ELO (58%) and they were all different. For 30/70, 40/60
and 60/40 composites, it increased a little bit for 10% of ELO (58%) and then it decreased
with more ELO (58%). For other samples, it decreased immediately with the addition of ELO
(58%). In addition to being a plasticizer, a team of researchers found that the linseed oil
reacted with phenolic resin and became a portion of the phenolic structure, which was a high-
quality friction material [12].
From all the analysis, it was found that the ELO (58%) acted as a plasticizer. However, the
strain at break was only 2% and the addition of ELO (58%) seemed not to increase the
toughness of the composite. The best material is composite 40/60. When the proportion of
phenolic resin was increased, properties became better. The post-curing temperature of 150°C
brought about cracks in the material when there was more phenolic resin.
Yue et al. [13] internally toughened novel phenolic resin by epoxidized soybean oil (ESO).
The resulting resin with good toughness and thermal stability was used as the matrix resin of
Page 14
copper clad laminate (CCL). FT-IR was employed to characterize the molecular structure of
the modified phenolic resin and SEM was used to observe the micro morphology of the resin
intersections. The properties of CCLs prepared with the modified phenolic resin were also
studied to determine the optimal processing conditions. Finally, the corresponding
toughening mechanism was investigated. It was demonstrated that the toughening relied
mainly on the triethanolamine-catalyzed etherification reaction between phenol hydroxyl and
ESO, and the chain extension polymerization between ESO and multi-amine, which brought
about long-chain ESO epoxy grafting onto the phenolic resin prepolymer. Moreover, it was
found that the ESO-toughened phenolic resin possessed optimal performance at an ESO
content of 30% and a curing agent content of 7%; the flexible ESO epoxy with significant
toughening effect could crosslink with the phenolic resin to form an internally toughened
network for improving the solderleaching resistance of the CCL.
Conclusions
Without the addition of linseed oil to the mixture of epoxy and phenolic resins, only
composites 50/50 and 40/60 will be cured at ambient conditions and form the interpenetrating
polymer network. Since only composites with higher proportion of epoxy resin have better
mechanical properties, the aim of reducing cost is not fully achieved.
The epoxidized linseed oil is really a plasticiser. With epoxy resin, ELO can mix with the
composite well if the phenolic resin was no more than 20 % by weight and gave better
mechanical properties. However, adding ELO did not improve the properties as it was
expected. The way in which ELO (58%) was added was unimportant as the properties did
not seem to change. A mixture of phenolic and epoxy resins gives good properties only if the
Page 15
proportion by weight of epoxy resin is high. In the projects done in the centre, fire resistance
is an important factor and epoxy reduces this a lot. Therefore, it can be argued that the
composites produced in this research are more suitable for friction and coating material.
References
1. Berthelot, J-M, Matériaux composites comportement mécanique et analyse des structures,
édition Masson, 1992. (Berthelot, J-M, Composite materials: Mechanical behaviour and
analysis of the structures, Masson edition, 1992).
2. ISO 3001:1999, Plastics. Epoxy compounds. Determination of epoxy equivalent.
3. AOCS, AOCS (American Oil Chemists’ Society) official methods Cd 1d-92 reapproved
1997.
4. Wikipedia, The free encyclopaedia, Epoxy resin, http://en.wikipedia.org/wiki/Epoxy_resin,
2006.
5. Chemwatch, Material safety data sheet for Hexion Cellobond J2027L, 2005, pp. 1-14.
Chemwatch, Material safety data sheet for Hexion Phencat 15, 2005, pp. 1-14.
6. Chemwatch, Material safety data sheet for Hexion Phencat 15, 2005, pp. 1-14.
7. Shackelford, J F, Introduction to Materials Science for Engineers, 3rd
edition, Macmillan,
1992, pp.435-437, 459.
Page 16
8. ISO 14125:1998(E), Fibre reinforced plastic composites – Determination of flexural
properties.
9. Li, L, Dynamic Mechanical Analysis (DMA), Basics and Beyond, Perkin Elmer Inc. 2000,
pp.3, 15, 17.
10. Crivello, J V, Sternstein, S S and Narayan, R, Mechanical characterization of glassfibre
reinforced/UV cured resins from epoxidized linseed oil, Proceedings of the ASME Material
division, ASME, 1995, MD-Vol. 69-1, 1995 IMECE, pp. 175-180.
11. Miyagawa, H, Mohanty, A K, Misra, M and Drzal, L T, Thermo-physical and impact
properties of epoxy containing epoxidized linseed oil, 1anhydride-cured epoxy,
Macromolecular materials engineering, 2004, Vol. 289, No. 7, pp. 629-635.
12. Yuan, X, Shao, M, Chen, M, Zhang, Y and Wang, J, Preparation and heat resistant
characterization of phenolic resin modified by linseed oil, Journal of Jiangsu University
(natural science edition), Vol. 27, No. 3, may 2006, pp. 234-236.
13. Yue, S, Hu, J, Huang, H, Fu, H, Zeng, H, Chen, H, Synthesis and application of
phenolic resin internally toughened by chain extension polymer of epoxidized soybean oil,
Journal of South China University of Technology (Natural Science), 2007, Vol. 35, No. 7, pp.
99-104.
Page 17
Figure 1: A schematic diagram for three point bending test
Page 18
Figure 2: DMA results of composite 50/50 (a) and 40/60 (b) with 6% of phencat 15 cured at ambient
conditions for 4hours and then post-cured in an oven for 4 hours at 80°C and 4hours at 100°C
36.59°C
2704MPa
118.16°C
89.16°C
50
100
150
200
[
] L
oss M
od
ulu
s (
MP
a)
0.0
0.1
0.2
0.3
0.4
0.5
[
] T
an
De
lta
0
500
1000
1500
2000
2500
3000
[
] S
tora
ge
Mo
du
lus (
MP
a)
20
40
60
80
100
120
140
160
180
200
Temperature (°C)
Sample: Sample 16
Size: 35.0000 x 10.1800 x 4.0400 mm
Method: Temperature Ramp
Comment: 40%Epoxy-60%Ph 6%pk15 4h604h100
DMA
File: C:...\1st tests\Sample 16.001
Operator: Francisco Cardona
Run Date: 18-May-06 17:18
Instrument: DMA Q800 V5.1 Build 92
Universal V3.9A TA Instruments
37.98°C
1617MPa
87.94°C
125.25°C
50
100
150
[
] L
oss M
od
ulu
s (
MP
a)
0.0
0.1
0.2
0.3
0.4
0.5
[
] T
an
De
lta
0
500
1000
1500
2000
[
] S
tora
ge
Mo
du
lus (
MP
a)
20
30
40
50
60
70
80
90
100
120
140
160
Temperature (°C)
Sample: Sample 14
Size: 35.0000 x 10.8000 x 4.0400 mm
Method: Temperature Ramp
Comment: 50Epoxy-50Ph 6%pk15 4h60-4h100
DMA
File: C:...\1st tests\Sample 14.001
Operator: Francisco Cardona
Run Date: 18-May-06 17:18
Instrument: DMA Q800 V5.1 Build 92
Universal V3.9A TA Instruments
(a)
(b)
Page 19
Figures 3: Flexural test results of HYREZ 202 (a) and of composite 80/20 (b)
Glass transition temperature with varying percentage by weight of ELO
(58%)
0
100
200
300
400
500
600
700
0 10 20 30 40 50
Percentages by weight of ELO (58%)
Gla
ss t
ran
sit
ion
tem
pera
ture
(oC
)
80Epoxy-20Phenolic
70Epoxy-30Phenolic
60Epoxy-40Phenolic
50Epoxy-50Phenolic
40-Epoxy-60Phenolic
30Epoxy-70Phenolic
Figure 4: Glass transition temperature of epoxy and phenolic resins with varying ELO (58%)
Figure 3 (a) Figure 3 (b)
Page 20
Storage modulus of epoxy and phenolic resins with varying percentage
of ELO (58%)
0
500
1000
1500
2000
2500
0 10 20 30 40 50
Percentages by weight of ELO (58%)
Sto
rag
e m
od
ulu
s (
MP
a)
80-20
70-30
60-40
50-50
40-60
30-70
Figure 5: Storage modulus of epoxy and phenolic resins with varying percentages of ELO (58%)
Flexural modulus of epoxy and phenolic resins with varying percentage of
ELO (58%)
0
500
1000
1500
2000
2500
3000
0 10 20 30 40 50
Percentages by weight of ELO (58%)
Fle
xu
ral m
od
ulu
s (
MP
a)
80-20
70-30
60-40
50-50
40-60
30-70
Figure 6: Flexural modulus of epoxy and phenolic resins with varying ELO (58%)
Page 21
Strain at break of epoxy and phenoolic resins with varying
percentage by weight of ELO (58%)
0
1
2
3
4
5
0 10 20 30 40 50
Percentages by weight of ELO (58%)
Str
ain
at
bre
ak
(%
) 80-20
70-30
60-40
50-50
40-60
30-70
Figure 7: Strain at break (%) of epoxy and phenolic resins with varying ELO (58%)
Peak flexural stress of epoxy and phenolic resins with varying
percentage of ELO (58%)
0
10
20
30
40
50
60
70
0 10 20 30 40 50
Percentages by weight of ELO (58%)
Pe
ak
fle
xu
ral s
tre
ss
(MP
a)
80-20
70-30
60-40
50-50
40-60
30-70
Figure 8: Peak flexural stress of epoxy and phenolic resins with varying ELO (58%)
Page 22
Table 1: Different percentage by weight of epoxy and phenol resins with linseed oil pre-mixed with epoxy
resin
Epoxy resin Phenloic resin
Total
mass
of
epoxy
resin
Total
mass of
phenolic
resin
Percentage
Epoxidized
linseed oil
(58%) in
phenolic resin
temperature and
time of curing
Hyrez 202
Part A Part B
Epoxidized
linseed oil
(58%)
Phenolic
J2027L
5%
Phencat
382
16 4 0 76 4 20 80 0 4h at 80
oC &
ramp to 150 oC
14.4 4 1.6 76 4 20 80 10 ditto
12.8 4 3.2 76 4 20 80 20 ditto 11.2 4 4.8 76 4 20 80 30 ditto 9.6 4 6.4 76 4 20 80 40 ditto 24 6 0 66.5 3.5 30 70 0 ditto
21.6 6 2.4 66.5 3.5 30 70 10 ditto 19.2 6 4.8 66.5 3.5 30 70 20 ditto 16.8 6 7.2 66.5 3.5 30 70 30 ditto 14.4 6 9.6 66.5 3.5 30 70 40 ditto 32 8 0 57 3 40 60 0 ditto
28.8 8 3.2 57 3 40 60 10 ditto 25.6 8 6.4 57 3 40 60 20 ditto 22.4 8 9.6 57 3 40 60 30 ditto 19.2 8 12.8 57 3 40 60 40 ditto 40 10 0 47.5 2.5 50 50 0 ditto 36 10 4 47.5 2.5 50 50 10 ditto 32 10 8 47.5 2.5 50 50 20 ditto 28 10 12 47.5 2.5 50 50 30 ditto 24 10 16 47.5 2.5 50 50 40 ditto 48 12 0 38 2 60 40 0 ditto
43.2 12 4.8 38 2 60 40 10 ditto 38.4 12 9.6 38 2 60 40 20 ditto 33.6 12 14.4 38 2 60 40 30 ditto 28.8 12 19.2 38 2 60 40 40 ditto 56 14 0 28.5 1.5 70 30 0 ditto
50.4 14 5.6 28.5 1.5 70 30 10 ditto 44.8 14 11.2 28.5 1.5 70 30 20 ditto 39.2 14 16.8 28.5 1.5 70 30 30 ditto 33.6 14 22.4 28.5 1.5 70 30 40 ditto 64 16 0 19 1 80 20 0 ditto
57.6 16 6.4 19 1 80 20 10 ditto 51.2 16 12.8 19 1 80 20 20 ditto 44.8 16 19.2 19 1 80 20 30 ditto 38.4 16 25.6 19 1 80 20 40 ditto
Page 23
Table 2: Different percentage by weight of epoxy and phenol resins with linseed oil pre-mixed with
phenolic resin
Sample
No.
Epoxy resin Phenlic resin
Total
mass
of
epoxy
resin
Total
mass of
phenolic
resin
Percentage
Epoxidized
linseed oil
(58%) in
phenolic
resin
temperature
and time of
curing
Hyrez 202
Part
A
Part
B
Epoxidized
linseed oil
(58%)
Phenolic
J2027L
5%
Phencat
382
15-1 8 2 0 85.5 4.5 10 90 0
4h at 80oC
& ramp to
150 oC
15-2 8 2 8.55 76.95 4.5 10 90 10 ditto
15-3 8 2 17.1 68.4 4.5 10 90 20 ditto
15-4 8 2 25.65 59.85 4.5 10 90 30 ditto
15-5 8 2 34.2 51.3 4.5 10 90 40 ditto
15-6 16 4 0 76 4 20 80 0 ditto
15-7 16 4 7.6 68.4 4 20 80 10 ditto
15-8 16 4 15.2 60.8 4 20 80 20 ditto
15-9 16 4 22.8 53.2 4 20 80 30 ditto
15-10 16 4 30.4 45.6 4 20 80 40 ditto
15-11 24 6 0 66.5 3.5 30 70 0 ditto
15-12 24 6 6.65 59.85 3.5 30 70 10 ditto
15-13 24 6 13.3 53.2 3.5 30 70 20 ditto
15-14 24 6 19.95 46.55 3.5 30 70 30 ditto
15-15 24 6 26.6 39.9 3.5 30 70 40 ditto
15-16 32 8 0 57 3 40 60 0 ditto
15-17 32 8 5.7 51.3 3 40 60 10 ditto
15-18 32 8 11.4 45.6 3 40 60 20 ditto
15-19 32 8 17.1 39.9 3 40 60 30 ditto
15-20 32 8 22.8 34.2 3 40 60 40 ditto
15-21 40 10 0 47.5 2.5 50 50 0 ditto
15-22 40 10 4.75 42.75 2.5 50 50 10 ditto
15-23 40 10 9.5 38 2.5 50 50 20 ditto
15-24 40 10 14.25 33.25 2.5 50 50 30 ditto
15-25 40 10 19 28.5 2.5 50 50 40 ditto
15-26 48 12 0 38 2 60 40 0 ditto
15-27 48 12 3.8 34.2 2 60 40 10 ditto
15-28 48 12 7.6 30.4 2 60 40 20 ditto
15-29 48 12 11.4 26.6 2 60 40 30 ditto
15-30 48 12 15.2 22.8 2 60 40 40 ditto
15-31 56 14 0 28.5 1.5 70 30 0 ditto
15-32 56 14 2.85 25.65 1.5 70 30 10 ditto
15-33 56 14 5.7 22.8 1.5 70 30 20 ditto
15-34 56 14 8.55 19.95 1.5 70 30 30 ditto
15-35 56 14 11.4 17.1 1.5 70 30 40 ditto
15-36 64 16 0 19 1 80 20 0 ditto
15-37 64 16 1.9 17.1 1 80 20 10 ditto
15-38 64 16 3.8 15.2 1 80 20 20 ditto
15-39 64 16 5.7 13.3 1 80 20 30 ditto
15-40 64 16 7.6 11.4 1 80 20 40 ditto
Page 24
Table 3: Results of ambient cured and ambient plus post-cured of the two resins.
Sample
No.
Hyrez 202 (percentage by weight)
Phenolic with 5% Phencat
382 (percentage by
weight)
Ambient cured
Ambient plus oven
cured
1 50 50 ok ok
2 60 40 x foam
3 70 30 x foam
4 80 20 x foam
5 100 0 ok ok
6 40 60 ok ok
7 30 70 too brittle ok
8 20 80 x bubbles
9 0 100 ok bubbles


![© 2019 JETIR January 2019, Volume 6, Issue 1 Fiber And ... · properties. Epoxies are less affected by water and heat than other polymer matrices [116]. 1.3 Thermal Characterization](https://static.documents.pub/doc/80x56/605e6c8ced87fd511979a81c/-2019-jetir-january-2019-volume-6-issue-1-fiber-and-properties-epoxies.jpg)


