Development of Quantitative Nanoscale Techniques for Ultra Trace Analysis of
Biological Microsamples
Jack Henion (1), Yuanyuan Li (1), Lian Shan (1), Gary A. Schultz (1), Li Sun (2) and Kevin Bateman, (2)
(1) Advion Bioanalytical Labs
(2) Merck Research Laboratories
1
2
Outline
• Background – Going Small – Microdosing – Analytical considerations
• Experimental results – Method development – Method validation results – Incurred sample analysis
• Conclusions
The Need to go Small
• We are experiencing an increasing demand to reduce study sample volumes for both animal and human studies
• We are also seeing decreases in dose • This requires:
– Miniaturization in sample collection methods – Miniaturization of sample processing methods – Improvements in overall sensitivity of the assays
4
Microdosing
• Microdose: 1/100th or less than a pharmacologically active dose, up to 100 µg * – Brings investigational drugs into humans with reduced toxicity and
side effect risks – Allows early read on human PK – Provides opportunities to reduce drug development cost and time
• Rationale for use of microdosing – Prioritization of four 2nd generation drug candidates primarily
driven by PK – Historically poor human PK prediction from preclinical data – Compounds are difficult to synthesize
* Lappin et al, 2003
5
Accelerator Mass Spectrometry (AMS) A Tough Act to Follow, but…
• Extreme sensitivity: pM to fM (10-12 – 10-15 M) in biofluids*
• Based on measuring total radioactivity, predominantly of • C-14 labeled compounds • Sample graphitization prior to detection
– Oxidation to carbon dioxide – Reduction to graphite
• Does NOT provide direct information on chemical identity; require LC separation of analyte and metabolite(s)
• Synthesis of radio-labeled compound required • More expensive than commonly used LC/MS-MS; not
available internally at most pharmaceutical companies.
* Salehpour et al, 2009
6
Project Objectives
• To develop optimized LC/MS techniques that can support regulated bioanalysis of microdose study samples using micro sample volumes (100 uL or less).
• Specific changes: – Sample sizes of 100 uL or less – Refined sample preparation – 2D trap-nanoLC – Automated nanoelectrospray
• Fully validate assays per clinical regulated bioanalysis SOP requirements.
7
First Generation HIV Integrase Inhibitor
MK-‐0518
MK-‐0518: The first marketed HIV integrase inhibitor
SIL-‐IS
*
**
*
**F
HN
O
NN
HN
O
O
N
N
OH
O
8
Microdosing Study
• Study design – Oral and intravenous doses at 50 µg – MK-0518 included as a PK benchmark against which to compare the PK of
the new drug candidates
• Analytical requirement: LLOQ 1-2 pg/mL
Panel Subject Number Period 1 † Period 2 †
I n=6 MK-A oral; 50 µg MK-A IV; 50 µg
II n=6 MK-B oral; 50 µg MK-B IV; 50 µg
III n=6 MK-C oral; 50 µg MK-C IV; 50 µg
IV n=6 MK-D oral; 50 µg MK-D IV; 50 µg
V n=6 MK-0518 oral; 50 µg MK-0518 IV; 50 µg
† At least a 7-‐day washout between periods; plasma PK samples collected for up to 48h post dose.
9
Initial Analytical Challenges
• High background chemical noise • Matrix effects • Poor assay reproducibility • Increase in column back-
pressure over time
• To reduce background noise and improve assay selectivity – Negative ion electrospray
• To enhance analyte MS response by optimizing mobile phase composition:
– Organic modifier: acetonitrile – Additive: acetic acid (“Wrong-way-round”
ionization)
MK-A plasma extract, 10 pg/mL
SPE (Waters Oasis HLB)
ESI +
MK-A plasma extract, 10 pg/mL
SPE (Waters Oasis HLB)
ESI -
Initial Assay Approach MK-0518, 1 pg/mL
MK-0518 Channel
IS Channel
Load: Acidified PL (0.9 mL) SPE: Waters Oasis HLB 96-well plate
Wash 1: 2% NH4OH Wash 2: 5% MeOH Wash 3: 5% MeOH containing 2% formic acid Wash 4: 50% MeOH
Elute: ACN
Ammonium acetate (100 mM, pH 4.5) & MTBE LLE: 96-well plate
format
Reconstitute: 30%ACN (50 µL) Inject: 5 µL
Recovery: 43%; Matrix effect: 81%* LOQ: 1 pg/mL (0.03 pg on column)
* Matrix effect (%) = [(Mean peak area of analyte spiked post-extraction) x 100] / (Mean peak area of analyte in neat reconstitution solution) 10
11
Revised Method Approach
MK-0518 Assay Preliminary Evaluation
Plasma Volume 100 µL – Target to reduce plasma volume
LC Dionex Ultimate 3000 RSLC nanoLC system and Ultimate 3000 RS column compartment;
Dionex Ultimate 3000 RS pump and Ultimate 3000 autosampler LC Packing µ-Precolumn Cartridge Acclaim PepMap 100 C18, 5 µm, 300 µm × 5 mm Thermo Acclaim PepMap 100 C18 column (3 µm, 75 µm × 15 cm) Gradient elution
MS/MS Thermo TSQ Vantage tandem mass spectrometer , ESI +
NanoElectrospray Interface Advion TriVersa Nanomate in LC coupler mode
Sample Preparation Solid-phase extraction followed by liquid-liquid extraction
Reconstitution Solution 150 µL
Injection Volume 70 µL
Relevant Experimental 2D LC/MS/MS Approach
• Trapping LC System: – Trap Column: 300 micron i.d. x 1 cm C-18, Dionex – Column flow rate: 300 uL/min – Column temperature: Ambient – Injection volume: 70 µL/150 uL – Mobile phase for trapping: 0.1% formic acid water – Mobile phase for column cleaning: 500/250/250/1 ACN/IPA/H2O/formic acid – Trapping time: 2 min
• After 5 min, the trap valve switched back for cartridge cleaning and regeneration
• Separation nanoLC system:
– Column flow rate: 0.6 µL/min – Column temperature: 70°C – Mobile Phase:
• A: 98/2 H2O/acetonitrile containing 0.1% formic acid; • B: 90/10 acetonitrile/H2O containing 0.1% formic acid
– Gradient Elution:70/30 A to 90/10 B over 10 min.
12
Loading Pump
InjecTon Valve
70°C Oven
Trap
waste Nano LC pump
14
ESI Chip LC Coupler Nano LC column
Trap, 0.3 mm by 5 mm Switching Valve
Sample loop
Nano LC column, 0.075 mm by 150 mm Dionex Pepmap C18; 600 nL/min
70 microliters loaded
2-D Trap-Nano LC Valve Configuration
TriVersa NanoMate® with ESI Chip™ Provides Automated Nano Electrospray
• Robust • Reproducible • Spray Sensing • Switches emitters in 3 sec if
spray falters
15
RT: 0.00 - 6.00 SM: 7G
0.0 0.5 1.0 1.5 2.0 2.5 3.0 3.5 4.0 4.5 5.0 5.5 6.0Time (min)
0
10
20
30
40
50
60
70
80
90
1000
10
20
30
40
50
60
70
80
90
100
Re
lative
Ab
un
da
nce
NL: 4.41E3TIC F: + c NSI SRM ms2 445.150 [361.100-361.200] MS ICIS 2 4 MK-0518 STD1 1 1
NL: 4.70E5TIC F: + c NSI SRM ms2 451.200 [367.050-367.150] MS ICIS 2 4 MK-0518 STD1 1 1
16
Revised Assay Optimization
MK-‐0518 Channel
IS Channel
MK-‐0518, 0.5 pg/mL Load: Acidified PL (0.1 mL) SPE: Waters Oasis
HLB 96-‐well plate
Wash 1: 2% NH4OH Wash 2: 5% MeOH Wash 3: 5% MeOH containing 2% formic acid Wash 4: 50% MeOH
Elute: ACN
Ammonium acetate (100 mM, pH 4.5) & MTBE LLE: 96-‐well plate
format
ReconsStute: 0.1% FA H2O (150 µL); Inject: 70 µL
Recovery: 60%; Matrix effect: 50% LOQ: 0.5 pg/mL (0.007 pg on column) 30 Sec
Low and Middle QC’s for MK-0518
17
RT: 0.00 - 6.00 SM: 7G
0.0 0.5 1.0 1.5 2.0 2.5 3.0 3.5 4.0 4.5 5.0 5.5 6.0Time (min)
0
5
10
15
20
25
30
35
40
45
50
55
60
65
70
75
80
85
90
95
100
Relati
ve Abu
ndance
NL: 9.15E3TIC F: + c NSI SRM ms2 445.150 [361.100-361.200] MS ICIS 2 21 MK-0518 LQC1 6 1Low QC at 1.5 pg/mL
RT: 0.00 - 6.00 SM: 7G
0.0 0.5 1.0 1.5 2.0 2.5 3.0 3.5 4.0 4.5 5.0 5.5 6.0Time (min)
0
5
10
15
20
25
30
35
40
45
50
55
60
65
70
75
80
85
90
95
100
Relativ
e Abun
dance
NL: 4.58E5TIC F: + c NSI SRM ms2 445.150 [361.100-361.200] MS ICIS 2 67 MK-0518 MQC 6 1Middle QC at 150 pg/mL
Incurred Samples
RT: 0.00 - 6.00 SM: 7G
0.0 0.5 1.0 1.5 2.0 2.5 3.0 3.5 4.0 4.5 5.0 5.5 6.0Time (min)
0
10
20
30
40
50
60
70
80
90
1000
10
20
30
40
50
60
70
80
90
100
Relat
ive Ab
unda
nce
NL: 3.31E5TIC F: + c NSI SRM ms2 445.150 [361.100-361.200] MS ICIS 2 27 MK-0518 414730005226 0027 E1 P1 Day 1 3h PLM-
NL: 2.36E5TIC F: + c NSI SRM ms2 451.200 [367.050-367.150] MS ICIS 2 27 MK-0518 414730005226 0027 E1 P1 Day 1 3h PLM-
RT: 0.00 - 6.00 SM: 7G
0.0 0.5 1.0 1.5 2.0 2.5 3.0 3.5 4.0 4.5 5.0 5.5 6.0Time (min)
0
5
10
15
20
25
30
35
40
45
50
55
60
65
70
75
80
85
90
95
100
Relativ
e Abund
ance
NL: 9.25E3TIC F: + c NSI SRM ms2 445.150 [361.100-361.200] MS 2 33 MK-0518 414730005232 0027 E1 P1 Day 1 16h PLM
(Day 1, 3h)
(Day 1, 16h)
IS
Calibration Curve
19
0
0.05
0.1
0.15
0.2
0 5 10 15 20 25 30
Intr
umen
t res
pons
e
Concentration (pg/mL)
20
Intra-Run Variability
a Weighted least squares linear regression; WeighTng factor = 1/X2 b n=6
LQC1 LQC2 MQC HQC Theor. Conc. (pg/mL) 1.5 3 150 1500 Mean (pg/mL) 1.36 3.04 145 1410 %CV 5.5 8.2 2.9 1.6 %Theoretical 90.7 101.3 96.7 94 Mean (pg/mL) 1.46 2.62 143 1450 %CV 5 5 2.4 2.6 %Theoretical 97.3 87.3 95.3 96.7 Mean (pg/mL) 1.34 2.52 141 1430 %CV 9.5 6.5 0.5 0.5 %Theoretical 89.3 84 94 95.3
21
Inter Run LLOQ Precision & Accuracy at 0.5 pg/mL for MK-0518
a n=5, tested on 3 different days; b n = 3
Run1 Run2 Run3 Theor. Conc. (pg/mL) 0.5 0.5 0.5 Found Conc. (pg/mL) #1 0.476 0.533 0.539 #2 0.53 0.461 0.492 Mean (pg/mL) 0.503 0.497 0.516 S.D. 0.0382 0.0509 0.0332 %CV 7.6 10.2 6.4 %Theoretical 100.6 99.4 103.2 n 2 2 2
Method Comparison
• Original Method • (1 pg/mL x 0.9 mL)/0.05 mL
– =18 pg/mL x 0.005 mL injected – =0.09 pg or 90 femtograms on column
• New Method • (0.5 pg/mL x 0.1 mL)/0.15 mL
– = 0.33 pg/mL x 0.070 mL injected – =0.023 pg or 23 femtograms on column
9x less plasma and 4x less loaded = 36x improvement
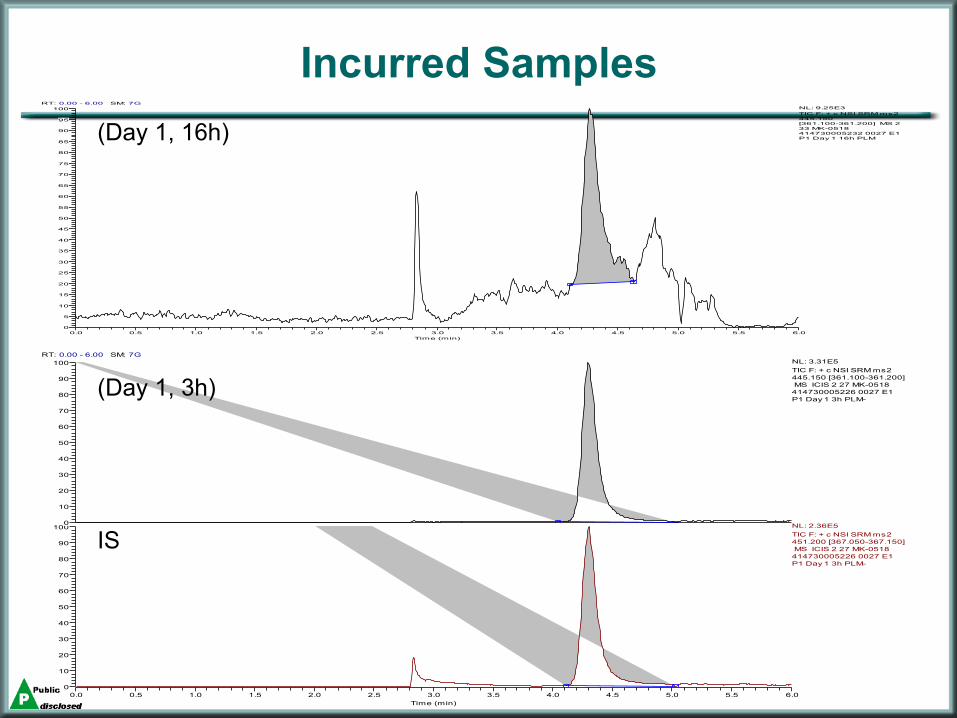
PK Curve for Incurred MK-0518
NanoLCMS LCMS
LC/MS 16 hours terminal elimination
2D Trap nanoLC/MS 24 hours terminal elimination
Summary
• The demand to reduce sample volumes and LLOQ’s is driving the need for improved bioanalytical techniques including robust and dependable nanoLC/MS
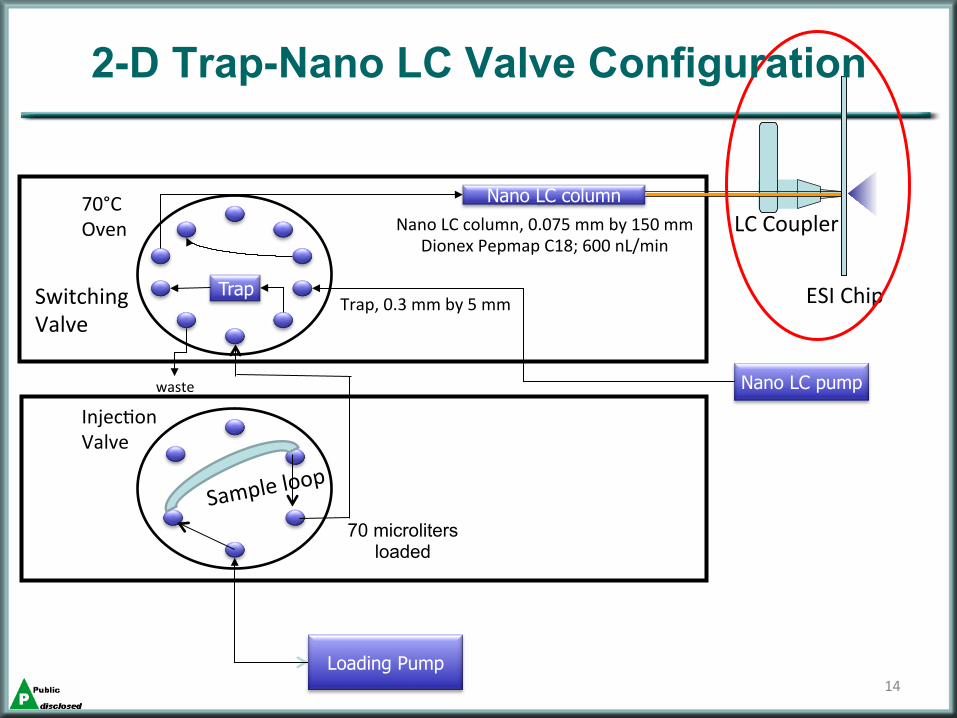
• 2D trap-nanoLC/ESI provided improved LLOQ (0.5 pg/mL) using 1/10 the volume of plasma – Trap column allows trace-enrichment of dilute extract for transfer to
second nanoLC dimension – Bioanalysis done with automated chip-based nano ESI – Monitor of terminal elimination was improved by 8 hours for 50 ug
incurred dose
• Planned Improvements – Negative ion nanoESI should improve S/N as previously demonstrated. – Nano UPLC is expected to provide additional improvements in LLOQ
25
NanoAcquity coupled with AB Sciex 5500 QTRAP-TriVersa NanoMate or Chip-Mate
Nano ESI with TriVersa NanoMate Nano ESI with new Chip-‐Mate
2 pg/mL Fortified in Human Plasma
XIC of +MRM (2 pairs): 445.200/361.100 Da from Sample 92 (0518_STD3_2 pg/mL_01_CM) of DataMK... Max. 1989.8 cps.
7.5 8.0 8.5 9.0 9.5 10.0 10.5 11.0Time, min
0
200
400
600
800
1000
1200
1400
1600
1800
1990
Intensity, cps
8.74 MK-‐0518
2 pg/mL in plasma
On Chipmate
XIC of +MRM (2 pairs): 445.200/361.100 Da from Sample 65 (0518_STD3_2 pg/mL_01) of DataMK-051... Max. 3186.8 cps.
7.5 8.0 8.5 9.0 9.5 10.0 10.5 11.0Time, min
0
200
400
600
800
1000
1200
1400
1600
1800
2000
2200
2400
2600
2800
3000
3187
Intensity, cps
8.63
MK-‐0518
2 pg/mL in plasma
On TriVersa
10 Sec
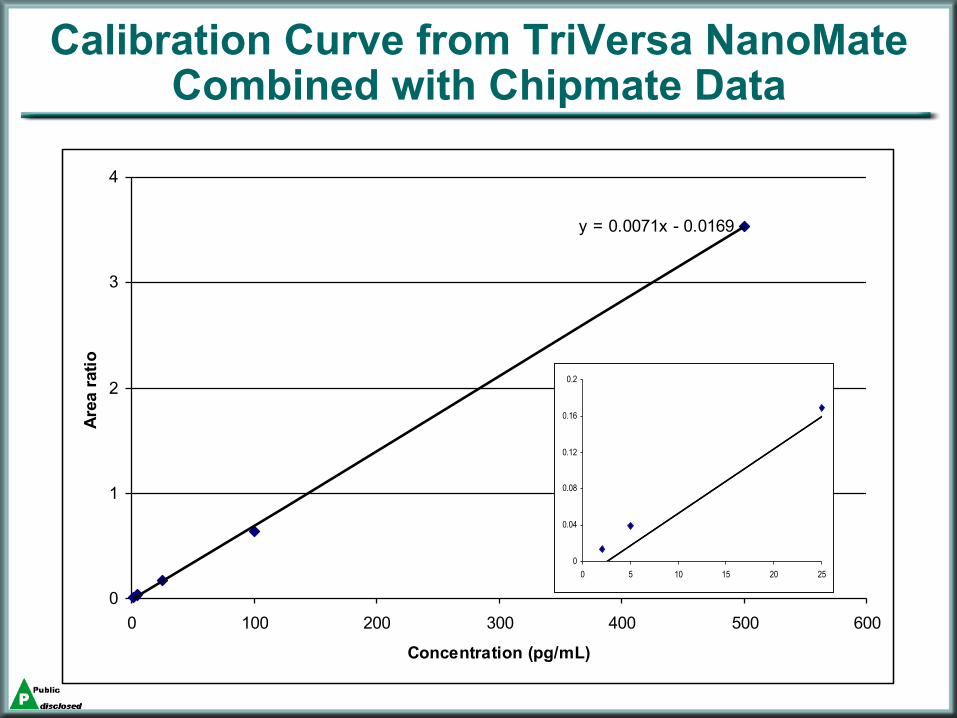
Calibration Curve from TriVersa NanoMate Combined with Chipmate Data
y = 0.0071x - 0.0169
0
1
2
3
4
0 100 200 300 400 500 600
Concentration (pg/mL)
Area
ratio
0
0.04
0.08
0.12
0.16
0.2
0 5 10 15 20 25
Summary
• The recent data show a much reduced chemical background
• Much narrower nano LC peaks
• And potentially improved (lowered) LLOQ’s based upon even smaller microsamples
Trizaic-TQS: combine sensitivity in low flow chromatography and robustness of the nanochip
LC connections
Trizaic chip
Trizaic lock
Emitter
Liquid connections Jose Castro-Perez"
Captive Spray - Vantage
0 2 4 6 8 100
2.0×10⁶
4.0×10⁶
6.0×10⁶
8.0×10⁶
QC Samples
Peak
Are
a
Trizaic - TQS
0 2 4 6 8 10 12 140
2.0×10⁴
4.0×10⁴
6.0×10⁴
8.0×10⁴
QC Samples
Peak
Are
a
Before: Signal dropped 50% over 50 injections. (NanoEase 300umx50mm, 10µL/min, 20µL injection)
Current: Signal variability was 3.5% over 800 injections. (Trizaic, 3µL/min, 3µL injection)
Signal/Noise improved and more stable over 800 injections of plasma digests
Source block after 1400 plasma injections using Nanotile – Off axis spraying
Source block
Sample cone relatively clean
Bulls-eye plasma deposit non-volatile material
Future Developments
• Micro and Nano techniques for sample collection, processing and analysis are becoming more robust. – Several companies producing new products
• The need for analysis of smaller samples while improving the lower limits of quantification are helping to drive the science forward.
• Lessons learned from protein and peptide analysis are being translated to small molecule bioanalysis and visa versa.