DEVELOPMENT OF REAL-TIME ULTRASONIC SENSORING SYSTEM TO MEASURE DISTANCE USING LABVIEW NORSUKMAWATI BINTI ISHAK This thesis is submitted as partial fulfillment of the requirements for the award of the Bachelor of Electrical Engineering (Hons.) (Electronics) Faculty of Electrical & Electronics Engineering Universiti Malaysia Pahang JUNE 2012
Transcript
DEVELOPMENT OF REAL-TIME ULTRASONIC SENSORING SYSTEM TO
MEASURE DISTANCE USING LABVIEW
NORSUKMAWATI BINTI ISHAK
This thesis is submitted as partial fulfillment of the requirements for the award of the
Bachelor of Electrical Engineering (Hons.) (Electronics)
Faculty of Electrical & Electronics Engineering
Universiti Malaysia Pahang
JUNE 2012
v
ABSTRACT
This project involves the implementing of ultrasonic sensor for industrial
related applications in real-time. Ultrasonic sensor works on the area from 40 KHz to
400 KHz. To detect the distance of the object, ultrasonic sensor measures the time
from the transmission of sonic wave to reception of the sonic wave. In process
industry, it present the ideal solution to level detection of non-contact level sensing
of highly viscous liquids in process industry. It also used to measurement of flow,
crack detection and tank level measurement. The sensor system should have DAQ
capabilities using NI DAQ card USB-6009. By using the DAQ card, the data will be
transfer from sensor to computer. Input and output data will be transfer through
digital signals or analog signals or channels. DAQ card operate by utilizing both
DAQ hardware and software. By using the LabVIEW programming language, the
interface for the sensor system will be developed and LabVIEW also used to
communicate with DAQ hardware. In LabVIEW, we build a block diagram contains
to control the front panel objects. The developed sensor should capable of
measurement in real-time. The system also capable for data storage and data retrieval
for further analysis.
ABSTRAK
Projek ini melibatkan pelaksanaan sensor ultrasonik bagi aplikasi industri
berkaitan dalam masa nyata. Sensor ultrasonik bekerja di kawasan dari 40 KHz
hingga 400KHz. Untuk mengesan jarak objek, sensor ultrasonik mengukur masa
bermula daripada penghantaran gelombang sonik hingga penerimaan gelombang
sonik. Dalam industri proses, sensor ultrasonik adalah penyelesaian yang ideal untuk
mengesan tahap penderiaan cecair yang sangat likat di dalam industri proses. Ia juga
digunakan untuk pengukuran aliran, pengesanan retak dan pengukuran tahap tangki.
Sistem sensor ini perlu mempunyai keupayaan pemerolehan data menggunakan NI
DAQ USB-6009. Dengan menggunakan kad DAQ, data akan dipindahkan dari
sensor ke komputer. Data input dan output akan dipindahkan melalui isyarat digital
atau isyarat analog atau saluran. Kad DAQ beroperasi dengan mengunakan kedua-
dua perkakasan dan perisian DAQ. Dengan menggunakan bahasa pengaturcaraan
LabVIEW, antara muka untuk sistem sensor akan dibangunkan dan LabVIEW juga
digunakan untuk berkomunikasi dengan perkakasan DAQ. Di LabVIEW, kita
membina gambarajah blok untuk mengawal objek panel hadapan. Sistem sensor ini
seharusnya mampu mengukur dalam masa nyata. Sistem ini juga mampu untuk
menyimpan dan mendapatkan kembali data untuk analisis selanjutnya.
TABLE OF CONTENTS vi
CHAPTER TITLE PAGE
DECLARATION OF THESIS’S STATUSDECLARATION OF SUPERVISORTITLEDECLARATION iiDEDICATION iiiACKNOWLEDGEMENT ivABSTRACT vTABLE OF CONTENT viLIST OF FIGURES viiiLIST OF TABLES ix
2 LITERATURE REVIEWS 42.1 Introduction 42.2 Overview of ultrasonic sensors 42.2.1 Ultrasonic sensor principle 62.2.2 Ultrasonic sensor applications 142.2.3 LV-MaxSonar-EZ1 192.3 NI LabVIEW 212.3.1 The Overview of the LabVIEW 212.4 NI DAQ 232.4.1 NI USB-6009 25
3 METHODOLOGY 273.0 Flow Chart 273.1 Hardware development 283.2 Software development 30
vii
4 Results and Discussions. 344.1 Results and discussions 344.2 Problems of project 43
2.1 Two port network representation of piezoelectric 6
transmitter and receiver.
2.2 Equivalent circuit of a transmitter. 7
2.3 Ideal equivalent circuit of transmitter. 8
2.4 Equivalent circuit of a transmitter with m, B and 1/K 8
reflected in the primary side.
2.5 Magnitude plot of transmitter. 9
2.6 Phase plot of transmitter. 9
2.7 Transmission of ultrasonic signal in between two 10
mediums.
2.8 Measuring Scheme. 12
2.9 Reflected means of ultrasonic signal. 13
2.10 Mounted Ultrasonic Sensors. 17
2.11 Echo-ranging level sensing. 18
2.12 LV-MaxSonar-EZ1. 19
2.13 LV-MaxSonar pin out 20
2.14 LabVIEW. 21
2.15 LabVIEW front panel. 22
2.16 LabVIEW block diagram. 23
2.17 Configuration of data acquisition. 24
2.18 NI USB-6009 25
3.1 Configuration of project circuit. 28
3.2 Connection between LV-MaxSonar-EZ 28
and NI USB-6009.
3.3 LabVIEW front panel of the system. 30
3.4 LabVIEW block diagram. 32
4.1 Graph of voltage and distance measurement. 34
4.2 Graph of average voltage versus distance. 36
4.3 Graph of voltage versus distance for different 41
materials.
4.4 Result measurement for box. 41
4.5 Result measurement for aluminium 42
4.6 Result measurement for plastic 42
ix
LIST OF TABLES.
TABLE NO. TITLE PAGE
2.1 Characteristic Impedance of few materials. 11
2.2 Signal descriptions of NI USB-6009 26
4.1 Voltage output of ultrasonic sensor 36
Versus distance.
4.2 Voltage output of ultrasonic sensor 40
Versus distance for different materials.
1
CHAPTER 1
INTRODUCTION.
1.1 Background
This project involves the implementing of ultrasonic sensor for industrial
related applications in real-time. Ultrasonic sensor works on the area from 40 KHz to
400 KHz. To determine the distance to an object, the time interval from sending and
receiving echo will be calculated.
To develop interface for the sensor system, LabVIEW software will be used.
Graphical User Interface (GUI) will be created to provide a user friendly system and
the analysis can be performed faster and easier.
To determine the distance, the sensor will be connected to computer by using
NI DAQ card. The LabVIEW program record and measure voltage from the sensor.
A graph will be executed after acquiring the analog voltage from the sensor, and the
voltage signal will display in time domain. By using a certain formula, we can
convert this voltages to distance. The results are saved at one file.
1.2 Objective 2
i. To design working prototype of ultrasonic sensor system.
ii. To display result in real-time by using LabVIEW.
iii. To learn the flow of data/or data conversion/data DAQ system.
iv. To understand the operation of the circuit and applications of this system.
v. To implement working ultrasonic system for industrial based application.
1.3 Scope Project
i. Implement the real-time concept in distance monitoring system.
ii. Concentrate on measuring the distance using ultrasonic sensor
iii. Develop interface for the sensor system using LabVIEW.
iv. Saving file.
1.4 Problem Statement
In process industries, liquids is require to be pump, store in tanks, then pump
to another tank and many times will be process by chemical or mixing treatment
in the tanks. The basic problems are the level of fluid in a tank must always be
monitored and controlled and the liquid flow between the tanks requires
regulation at certain desired rate.
For future, this project, may contribute to overcome this problems. The level
of fluid can be measured by using ultrasonic principle and can always be
monitored in real-time by using LabVIEW programming language.
1.5 Thesis Arrangement 3
This thesis has 6 chapters which are Introduction, Literature Review, Hardware
Design, Software Design, Result and Discussion, and Conclusion and Further
Development of the project.
Chapter 1 will be discussed about the introduction of project. The contains
includes basic idea of the project, the objective and overview of the project.
Chapter 2 will be discussed about the literature review. The contains includes the
components that is use in this project. This chapter also contains the related
methodologies from variety of sources for the development of this project.
Chapter 3 will be discussed about the design and methodology of the project. The
contains includes General concept of the project like the components that have
been used and also will be discussed about the simulation of the circuit. The
concept idea of simulation will be discussed.
Chapter 4 will be discussed about the result and discussion. The limitation barrier
in completing this project also will be discussed.
Lastly, chapter 5 will be discussed about the conclusion and further development
of this project.
4
CHAPTER 2
LITERATURE REVIEW
2.1 Introduction
For completing this project, some literature reviews from several resources
have been done as the guidance to complete this project. Some applications that
similar to this project also will be discussed.
2.2 Overview of Ultrasonic Sensors
Ultrasonic sensor works on the area from 40 KHz to 400 KHz. To determine
the distance, sensors calculate the time interval between sending the signal and
receiving the echo. [1] The term ultrasonic refers to mechanical or acoustical waves
of frequency more than 20 kHz. Systems typically use a transducer which generates
sound waves in the ultrasonic range, above 18,000 hertz, by turning electrical energy
into sound, then upon receiving the echo turn the sound waves into electrical energy
which can be measured and displayed. [1] An electro acoustic transducer is a device
that converts electrical energy to acoustical energy or vice versa.
5
The ultrasonic distance sensor can be operated in two different modes. The
first mode, referred to as continuous (or analog) mode, involves the sensor
continuously sending out sound waves at a rate determined by the manufacturer. The
second mode, called clock (or digital) mode, involves the sensor sending out signals
at a rate determined by the user. [3] This rate can be several signals per second with
the use of a timing device, or it can be triggered intermittently by an even such as the
press of a button.
With respect to sensing and measurements, high frequency avoids
interference from many audible, low frequency noises due to wind, machinery,
pumps and vibration of large bodies. High frequency allows resolution of “the small”
in both the temporal and spatial senses. The major benefit of ultrasonic distance
sensor is their ability to measure difficult target; solids, liquids, powders and even
transparent and highly reflective materials that would cause problems for optical
sensor. In addition, analog output ultrasonic sensors offer comparatively long ranges,
in many cases > 3 m. They can also be very small - some tubular models are only 12
mm in diameter, and 15 mm x 20 mm x 49 mm square-bodied versions are available
for limited - space applications. [3] When used for sensing functions, the ultrasonic
method has unique advantages over conventional sensors such as infrared or reverse
sensor. [4] By using ultrasonic method, the discrete distances to moving objects can
be detected and measured. The measurement of ultrasonic sensor also less affected
by target materials and surfaces, and not affected by color. Solidstate units have
virtually unlimited, maintenance free life. Ultrasonic sensors also have ability to
detect small objects over long operating distances and have resistance to external
disturbances such as vibration, infrared radiation, ambient noise, and EMI radiation.
The technology is limited by the shapes of surfaces and the density or
consistency of the material. For example foam on the surface of a fluid in a tank
could distort a reading. Turbulence, vapors, and changes in the concentration of the
process material also affect the ultrasonic sensor’s response. [1] Ultrasonic sensors
have limitations due to their wide beam-width, sensitivity to specular surfaces [6],
6
and the inability to discern objects within 0.5 m [7]. Because of the typical specular
nature of the ultrasonic waves reflection, only reflecting objects that are almost
normal to the sensor acoustic axis may be accurately detected [8].
2.2.1 Ultrasonic Sensor Principle
The ultrasonic measurement system consists of an ultrasonic transmitter, the
transmission medium, and an ultrasonic receiver. The commonly used ultrasonic
sensors are the piezoelectric sensing elements.
Transmitter Receiver
Figure 2.1.: Two port network representation of piezoelectric transmitter and
receiver. [21]
As we know piezoelectric effect is reversible, the ultrasonic transmitter uses
the inverse piezoelectric effect i.e. if a voltage is applied to the transmitter the crystal
will undergo a corresponding deformation. The vibration of the crystal is transmitted
through the media from one end to the other. The particle displacement sets up an
accompanying pressure which is picked up by the receiver. The receiver use the
direct piezoelectric effect and converts the force into the corresponding voltage.
7
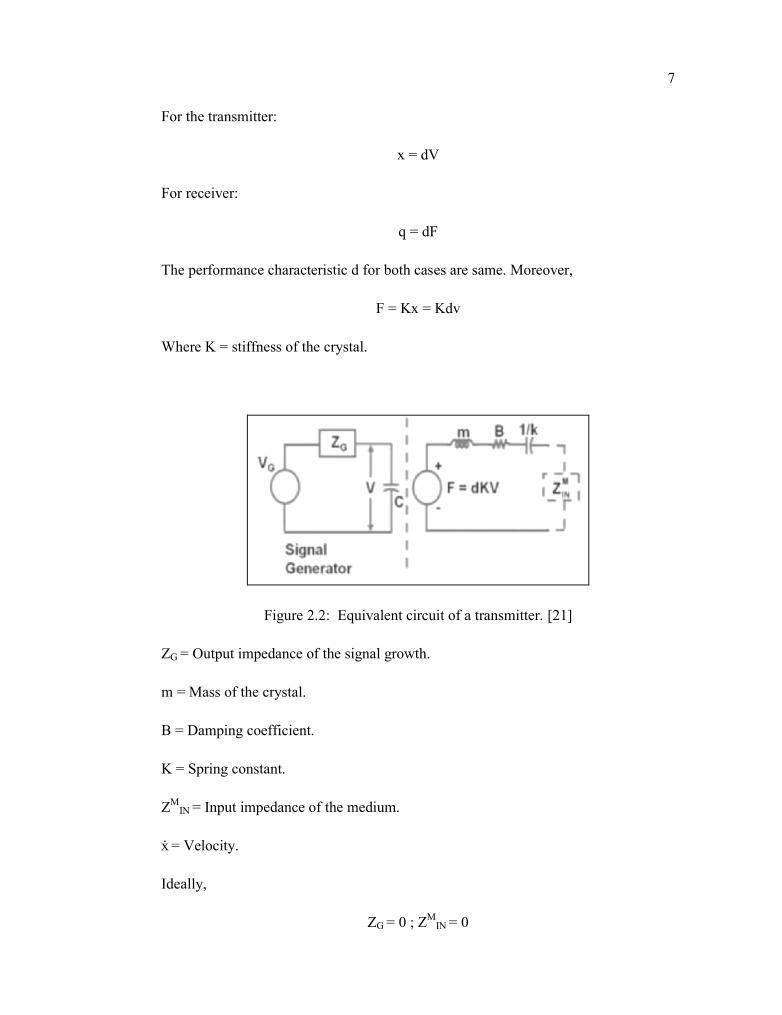
For the transmitter:
x = dV
For receiver:
q = dF
The performance characteristic d for both cases are same. Moreover,
F = Kx = Kdv
Where K = stiffness of the crystal.
Figure 2.2: Equivalent circuit of a transmitter. [21]
ZG = Output impedance of the signal growth.
m = Mass of the crystal.
B = Damping coefficient.
K = Spring constant.
ZMIN = Input impedance of the medium.
ẋ = Velocity.
Ideally,
ZG = 0 ; ZMIN = 0
8
Figure 2.3: Ideal equivalent circuit of transmitter.[21]
Figure 2.4: Equivalent circuit of transmitter with m, B and 1/K reflected in the
primary side.[21]
Where L1 = m/(dk)2 ; R1 = B/(dk)2 ; C1 = d2k.
Overall impedance = H(s) or 1
Therefore,
9
Thus, we have two natural frequencies:
ωn (series natural frequency) =
ωp ( parallel resonant frequency) =
Figure 2.5: Magnitude plot of transmitter.[21]
At ω = ωn magnitude is minimum whereas it is maximum at ω = ωp
Assuming R1 = 0
Figure 2.6: Phase plot of transmitter.[21]
10
At ω = ωn and ω = ωp the system is resistive. When R1≠ 0 the above diagram shiftstowards the right hand side. This circuit behaves as an inductor between ωn and ωp.
Transmission of ultrasound:
If P = pressure or stress
x. = u = velocity
Characteristic impedance:
Z = P/u
Power intensity:
W = P*u
Average power intensity:
Figure 2.7: Transmission of ultrasonic signal in between two medium. [21]Z1 = Characteristic Impedance of medium 1
Z2 = Characteristic Impedance of medium 2
WI = Incident power intensity
WR = Reflected power intensity
WT = Transmitted power intensity
11
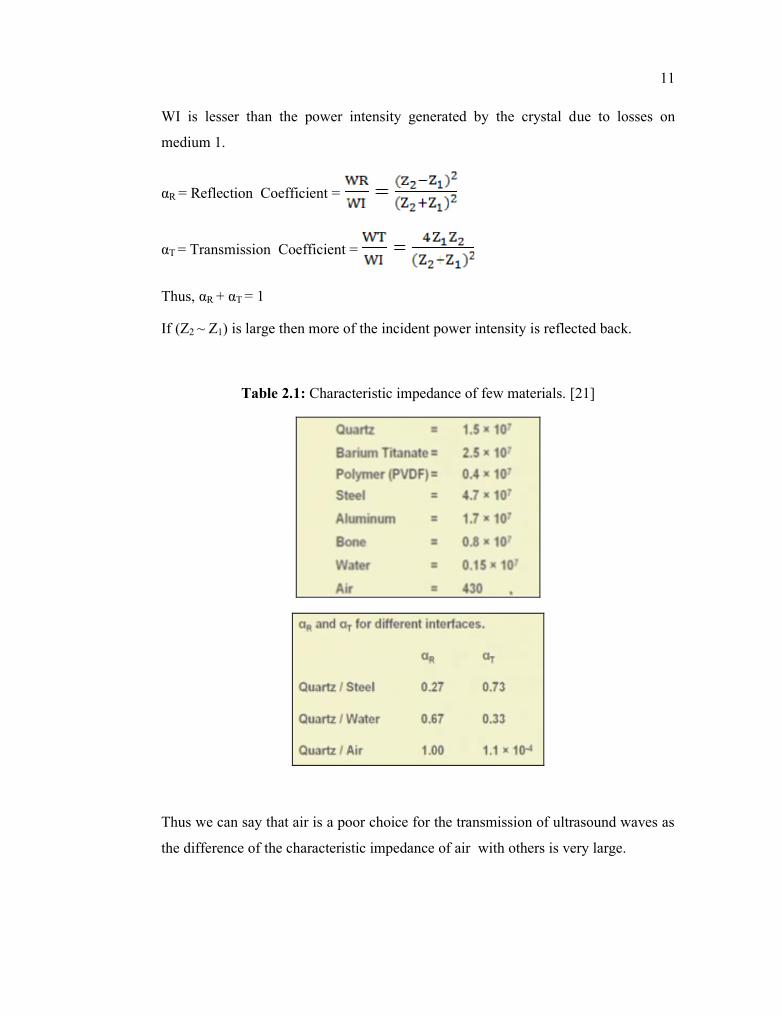
WI is lesser than the power intensity generated by the crystal due to losses on
medium 1.
αR = Reflection Coefficient =
αT = Transmission Coefficient =
Thus, αR + αT = 1
If (Z2 ~ Z1) is large then more of the incident power intensity is reflected back.
Table 2.1: Characteristic impedance of few materials. [21]
Thus we can say that air is a poor choice for the transmission of ultrasound waves as
the difference of the characteristic impedance of air with others is very large.
12
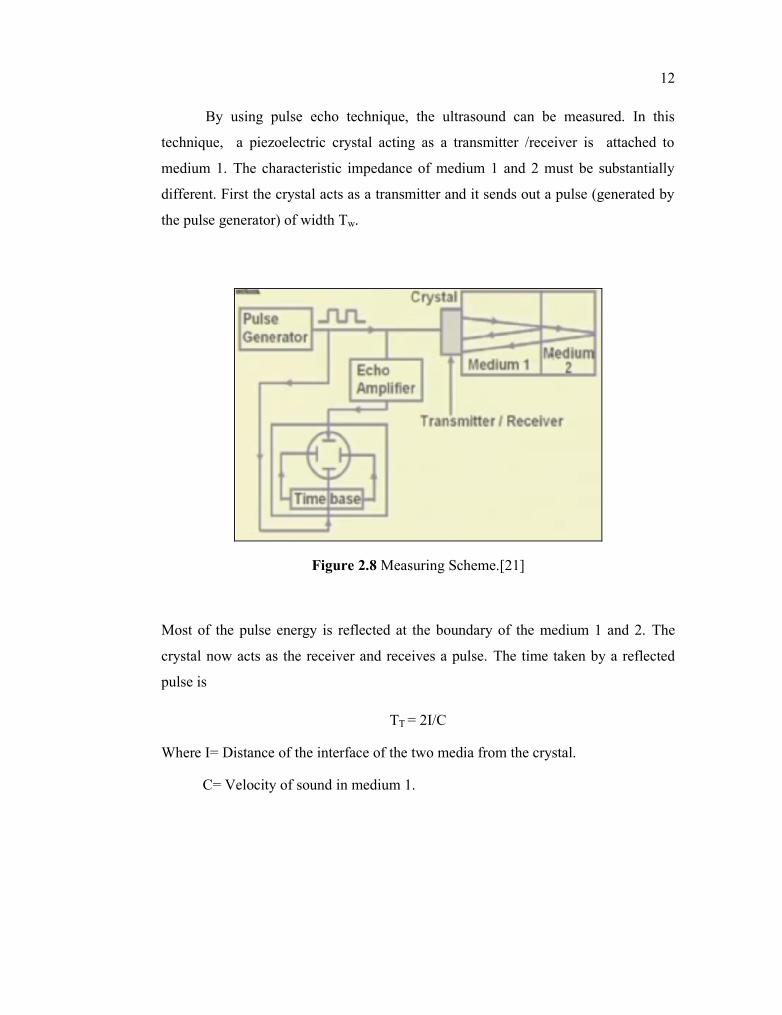
By using pulse echo technique, the ultrasound can be measured. In this
technique, a piezoelectric crystal acting as a transmitter /receiver is attached to
medium 1. The characteristic impedance of medium 1 and 2 must be substantially
different. First the crystal acts as a transmitter and it sends out a pulse (generated by
the pulse generator) of width Tw.
Figure 2.8 Measuring Scheme.[21]
Most of the pulse energy is reflected at the boundary of the medium 1 and 2. The
crystal now acts as the receiver and receives a pulse. The time taken by a reflected
pulse is
TT = 2I/C
Where I= Distance of the interface of the two media from the crystal.
C= Velocity of sound in medium 1.
13
Figure 2.9: Reflected means of ultrasonic signal.[21]
The Repetition Rate TR should be such that all the reflected pulses of interest have
been observed before sending the 2nd pulse. The transmit time TT should be large
compared to the pulse width Tw to avoid interference between outgoing pulse and
incoming or reflected pulse.
The advantages of ultrasonic sensor are it is easy to direct and focus a beam
of ultrasound as diffraction of these waves are small due to their short wavelength
and ultrasonic waves can easily pass through metals. This helps in mounting the
measurement system outside the system and it will lead to the development of non-
invasive sensor.
14
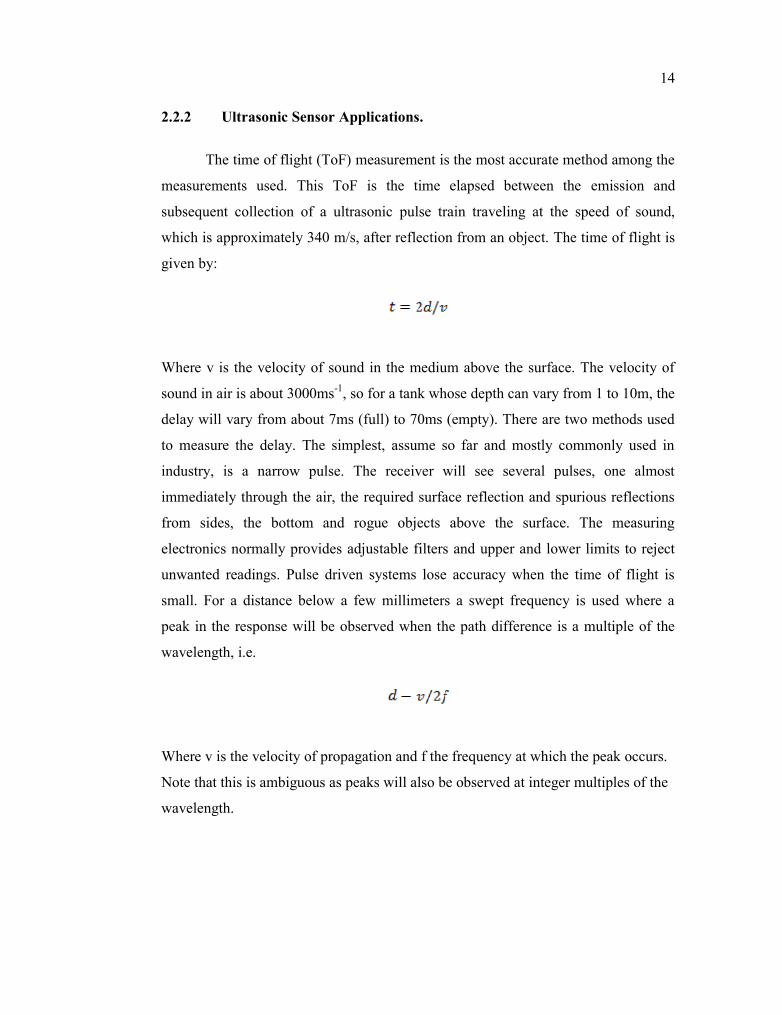
2.2.2 Ultrasonic Sensor Applications.
The time of flight (ToF) measurement is the most accurate method among the
measurements used. This ToF is the time elapsed between the emission and
subsequent collection of a ultrasonic pulse train traveling at the speed of sound,
which is approximately 340 m/s, after reflection from an object. The time of flight is
given by:
Where v is the velocity of sound in the medium above the surface. The velocity of
sound in air is about 3000ms-1, so for a tank whose depth can vary from 1 to 10m, the
delay will vary from about 7ms (full) to 70ms (empty). There are two methods used
to measure the delay. The simplest, assume so far and mostly commonly used in
industry, is a narrow pulse. The receiver will see several pulses, one almost
immediately through the air, the required surface reflection and spurious reflections
from sides, the bottom and rogue objects above the surface. The measuring
electronics normally provides adjustable filters and upper and lower limits to reject
unwanted readings. Pulse driven systems lose accuracy when the time of flight is
small. For a distance below a few millimeters a swept frequency is used where a
peak in the response will be observed when the path difference is a multiple of the
wavelength, i.e.
Where v is the velocity of propagation and f the frequency at which the peak occurs.
Note that this is ambiguous as peaks will also be observed at integer multiples of the
wavelength.
15
The method discussed above can be used for the following cases with ease.
a) Level measurement. [21]
It is to be noted that the crystal must be placed at the bottom and not at the top. If
placed at the top due to presence of air no wave will be able to propagate thus giving
us erroneous measurement.
b) Crack detection. [21]
Here crack or gap acts as the second medium and thus helps us to detect where the
crack has taken place.
16
Both methods require accurate knowledge of the velocity of propagation. The
velocity of sound is 1440ms-1 in water, 3000ms-1 in air and 5000ms-1 in steel. It is
also temperature dependent varying in air by 1% for a 300C temperature change.
Pressure also has an effect. If these changes are likely to be significant they can be
measured and correction factors applied. The speed of sound in air varies as a
function of temperature by the relationship [11]:
where:
c(T) = speed of sound in air as a function of temperature in inches per secondT = temperature of the air in °C
The wavelength of sound changes as a function of both the speed of sound and thefrequency, as shown by the expression:
λ = c/fwhere:
λ = wavelengthc = speed of lightf = frequency
As the sound travels, the amplitude of the sound pressure is reduced due to
friction losses in the transmission medium. Knowing the value of this absorption
loss, or attenuation, is crucial in determining the maximum range of a sensor. The
attenuation of sound in air increases with the frequency, and at any given frequency
the attenuation varies as a function of humidity. The value of humidity that produces
the maximum attenuation is not the same for all frequencies. [12,14] Above 125 kHz,
for example, the maximum attenuation occurs at 100% RH; at 40 kHz, maximum
attenuation occurs at 50% RH. Since an ultrasonic sensor usually is required to
operate at all possible humidities, target range calculations should use the largest
value of attenuation.
17
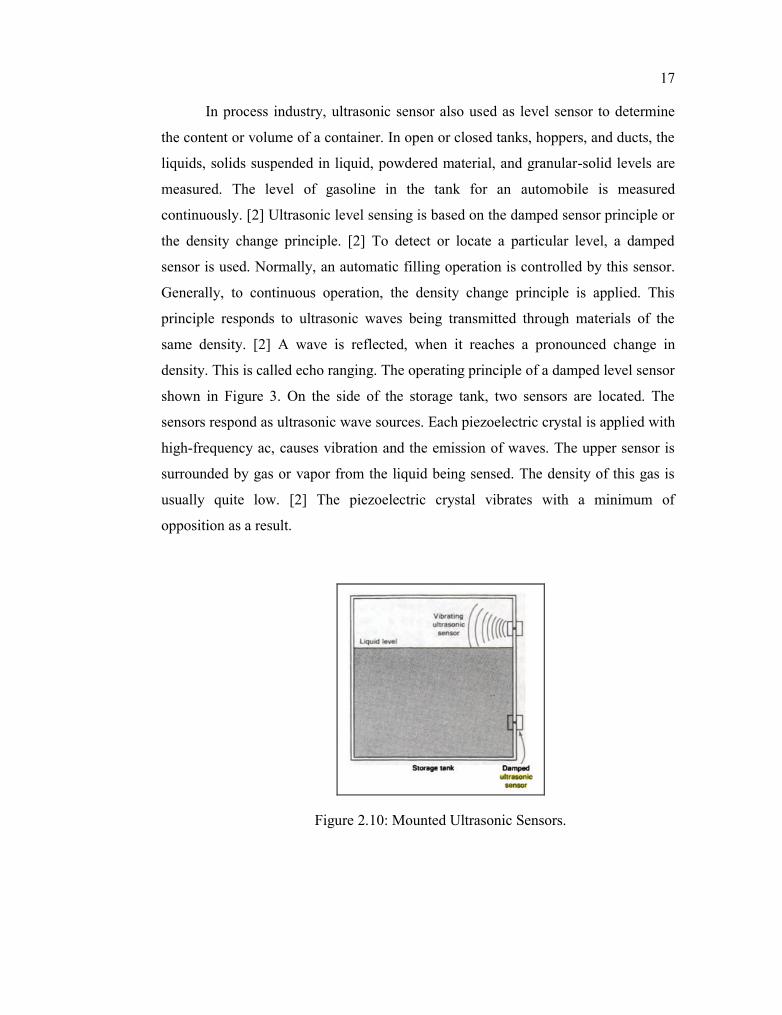
In process industry, ultrasonic sensor also used as level sensor to determine
the content or volume of a container. In open or closed tanks, hoppers, and ducts, the
liquids, solids suspended in liquid, powdered material, and granular-solid levels are
measured. The level of gasoline in the tank for an automobile is measured
continuously. [2] Ultrasonic level sensing is based on the damped sensor principle or
the density change principle. [2] To detect or locate a particular level, a damped
sensor is used. Normally, an automatic filling operation is controlled by this sensor.
Generally, to continuous operation, the density change principle is applied. This
principle responds to ultrasonic waves being transmitted through materials of the
same density. [2] A wave is reflected, when it reaches a pronounced change in
density. This is called echo ranging. The operating principle of a damped level sensor
shown in Figure 3. On the side of the storage tank, two sensors are located. The
sensors respond as ultrasonic wave sources. Each piezoelectric crystal is applied with
high-frequency ac, causes vibration and the emission of waves. The upper sensor is
surrounded by gas or vapor from the liquid being sensed. The density of this gas is
usually quite low. [2] The piezoelectric crystal vibrates with a minimum of