Programa de Desenvolvimento Rural, Sofala DEVELOPMENT OF SCENARIOS FOR THE CANDA COMMUNITY, SOFALA PROVINCE, MOZAMBIQUE Rob Cunliffe 02 September 2004 República de Moçambique Um programa do Ministério da Agricultura e Desenvolvimento Rural e da Cooperação Técnica Alemã
Transcript
Programa de Desenvolvimento Rural, Sofala
DEVELOPMENT OF SCENARIOS FOR THE CANDA COMMUNITY,
SOFALA PROVINCE, MOZAMBIQUE
Rob C02 Septe
República de Moçambique Um programa do Min i s té r io da Agr i cu l tu ra e Dese
unliffe
mber 2004
nvo lv imen to Rura l e da Cooperação Técn ica A lemã
2
CONTENTS LIST OF ABBREVIATIONS............................................................................................................3 SUMMARY.......................................................................................................................................4 1. INTRODUCTION ...................................................................................................................5
1.1 Purpose of This Study...........................................................................................................6 2. METHODS ..............................................................................................................................7
2.1 Situation Analysis...............................................................................................................10 2.2 Possible Contrasting Futures for Canda .............................................................................11 2.3 Writing the Scenarios .........................................................................................................12
3. SITUATION ANALYSIS .....................................................................................................13 3.1 Basic Needs ........................................................................................................................13 3.2 Natural Resources...............................................................................................................14 3.3 Livelihood Activities ..........................................................................................................15 3.4 Trends in Socio-Economic and Environmental Factors .....................................................17 3.5 Drivers of Change...............................................................................................................22 3.6 Future Projections and Certainty of Drivers.......................................................................25 3.7 Social Differentitation ........................................................................................................30
4. POSSIBLE CONTRASTING FUTURES FOR CANDA .....................................................33 4.1 Selection of Axes................................................................................................................33 4.2 Markets and Prices..............................................................................................................34 4.3 Social Services....................................................................................................................38 4.4 Investment by Commercial Farmers...................................................................................40 4.5 Charcoal Production and Growth of Vila Gorongosa ........................................................41 4.6 Impacts to Different Wealth Classes ..................................................................................43
5. SCENARIOS .........................................................................................................................45 5.1 Growing Through Farming.................................................................................................45 5.2 Mixed Development ...........................................................................................................47
6. DISCUSSION ........................................................................................................................49 6.1 Implications for the Canda Community.................................................................................49 6.2 Further Work..........................................................................................................................49 7. ACKNOWLEDGEMENTS...................................................................................................50
LIST OF ABBREVIATIONS CRUAT Community Resource Use Assessment Team GTZ-PRODER GTZ - Programme de Desenvolvimento Rural IES Institute of Environmental Sciences NGO Non-Governmental Organization NRM Natural Resources Management ORAM Associacao Rural de Ajuda Mutua RIW Relative Importance Weighting RIWC Relative Importance Weighting – Cumulated RIWS Relative Importance Weighting – Standardized SAFMA-GM Southern African Millennium Assessment – Gorongosa/Marromeu
3
SUMMARY
This study, concerning the development of scenarios for the Canda Community of Gorongosa District, Mozambique, was implemented as a small project over the six-month period from February to August 2004. It comprised a collaborative effort between GTZ-PRODER (Programme de Desenvolvimento Rural), who have been active in this community for more than 3 years, and Institute of Environmental Studies (IES) of the University of Zimbabwe, who have previous experience of working with scenarios with rural communities, including within this portion of Mozambique. The objectives of the project were twofold: to work with the Canda community and develop a number of plausible future scenarios, and to develop the capacity of participating GTZ-PRODER staff to carry out similar exercises elsewhere.
Fieldwork was carried out in participation with members of the Canda community. Canda leadership selected a group of village representatives to work together for the duration of the study. Participation varied from day to day, but averaged about 18 village representatives per day. Work was carried out over two short field trips, extending for eight and four days respectively.
The focus of the first trip was to collect background information so as to understand the broader context of the Canda community. Data was collected on the basic needs required by an average family within Canda to live an adequate quality of life; activities carried out in order to satisfy these basic needs; the occurrence and abundance of natural resources; trends in socio-economic and environmental indicators over the ten year period from the end of the civil war to the present (1994 – 2004); and the identification of drivers of change for these indicators. The final exercise was to project the drivers forward ten years into the future, and to consider their likely impact of each driver over this period and the certainty associated with each prediction.
The development of the scenarios entailed the construction of a number of contrasting but plausible alternative futures for the Canda community. Using the results of the previous exercises, the initial task was to identify the key factors that would define the principal contrasts between the different scenarios. The first factor selected was that of markets and prices for agricultural crops, followed by social services, particularly health and education facilities. Several more drivers were subjectively added, comprising the level of investment by commercial farmers, production of charcoal and growth of Vila Gorongosa. For each axis community participants were asked to identify the likely impact of stated conditions over a ten-year period into the future (i.e. to 2014).
Throughout this process awareness was maintained as to the implications of social differentiation within Canda. Three different wealth classes were identified, and the impacts of differing sets of conditions were evaluated with respect to these different wealth classes.
The results of these analyses provided the necessary material for the subsequent construction of two scenarios. This final step was carried out independently of the community participants. Although not necessarily desirable, this was dictated by time constraints.
Assuming that the approach appears useful, GTZ hope to apply this methodology to other communities with whom they are currently working. There is also potential to extend the use of the scenarios by looking at potential response options to the different scenarios by different user groups.
4
1. INTRODUCTION
GTZ’s involvement with Gorongosa District dates back to about 1994 shortly after the end of the extended civil war. Their work in Gorongosa has been organized into a number of phases, although certain activities have overlapped from one phase to the next. The focus of their initial three year “Emergency Programme” was to assist displaced people to resettle in their former villages and to ensure that people had access to food. Initially this entailed the provision of food aid, but thereafter emphasis was switched to promoting food production through providing key agricultural inputs such as tools and seeds. The next phase of assistance, from 1997 to about 1999, sought to further encourage a self-help approach, principally through further promotion of agricultural activities. This included establishing a rural based system of agricultural extension, and also developing technology for constructing improved granaries in order to reduce post-harvest crop losses. Efforts were made to increase rural incomes, both through improving the marketing of agricultural products and through encouraging the formation of small groups and starting various natural resources based income generating projects.
The current phase of assistance, known as PRODER (Programme de Desenvolvimento Rural), was started in 1999 and is still continuing. The objective of this phase is to further promote the development, empowerment and self-sufficiency of rural communities. Greater emphasis is now being given to training and capacity building, both of participating communities and also relevant district agencies, in particular the Department of Agriculture (DPAP). For the communities this means continued training, the introduction and development of new technologies and skills, institutional development and support in order to equip participants to cope with the changing legislative environment and government procedures, plus continued support for income generating activities. At the district level GTZ is providing training and support to relevant local agencies, such as DPAP and the district administration. For example, continued support is being provided to maintain the network of rural extension workers, but this is now being channeled through DPAP rather than individual extension workers being employed directly by GTZ, as was the case in the past. Additional resources and support are also being provided in the form of vehicles, computers and assistance with operational costs such as salaries and fuel. GTZ has also supported the District Administration in the development of a District Development Plan.
The philosophy of GTZ is to develop relevant methodologies and experience and then to spread these to other areas. Within Gorongosa, GTZ started working with the Canda community and has now included two more communities (Nhambita and Tambarara Regulados). The programme is also being extended to four other communities, two in Cheringoma District and one each in Caia and Meringue Districts, all of Sofala Province. GTZ has two other independent programmes within Mozambique, one each within Manica and Inhambane Provinces.
Within Gorongosa District, GTZ is working closely with ORAM (Associação Rural de Ajuda Mutua). ORAM is a Mozambiquan non-governmental organization, working throughout the country, seeking to provide support to rural communities, particularly farmers. In addition to providing practical assistance such as training farmers regarding the keeping of livestock, and assisting farmers to organize themselves into producer associations to carry out income generating activities, ORAM also seeks to provide a voice for small farmers in national fora. In particular, ORAM has been closely linked with development and implementation of the new land law in Mozambique. Under this legislation it has become possible for rural communities to assume control over their land resources. ORAM selected Canda as one of its pilot communities within which to promote the development and implementation of the land law. Working in partnership with GTZ, ORAM has assisted the Canda community to go through the necessary steps to assume control over their resources. These have included clarification of the composition of the community plus boundaries with neighbouring communities, establishment of a natural resources committee, carrying out of a natural resources survey and, based on this, the development of a
5
natural resources management plan. ORAM is now assisting the Nhambita and Tambarara communities to go through the same process.
The Southern African Millennium Assessment – Gorongosa/Marromeu (SAfMA-GM) project, was a four-year (2000-2004) collaborative research project carried out within Sofala Province, but with a particular emphasis on Gorongosa National Park and adjacent settled areas. The objective of the project was to provide an assessment of the linkages between key ecosystem services (food, water, woodfuel and biodiversity) and human well being and, based on this, to provide relevant information to decision makers on the potential trade-offs to be made between ecosystems and the future human well being. The assessment was conducted at several scales from regional to ecosystem to local communities, including within Gorongosa District the Vunduzi, Nhanchururu and Nhambita communities. Initial activities included looking at the current state and trends of key ecosystem services. Thereafter, a set of scenarios was developed that sought to describe plausible but contrasting future development trajectories for the region. These scenarios were subsequently presented to different social groups, including local communities, in order to identify how each group might respond to the hypothetical conditions, and thus to gain an understanding of the factors constraining their potential response options. The use of scenarios was found to be a powerful tool as regards planning for the future and identifying where future development efforts might best be concentrated.
1.1 Purpose of This Study
The present study, which is the subject of this report, comprised a collaborative initiative between GTZ and the Institute of Environmental Studies (IES) of the University of Zimbabwe, under whom the SAfMA-GM project was implemented. The purpose of the work was to work together with the Canda community to develop a set of plausible alternative scenarios for their community. For IES this provided a good opportunity to further extend and develop its approach of using scenarios to work with rural communities. For GTZ the intention was to gain exposure to a new approach which, through providing a powerful means for communities to anticipate and plan for different possible futures, should prove useful towards their broad goal of empowering rural communities.
GTZ selected to work with the Canda community. The study was implemented as a small project, extending over a six-month period from February to August 2004. The objectives of the project were twofold:
To work with the Canda community and develop a number of plausible future scenarios.
To develop the capacity of GTZ-PRODER staff to carry out similar exercises elsewhere.
Assuming that the approach appears useful, GTZ hope to apply this methodology to the other communities with whom they are currently working. There is also potential to extend the use of the scenarios by looking at potential response options to the different scenarios by different user groups.
6
2. METHODS
The Canda Regulado comprises some 18,000 people spread over an area of 107,000 ha. To simplify logistical arrangements it was decided to concentrate efforts within Canda village, this being one of the four villages within the Canda Regulado. Work was carried out over two field trips, the first from 29 April to 8 May, and the second from 2-7 June 2004.
The research team comprised four core members: Martinho Anselmo, Marcelino Goba and Almerindo Dos Santos all of GTZ, plus Rob Cunliffe of IES (Table 1). Three additional members participated during the initial field trip: Berta Rafael of GTZ plus Feliciano Picardo and Victor Semo, both of ORAM. All members had previous experience of working with participatory techniques and analyses, but apart from Cunliffe and Picardo had not worked with scenarios at all.
At the start of the first trip a preparatory meeting was held with the local leadership, including the Regulo and the President of the Canda Natural Resource Committee (for the whole Regulado), during which we discussed the intended programme. We explained that we hoped to work together to develop scenarios, and how this was perceived as fitting into GTZ-PRODER’s objectives concerning community development. We also suggested that the best way to carry out this exercise would be to work together with a small group of community representatives (Community Resource Use Assessment Team or CRUAT), initially for roughly a 10 day period, and subsequently for another week or so. It was emphasised that such a group would need to be representative of the community as a whole – in this case the community being the village of Canda, and should ideally include a balance of men and women; representation of people of different ages from youth to elders, and of people with different activities, skills and occupations; as well as members of the local leadership plus influential people within the community (for example, teachers or traditional healers). The local leadership accepted the project and the approach, and undertook to select and organise such a group of people.
Table 1. List and participation of facilitators. No. of days Name Sex Age Occupation Trip 1 Trip 2
Martinho Anselmo M 38 GTZ – Gorongosa team leader 8 4
Marcelino Nunes Goba M 28 GTZ – Gorongosa, Canda community 8 4
Almerindo Dos Santos M 34 GTZ – Gorongosa, Nhambita community 7 4
Robert Cunliffe M 40 IES – Project leader 8 4
Berta Rafael F 33 GTZ – Gorongosa, Tambarara community 5 -
Feliciano Picardo M 29 ORAM – Gorongosa 5 -
Victor Semo M 48 ORAM – Gorongosa 3 -
Some 53 participants, comprising 33 men and 20 women, took part during the two field trips (Table 2). These people ranged in age from 20 to 66 years. The CRUAT included a relatively high number of local leaders (11 participants comprising four traditional leaders, five members of the natural resources committee, the Chefe do Posto and a priest); a bee keeper, a charcoal producer and two carpenters, plus three natural resource monitors (fiscals), three community animators, two students and a messenger of the Regulo. The remaining 29 participants described themselves as farmers. Overall mean participation was 18 community representatives per day, with 18 people participating for 6 or more of the 12 days of data collection.
Each day the participants would usually be split into two, or sometimes three, smaller groups, each of which would work on a different exercise. At the end of each day, or at the start of the
7
following day, everyone would come together as a single group to present and discuss the results of the previous session in a combined forum. Work was carried out from roughly 9 am through to 1 pm each day. People were not paid for their participation, but were provided with tea in the morning plus a cooked lunch after work had been completed.
The focus of the initial field trip was to carry out a situation analysis that would provide background contextual data necessary for the subsequent development of the scenarios. During a second field trip data was collected on possible alternative futures for Canda, from which results two scenarios were subsequently developed.
8
Table 2. List of community participants. No. of days Name Sex Age Occupation Trip 1 Trip 2
Elicha Almeida M 27 Farmer 8 - Eugenio Almeida M 66 Regulo Canda 7 1 Julio Almeida M 31 NRC fiscal 6 - Albano Vasco Chanze M 34 Community animator 2 - Paiva David M 23 Farmer 8 4 Zacarito David M - Farmer - 1 Costencio Djoane M 34 Bee keeper - 1 Baptista Estevao M 58 NRC member 8 - Domingo Francisco M 28 NRC member 6 - Joao Fulai M 35 Community animator 8 4 Rencasto Fulai M 24 Farmer - 3 Manuel Conde Gabriel M 46 Chefe do Posto 1 1 Francisco Gutsi M 49 Mfumo 2 - Azecarito Iaunde M 34 Carpenter 1 - Chico Jaime M 26 Farmer 2 1 Isaque Jaime M 40 NRC fiscal 6 4 Americo Johane M 36 Charcoal producer 2 - Armindo Miquitaio M 49 Farmer - 3 Zeca Mirione M 40 Farmer 4 - Marcelino Morais M 47 Mfumo 4 4 Americo Parafino M 40 Community animator 7 4 Simao Paulino M 22 Student 1 - Zacalito Phei M 30 Farmer 6 - Bento Cimeo-Res M 30 Farmer 1 - Antonio Roque M 40 Priest 2 - Augusto Saize M 54 Farmer 3 4 Lucas Samo M 42 Farmer 1 - Jose Carlos Thaunde M 34 Carpenter 6 - Jermias Tomas M 35 Sapanda 5 1 Julio Tomas M 32 Messanger for Chief 2 - Machava Tomas M 31 Student 7 - Miguel Tomas M 38 Farmer 4 - Kenode Valissi M 36 NRC fiscal 2 - Elisa Alexandre F 45 Farmer 3 - Crescia Baera F - Farmer - 3 Rosalina Chico F 59 NRC member 8 4 Juliana Creva F - Farmer - 1 Lenita Creva F - Farmer - 1 Lidia Eugenio F 20 Farmer 1 - Jumaida Fazenda F - Farmer - 3 Saleta Fazenda F 40 Farmer - 3 Rita Jaime F 35 NRC member - 4 Adelina Joao F - Farmer 4 - Batina Joaquim F - Farmer - 3 Domingas Paulina F 32 NRC member 1 - Zita Paulo F - Farmer - 1 Liana Ndimadieme F 45 Farmer 1 - Maculada Recango F - Farmer - 1 Sofia Rivia F 29 Farmer - 3 Jelita Tchichone F 36 Farmer - 3 Liana Timalissene F 60 Farmer 6 - Mariazinha Tomas F 38 Farmer 8 - Fatianca Viola F 52 Farmer - 1
9
2.1 Situation Analysis
The first exercise carried out was to identify the basic needs for an average family within Canda to live an adequate quality of life. The resulting basic needs were subsequently grouped under more general categories such as food, or tools and equipment, and these groups were then scored in terms of relative importance. Brief data was gathered on the occurrence and abundance of natural resources. Little emphasis was given to this section as some data was already available from previous studies (principally a forest inventory plus a management plan for the area). Armed with this background information, the CRUAT were then asked to identify activities that people in Canda carried out in order to satisfy their basic needs. These activities were scored both in terms of relative importance and also the number of households engaging in each activity.
Following on from this background information, the next step was to identify and score trends in socio-economic and environmental factors. In doing so, it was decided to confine consideration to the ten year period from the end of the war to the present. For each indicator, its level was compared from 1994 to 2004 and scored accordingly. Explanations were sought as to what were the possible causes of perceived changes. Analysis of these explanations enabled the generation of lists of drivers of change. These drivers were then subdivided into two groups, socio-economic drivers and environmental drivers, both of which were further subdivided into positive and negative factors. The resulting four groups of drivers were then scored individually in terms of relative importance and the number of households or area of Canda perceived to be impacted by each driver. The final analysis of drivers was to project them forward into the future, again covering a ten year period from the present through to 2014, and to assess whether the likely impact of each driver was expected to decrease, remain the same or increase, and to estimate how certain CRUAT members were as to these predictions.
A final avenue of data collection was to briefly explore social differentiation within the Canda community. In this respect the CRUAT was asked to identify different wealth classes and to estimate the proportion of households falling within each category. Next the CRUAT were asked to identify factors whereby a household might either increase or decrease in terms of wealth status. The final exercise was to explore the likely projections for different wealth classes over the coming ten years.
In the field, all data was recorded on flipcharts, in Portuguese, usually in the form of simple lists, tables or spidergrams. Within this report, for ease of interpretation, importance scores for various factors are presented in tables in a standard format. In the first column of each table, the identified factors are listed in order of most important to least important. The second column, headed RIW (Relative Importance Weighting), comprises the relative importance scores given by the CRUAT for each factor (for example, as shown on a spidergram). In order to facilitate comparisons between different factors, and between different tables, it is necessary to standardize these scores. This is done by dividing the importance score for each factor by the sum of the importance scores for all factors. These standardized scores, labelled as RIWS (Relative Importance Weighting – Standardized), necessarily fall between 1 and 0, and for each table the sum of all RIWS is necessarily 1. The final column is headed RIWC or Relative Importance Weightings – Cumulated. This provides a running total of the RIWS scores from the previous column, which is again useful for purposes of interpretation. The RIWC for any factor is thus the sum of the RIWS for that factor plus the RIWS scores for any preceding factors. This shows how much of the overall relative importance is accounted for by this group of factors. The RIWC score for the final factor is necessarily 1. Multiplication of the RIWC scores by 100 effectively converts these to percentages. For example a RIWC score of 0.431 corresponds to 43.1% of the overall relative importance weighting or RIW.
10
2.2 Possible Contrasting Futures for Canda
The development of the scenarios entailed the construction of a number of contrasting but plausible alternative futures. This was done by drawing on the results concerning drivers of change and predictions concerning the strength and certainty of their likely future impacts. The first step was to identify the key factors that would define the principal contrasts between the different scenarios. Having identified these factors, or axes, the next step was to consider the effects of the principal drivers of change under the stated different conditions or combinations of conditions. These results provided the necessary material for the subsequent development of the narratives for each scenario (Section 5).
Due to the limited time available for the study it was decided to develop only two different scenarios. The community participants did not feel comfortable in making predictions any further than ten years into the future, so this was selected as the time frame for building the scenarios (i.e. to the year 2014).
Selection of Axes. Identification of the principal contrasting factors for development of the scenarios was based on analysis of the socio-economic and environmental drivers of change. Potential drivers to use for the primary axes were those with the highest scores in terms of impact on future livelihoods. Amongst these, the drivers of greatest interest were those with the highest levels of uncertainty rather than those that were considered more predictable. A simple analysis was conducted for all drivers (social and environmental, Tables 15-18), whereby the predicted impact of each driver (relative importance weighting standardized or RIWS) was multiplied by its uncertainty (relative uncertainty standardized or RUS). The latter were derived from the certainty scores allocated to each driver (on a scale from 1-20 points where 1 = highly uncertain and 20 = extremely certain). Relative uncertainty scores (RU) were derived by subtracting certainty scores from 20, and then standardized by dividing through by 20 (RUS). Drivers were then ranked in order from highest to lowest impact by uncertainty (RIWS*RUS) scores. Scores for similar drivers were combined, and selection of axes was based on consideration of these aggregate scores.
Impacts of Different Stated Conditions. At this point the CRUAT was split into two subgroups, one to deal with the development of each scenario. The two groups were asked to consider the likely results to households within Canda village for the year 2014, of differing conditions for the primary axis, this being market conditions and prices for crops. One group was asked to consider conditions of unfavorable markets and prices, and the other group the likely outcome under conditions of favorable markets and prices. Some prompting was given in order to ensure consideration of certain important drivers of change, but no attempt was made to ensure the systematic evaluation of all the previously identified social and environmental drivers under the two different states. The bulk of factors identified concerned changes in terms of social conditions such as changes in wealth, food security and social services. No attempt was made to rank or score these findings.
In order to ensure more comprehensive responses, each group was asked to further consider the likely impacts of their particular state of market conditions, firstly, in terms of changes to farming systems and agricultural production and, secondly, to natural resources and the environment. Each group was then asked to consider how such conditions of unfavorable or favorable markets and prices might arise and, for conditions of unfavorable markets and prices, to identify potential alternatives for the generation of income.
The second contrasting axis was now introduced, this being the status of health and education services. In doing so, the group previously dealing with conditions of unfavorable markets and prices were asked to now consider the impacts of improved social services, whilst the other group, previously dealing with more favorable market prices with conditions, was asked to consider the
11
implications of deteriorating or static social services. The effect of doing this was to limit the number of sets of potential future conditions to two rather than the full set of four possible combinations of factors (poor or good markets with either poor or good social services). The reason for linking poor markets with improved social services and good markets with poor social services was also deliberate, in order to avoid generating unrealistic and less informative contrasting situations of entirely positive versus entirely negative conditions.
The third contrasting axis to be considered was that of differing levels of in migration and investment by commercial farmers. In this case, the situation of low levels of investment was paired with the former group of unfavorable markets and prices but improved social services, and that of high levels of investment with conditions of good markets and prices but poor social services.
A final factor was subsequently added to each group, but in this case the two factors did not correspond with one another. The first group (unfavorable market conditions, improved social services, low investment by commercial farmers) was asked to consider the implications of increased charcoal production in Canda. The second group (favorable market conditions, poor social services, high investment by commercial farmers) was asked to assess the impacts of marked growth in the town of Vila Gorongosa. These factors were added on the basis of being potentially important considerations, but which the CRUAT had not given any serious thought to during any of the preceding exercises.
The final exercise was to seek to evaluate what the likely outcomes of the two sets of conditions would be for the three different wealth classes (poor, intermediate and richer households) previously identified within Canda.
2.3 Writing the Scenarios
The results of the above exercises, concerning predicted outcomes under differing sets of conditions, provided the material from which the actual narratives of the two scenarios were subsequently developed. This final step was done independently of the community participants. It would have been preferable to at least review the two storylines with the CRUAT, but there simply was no opportunity for this. This could perhaps be done as a separate exercise sometime in the future.
12
3. SITUATION ANALYSIS
3.1 Basic Needs
The various basic needs identified by the CRUAT were subsequently grouped into 14 main categories (Table 3). The factors listed under each group were not intended to be exhaustive. For example, use is made of a much wider range of forest resources than the seven factors listed in Table 3 (firewood, charcoal, trees, bamboo, grass, wild fruits and land).
Table 3. Basic needs identified by the Canda CRUAT.
FaFo
Toequ
Cu
Lead
Cash
Infra
Cloth
MonLives
Train
TranFruit
Landresources Charcoal
Bamboo Grass
Key standand f92%
Basic Need Details
mily Family members od Maize
Sorghum Rice Beans Sweet potatoe Cassava Madumbi Groundnuts Jugo beans Onion Tomatoe Pumpkin Green pepper Piripiri Sessame Salt Fish Honey Water Traditional beer
ols and ipment
Axe Hoe Panga Knives Sickle Hunting equipment Fishing equipment Grinding stick Grinding stone Clay pots/plates etc Reed mats
ltural activities Football
Drums
basic needs, in terms of an average household withinard of living, were considered to be: the presence of orest resources, and tools and equipment. Collectiveof the overall relative importance weight (RIW) (Tab
Canda village achieving an adequate a family, food (including water), land ly these four components account for le 4). A further 5% of the RIW was
accounted for by leadership, production of cash crops, and infrastructure. The low relative importance of the latter (1%), which includes items such as housing, roads, schools, clinics, churches, shops, wells, etc., was somewhat surprising. The remaining seven factors collectively accounted for the final 2% of the overall importance mass.
Common items that were not mentioned include factors such as employment, security, household goods, control over resources, good governance, markets and good relations with neighbours. Most of these aspects were however, brought up in one form or another in subsequent exercises and discussions.
Table 4. Relative importance of basic needs in Canda, scored in terms of their contribution to an average household living an adequate standard of living.
Basic Need RIW RIWS RIWC Family 2000 0.431 0.431 Food 1200 0.258 0.689 Tools and equipment 600 0.129 0.818 Land and forest resources 500 0.108 0.926 Leadership 100 0.022 0.947 Cash crops 90 0.019 0.967 Infrastructure 50 0.011 0.978 Clothes and bedding 19 0.004 0.982 Money 18 0.004 0.986 Livestock 17 0.004 0.989 Training and skills 16 0.003 0.993 Transport 13 0.003 0.995 Fruits 11 0.002 0.998 Cultural activities 10 0.002 1.000 Total 4644 1.000 1.000
3.2 Natural Resources
The principal natural resources identified were land and soil, water, and forests (Table 5). Several different types were identified for each of these. In terms of relative abundance, land and water were considered to be relatively plentiful whilst forests, stones and particularly wildlife were relatively scarce (Table 6). Other than stones, for which only 40% were estimated to be suitable for use in construction works, the bulk of all other resources were considered to be in satisfactory condition as regards their principal uses by families in Canda. Table 7 lists characteristics associated with favourable and unfavourable occurrences of soil, water and forest resources. Favourable occurrences comprise soils that are suitable for cropping, water for drinking and forests with abundant quantities of useful forest products (firewood, poles, honey, wildlife, etc.).
Table 5. Types of principal natural resources occurring within Canda.
Resource Type Land and soil Black soil
Red soil Sandy soil
Water Rivers Wells Pans
Forests Open forest (sources of firewood and building materials) Closed forest (sources of timber)
14
Table 6. Availability and condition of natural resources in Canda.
Resource Relative Abundance
Satisfactory Condition (%) Notes
Land 50 70 Suitable for agriculture
Water 30 83 Suitable for household use
Forests 10 80 With useful forest resources
Stones 5 40 Suitable for construction purposes
Wildlife 1 80 Suitable for consumption
Table 7. Characteristics associated with favorable and unfavorable occurrences of key natural resources in Canda.
Dirty water Water with small animals Water from pans or pools from rain
Valuable forest area Has firewood Has poles for construction purposes Has wildlife resources Suitable for production of honey
Open forest Lacking firewood, poles, grass etc. Lacking or with only few resources
3.3 Livelihood Activities
The listing of activities presented in Table 8 was generated in direct reference to the earlier listing of basic needs. A total of 27 activities were identified, such that there are several ways for satisfying most basic needs. These activities were scored in terms of both relative importance and the estimated proportion of households carrying out each activity. The range of relative importance scores was considerably more constrained than that allocated to the basic needs (2-100 points, Table 8 versus 10-2000 points, Table 4). However, in terms of importance rankings there was relatively close agreement between those allocated to basic needs (Table 4) and the activities carried out in order to satisfy these basic needs (Table 8). The most significant difference was the considerably higher importance rating given to the construction of infrastructure such as houses (RIWS = 0.052) and roads (RIWS = 0.049), as compared to the low need for such facilities (RIWS = 0.011, Table 4). Activities that are carried out by the majority of families (70% or more) include: securing access to land, using water, marrying and making a family, cultivating food crops, visiting hospitals or traditional healers, participating in the selection of local leadership, selling crops, collecting forest products, keeping livestock, constructing houses, constructing roads (and other infrastructure), participating in cultural activities, attending school, buying clothing and other household items, and buying tools and equipment. Activities with relatively high importance scores in comparison to the number of households carrying out these activities include making tools and equipment, cultivating cash crops, conserving natural resources, and getting training or learning from others. Activities which are relatively common, but considered to be of relatively low importance, included selecting local leaders, selling crop products, keeping livestock, participating in cultural activities and working for others.
15
Table 8. Numbers of households carrying out different activities within Canda and the relative importance of these activities in terms of an average household living an adequate standard of life.
Activity No. Of Households (%) RIW RIWS RIWC
Securing access to land 100 100 0.066 0.066
Using water 100 99 0.065 0.130
Collecting forest products 90 98 0.064 0.195
Conserving natural resources 50 95 0.062 0.257
Marrying and making a family 100 90 0.059 0.316
Cultivating food crops 100 80 0.052 0.369
Constructing houses 90 79 0.052 0.420
Visiting hospitals and traditional healers 98 75 0.049 0.470
Constructing roads/bridges 80 74 0.049 0.518
Attending school 79 70 0.046 0.564
Buying tools and equipment 70 65 0.043 0.607
Cultivating cash crops 25 63 0.041 0.648
Making tools and equipment 11 61 0.040 0.688
Keeping livestock 90 60 0.039 0.727
Selling crop products 95 59 0.039 0.766
Buying clothing and household items 73 58 0.038 0.804
Selecting local leaders 98 50 0.033 0.837
Getting training 30 48 0.031 0.868
Learning from others 20 40 0.026 0.894
Using bicycles 50 37 0.024 0.919
Buying food items 40 30 0.020 0.938
Using public transport – lifts 41 28 0.018 0.957
Working for others 62 25 0.016 0.973
Exchanging crops for goods 30 24 0.016 0.989
Participating in traditional ceremonies 80 10 0.007 0.995
Hunting wildlife 10 5 0.003 0.999
Borrowing money 3 2 0.001 1.000
Total 1525 1.000 1.000
16
3.4 Trends in Socio-Economic and Environmental Factors
Respondents were asked to consider trends in a wide range of socio-economic and environmental factors. These factors were generated from consideration of the basic needs and activities such that they should all be locally relevant, despite not being generated directly by the CRUAT. For each factor the CRUAT was asked to think back 10 years to just after the ceasefire period, and to compare conditions as they were then to the current status. For all factors the current situation was given a score of 10 points, and the CRUAT were then asked to score the factor 10 years ago on a scale of 1-20, with 1 being lower than the present situation and 20 being higher than the present situation. Participants were also asked to give a brief explanation as to the reported trends.
A total of 15 socio-economic factors were examined, but for most of these more than one indicator was scored, such that the total number of comparisons was 45 (Table 9). Of these, 27 can be interpreted as being positive changes, 14 negative, whilst four had not changed. Factors that were generally considered to have improved were houses, crop production and sales, livestock production, and purchases from shops. A number of factors had mixed indicators, i.e., had improved in some ways and deteriorated in others. These included education (more schools and higher attendance, but poor quality of teachers), entertainment (new technologies and more readily available, but less government support for cultural events), religion (more churches and more participants, but some are not genuinely interested in helping the community), and demographic factors (more births, fewer people leaving the village and more people settling in Canda, but more deaths). There were also some aspects that were considered to have mainly deteriorated: health status (more and new diseases, no increase in medical facilities or staff, lower availability of medicines, and traditional healers becoming too expensive), women getting married at a younger age (and continuing levels of polygamy), degree of respect (declining within the community and for traditional leaders) and levels of conflict (more causes and more conflicts).
For natural resources and the environment a total of 59 indicators, grouped under 18 factors, were examined (Table 10). In this case the negative trends outnumbered the positive trends by a margin of 27 to 17, with the remaining 15 indicators being unchanged. Resources that were perceived to have declined included timber, bamboo, wildlife, rivers (less water, but increased use for irrigation), pans and pools, and mushrooms. The frequency and area of burning was also considered to have increased, and access to land was perceived as having become more difficult due to the increase in population. Resources which were perceived to have remained much the same were soils (all types), stones, firewood, thatching grass, wild fruits, springs and reeds (increased level of use but no change in quality). Improvements were noted in terms of drinking water (opening of wells and treatment of wells with chlorine) and reduced impact of pests such as crop pests and rats (due to increased availability and use of chemical control measures). Mixed results were obtained for honey production (more producers, improved methods, but lower levels of production and sales).
17
Table 9. Trends in socio-economic factors within Canda for the period 1994 to 2004. Each indicator was given a score of 10 points for 2004. The value for 1994 was then scored on a scale of 1-20 with 1 being much lower than the present situation and 20 far higher than the present situation. Trends were also rated as being either positive (P), negative (N) or unchanged (=).
Factor Indicator 1994 2004 P/N Explanation
Number of houses 6 10 P Increase in population Houses Status of houses 3 10 P Increase in income from crops
Introduction of new technologies Increase in income through working
Size of harvest 7 10 P Now produce crops both for food and to sell (previously it was hard to sell crops)
Quality of crops 4 10 P Improved seeds available Improved extension services
Growing food crops
Amount of crops stored 16 10 P More was stored in the past due to the absence of markets Nowadays people need more money than before
Number of households with livestock
5 10 P Increased income from crop production Presence of restocking programmes
Number of animals 3 10 P End of war, continued peace Restocking programmes
Types of animals 4 10 P Restocking programmes have lead to the introduction of species such as cattle, goats, ducks and turkeys
Production of livestock
Incidence of animal diseases
5 10 N Appearance of new illnesses Introduction of sick animals from elsewhere
Number of households selling crops
5 10 P Increase in population Increase in production
Quantity of sales 4 10 P Increased production (e.g. cultivation of bigger areas) Increase in support from government and NGOs Rehabilitation of roads enables access to markets Buyers now come to the community
Crop sales
Types of products sold 3 10 P Introduction of new crops such as cotton and tobacco
Number of people using hospitals
4 10 P Increased due to raised awareness of health issues
Number of hospitals 10 10 = Government responsible for building hospitals Number of medical staff 10 10 = Government responsible for medical staff Availability of medicines 15 10 N Government responsible for medicines Incidence of diseases 5 10 N People travelling more now
Appearance of new diseases (AIDS)
Health care
Use of traditional healers 15 10 N Becoming too expensive Number of students 3 10 P Increase in population
Increased awareness of value of education Number of schools 5 10 P Construction of schools by community and with
help from donors Increased awareness of value of education
Quality of education 15 10 N Teachers are not performing well Corruption by teachers (demand money to teach)
Quality of teachers 15 10 N Many teachers do not have any training Salaries are low and often delayed
Education
Distance to schools 5 10 P Closer as there are now more schools
18
Factor Indicator 1994 2004 P/N Explanation
Age of girls at marriage 15 10 N Decreasing due to a decline in moral values Many young girls want to become independent and to start their own families
Marriage
Incidence of polygamy 10 10 = Polygamy allows more children and thus improved social status Polygamy enables increased agricultural production
General degree of respect 17 10 N Greetings are now much less formal Decline in initiation ceremonies Many people now travel to towns where they learn other (less respectful) ways
Respect for the Regulo 15 10 N Influx of outsiders who came during the war and have remained Change in attitudes of local residents
Respect
Respect for government structures
10 10 = Recognised administrative leaders
Number of events 15 10 N Government previously encouraged cultural activities Previously cultural staff at the village level
Types of entertainment 5 10 P Introduction of new technologies like satellite TV and videos
Entertainment
Distance to events 15 10 P Now closer as many people show videos in the village
Number of conflicts 5 10 N Decline in moral values Lower incidence of initiation ceremonies Young people are drinking more Divergence of political parties
Conflicts
Types of conflicts 5 10 N People are still aggressive due to the war Jealousy towards those who do better Differences in politics and religion
Deaths Number of deaths 3 10 N Decreased availability of health care and medicines New diseases such as AIDS Increased mobility of people means more diseases are brought to Canda
Births Number of births 4 10 P People are marrying earlier People take more than one wife Improved food security due to increased crop production
Number of religions 3 10 P Numerous new religions as priests see this a source of money
Help to society 15 10 N Some religions are false and operate only for the money
Number of participants 5 10 P More religions and churches
Religious Activity
Distance to churches 5 10 P Now closer as more religions and churches Number of people buying goods
5 10 P Increased family income due to increased crop production
Purchases from shops
Distance to shops 5 10 P Closer due to opening of small shops within the village
Number of people leaving the village
15 10 P Fewer people leave now that there is peace Good land for agriculture so no reason to leave
Number of people settling in Canda
5 10 P People are attracted by the good land for agriculture
Number of men looking for work outside
5 10 P More men go out looking for employment
Resettlement
No of women moving out the village
18 10 P Woman are occupied with households so do not go out much
19
Table 10. Trends in natural resources and environmental factors within Canda for the period 1994 to 2004. Each indicator was given a score of 10 points for 2004. The value for 1994 was then scored on a scale of 1-20 with 1 being much lower than the present situation and 20 far higher than the present situation. Trends were also rated as being either positive (P), negative (N) or unchanged (=).
Factor Indicator 1994 2004 P/N Explanation
Access to land for agriculture 12 10 N Decreased due to increase in population Distance to fields 10 10 = Soils have remained fertile so there has been little
need to move fields
Land
Fertility of soil 10 10 = Soils have remained fertile Availability of timber 14 10 N Reduced as many companies have come to cut
wood Distance to timber 20 10 N Now more distant due to uncontrolled cutting
Timber
Size of timber 20 10 N Decreased due to uncontrolled cutting Availability of bamboo 15 10 N Decreased due to pressure of cutting Distance to find bamboo 20 10 N Now more distant due to pressure of cutting Thickness and length of bamboo
18 10 N Decreased due to pressure of harvesting
Bamboo
Quality of bamboo 20 10 N Now hard to find preferred hollow bamboo, due to cutting
Availability of water 14 10 N Decreased due to increased levels of dryness Quality of water for drinking 6 10 P Many wells have been opened up
Government has started a programme of treating well water with chlorine
Distance to water for drinking 20 10 P Now closer due to the opening of wells
Water for drinking
Number of sources of water 4 10 P Increased due to opening of wells Availability of stones 16 10 N Decreased due to continued extraction e.g. for road
construction Quality of stones 10 10 = Same quarry is still in use
Stones
Distance to stones 10 10 = Same quarry is still in use Numbers of animals 20 10 N Declined due to increase in human population
Hunting activities Types of animals 20 10 N Fewer types due to increase in population and
increased levels of hunting Increased settlement has made it difficult for animals to get to water
Distance to find animals 2 10 N Further as little habitat for wildlife remains in Canda
Selling of meat from animals 15 10 N Decreased due to the decline in animals
Wildlife
Protection of wildlife 12 10 N Loss of habitat for wildlife due to expanding settlement
Number of honey producers 9 10 P Slight increase due to support given to bee keepers Gathering of honey 16 10 P Decreased due to promotion of new technologies of
bee keeping Bee keeping 0 10 P Introduction of new technologies Sales of honey 13 10 N Lower than before as people are now more selective
than in the past Consumption of honey 12 10 P Sugar is now readily available
Honey
Quantity of honey 11 10 N Have more beekeepers but with lower yields. Availability of firewood 10 10 = Still available close to households Firewood Distance to find firewood 10 10 = Still available close to households Availability of grass 10 10 = No change Grass for
thatching Quality of grass 10 10 = No change Wild fruits Availability of wild fruits 10 10 = No change
20
Factor Indicator 1994 2004 P/N Explanation
Types of fruits 10 10 = No change Soils Availability, quality and
colour 10 10 = No change for any types (sandy, red, black, clay,
river sand) Numbers of rivers 10 10 = No change in pattern of drainage Amount of water in rivers 15 10 N Decreased due to increased levels of dryness Use of water for irrigation 3 10 P New farmers have come to the community
Increased production of vegetable crops that need irrigation
Rivers
Use of river water for drinking 14 10 P Reduced due to the opening of wells Number of pans 13 10 N Lower due to general decrease in rainfall Quality of water in pans 12 10 N Low water levels results in poor quality water Access by wildlife to pans 20 10 N Reduced due to increased levels of dryness
Lakes
Use of pan water for drinking 15 10 P Reduced due to opening of wells Poor quality of water in pans Low availability of water in pans
Number of springs 10 10 = No change Springs Use of springs for drinking 6 10 N Increased due to increase in population and
settlement in close proximity to springs Numbers of mats produced 5 10 P Increased as more people now making mats Numbers of mats being sold 8 10 P More people looking for mats both within the
community and outside Quality of reeds 10 10 = No change
Reeds for mats
Use of reed mats 5 10 P Increased due to increase in population Numbers of consumers 14 10 N Decreasing as mushrooms are becoming scarcer Availability of mushrooms 17 10 N Decreasing due to dryness/less rainfall
Mushrooms
Quality of mushrooms 10 10 = No change Size of area burnt 5 10 N Increased despite many awareness activities to
discourage burning Frequency of burning 5 10 N Frequency of fires is increasing Sources of fire 5 10 N Number of sources are also increasing
Fires
Measures to combat fires 2 10 P Local control is increasing Government awareness programmes New land law discourages fires
Number of plagues 18 10 P Decreased due to use of chemicals such as pesticides
Level of destruction 18 10 P Decreased due to use of chemicals such as pesticides
Plagues (e.g. worms, locusts, rats etc)
Control measures 5 10 P Use of chemicals is being promoted by government and NGOs
21
3.5 Drivers of Change
Using the results of the previous exercise, CRUAT members were asked to identify drivers of change for scoio-economic and environmental factors. This was done by sifting through the various explanations given for the perceived changes. The identified drivers were then further subdivided into positive and negative groups. Drivers within each group were then scored in terms of relative importance and, for socio-economic factors, the proportion of households each driver was considered to act upon, or for environmental drivers, the extent of the village that was impacted by each driver.
Socio-Economic Drivers. A total of 15 positive socio-economic drivers were identified (Table 11). The most significant by far was the achievement of peace, which accounted for 27% of the overall importance mass. The next four most important factors were largely concerned with improved agricultural production, these being: the ready availability of good land for agriculture, the introduction of cash crops, increased crop production and increased population (labour). Each of these drivers accounted for between 10 and 12% of the overall RIW. The next four factors, each accounting for between 3 and 6% of the RIW, were concerned with incomes (increased crop sales and increased buying power) and infrastructure (better roads and schools). The remaining six factors were considered to be of little importance, collectively accounting for the remaining 6% of the overall RIW. There was generally a high degree of correspondence between relative importance scores and the number of households each driver acts upon, with seven of the nine most important drivers acting on a high proportion of households (60 – 100%, Table 12). The two exceptions were the introduction of cash crops and increased buying power, which were considered to be restricted to 15% and 30% of households respectively.
Fewer negative socio-economic drivers were identified (n = 10, Table 12). The two most significant factors both concerned health issues – the appearance of new diseases and a perceived decline in the effectiveness of health services. Together these two factors accounted for 53% of the overall RIW. The following six negative drivers each accounted for between 4 and 9% of the RIW. These concerned issues such as the decline of cultural and moral values, an increase in political conflicts, low age of marriage, poor quality of education and declining state support for cultural activities.
Environmental Drivers. Only four positive environmental drivers were identified (Table 13), of which the presence of good land and soils for agriculture was seen as being by far the most important (70% of the overall RIW). The existence of wildlife and forestry legislation was seen as being the next most important factor (28% of the RIW). Other drivers, of minor significance, were the promotion of bee keeping and the reduction of hunger.
A much greater suite of negative environmental drivers were recorded (Table 14). The most important of these was considered to be a general increase in dryness (i.e. declining rainfall). This was followed by increased burning and destructive actions carried out by timber companies during the extraction of timber resources. These three factors accounted for 38% of the overall RIW. The next four factors each accounted for a further 6-8% of the overall RIW. These were an increase in population, in-migration of commercial farmers, and uncontrolled use of forest and wildlife resources. The next six drivers each accounted for 3-5 % of the overall RIW. These were: the expansion of settlement and settlement too close to springs, the production of cash crops, the extraction of stones, reduced water in rivers and increased use of reeds in the making of reed mats. The remaining eight negative drivers together accounted for only 6 % of the RIW. Eleven of the 13 most important drivers were identified as acting on between 50 and 90% of the overall village area (Table 14), the two exceptions being that of settlements close to springs and the extraction of stones, both of which were reported to be considerably more confined. The remaining eight less important drivers impacted on 5 – 50% of Canda, the modal value being 25%.
22
Table 11. Positive social drivers in Canda. The proportion of households impacted by each driver and the relative importance of each driver in terms of an average household living an adequate standard of life.
Social Drivers – Positive Participants (%) RIW RIWS RIWC
End of war – start of peace 100 200 0.272 0.272
Good land for agriculture 100 90 0.122 0.395
Introduction of new crops (cash crops) 15 87 0.118 0.513
Increased production of crops 70 80 0.109 0.622
Increase in population 80 75 0.102 0.724
Increased buying power 30 45 0.061 0.785
Rehabilitation of roads (within village) 100 40 0.054 0.839
Increase in schools and teachers 60 35 0.048 0.887
Opening of small shops in the village 17 14 0.019 0.961
More buyers coming from outside the village 8 13 0.018 0.978
Support for restocking programmes 10 10 0.014 0.992
Introduction of new technologies 20 5 0.007 0.999
Increase in religions and churches 30 1 0.001 1.000
Total 735 1.000 1.000
Table 12. Negative social drivers in Canda. The proportion of households impacted by each driver and the relative importance of each driver in terms of an average household living an adequate standard of life.
Social Drivers – Negative Participants (%) RIW RIWS RIWC
Appearance of new diseases 50 60 0.278 0.278
Decline in health services 70 55 0.255 0.532
Lack of initiation ceremonies 50 20 0.093 0.625
Low age of marriage 85 19 0.088 0.713
Political differences 90 18 0.083 0.796
Decline of moral values due to movements 20 15 0.069 0.866
Poor quality of education 50 13 0.060 0.926
Declining support for cultural activities 10 10 0.046 0.972
Influence of cultures from outside 30 5 0.023 0.995
Poor performance of some churches 25 1 0.005 1.000
Total 216 1.000 1.000
23
Table 13. Positive environmental drivers in Canda. The proportion of Canda impacted by each driver and the relative importance of each driver in terms of an average household living an adequate standard of life.
Environmental Drivers – Positive Area (%) RIW RIWS RIWC
Good land and soils for agriculture 80 500 0.699 0.699
Existence of wildlife and forest legislation 20 200 0.280 0.979
Promotion of bee keeping 50 10 0.014 0.993
Reduction of hunger 40 5 0.007 1.000
Total 715 1.000 1.000
Table 14. Negative environmental drivers in Canda. The proportion of Canda impacted by each driver and the relative importance of each driver in terms of an average household living an adequate standard of life.
Environmental Drivers – Negative Area (%) RIW RIWS RIWC
Dryness 90 1000 0.166 0.166
Increase in burning 80 700 0.117 0.283
Activities of timber companies 90 600 0.100 0.383
Increase in number of families 70 490 0.082 0.464
Uncontrolled cutting of timber/forest resources 90 470 0.078 0.543
Hunting without any license 90 460 0.077 0.619
In migration of commercial farmers 60 400 0.067 0.686
Expansion of settlement 90 300 0.050 0.736
Production of cash and horticultural crops 60 280 0.047 0.782
Settlement close to springs 30 260 0.043 0.826
Extraction of stones for building 25 250 0.042 0.867
Increased utilization of reeds for mats 60 240 0.040 0.907
Reduced water in rivers 50 200 0.033 0.941
Many buyers coming to Canda 20 100 0.017 0.957
Animals are running away 40 90 0.015 0.972
Opening of wells 20 70 0.012 0.984
Reduction in wildlife 40 50 0.008 0.992
Extraction of honey 50 30 0.005 0.997
Treatment of water in wells 5 10 0.002 0.999
Use of pesticides 30 6 0.001 1.000
Decline in mushrooms (food for animals) 10 1 0.000 1.000
Total 6007 1.000 1.000
24
3.6 Future Projections and Certainty of Drivers
The final exercise concerning the identified socio-economic and environmental drivers was an analysis in terms of their likely future impact and the certainty associated with these predictions. The CRUAT members were asked to think ahead to ten years into the future (2014), and for each driver to consider whether its impact at that time was likely to be similar to its current effect or else increased or decreased, to score how certain they felt about the prediction, and to provide the rationale for the prediction and score (Tables 15 – 18). The degree of certainty was assessed according to a 20 point scale, for which 1 represented very low certainty and 20 very high certainty.
Socio-Economic Drivers. Of the fifteen positive socio-economic drivers (Table 15), eleven were expected to have increased impact, two to remain the same (support for restocking and increased buying power) and two to have reduced impact (opening of small stalls in the village and continued presence of good land for agriculture). In general, the CRUAT predicted a continuation of the current conditions of peace and continued increases in population, crop production, the introduction of new crops and technologies, more buyers coming to the village and increased crop sales. These trends were envisaged as being accompanied by improved infrastructure in the form of better roads within the village, better schools, more churches and better houses. The CRUAT felt relatively certain about almost all these trends (scores of 12-19 each), the two items of lower certainty being support for restocking (5 points as this depends on government decisions) and the opening of more small stalls in the village (10 points – due to declining viability and to the likelihood of larger shops being opened in the village). Despite the predictions of increased production and sales, the CRUAT did not expect this to translate into increased buying power, noting with strong certainty that prices and the cost of living were also likely to continue to rise and thus negate the expected increase in earnings.
For the ten negative socio-economic drivers, five were predicted to increase, four to remain the same, and the remaining one to decrease in impact (Table 16). The factors that were predicted to strengthen, all with relatively high certainty (scores of 12 – 18 points), were the occurrence of new illnesses, decline of initiation rites and moral values, political disagreements and dishonesty within churches. Factors with lowest certainty were those relating to inputs by government: 8 points for cultural events and 9 points for quality of education. The one factor that was predicted to decrease is the number of people moving out of the village, due to the continuation of peace and the presence of good soils.
Environmental Drivers. The two positive environmental drivers that were predicted to increase, and with relatively high certainty, were improvements in bee keeping and the positive influence of the natural resources management committee. The CRUAT were much less certain that hunger would continue to be reduced, that the fertility of soils would continue to persist, and of the continued positive impact of environmental legislation.
Of 21 negative environmental trends, 14 were predicted to increase in impact, mostly with a relatively high degree of certainty (12 – 20 points). The CRUAT were least certain about the likelihood of continued decline in rainfall, and thus the availability of mushrooms, both of which were given certainty scores of 10 points. The rate of illegal hunting and reductions in water levels were expected to continue at the same rate as in the recent past. Factors that were expected to decrease in impact were the decline in wildlife (due to its virtual elimination), the extraction of honey (replaced by honey production) and settlement near springs (to be controlled by traditional leadership).
25
Table 15. Anticipated trends for positive social drivers in Canda. Each driver is rated in terms of whether its impact in 2014 is expected to be increased (inc), the same or decreased (dec), and the certainty associated with this prediction (1= highly uncertain to 20 = extremely certain).
Driver Impact Certainty Explanation
Increased crop sales Inc 17 Canda has good land
Regular rainfall will continue
Continuation of peace Inc 18 Agreement among people in Canda
Government are promoting the need to maintain peace
Support for restocking Same 5 Support to farmers is now decreasing (planning is top down so we do not know what will happen)
Increased buying power Same 19 Cost of life is increasing
Prices are rising
Increase in schools and teachers
Inc 16 Due to government support and also community programme to build primary schools because people are starting to understand the power of education
Government is raising awareness, especially for girls to go to school
Increase in religions and churches
Inc 15 There are many people who work for the churches and go from house to house to explain the importance of their churches
Opening of small stalls Dec 10 Cost of living is increasing such that some owners will not be able to continue
New shops will open in the community
Good land for agriculture
Dec 15 Entry of new farmers from outside will impact on the land through their use of big fields, pesticides and fertilizers
Increase in production Inc 18 Good land and soils
Regular rainfall
Introduction of new technologies
Inc 17 People can see their neighbours in good homes and so try to improve their own
Access to employment Inc 13 Farmers coming in (employment within Canda is on farms or in shops, or else must go outside to look for work elsewhere, but not much interested in that)
Introduction of new crops
Inc 15 New farmers
New government projects
Rehabilitation of roads Inc 14 Government already have plans for this
New farmers will want to improve roads for themselves
New buyers to the community
Inc 12 Production will be growing
People will still need money
Increase in population Inc 16 People are getting married earlier
Polygamy
People from outside are coming to settle
26
Table 16. Anticipated trends for negative social drivers in Canda. Each driver is rated in terms of whether its impact in 2014 is expected to be increased (inc), the same or decreased (dec), and the certainty associated with this prediction (1= highly uncertain to 20 = extremely certain).
Driver Impact Certainty Explanation
Lack of initiation rites Inc 18 Will be fewer and fewer due to influence of cultures from outside and due to settlers from outside bringing their own ideas
Lack of support for cultural activities
Same 8 People of Canda do not give much consideration to local culture
Ministry of culture does not have any local representative within Canda
Not a priority of the present government
Political disagreements Inc 14 Near to elections therefore will increase
All parties do not understand well how to work with more than one party
Poor role of churches Inc 12 Leaders of some churches are just looking for money
Mobility of people Dec 18 Good soils so few people will go out
Used to go out because of the war, but now it is peaceful
New illnesses Inc 16 Number of people from outside coming to Canda will increase
These people have strange attitudes and will do what they want
Decline in health services
Same 14 Government lacks the funds to improve conditions or to hire more nurses
Traditional healers are getting expensive
Low quality of education
Same 9 Many teachers drink during work time
Salaries continue to be late
Likely to remain with many untrained teachers
Early marriage Same 16 Means for girls to attain better conditions (better than support at the family home) and less pressure on the family home
Influence of outside culture
Inc 18 Buyers from outside will continue to come looking for products
27
Table 17. Anticipated trends for positive environmental drivers in Canda. Each driver is rated in terms of whether its impact in 2014 is expected to be increased (inc), the same or decreased (dec), and the certainty associated with this prediction (1= highly uncertain to 20 = extremely certain).
Driver Impact Certainty Explanation
Good fertility of soils Dec 10 Monoculture production
Less chance for fallows
Reduction of hunger Same 5 Depends on rainfall
All people are involved in the production of food
Existence of natural resource legislation
Inc ? More effective application of penalties
But number of disorderly people likely to increase
Support for bee keeping activities
Inc 15 Reduced cutting of trees
Reduced killing of bees
Reduced burning of forests
Impact of Natural Resources Committee
Inc 14 Can explain regulations relating to natural resources
Improved management of natural resources
28
Table 18. Anticipated trends for negative environmental drivers in Canda. Each driver is rated in terms of whether its impact in 2014 is expected to be increased (inc), the same or decreased (dec), and the certainty associated with this prediction (1= highly uncertain to 20 = extremely certain).
Driver Impact Certainty Explanation
Increased presence of commercial farmers
Inc 12 Numbers may not increase but negative impacts will due to cutting trees to increase fields and increased use of water and fertilizers
Increase in number of families
Inc 20 Many young people now, which means increased future demand for land and houses, and pressure on forest resources such as bamboo, poles, firewood, etc.
Existence of timber companies
Inc 20 Pressure for timber companies to come here will continue
They cut everything, chase away animals, even destroy the grass
Rivers become drier and rainfall decreases
Uncontrolled use of resources
Inc 18 Increase in number of people so will need more trees for houses, firewood etc
Dryness Inc 10 Rainfall depends on God
Dryness will increase if current levels of tree cutting are continued
Opening of wells Inc 16 Increase in people mean that there will be an increased demand for clean water for drinking
More springs and rivers will run dry
Treatment of water Inc 19 Only in wells, but more people will mean more wells and so more treatment
Extraction of stones Inc 17 Stones are required for all kinds of construction so the demand will continue
Illegal hunting Same 14 Wildlife is decreasing
Control by fiscals and regulations will increase
Hunting of small animals for eating
Habitat for wildlife Dec 18 Control by committee
Committee has a management plan
Expansion of people will mean that there is no more habitat for wildlife so impact will be decreased
Decrease in wildlife Dec 15 Due to increased control
Many animals died during the war due to uncontrolled hunting so numbers are now low
Extraction of honey Dec 13 Beekeepers will change to boxes
Committee will control the extraction of honey
Burning Inc 12 Clearing of machambas will increase
The number of undisciplined people will increase
Horticulture and cash crop production
Inc 18 More people will be doing this
29
Driver Impact Certainty Explanation
Will result in the opening of more fields
Settlement near springs Dec 16 Traditional leader forbids this process
Control by government land law
Increased use of reeds for mats
Inc 19 More people locally will need mats
More buyers for mats from outside
Reduced levels of water Same 10 Depends on rainfall
Increase in number of buyers
Inc 18 Increase in number of people
Sleeping mats are a basic need for people
Chasing of animals Dec 17 Control on hunting by committee and government
Reduced burning in areas of hunting
Use of pesticides Inc 15 More people will be cultivating and producing crops
Decline of mushrooms Inc 10 Depends on rainfall
Depends on burning (more burning means less mushrooms)
3.7 Social Differentiation
The CRUAT recognised three different wealth classes within Canda: poor, intermediate and wealthy households (Table 19). The bulk of the community were estimated to comprise either intermediate (50%) or poor (40%) households, with the remaining 10% being somewhat wealthier. The poorest households have poor quality houses; do not produce sufficient food; do not grow cash crops; spend much of their time working for others; have little in the way of possessions such as clothes, tools and livestock; have no money; are excluded from leadership positions and have limited participation in cultural activities. Intermediate households have sufficient food and resources to get by, but with little extra to spare. The richest households have more resources, achieve higher crop production, including of cash crops, often hold positions of leadership and have a dominant role in cultural activities. Interestingly, no differences between wealth classes were suggested in terms of family composition.
The CRUAT were also asked to identify ways or causes whereby the wealth status of a household might change either for the worse (Table 20) or for the better (Table 21). The four most important factors potentially leading to a reduction in wealth were war, death of the head of household, burning of houses or grain stores and natural calamities, collectively accounting for 40% of the overall RIW. Individuals have little control over any of these factors. The remaining 60% of the RIW is spread amongst a further seven factors all of which do fall under individual control. The strongest of these were to be disorganized, failure to learn from others and to wait for help from others. When it comes to improving wealth status, eight of the nine listed factors fall under individual control, the exception being inheritance following the death of a relative. The top four factors, accounting for 71% of the overall RIW, all refer to being well organized in terms of management activities, particularly of agricultural production.
The CRUAT were finally asked what was likely to happen to different types of households over the next ten years (Table 22). The prediction was that poor households will get poorer, rich households will get richer, and intermediate households may or may not improve on their existing status. This is reflected in the associated assessments of certainty, the lowest score (10 points) being given in respect of the intermediate households becoming wealthier. The explanation is that the intermediate households have an adequate basis on which to develop and improve their wealth
30
status, but that not all will manage to do so. A significant factor with respect to the poorest households is that the cost of living is expected to continue to increase, making it difficult to escape from conditions of poverty.
Table 19. Indicators for three different wealth classes within Canda.
Families No differences in composition of families between different classes of households
Food Insufficient to eat every day Enough to eat every day Sufficient to eat regularly plus some to store
Tools and equipment None Have a few Have many different items
Land and forest resources Have access to forest resources, but unable to exploit these as too busy working for others
Use land for crop production and collect forest products such as firewood, fruits etc.
Has larger fields, otherwise uses much the same set of resources as do intermediate households
Leadership Man has no power in his own home, so cannot be a leader
May or may not hold some position of authority
These are the people who are usually appointed as leaders
Cash crops None – work in fields of others
Can grow up to one acre Can grow two or more acres of cash crops
House Traditional house in poor state of repair, or no house at all
Traditional house, but in reasonable condition
Traditional house in good condition, possibly with a zinc roof
Clothes and bedding Only one set per person, must wash them at night
Has two or three of each item
Sufficient to change daily
Money No money Can earn a little money through working for others
Sufficient money for household needs and can employ others
Livestock None Fewer than three each of chickens, goats and pigs
Greater numbers of animals, may also have cattle and ducks
Training and skills None May have some skills, particularly doing work for others such as making bricks, building or metal working
May have some skills, which enable them to be employed within the community
Transport None May have a bicycle Will have a bicycle, or possibly a motorbike or a car
Fruit trees None Have some at home Have some at home and may have a field of fruit trees
Cultural activities Seldom participates Participates regularly Participates and discusses events with the traditional leadership
Proportion of hholds (%) 40 50 10
31
Table 20. Potential causes of declines in household wealth class in Canda, scored according to their relative potential influence.
Possible causes of reduction in wealth RIW RIWS RIWC
War 100 0.146 0.146 Death of the head of household 90 0.131 0.277 Burning of houses or grain stores 85 0.124 0.401 Natural calamities e.g. droughts or floods 80 0.117 0.518 To be disorganized in household management 70 0.102 0.620 To wait for help from outside (donor assistance) 65 0.095 0.715 Failure to follow and learn from others 60 0.088 0.803 Laziness 50 0.073 0.876 Lack of agreement within the household 40 0.058 0.934 Not to participate in development programmes 35 0.051 0.985 To cultivate small fields 10 0.015 1.000
Total 685 1.000 1.000
Table 21. Potential ways of improving household wealth class in Canda, scored according to their relative potential influence.
Ways of increasing household wealth RIW RIWS RIWC
To be well organized in terms of household management 20 0.192 0.192 To know when to plant, cultivate, collect and sell crops 19 0.183 0.375 To have large fields with fertile soil and to grow cash crops 18 0.173 0.548 To manage crops and money well 17 0.163 0.712 To have an educated son who can help you 10 0.096 0.808 Through inheritance from other family members 8 0.077 0.885 To run a small business 7 0.067 0.952 Through use of traditional healers – witchcraft 4 0.038 0.990 To marry into a richer family 1 0.010 1.000
Total 104 1.000 1.000
Table 22. Anticipated trends for the three household wealth classes in Canda from the present to the year 2014, and the certainty associated with this prediction (1= highly uncertain to 20 = extremely certain).
Wealth Category Change to 2014 Certainty Explanation
Poor households Will get poorer 15 Cost of living is increasing Number of people per family is increasing and big families lead to poverty
Intermediate households
Will get richer 10 Established base for improving life Can employ others Can increase size of fields
Rich households Will get richer 19 Basis exists to maintain or improve on current level Motivated to stay at this high level or to improve
32
4. POSSIBLE CONTRASTING FUTURES FOR CANDA
4.1 Selection of Axes
Selection of axes was targeted to those drivers predicted to have highest impact and highest uncertainty. Results of the multiplication of RIWS by RUS scores for the top 19 drivers (those drivers with RIWS*RUS scores greater than 0.01) are shown in Table 23. The factor with the highest score was the existence of good land and soil for agriculture (RIWS*RUS = 0.35), followed by increased dryness (RIWS*RUS = 0.08), whilst the least significant of these 19 factors was support for restocking programmes (RIWS*RUS = 0.01).
These 19 drivers were then aggregated into 10 groups, and a total score was calculated for each group by summing the RIWS*RUS scores for each factor within the group (Table 23). The group with the highest total score was that concerned with sustained and increased production and sales of crops (0.42). This was followed by declining status of social services (0.18), increased dryness/reduced water levels (0.10), and increased burning, the maintenance of peace and reduced support for cultural activities (all 0.05).
Table 23. Nineteen social and environmental drivers with highest relative impact by relative uncertainty scores (RIWS*RUS), aggregations of these into ten different groups and the total RIWS*RUS score for each group. For Type, EP = environmental positive, EN = environmental negative, SP = social positive and SN = social negative; RC = relative certainty score, RU = relative uncertainty score (20 – RU); RUS = standardized relative uncertainty score (RU/20).
Driver Type RIW RIWS RC RU RUS RIWS *RUS Rank Group Group
Score Good land and soils for agriculture EP 500 0.699 10 10 0.50 0.3497 1 1 0.42
Increased production of crops SP 80 0.109 18 2 0.10 0.0109 18 1
Support for restocking programmes SP 10 0.014 5 15 0.75 0.0102 19 10 0.01
33
Based on this outcome it was decided to select crop production and social services as the two principal axes for the scenarios. For agriculture, the CRUAT expressed high certainty that production and sales will increase over the next ten years, including increased production of cash crops. What appeared to be considerably less certain was the degree to which this might result in increased wealth, or whether the increased income from crops would be negated by increasing prices for agricultural inputs and other purchased goods, which relates more closely to markets and prices rather than the actual production of crops. Accordingly the status of markets and prices was selected as the primary axis for splitting the future into separate possibilities (favourable markets and prices versus unfavourable markets and prices). The emphasis of the second axis of social services was the status of health and education services (improved versus deteriorated).
Additional chosen axes were the numbers of and investment by commercial farmers (high versus low), the growth of Vila Gorongosa and an increase in production of charcoal. These axes were added subjectively, but on the basis that these comprised potentially highly significant factors which appeared to have been largely overlooked by the CRUAT during their earlier deliberations.
4.2 Markets and Prices
Poor markets and prices were seen as leading to reduced incomes and increased poverty, and thus to impact broadly across all sectors of rural livelihoods (Table 24). Households would be less able to produce and/or purchase foods (crops, livestock and manufactured foods), and thus would experience reduced food security and possibly increased hunger. Fewer children would be able to afford to attend school and to afford examination fees. Access to medical facilities would likewise be impaired, leading to declining health status. More conflict would be experienced within families and the community (due to more corruption, thieves and liars), people would have fewer opportunities for involvement with development programmes, young men would experience greater problems with raising lobola and thus getting married, whilst there would be increased pressure for girls to marry younger, an increase in prostitution, and less opportunities for entertainment. People would also be less able to afford clothes and other purchased items. One possible response would be to seek to increase income through pursing alternative means of earning money.
Table 24. Predicted impacts arising from conditions of poor or favourable markets and prices to households within Canda village in the year 2014.
Poor markets and prices Favorable markets and prices
Lack of money Can afford to buy food products and thus have a better diet
Reduced capacity to buy good from shops Possible to buy animals
Reduced numbers of livestock Reduced levels of hunger
Increase in hunger Possible to buy more clothes
Lack of clothes Possible to travel to other places
Increased poverty More children able to attend schooling
Difficult to travel to other places Possible to support school fees for children
Increase in alternative forms of income generation likely to result in increased pressure on the environment
Increase in diseases, such as STD’s, as people come into the community
Fewer children able to attend school Better able to afford health care expenses such as hospitals
Unable to afford examination fees Increased numbers of weddings
Increase in illnesses such as AIDS and STDs Increased conflict between community members d id ( h h b i )
34
Poor markets and prices Favorable markets and prices
and outsiders (those who come to buy grain)
Unable to afford medications Possible to build better houses
Poor roads leads to increased crop losses (unable to get these to markets)
Can afford to buy bicycles
Reduced involvement in community development programmes Regulo can purchase a generator
Reduced number of local projects such as brick making Possible to open new and larger fields
Increased levels of local corruption (e.g. selling of food meant for feeding school children)
Can employ people to work in fields
Reduced number of official weddings as men are unable to afford lobloa payments
Can afford to use tractors in fields
Increase in young marriages particularly for girls Will be able to purchase seeds locally in the village
Increase in prostitution Possible to open small shops in the village
Increased presence of thieves and liars Many people will come to Canda looking for land for cropping
Increased conflict within families, particularly husband and wives due to increased hunger at home
Canda village will grow in terms of both population and structures
Few opportunities for entertainment All levels of families will increase in wealth (poor families through working for others and richer families through increased income from agriculture)
Favourable market conditions and prices, on the other hand, would lead to increased incomes. This would enable more of the same activities as at present, but would also open up new possibilities that are currently not possible. For example, with better income people would be more able to afford clothes, to send more children at schools, to have better access to health services, build better houses, increase production through employing others to work in fields etc. New opportunities would come in the form of improved diets (able to purchase more food goods), increased purchases and production of livestock, increased levels of travel to other places, purchases of new products such as bicycles, perhaps even a generator, and perhaps to make it possible for some households to afford to use tractors for ploughing, to open small shops within the village, and to be able to buy seeds directly within the village.
Increased crop production and sales would also lead to many people coming to settle in Canda (attracted by the presence of good land for agriculture), which might increase levels of conflict within the community. It would also attract many buyers to the community, which might have negative social consequences, for example increasing levels of diseases such as AIDS.
More specific information was collected as to what impacts poor or favourable markets and prices would be likely to have on agricultural systems and production (Table 25). Reduced incomes would clearly have a strong negative impact on agricultural production. Households would be less able to afford inputs (tools, animal or mechanical traction, seeds, fertilizers, insecticides), and would be less able to employ others to work in their fields. Therefore, households would have smaller fields, produce fewer types of crops, would experience reduced soil fertility (continued use of same fields and no use of fertilizers), and would suffer higher losses to pests. One potential coping strategy would be to seek to change the types of crops grown, in order to produce something else that might hopefully fetch a better return.
35
Table 25. Predicted impacts to farming systems and agricultural production within Canda village in the year 2014 arising from conditions of poor or favourable markets and prices within Canda village.
Poor markets and prices Favourable markets and prices
Fields will be smaller Will increase the size of fields
Will not be able to afford to employ other people to work in fields
Will continue to employ people in fields
Will produce fewer types of crops Will continue to grow the same variety of crops as at present
Will be difficult to find or afford some seeds Seeds will become more readily available
Reduced income due to smaller fields and low prices for products
Will continue to get fields of good fertility, although good land will become harder to find
Fertility of fields will be reduced but elsewhere will be retained (smaller plots)
Tools will be more readily available
Difficult to afford tools such as axes and hoes Way of clearing of fields will remain much the same, although some people will afford to get animals for ploughing
Not possible to afford animal traction Few people may afford to use a tractor to clear
Not possible to afford use of tractors Will continue to use fertilizers, but only on cash crops such as cotton, tobacco and tomatoes
Will not afford to buy fertilizers or insecticides or sprayers
Will abandon practice of multi cropping as this leads to depressed yields of the primary crop
Will continue to rely on local methods of soil fertility improvement such as the use of manure and crop residues
Those near the mountain will continue to irrigate crops as they do at present (tobacco, onions, tomatoes)
Lack of chemical control will lead to increased levels of pests and diseases
Future production of cash crops is hard to predict as this depends to a large extent on the inputs of companies
Will continue to do multi cropping of maize, sorghum, beans and cassava
Will try alternative crops in an attempt to find something that brings a better return, but production will continue in the same field
Under more favourable market and price conditions households would be able to increase the size of their fields and to employ others to work in their fields, and thus to increase their overall production. Otherwise the system of production was expected to remain fairly similar, i.e. people would still produce much the same varieties of crops and in much the same manner as present (although a few families may be able to afford to use animals and tractors for ploughing). It was recognized that such conditions would lead to increased difficulties in terms of finding or securing access to additional good land.
Predictions were also specifically sort as to the likely consequences of poor versus favourable markets and prices for crops as regards natural resources and the environment within the village area (Table 26). Under poor market conditions, there would be less clearing of land for agriculture, such that in 2014 good land would still be readily available for further farming.
More favourable market conditions were seen as leading to increased pressure on natural resources, through increasing conversion of woodlands to fields coupled with increasing numbers of people (due to both natural growth and high levels of in migration). Soil fertility within fields was predicted to decrease (due to repeated cropping). It was envisaged that the Canda Natural Resources Committee might be able to effect some control over the use of woodland resources,
36
particularly on the mountain area, over the use of timber and wildlife, and through controlling the incidence of fires.
Table 26. Predicted impacts to natural resources and the environment within Canda village in the year 2014 arising from conditions of poor or favourable markets and prices within Canda village.
Poor markets and prices Favourable markets and prices
Land for farming will still be available due to few people taking up farming and small fields
Soil fertility will decrease
Little use of water for irrigation, so will remain the same
Use of water will increase for irrigation and for household use
Level of water in rivers will be maintained, depending on natural factors (rainfall)
Access to water will be maintained through construction of additional wells and through continued treatment of well water with chlorine
Sales of forest products such as wood, poles and grass will decrease, but people will continue to use these for building houses
Forest resources on the mountain will be maintained but elsewhere will be reduced through continued use and sales
Timber resources will be retained, as few people will come to settle here and there will be little pressure for clearing new fields
Cutting of bamboo will increase as more people will come to settle here
Local consumption of honey will increase but due to lack of money sales (and thus production/gathering) will decrease
Grass resources will be maintained as more people will be able to afford zinc roves
Wildlife will increase – some people will use for consumption but sales of meat will decrease
Timber resources will be maintained due to control over cutting by natural resource committee
Production of honey will be continued
Fires will reduce due to increased levels of control
Wildlife will increase, particularly in those areas set aside for forest resources, and due to improved management by natural resources committee
The most likely potential causes of poor prices were seen as being a lack of competition amongst buyers and a lack of organization among producers (Table 27). Despite government setting minimum prices, it is likely that it will be possible for merchants to avoid these and effectively set their own prices, partly because many of the buyers appear to be linked to high ranking government officials. On the other hand, unless there is improved cooperation within the community it will make it impossible for the community to set and stick to an agreed minimum price. The poor condition of internal roads might remain an additional constraint for some producers to get their products to market or to be able to market their crops to advantage. The CRUAT did not think that they would be able to benefit much through transporting crops outside of the district and marketing elsewhere such as Chimoio, Beira or even Maputo. Community participants did not raise any concerns about wider economic issues such as grain imports or subsidies, and the potential implications of these for local markets.
How could better prices for crops be achieved? The principal suggested solution was for better community organization, such that all producers could agree and stick to a set price, rather than having a less favourable price dictated to them by the buyers. It was suggested that one way of achieving this would be to sell crops only from designated points rather than from individual houses. It was also suggested that an open market be maintained such that any buyers could come
37
to Canda (formerly people were only allowed to market to buyers based within the district), with the hope that this might ensure greater competition between buyers.
Table 27. Possible causes of poor or favourable markets and prices for agricultural products for farmers in Canda.
Poor markets and prices Favourable markets and prices
Lack of agreement on prices within the community People are organized and agree to stick to fixed prices
Prices set by buyers Prices of goods dictated by sellers
People sell products at low prices People able to sell goods at favourable prices
Poor state of roads makes it difficult for some people to bring products to the main road
Community designate one or more spots for selling, rather than from individual households
Buyers are government officials or else enjoy the protection of government members
Open markets such that people are free to sell their products to any buyers (previously could only sell to buyers from within the district)
Minimum prices are set by government but these are not respected
Prices are agreed between producers and buyers
In terms of potential alternatives for generating income, other than through crop sales, the principal suggestions were to seek employment (either within the community, or outside of Canda), or to seek to deal in semi-precious stones or gold. No mention was made of sales of other natural resources such as charcoal, bamboo, poles or grass, nor of tourism. The possibility of personally moving crops outside of the district, for example to Chimoio or Beira was considered, but was again largely dismissed as being difficult and usually not profitable.
4.3 Social Services
The CRUAT noted considerable differences in terms of predicted impacts associated with improved versus static or deteriorating health facilities. Improved conditions were seen as resulting in more community health centres, better condition of facilities, improved availability of medicines, better maternity assistance and fewer infant deaths (Table 28). Of concern was the fact that these conditions were not seen as leading to any reduction in the incidence of AIDS, on the basis that many people within Canda to not accept to use protection, and that this will not change.
Under poorer conditions of health services, access to formal health facilities (community health centres and hospitals) will be reduced, and people will be forced to increasingly turn to alternatives such as traditional healers and prophets. Some people will still go to the hospital at Vila Gorongosa, but only for serious cases. Child mortality could be expected to increase.
38
Table 28. Predicted impacts to households in Canda in the year 2014 arising from conditions of poor markets and prices but improved health services versus and favourable markets and prices but poor health services.
Poor markets and prices Improved health services
Favourable markets and prices Poor health services
Everyone will have access to health care Number of health centres will decrease
Improved community health centres (extended range of services)
Number of nurses in health centres will decrease such that there are no nurses in the community
Improved availability of medicines and emergency facilities
Difficult to afford to construct a health centre in the village
Not so far to travel to health centres Some people will still go to hospital in Vila for serious cases
Good staff, medicines and technical equipment in health facilities
Increase in deaths due to lack of vaccinations and control of diseases
Decrease in infant mortality Incidence of child mortality will increase
Number of assisted births will increase Women will continue to have babies at home
Fewer deaths People will collect medicines from the forest
Use of condoms will not increases People will use traditional remedies
Uptake of family planning will not increase People will go to prophets to discover the cause of illnesses
Level of AIDS will increase (even with good health services) as people will not accept to use protection against AIDS
People will go to traditional healers
Number of traditional healers will increase
People will start selling medicines within the community
Incidence of AIDS will increase as women do not like to use condoms
Level of family planning will decrease for cultural reasons, for if women fail to give more children then the husband may find another wife
Similar predictions were made in terms of educational facilities. Improvements in education were seen as potentially coming in the forms of both more facilities and better quality of services (Table 29). Under such conditions it was envisaged that families would be better motivated to send children to school and, in particular, should secondary schooling become available within the community, this would provide a means of getting better jobs and thus improving incomes. An additional benefit would be that with increasing levels of literacy, people would be expected to have a better understanding and uptake of development programmes.
Under the alternative situation of deteriorating educational services, households were predicted to place less value on education, such that children would instead be drawn into production activities such as crop production. It was suggested that the community might try and make up for the lack of state support, through constructing their own school and hiring a local teacher, but this is unlikely to be particularly effective. Literacy will decrease, ultimately leading to lesser understanding of development initiatives, and people will be poorly equipped to take up higher paying employment opportunities outside of the village.
39
Table 29. Predicted impacts to households in Canda in the year 2014 arising from conditions of poor markets and prices but improved education services versus and favourable markets and prices but poor education services.
Poor markets and prices Improved education services
Favourable markets and prices Poor education services
Number of schools will increase and also the number of classrooms and houses for teachers
Reduced number of schools
Quality of education will improve Quality of education will be reduced
Community will be mobilized to send their children to school, and even adults to attend adult education classes
Will only be able to go as far as Grade 5, as at present
Construction of a secondary school in Canda will greatly reduce costs of secondary school
Will not be able to afford to send children to secondary school outside of Canda
Levels of illiteracy will be reduced Level of illiteracy will increase
With good education children will be able to get better jobs and then send money home and so improve life in Canda
Will concentrate on farming activities
Poverty will decrease Will only be able to work on farms within the community and not to get better paid jobs
Community development will increase (people will better understand programmes such as the need for boiling water or vaccinations etc.)
People will become poorer as will not be able to earn money from working
Community development will decrease with decreasing levels of literacy
Will construct a school from local materials
Will choose someone from the community with experience to teach at the school
Everyone will contribute towards payment of the teacher either in form of crops or else money
4.4 Investment by Commercial Farmers
The third axis selected was that of low versus marked influx of commercial farmers and corresponding levels of investment. The presence of commercial farmers was seen as having both advantages and disadvantages (Table 30). High levels of investment were seen as leading to improved work opportunities, better services (particularly roads), and increased and improved economic activity in the form of more and better shops within the village, plus many buyers coming to Canda thus resulting in better prices for crops. However, there were also concerns that commercial farmers would seek to clear large tracts of land, thus increasing pressure on land resources, remaining woodland resources and, through the use of water for irrigation, particularly on water resources. Under conditions of little investment by commercial farmers the general perception was that of lower incomes and thus continued or increased poverty, i.e. loss of the opportunity to increase earnings through working for commercial farmers.
40
Table 30. Predicted impacts to households in Canda in the year 2014 arising from conditions of poor markets and prices, improved health and education services and little in migration and investment by commercial farmers versus and favourable markets and prices, poor health and education services and high in migration and investment by commercial farmers.
Poor markets and prices Improved health and education services
Little in migration and investment by commercial farmers
Favourable markets and prices Poor health and education services
High in migration and investment by commercial farmers
Lack of work opportunities Will go to work on the farms
Lower levels of income Employment on farms will enable improved standard of living
People become poorer Will be many shops in the village selling household items such as oil, sugar, soap etc.
Reduced opportunities to afford medications and to send children to school
Roads will be improved as farmers will want to move with their cars
More land will be available for fields Commercial farmers will produce large quantities of crops
Soil fertility will be maintained Commercial farmers will send crops for sale outside of Canda
Fewer new illnesses due to less movement of people Many people will come to Canda to buy crops here
Decrease in polygamy (unable to afford lobola) Prices of products in Canda will increase due to the commercial farmers
Quality of houses will remain the same (local materials – poles, clay, bamboo, grass)
Will be an increase in polygamy as people can afford to take additional wives
Increased movement of people will lead to an increase in illnesses
Growth of commercial farmers will lead to a shortage of land for fields in the community
Opening of big fields will lead to a reduction in forest cover
Clearing of woodland will lead to reductions in forest resources such as poles, bamboo, grass, firewood etc.
Use of water for irrigation will result in shortages of water in the community
4.5 Charcoal Production and Growth of Vila Gorongosa
Increased Production of Charcoal. The CRUAT did not perceive possible increased production of charcoal as bringing anything much in the way of benefits to their community (Table 31). They predicted that the prices achieved within Canda would be very poor, and that producers would respond by seeking to produce ever greater quantities. Despite attempts at regulation, it was predicted that people would find ways of circumventing controls, thus resulting in a system of open access, including by people from elsewhere. Massive production would soon result in environmental problems, including deforestation, reduced rainfall, increased dryness, and the
41
displacement of wildlife etc. Lower rainfall was also seen as resulting in lesser crop yields and thus increased hunger and poverty.
Growth of Vila Gorongosa. The possible growth of Vila Gorongosa was generally seen as being highly positive for the Canda community (Table 31). Such growth would provide opportunities for employment plus good markets for crops and livestock. It might also make it possible for some children to access secondary education at the school within Vila Gorongosa. The anticipated arrival of electricity was expected to lead to the establishment of timber processing facilities, which would ensure a high demand for timber from Canda. As Vila expands it was predicted that access to building materials such as zinc sheets for roofing would improve, and that people would be more able to afford them. On the other hand growth of Vila was associated with increased numbers of buyers coming to Canda, and also with some people working in Vila for the week and returning home on weekends. The CRUAT were concerned that these movements would be likely to result in higher levels of diseases, particularly AIDS.
Table 31. Predicted impacts to households in Canda in the year 2014 arising from conditions of increased charcoal production and by pronounced growth of Vila Gorongosa.
Poor markets and prices Improved health and education services
Little inmigration and investment by commercial farmers
Increased production of charcoal
Favourable markets and prices Poor health and education services
High inmigration and investment by commercial farmers
Pronounced growth of Vila Gorongosa
Many people will come from Vila to buy charcoal in Canda
Some people will go to Vila to get work
People will buy in Canda at low prices Some (few) children will go to Vila for secondary school but this will still be difficult to afford
Canda members will sell lots of charcoal but at low prices
Development of milling business will create a good market for crops
People will respond to low prices by producing large quantities of charcoal
Crop production and thus incomes will be increased
People will find ways to avoid regulations concerning quantities of charcoal to be produced
Increased incomes will enable purchase of more clothes
People from outside will come to produce charcoal in Canda, take it to Vila and sell it at better prices, but people from Canda will be stuck with low prices
Increased incomes will enable higher levels of polygamy
Increased production will put great pressure on forest resources
Presence of electricity will enable development of timber processing businesses and thus stimulate cutting of timber within Canda
Area of woodland will be reduced Presence of butcheries in Vila will lead to increases in livestock in Canda as many people will be coming to Canda to buy animals
Levels of water in rivers will be reduced State of houses in Canda will improve as zinc sheets will be available in Vila and with improved incomes more people will be able to afford these
Deforestation will lead to reduced rainfall and thus increased dryness
Incidence of illnesses will increase as many people will come to Canda to buy crops and some people will work in Vila during the week and come home for the weekends, thus increasing the chances of AIDS
42
Poor markets and prices Improved health and education services
Little inmigration and investment by commercial farmers
Increased production of charcoal
Favourable markets and prices Poor health and education services
High inmigration and investment by commercial farmers
Pronounced growth of Vila Gorongosa
Deforestation will lead to less honey gathering and honey production
Increased demand for forest products, such as timber, will result in increased resource conflicts and stimulate increased control by the natural resources committee
Dryness will lead to increased crop production
Fewer crops will result in increased hunger
Due to hunger, children will stop going to school and instead work with their parents doing other activities
Soil fertility will decrease due to deforestation
Desertification will increase
Loss of woodland will lead to displacement of wildlife
4.6 Impacts to Different Wealth Classes
As a final exercise the CRUAT were asked to consider the likely impacts of different market conditions (poor markets and prices versus good markets and prices) for families of different wealth status (poor, intermediate and rich families) within Canda. Regardless of market conditions, it was predicted that the wealthiest families would continue to get richer, largely on the basis of being able to increase the size of their fields, employ others to work in their fields, and market crops to better advantage than less wealthy families (Table 32). Similarly, households of intermediate wealth were seen as having the potential to become richer, this time on the basis of increased agriculture or else through working for others. However, few were expected to do sufficiently well to elevate themselves into the wealthiest category. The main difference was apparent for the poorest households. With poor markets and prices, these families were predicted to get poorer. However, under more favourable prices and markets it was anticipated that such families could improve their status and become a little wealthier. A key factor appeared to be the extent to which households are well organized and have the necessary skills to improve their situation.
Table 32. Predicted impacts to households in Canda of different wealth status in the year 2014 arising from conditions of poor markets and prices within Canda village versus favourable markets and prices.
Wealth status Poor markets and prices Favourable markets and prices
Poor Not organised to improve lives
Lack the basis for starting any business or improving status
Cost of living will increase
Will become poorer
High levels of stress will drive people to
Will sell some crops
Will work in fields of others in Canda
Will seek work in Vila Gorongosa
Will improve their status a bit
43
Wealth status Poor markets and prices Favourable markets and prices
continue to drink
Middle Will be able to crop bigger fields
Will get help from wealthier families to improve their status
Will increase in wealth but will not reach the rich category
Will continue to sell crops
Will work for farmers
Will increase livestock for consumption and sales
Will get wealthier
Rich Will increase the size of their fields
Will be able to transport crops outside of Canda and thus achieve better prices
Will be able to start other businesses
Will continue to be wealthy
Will be able to improve their homes
Will have bigger fields
Will know how to sell their crops for good prices
Will improve their lives (better houses, radios, bicycles, afford transport)
Some may afford to buy a car to move around
Will get richer
44
5. SCENARIOS
Based on the above results, two alternative scenarios have been developed: “Growing Through Farming” and “Mixed Development”, as described below.
5.1 Growing Through Farming
Over the next ten years the people of Canda continue to focus on agricultural production. Demand for agricultural produce remains strong, and farmers are able to achieve reasonable prices for their produce. This is reinforced by an increased degree of cooperation within the community. People gradually learn that through agreeing to sell only from designated points within the village, it gives them some ability to dictate minimum prices for their main produce, rather than remain at the mercy of traders.
Favourable prices result in better incomes, which enable improvements to many livelihood components. People are able to clear and manage bigger fields, thus increasing production. This leads to improved food security, and families are also more able to purchase additional food items from shops, and to keep more livestock, resulting in improved diets including higher levels of protein. People are able to purchase more clothes, to build better houses and to afford more products from shops. Improved wealth contributes to a decrease in family conflict, and it becomes easier for young men to afford lobola payments and to get married. Greater incomes also lead to increased spending and competition between families.
The general expansion of agriculture has created a strong demand for labour. Attracted by the favourable agricultural environment many people seek to come and settle in Canda. The community welcomes any such new settlers, partly because they provide a source of labour to help others in their fields. Few people move away from Canda, although some find work in Vila Gorongosa, where they typically stay during the week, returning to their family homes over the weekends.
Faced with increasing workloads children, particularly of poorer families, are pressured to leave school and work in fields instead. Although many families are now better placed to afford school and examination fees, education is no longer as highly valued as before. This is exacerbated by a general decline in the quality of educational services, due to poor investment by government in this sector. Donors too, with the general increase in wealth, are increasingly turning to other poorer communities whose needs appear to be greater.
More families turn to cash cropping, particularly tobacco and cotton, but also horticultural products such as onions, garlic, potatoes and green vegetables. The production of cash crops is supported by external companies, who provide the necessary inputs such as seeds, fertilizers and pesticides. This leads to increased use of chemicals, although they are still not used much for other crops such as maize and sorghum. Tools such as axes and hoes, and seeds also become more readily available within Canda. A few families build up sufficient animals to use for them for ploughing and transport, but for most families the bulk of agricultural work is still done by hand.
Continued agricultural expansion requires the clearing of more fields, such that by 2014 it is becoming more difficult to find good land. Although land is still available, all the best areas are now being fully utilized, leaving only patches of less favourable land with lighter soils and steeper slopes. Fallow periods start to decrease, leading to a loss of soil fertility. Increased clearing leads also to higher rates of soil erosion. Agricultural extension advice is largely tailored to cash crops, but the commercial companies encouraging such production have little commitment to sustainability. There is little uptake of conservation techniques such as contour ridging and minimum tillage.
45
Continued conversion of additional lands to agriculture results in a marked decrease in woodland cover, and associated decline of forest resources. However, firewood is still reasonably available, as are poles and bamboo. These can still be harvested from the remaining woodland areas, either directly or else purchased (by wealthier families). Increased incomes also result in an increased demand for meat, such that by 2014 virtually all wildlife has been eliminated from Canda.
There is also some suggestion of declining water resources, although the evidence remains inconclusive. However, increased deforestation has lead to increased and more rapid runoff, thus contributing to increased erosion (and also downstream siltation, but mainly outside of Canda village). Such erosion is exacerbated by an increase in riverbank cultivation. There is also some suggestion that the increased clearing may be contributing to reduction in water quality. The increased use of agricultural chemicals has also caused a decline in water quality, particularly of surface waters. Underground supplies, however, have not been seriously impacted.
Land shortages and conversion of woodland have been further exacerbated by a considerable influx of commercial farmers, attracted to Canda by favourable agricultural conditions. Whilst this development has provided a number of positive outcomes, such as opportunities for employment (although wages have generally remained low), improved roads, introduction of new crops and technologies, better prices for crop products, and better availability of goods within Canda, it has also lead to increased pressure on resources, through clearing of large fields and increasing use of irrigation. Due to the corrupt granting of licenses by the community and district leadership, some families have even been displaced to make way for commercial farmers.
Increased incomes also contribute to a rapid opening up of Canda to the outside world. There are increasing numbers of people coming into Canda, both to settle and to buy crops. People from Canda are also better able to afford to travel to other places, including for purpose of operating small businesses. One result to this increased exposure is an increase in social problems, partly from outsider coming to settle in Canda but who are not familiar with local customs, and also from young people who travel out from Canda and learn other behaviour. Initiation ceremonies, for example, have now been abandoned.
The most serious impact of this increased mobility is an increased incidence of AIDS. This is serious as though many families are now better able to afford treatment the level of treatment available has not improved, and has possibly even deteriorated. Disillusioned with the poor state of community health centres and hospitals, and frequent shortages of medicines, many people turn instead to traditional healers and prophets. However, their cures for AIDS do not prove effective. As AIDS increases it starts to take a greater toll in the community. Increasing deaths, particularly of heads of households, is a frequent cause of significant declines in family wealth status.
The increase in AIDS is also exacerbated by the growth of Vila Gorongosa and growing levels of interactions between Canda and the town. However, such growth also provides good opportunities in the form of markets for crops (particularly following the initiation of milling businesses), and livestock (to feed the new butcheries), and also increased employment. As Vila expands so goods such as zinc sheets for roofs also become increasingly available.
Under these conditions virtually all families experience some increase in wealth status. The richer families are able to increase their production, as well as start new activities such as trading in livestock and operating small businesses. Families of intermediate wealth are also able to increase their production, can also work for others, whilst some people are able to find employment on commercial farms or else in Vila Gorongosa. Some of the poorer families, through assistance from wealthier households, are also able to improve their status.
46
5.2 Mixed Development
Over the following decade the people of Canda continue to grow reasonable crops, but experience considerable difficulties in marketing these to any advantage. Regardless of minimum prices controls, traders with political connections can easily circumvent these and control any potential competition, such that they are able to effectively dictate prices paid for crops within Canda. This situation is compounded by a lack of agreement and organization amongst community members, such that there is no agreement on prices within the village. Coupled with a steady increase in the cost of living, most households are faced with a situation of dwindling relative incomes from agriculture.
Reduced incomes are reflected, for example, by poorer houses and fewer clothes. In addition, it places strains within families, which manifests in the form of increased marital discord, and also elevated levels of theft and local corruption. Young men struggle to find the resources to raise lobola, and are thus unable to marry. On the other hand young girls tend to get married even earlier than before, thus bringing in lobola payment whilst at the same time removing responsibility for upkeep from the parent family. Some girls even resort to prostitution in order to able to better provide for themselves. Individuals find it more difficult to participate in local development initiatives. It is the poorest families that are particularly hard hit, partly because other families are less well placed to offer them support, for example through employing them to work in their fields.
The poor returns achieved for crops also have considerable impacts to farming systems. Farmers are now less able to access and afford inputs and to pay people to work in fields. As a result fields tend to be smaller and total yields correspondingly lower. Fewer varieties of crops are grown and fewer chemicals are used. Farmers try experimenting with alternative crops in the hopes of achieving better returns, but are not particularly successful.
Depressed production and income leads to an increase in nutritional and health problems, leaving people more exposed to diseases, especially AIDS. Although government has maintained an agricultural policy that is basically hostile to small rural producers, they have managed to provide relatively high levels of support to the health and education sectors. This has enabled modest expansion of existing health facilities, including the opening of a community health centre within Canda, and improvements to the district hospital in Vila Gorongosa. The availability of medicines remains reasonably good, and due to subsidies these are still relatively affordable for the Canda community. Donor agencies have made important contributions, particularly towards AIDS awareness, treatment and support programmes. Pit latrines have also been introduced, and have had a marked impact in terms of improving community health and decreasing infant mortality.
There is a similar general improvement in education facilities. However, some families are not able to raise the necessary money for school fees, or examination fees, such that their children are unable to attend or complete their schooling. Those that can afford the fees tend to place a high value on education, in the hopes that this may lead to employment opportunities outside of the district, which could make an important contribution to household incomes.
Under the prevailing conditions of declining farm incomes, residents from Canda are forced to explore alternative sources of income. Some are able to find employment on commercial farms within the village, but the extent of these is relatively limited, and wages received are relatively poor. Others turn to gold panning and mining of semi-precious stones, but again this does not prove particularly rewarding. There is also a marked increase in the sale of forest products such as bamboo, poles, grass, reed mats and charcoal, both locally and to outside of the village, particularly Vila Gorongosa.
47
Of these resources, it is charcoal production that is most significantly increased, both by village residents and others coming from outside, with the bulk of the production being sold to Vila Gorongosa. However, prices realized within Canda remain strongly depressed, the bulk of the profit going to transport carriers and traders higher up the chain. Producers respond by seeking to produce greater volumes of charcoal, such that overall production continues to increase, resulting in rapid deforestation of the Canda landscape.
As progress is made with rehabilitation and development of the nearby Gorongosa National Park, interest is raised concerning the possibility of tourism ventures on Gorongosa mountain, including within Canda village. A small facility is eventually established. Although this does not result in significant levels of income, it does lead to improved environmental management of the surrounding areas. Cultural tours by foreign visitors to Canda also result in significant donations towards schools and health facilities.
Together with a local NGO, significant support is provided to the Canda NRM Committee, who start to function more effectively. With improved capacity the committee finds that it is able to exercise greater control over the village area, for example as regards the protection of mountain resources and the establishment of commercial farmers. In this respect new farmers are stopped from settling further into the mountain area, and emphasis is given to those interested in more intensive production, particularly where there are possibilities for out grower schemes. The NRM Committee, with NGO assistance, is also able to be proactive in the promotion of progressive agricultural conservation measures.
The NRM also manages to bring some order to the previously corrupt allocation of charcoal production licenses, effectively restricting production to local residents only.
Similarly, it manages to exert control and thus revenues from the extraction of stones from the local quarry, fuelled largely by significant growth in the town of Vila Gorongosa. The same applies to other resources such as timber and honey. Collectively these ventures result in modest additional income at the household level within Canda.
Following the victory of the opposition party in the 2009 national elections, government expenditure within Sofala Province and Gorongosa District, in particular, is increased. In addition to the general improvement of health and education services, there is a marked increase in allocation to road maintenance and development. Improvement of the feeder roads provides a significant boost to those farmers located further away from the main road. The new government also seeks to improve the agricultural sector, for example through promoting alternative and niche markets, where higher prices can be realized. The new political situation also opens significant new possibilities for employment outside of the district.
48
6. DISCUSSION
6.1 Implications for the Canda Community
The results of this study suggest that the Canda community is set for considerable expansion of agriculture. This will occur through existing families increasing the size of their fields, new families coming to settle in Canda, and the establishment of commercial farmers. With good soils and adequate rainfall, Canda has a natural advantage in this respect, and which is further enhanced through being positioned alongside a major road and within reasonable proximity of significant urban centres. Faced with the possibility of escalating cost of living, the extent to which this is likely to translate into increased wealth remains uncertain.
Agricultural growth will come at considerable expense to the environment, through increased conversion of woodlands to agriculture and associated loss of woodland resources. The Canda NRM Committee will face considerable challenges in trying to balance these divergent interests, and will probably require considerable support if they are to be successful in this. The ten year time scale for the scenarios was relatively short, and there appeared to be a general perception by the community that any negative environmental impacts would not be particularly severe during this period. Little interest was expressed in terms of any tourism opportunities.
Possible mitigating measures would be to seek to further capacitate the NRM committee, to enhance their ability to deal with natural resource management issues. Another possibility might be to seek to manage the in migration of commercial farmers, and seek to encourage smaller, more intensive, high income operations such as horticultural projects rather than more extensive field crops such as maize. This should serve to maximize the positive benefits whilst at the same time containing the potential negative effects.
Sadly, AIDS appears set to expand within Canda, with devastating impact. Community participants, despite having high awareness of the dangers of AIDS, expressed strong resistance to changing behaviours and adoption of potential protective measures. Here is another obvious area where assistance could potentially yield great benefits.
Potentially important stochastic events that were not directly addressed during this study include the possible impacts of droughts or floods, and also the potential impacts of different political parties coming to power. Equally important would be national policy and macro-economic issues that lie largely outside of the control of the community.
6.2 Further Work
It would have been desirable to develop the actual scenarios with the community, or at least to present the two storylines to the CRUAT for discussion and validation. Hopefully GTZ may still find chance to do this as part of their procedure of reporting back to the Canda community.
There are several other ways in which this work could usefully be carried further. One would be to seek to extend this approach to other communities, and through comparison of results evaluate how widely applicable the different scenarios might be. Another possibility would be to take these scenarios to other communities and use them to assess the possible response options to the different conditions and, in doing so, to seek to understand the limitations or constraints that define potential response options by different groups.
If nothing else the results of this exercise should provide a sound indication as to the factors that are likely to influence the future development of the Canda community, and thus provide a useful tool for the planning of any future interventions.
49
7. ACKNOWLEDGEMENTS
Numerous people made important contributions towards this study. In particular, I thank the many participants from the Canda community without whom this study would not have been possible. Equally important was the support provided by GTZ-PRODER, including funding. I am grateful to Martinho Anselmo, Marcelino Goba and Almerindo Dos Santos who participated and provided sustained assistance throughout the fieldwork, in form of logistical support, organization, facilitation and interpretation as well as background information and materials. Additional assistance was received from Berta Rafael, also of GTZ, plus Feliciano Picardo and Victor Semo both of ORAM. GTZ- PRODER also provided comfortable accommodation and transport for the study. Finally, I thank Jean-Paul Vermeulen of GTZ, Beira and Tim Lynam of IES, Harare for their sustained support and guidance in carrying out the study.


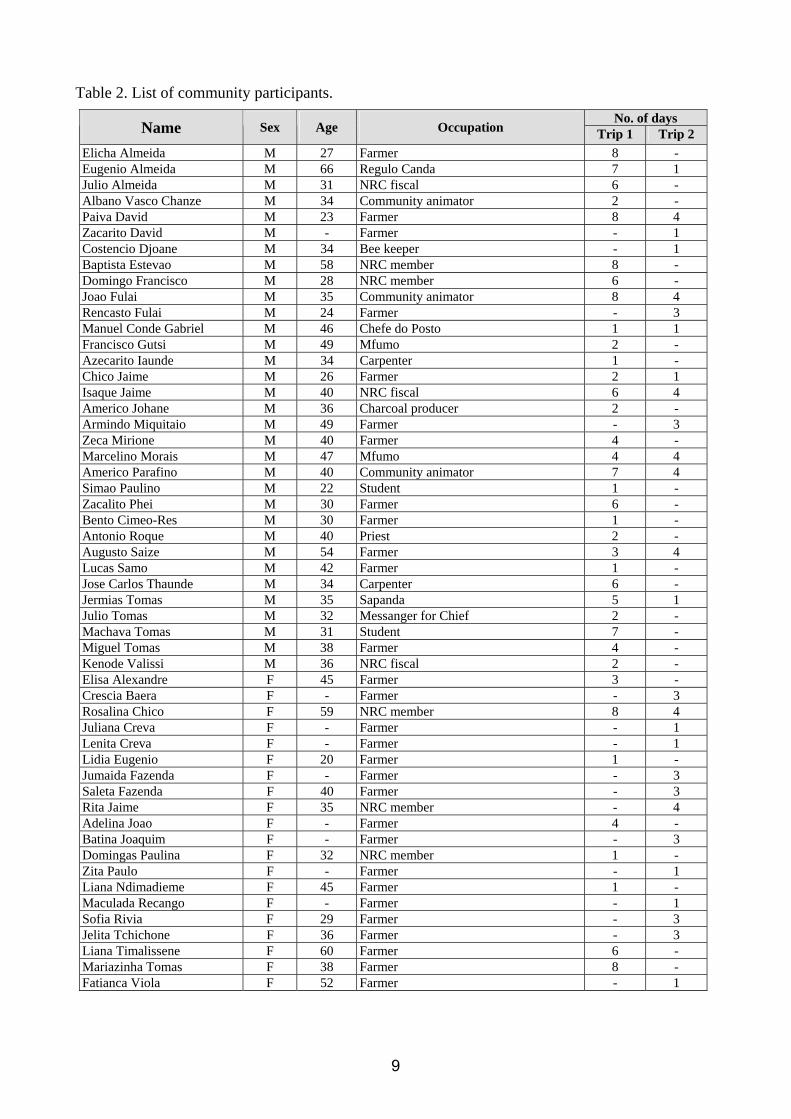

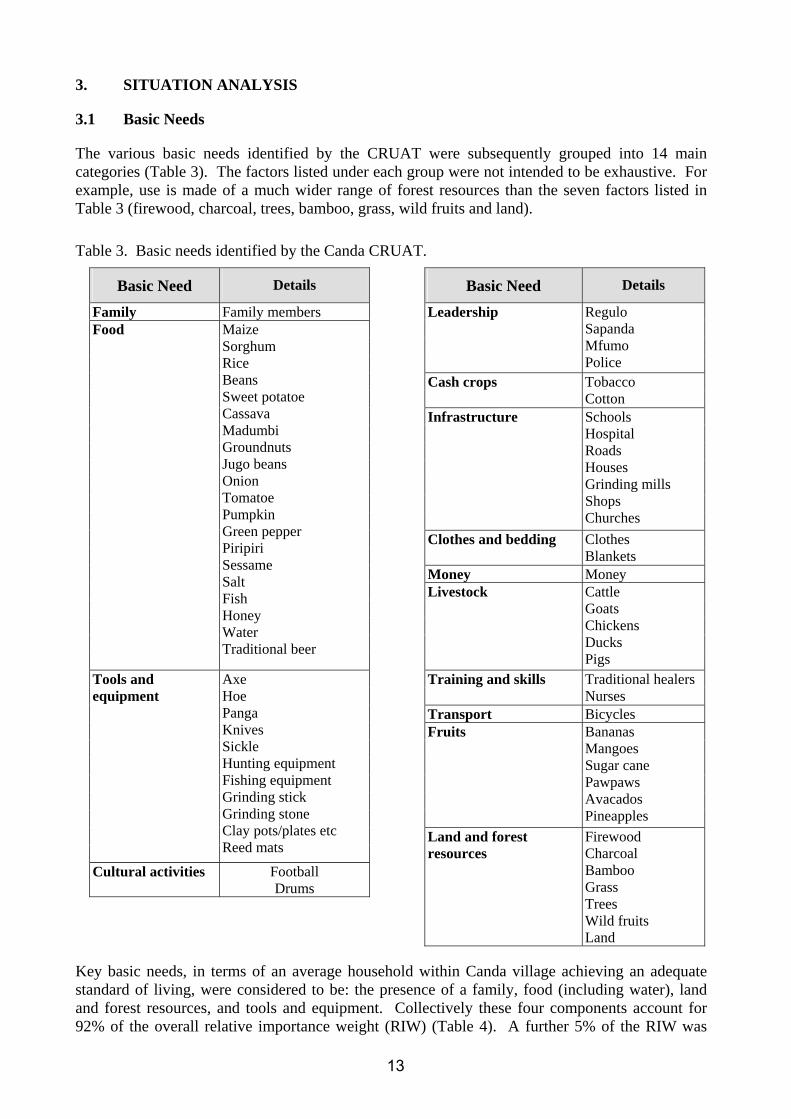
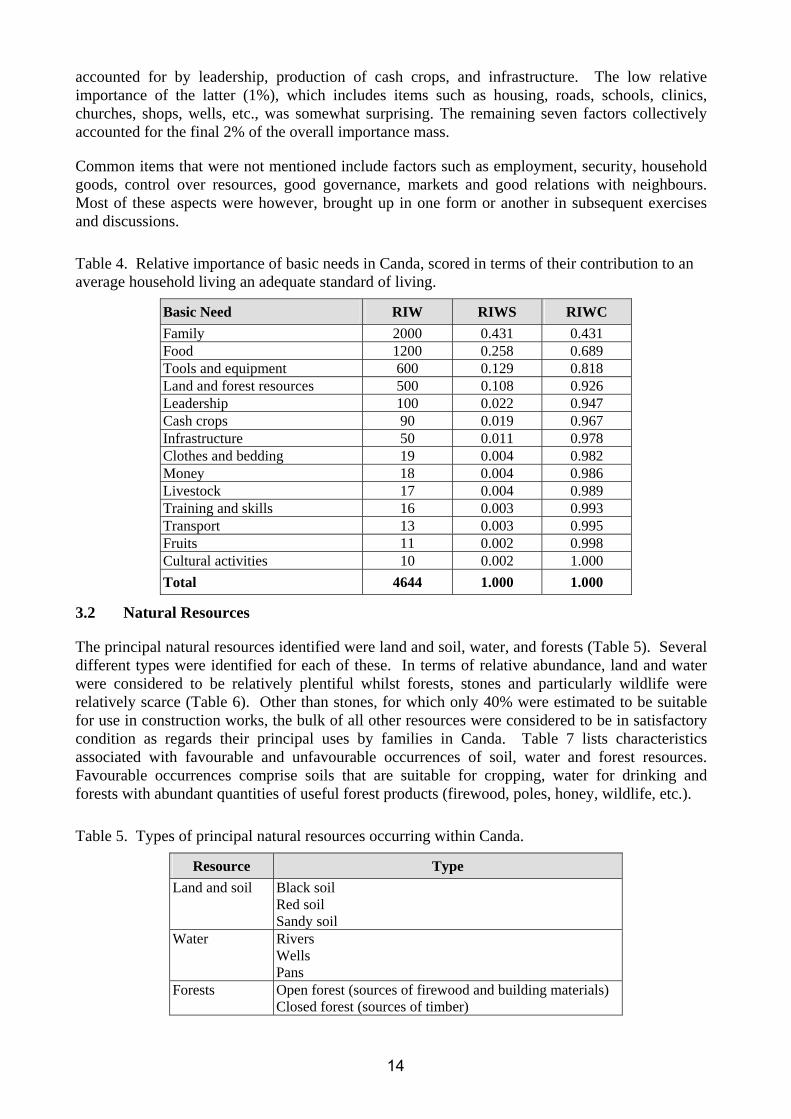
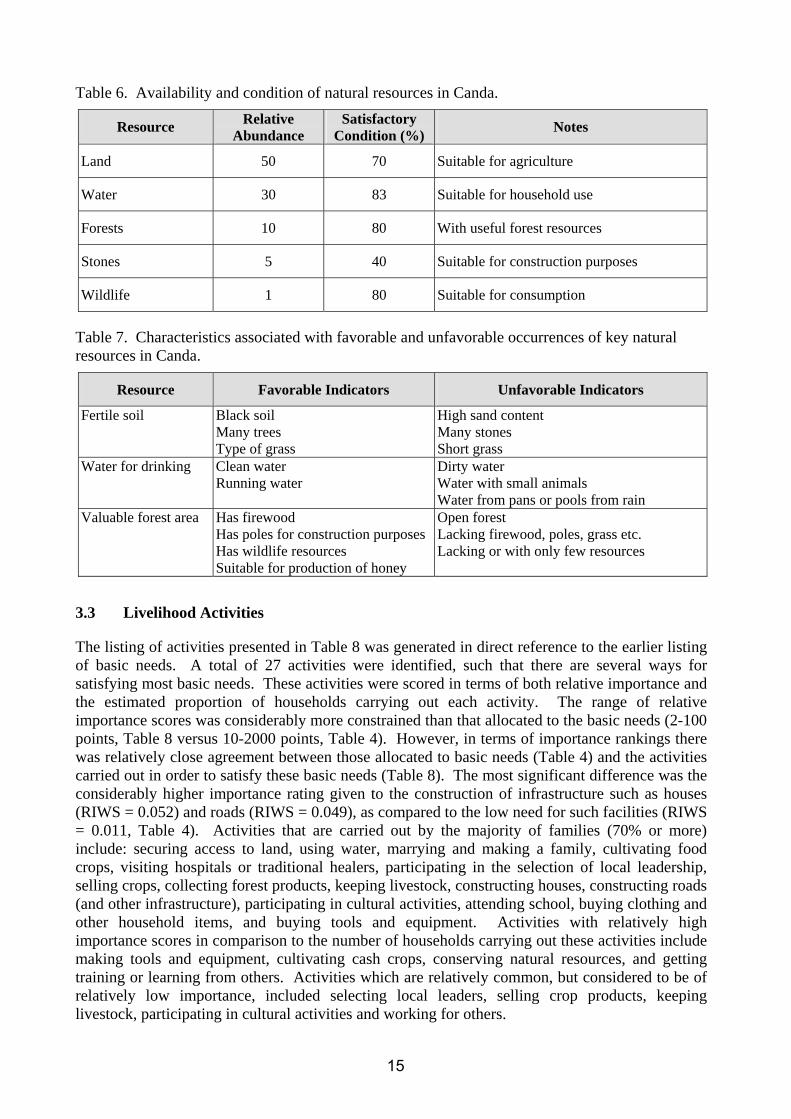
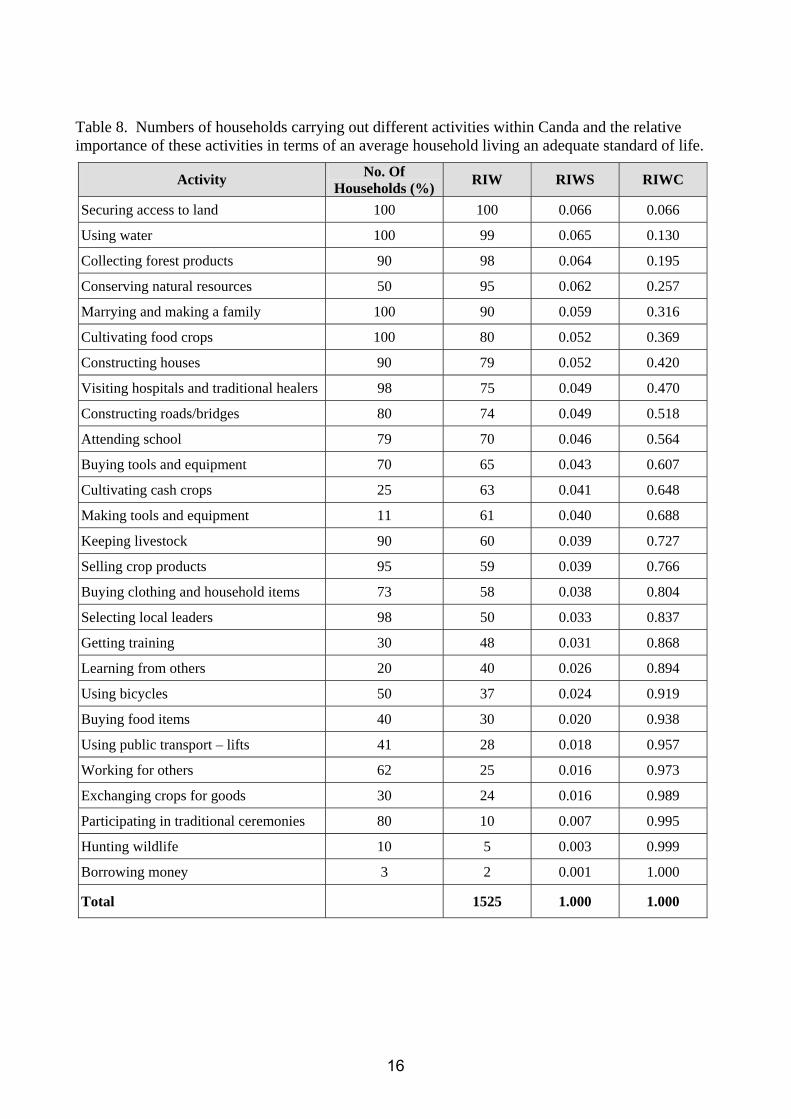


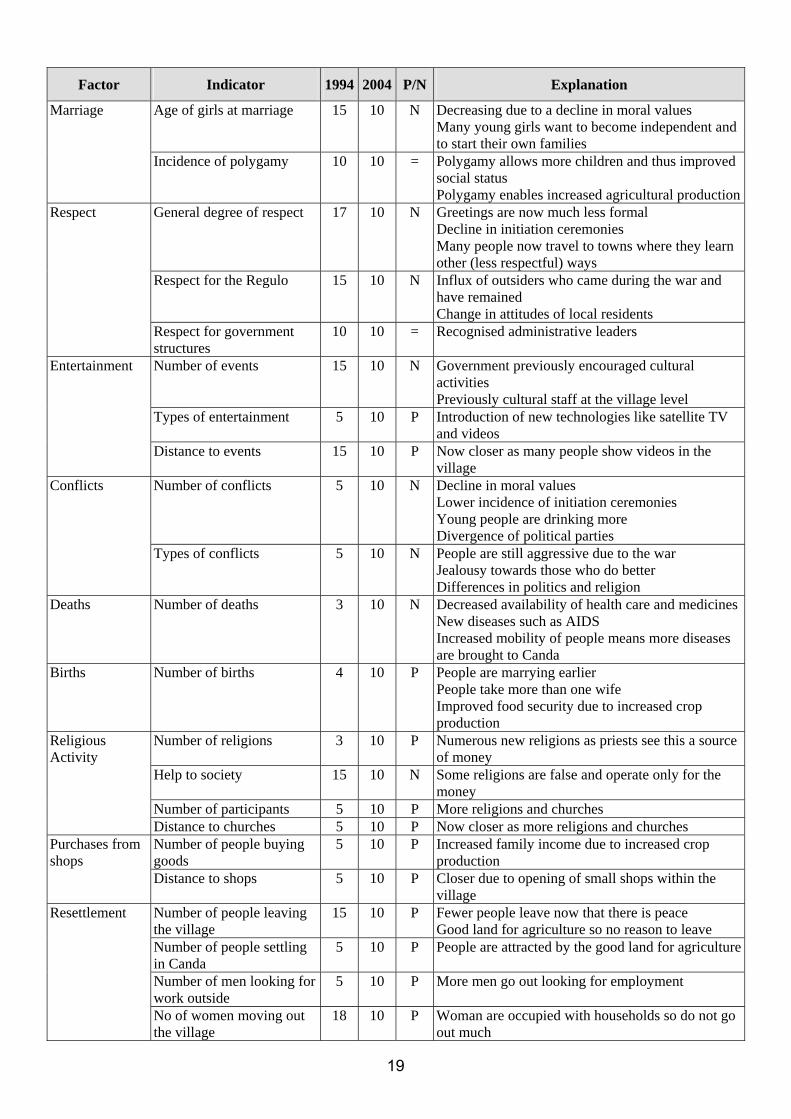
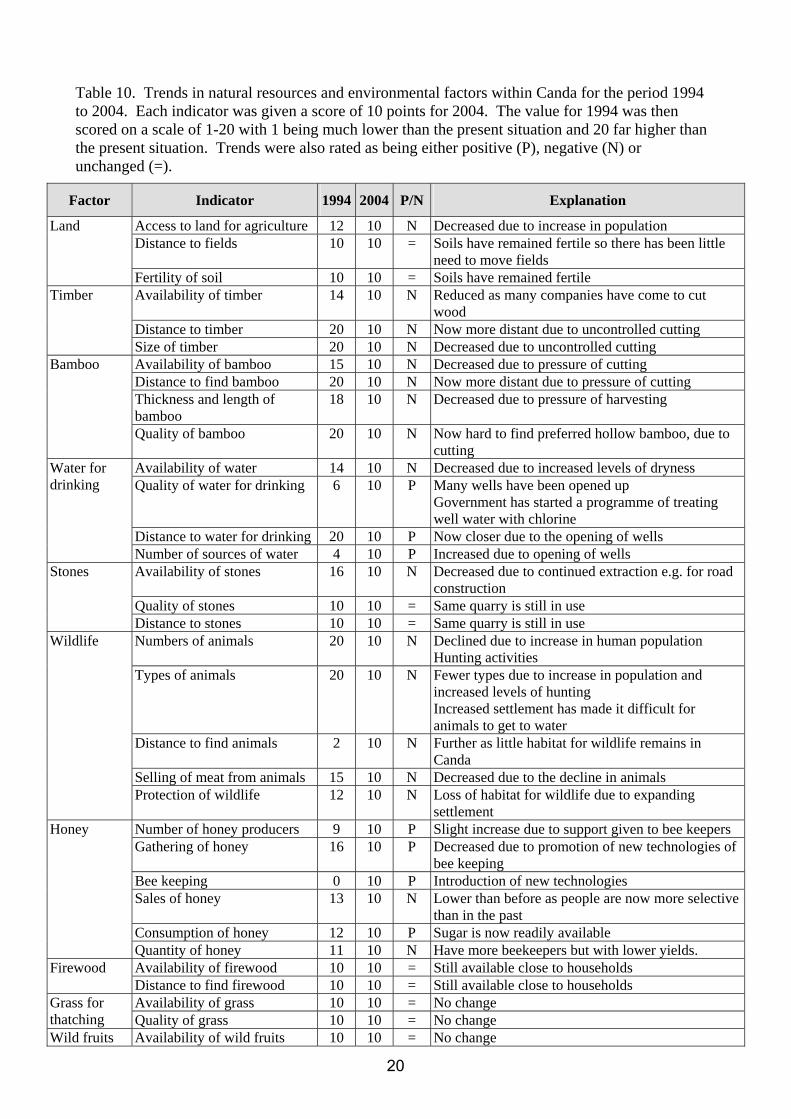

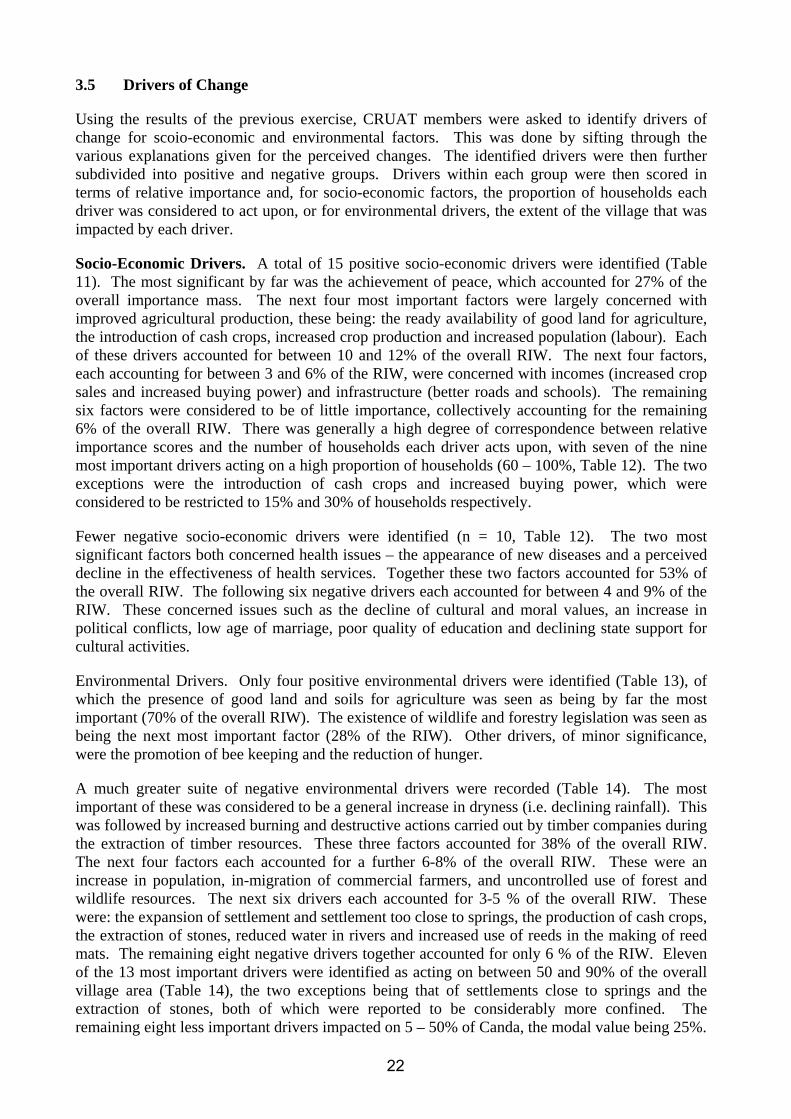
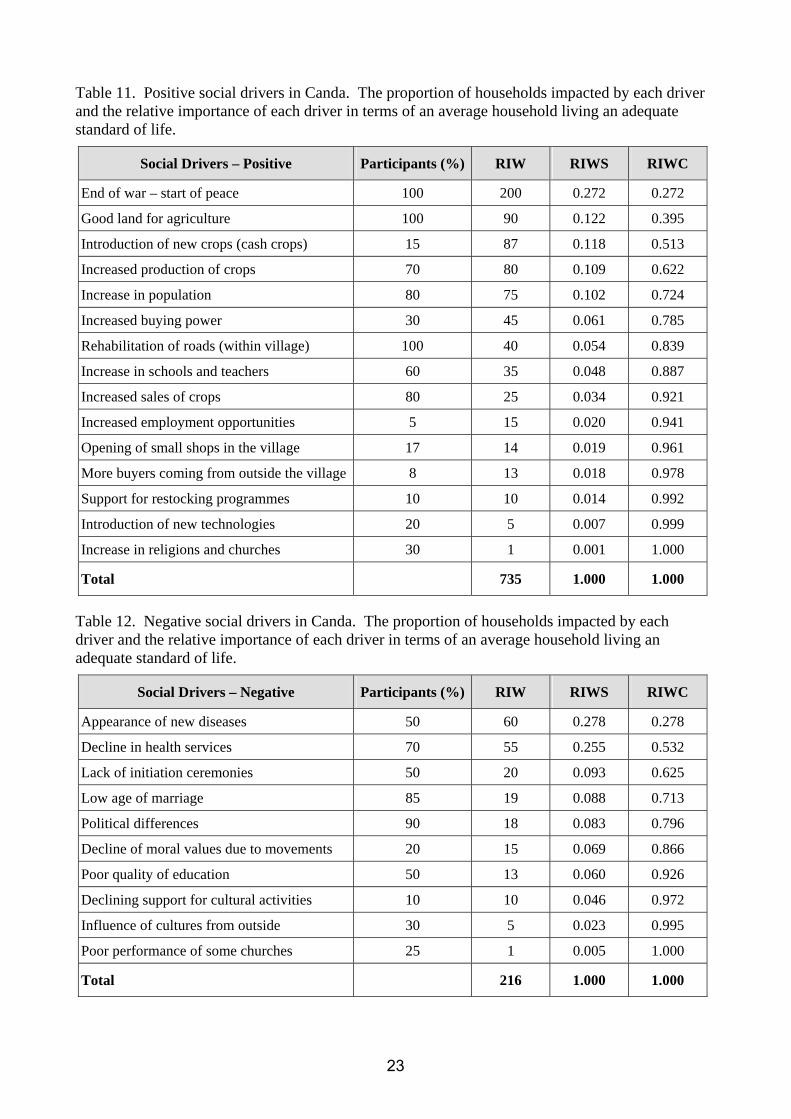
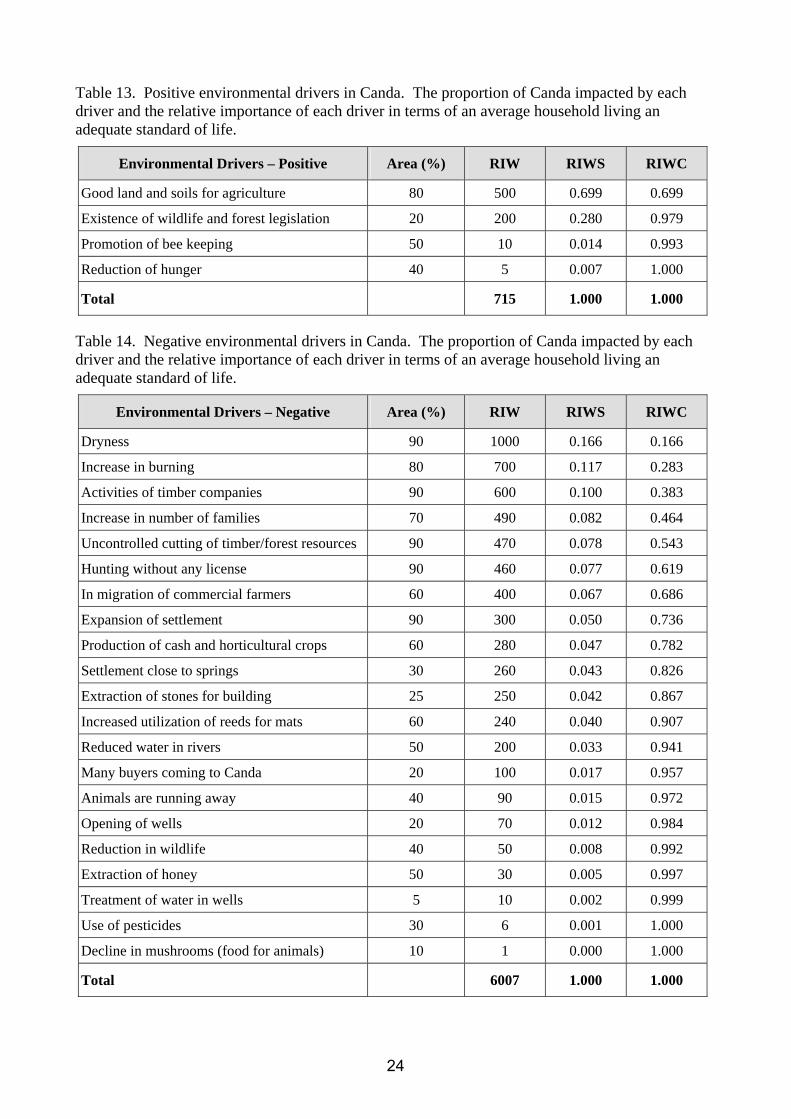
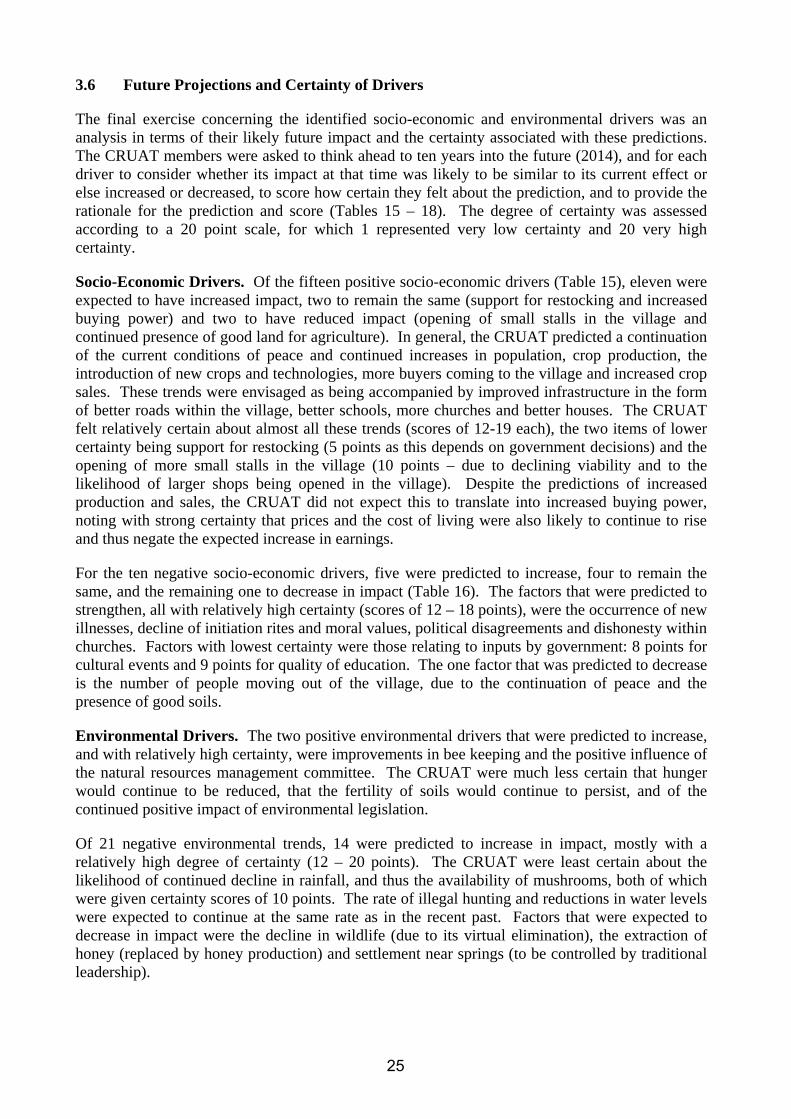
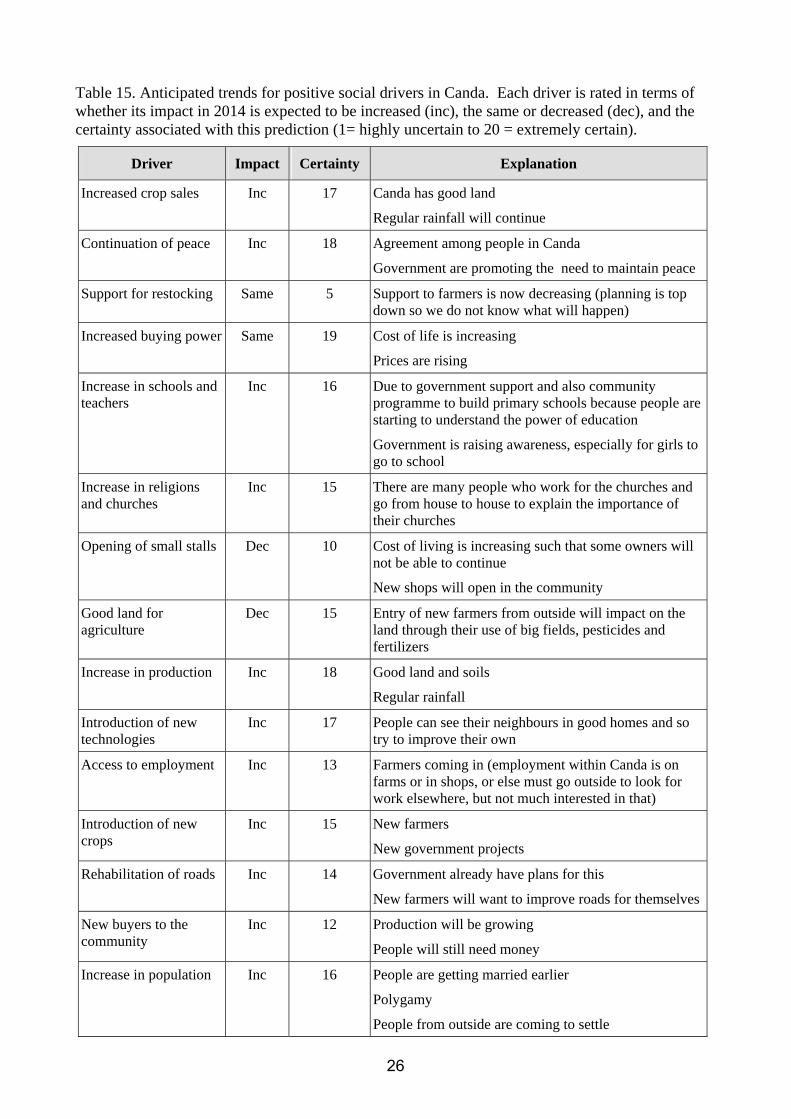
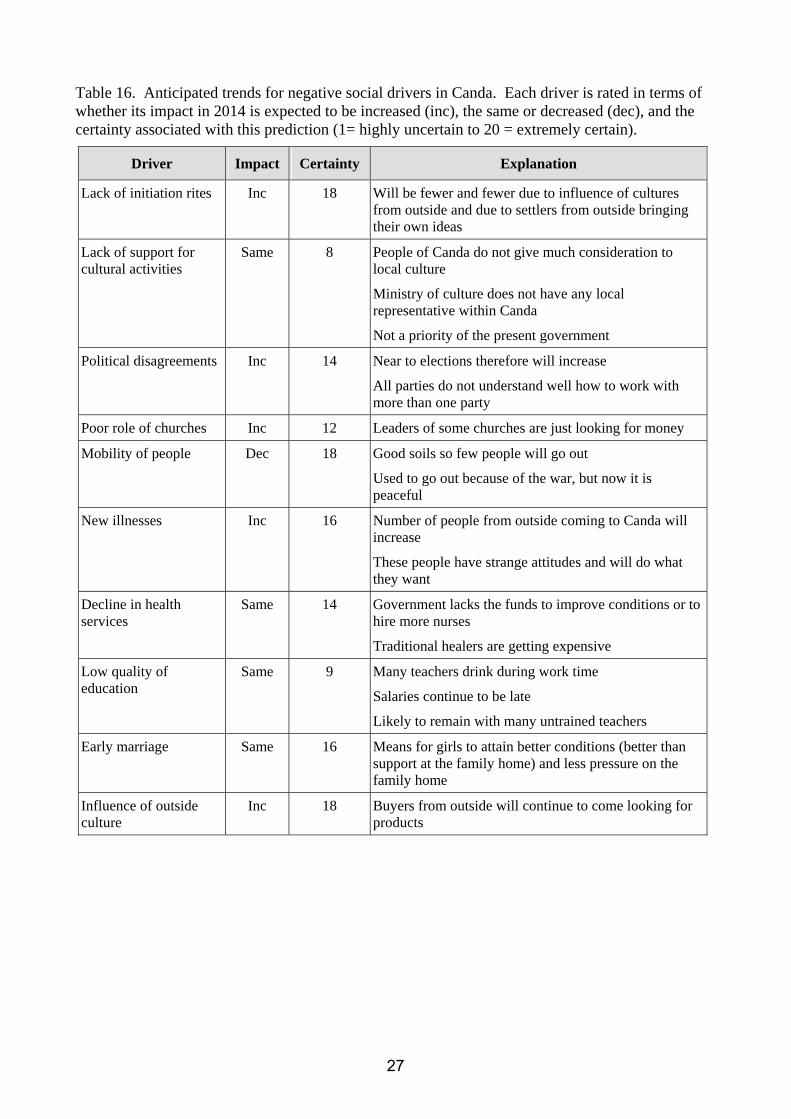
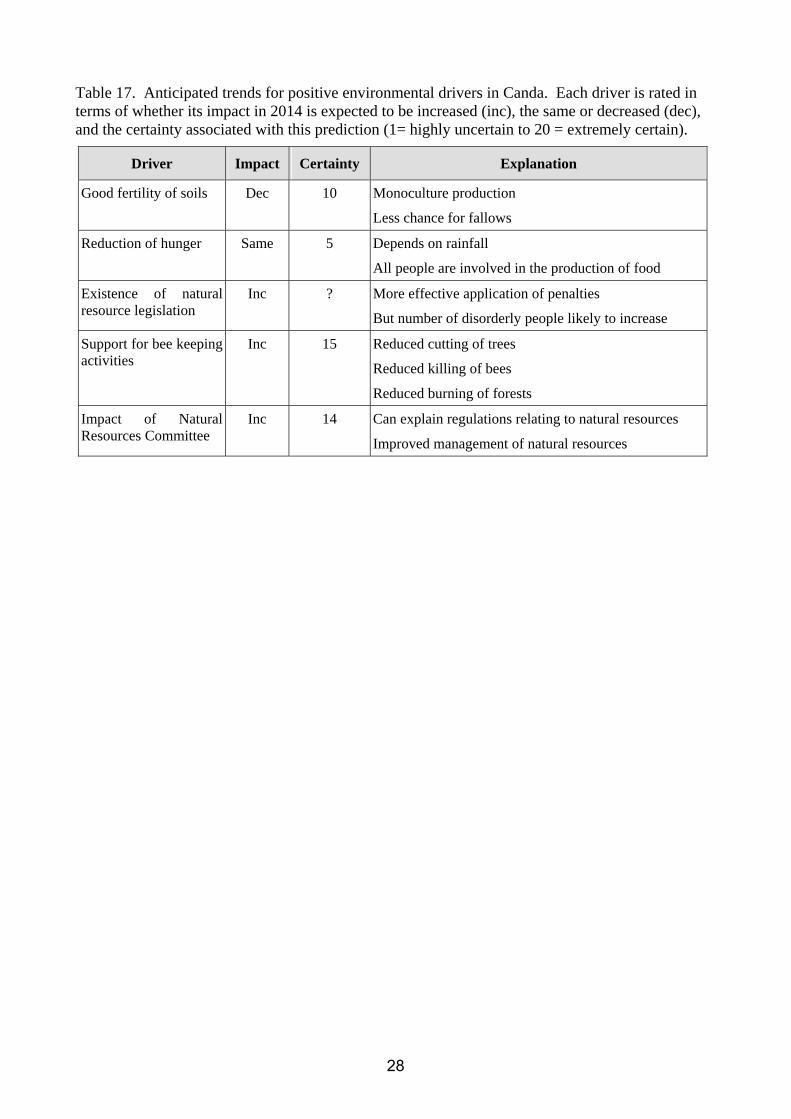
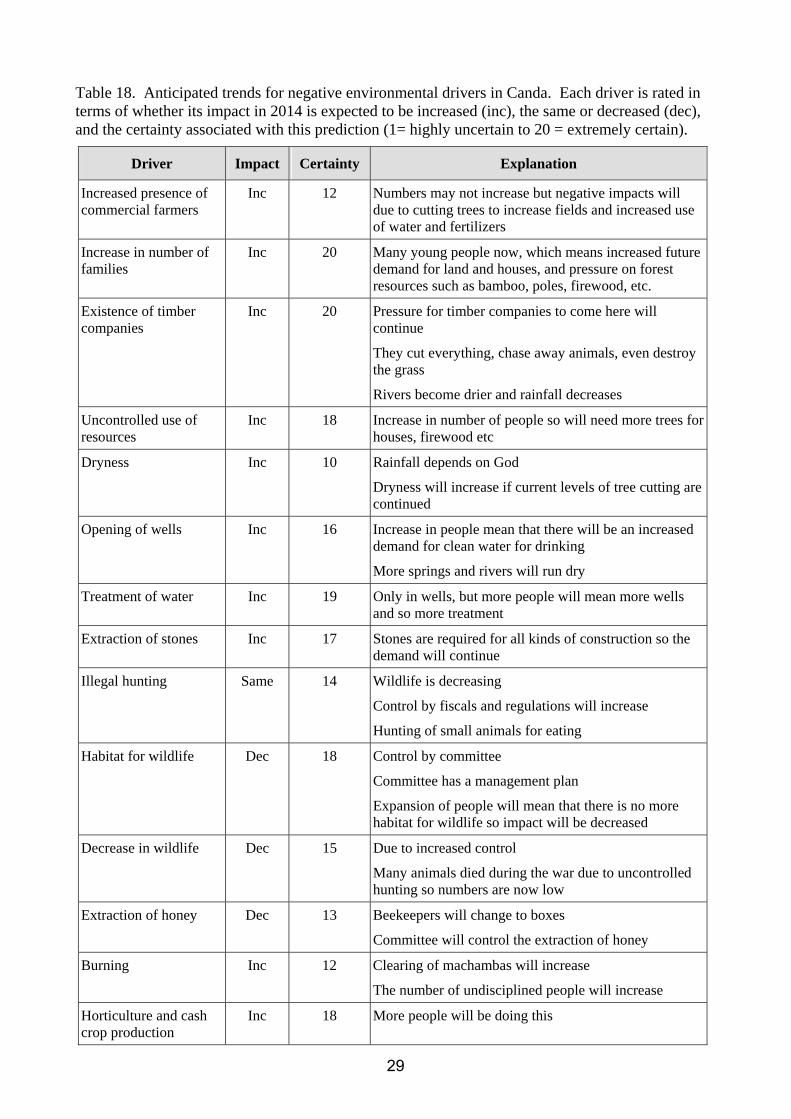
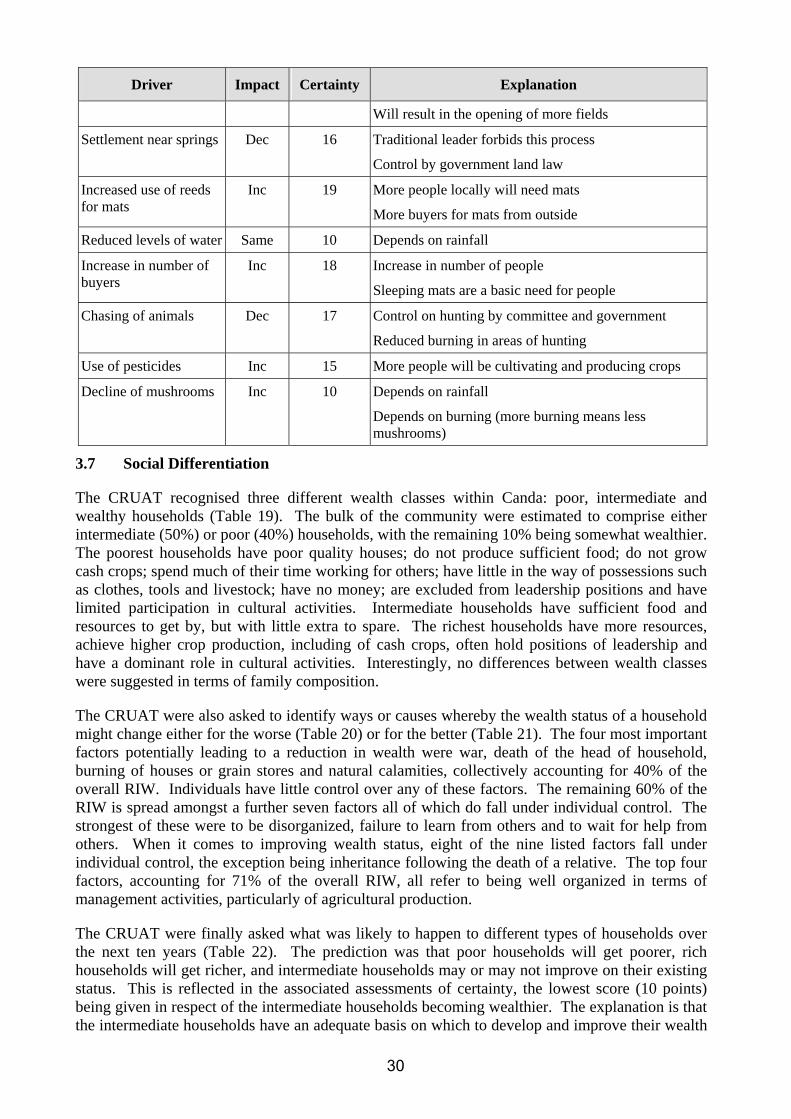

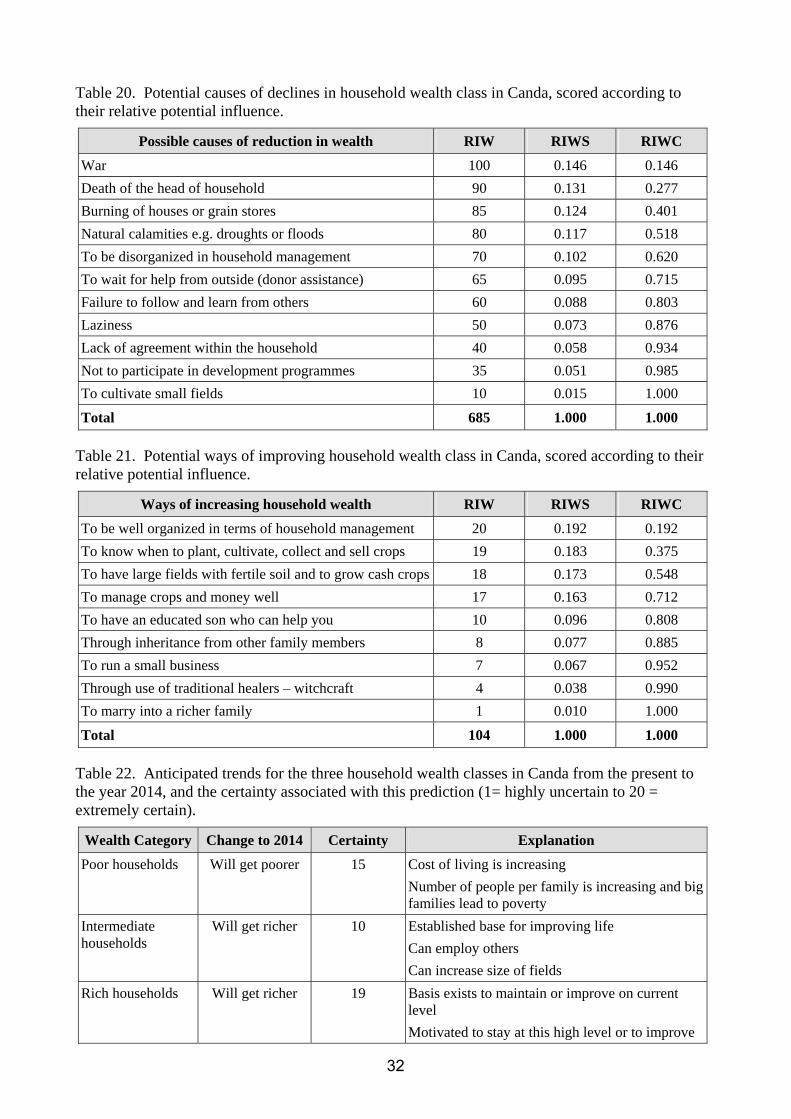

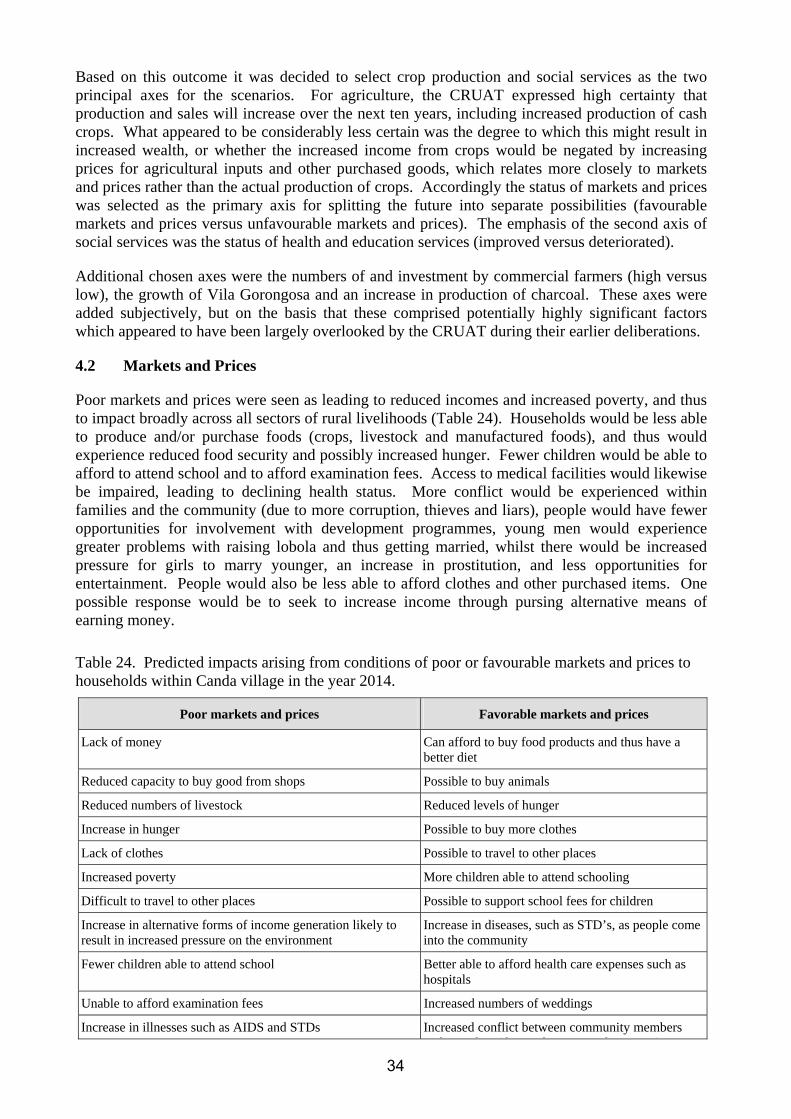
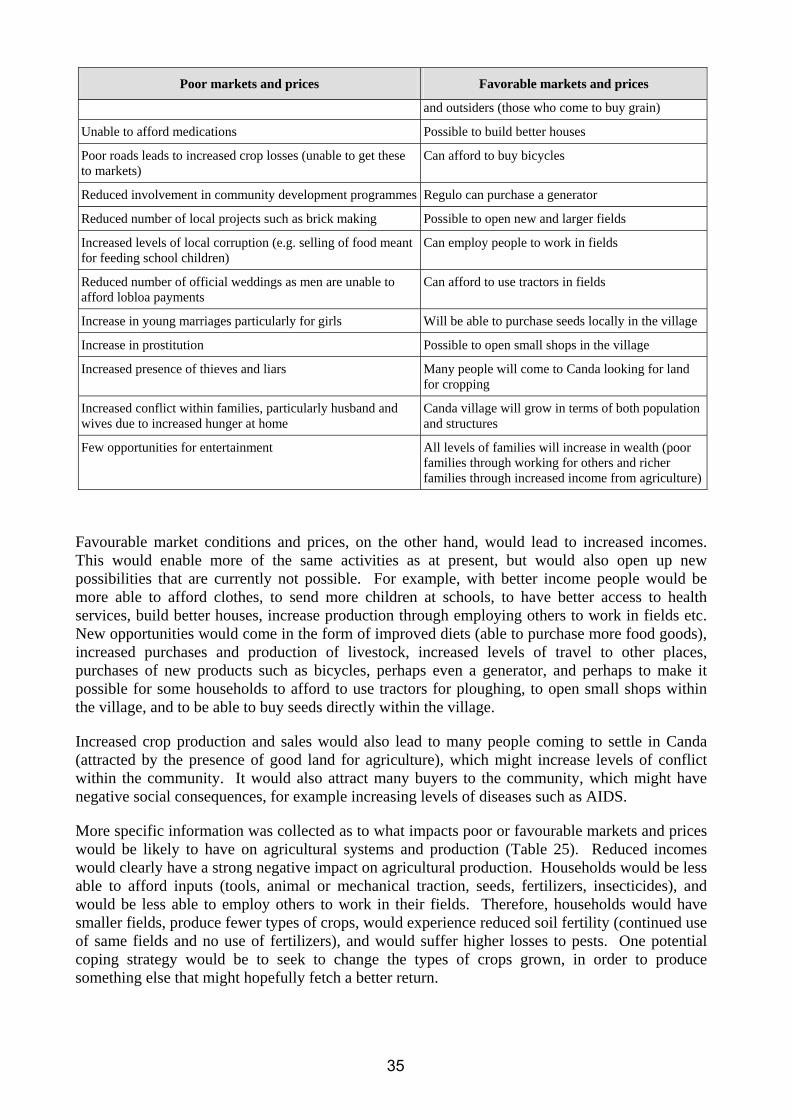
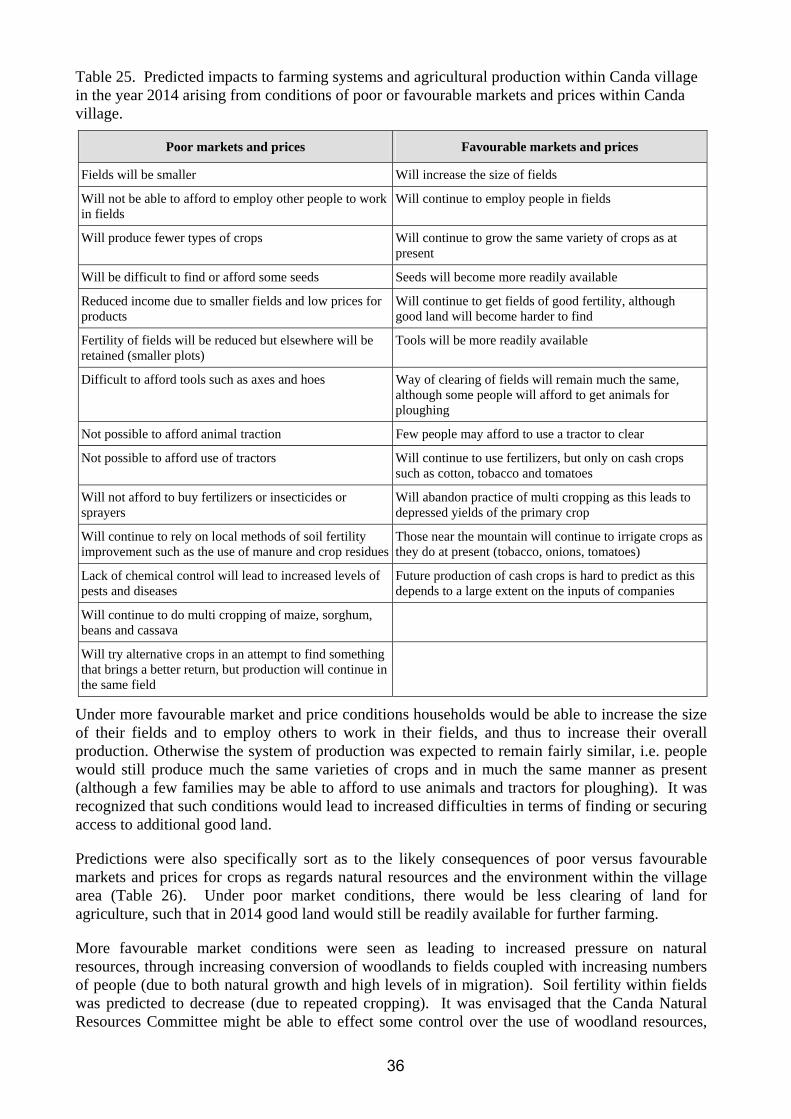
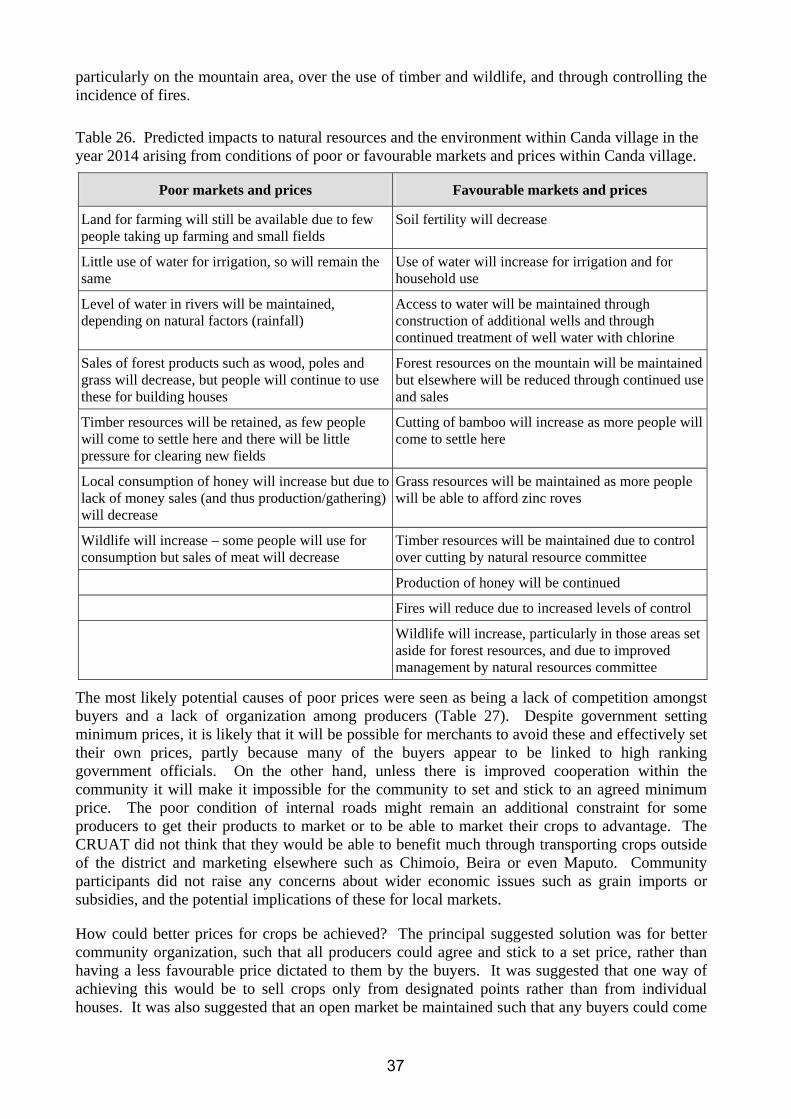
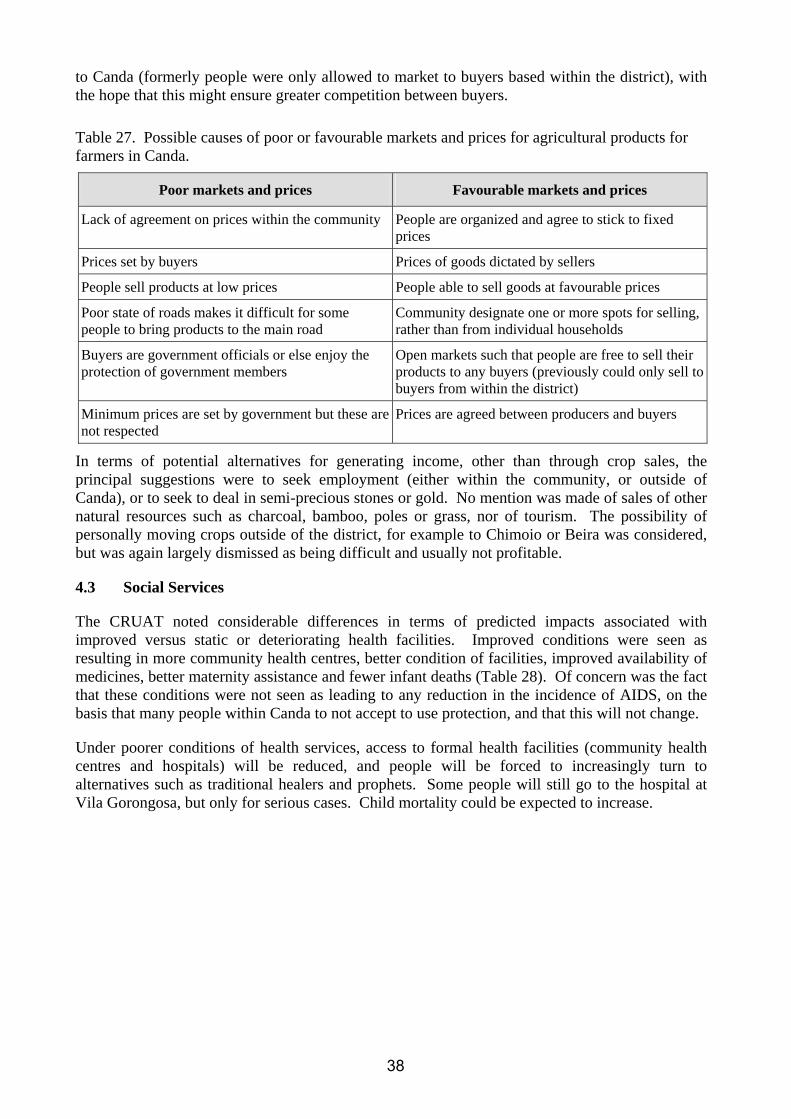

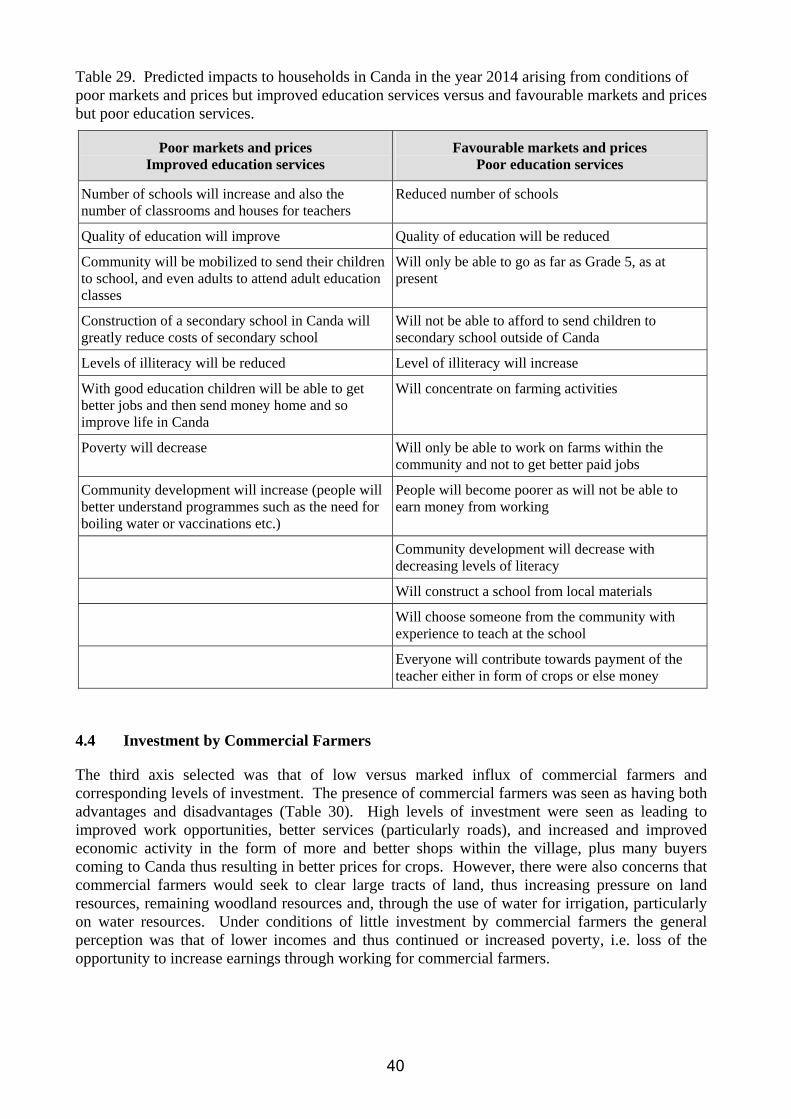
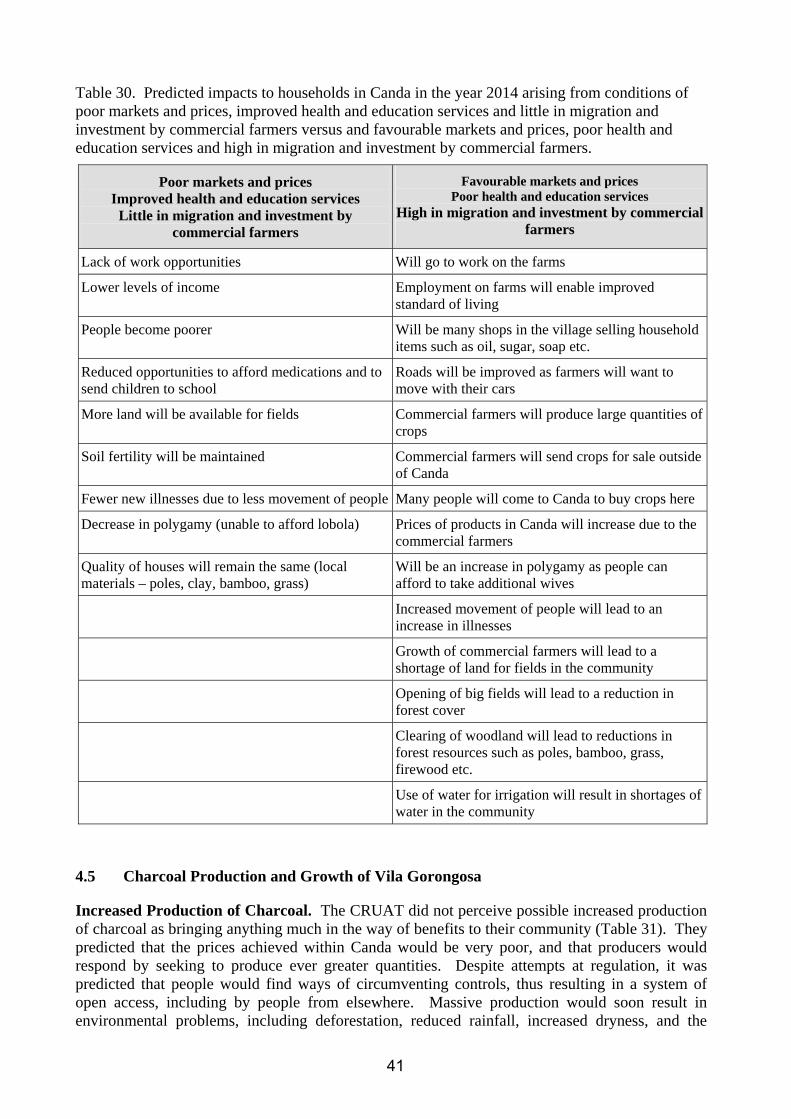
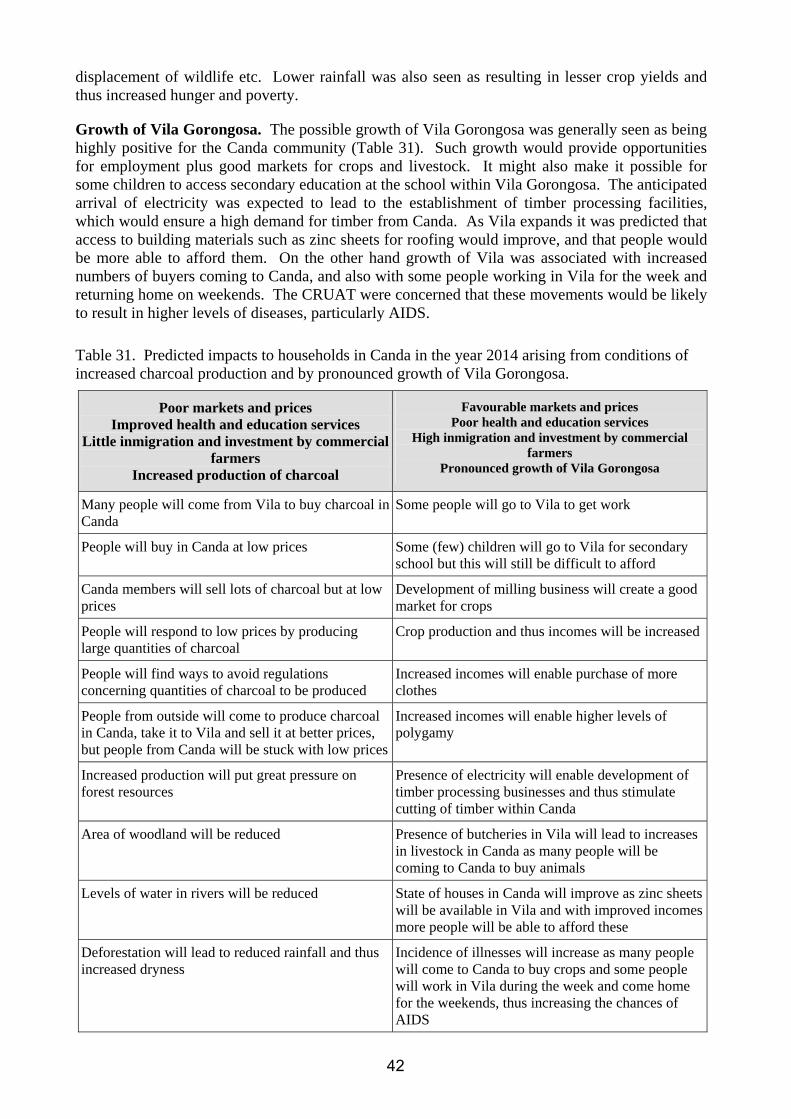
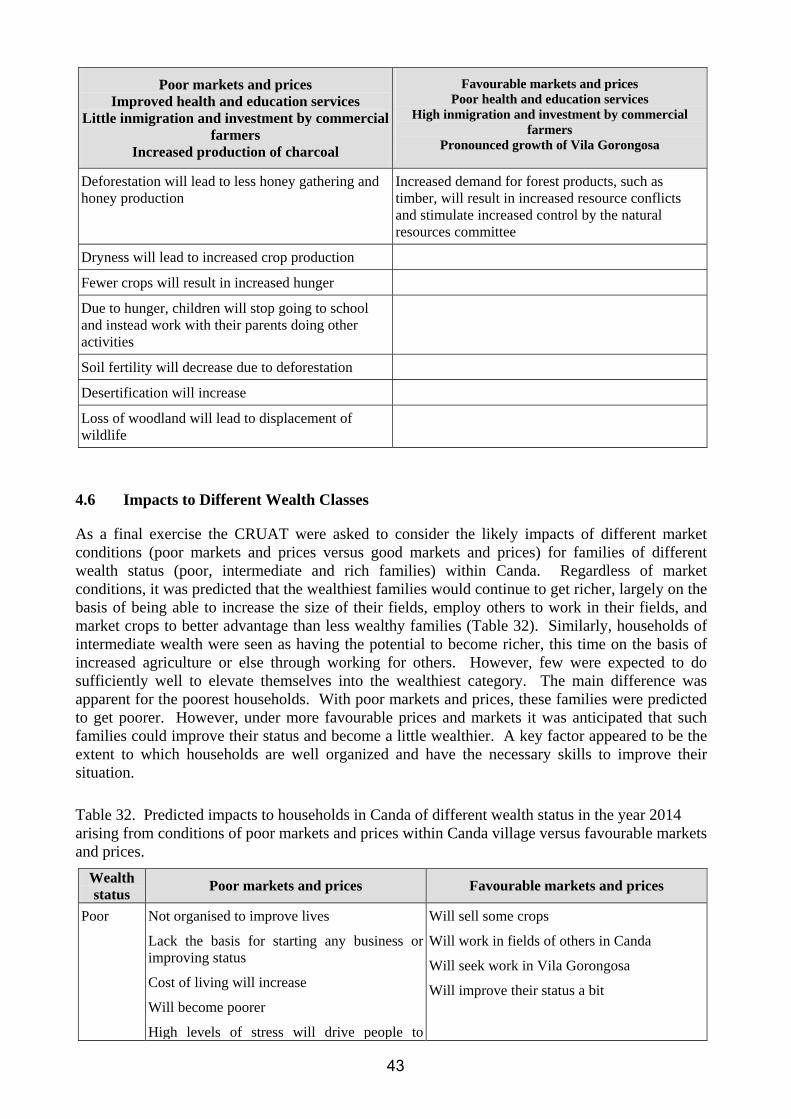

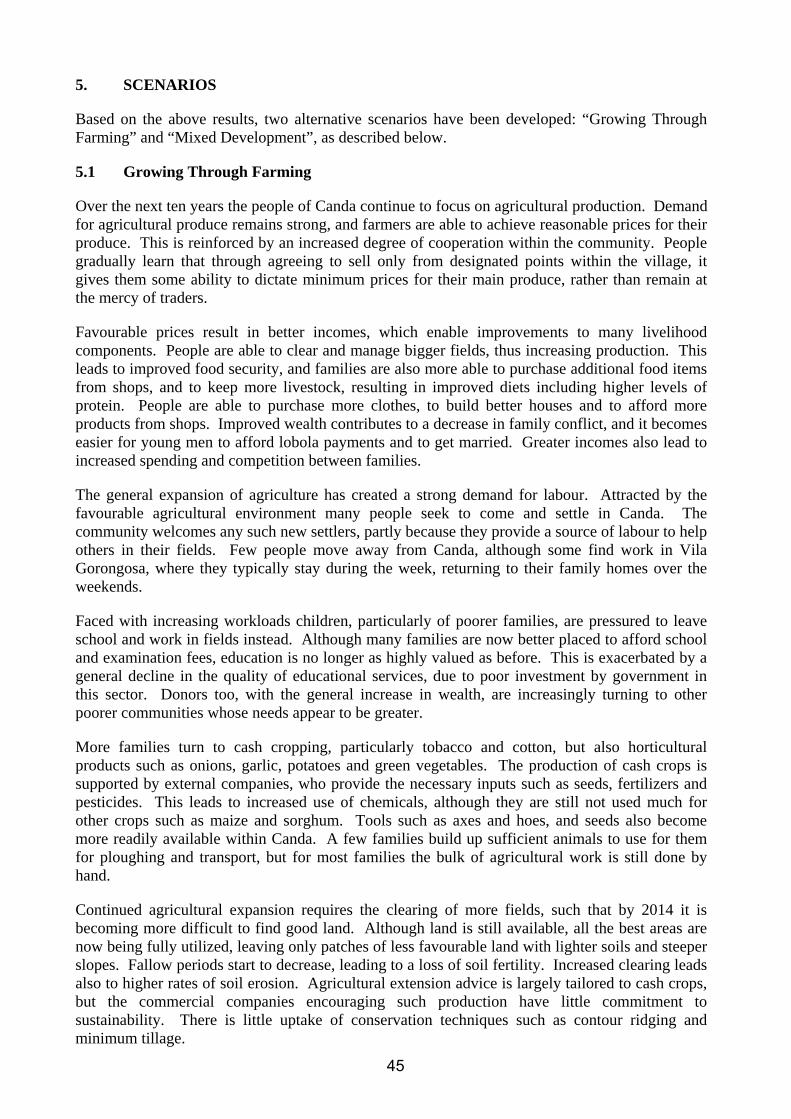


![[PPT]HEMOROİD - EGE BÖLGESİ CERRAHİ DERNEĞİegecerrahidernegi.org/gorseller/files/selman sokmen.ppt · Web viewTitle HEMOROİD Author Emre Canda Last modified by kaan Created](https://static.documents.pub/doc/80x56/5aeb18337f8b9a90318c8839/ppthemoroid-ege-blgesi-cerrahi-dernegi-sokmenpptweb-viewtitle-hemoroid.jpg)