Development of sensing systems for environmental monitoring by Christophe BouiUaud, BSc, submitted for the degree of Master in Science, Institute of Technology Sligo, Ballinode, Sligo, supervised by Dr. Fiona McArdle, Submitted to the National Council for Educational Awards, 2001. i
Transcript
Development of sensing systems for
environmental monitoring
by Christophe BouiUaud, BSc,
submitted for the degree of Master in Science,
Institute of Technology Sligo,
Ballinode,
Sligo,
supervised by Dr. Fiona McArdle,
Submitted to the National Council for Educational Awards,
2001.
i
ACKNOWLEDGMENTS
I would like to thank Dr. Fiona McArdle for all her guidance and help
throughout the duration of the research project.
I would like to express my sincere appreciation to all the research colleagues and
friends at the Institute of Technology Sligo, as well as all the science technical and
teaching staff.
I want to express my deepest gratitude to my parents and all my family for
their support throughout the duration of my academic years, and to all my closest
friends in France and Ireland, and especially Nicola for sticking by me and
encouraging me during the writing of this thesis.
ABSTRACT
This project focused on the investigation and the development of a chemical sensing
system for the determination of chromium Cr6+ and a bio-reactor followed by
electrochemical detection at a glassy carbon electrode, for the determination of
organochlorine compounds.
The conjugation of Cr6+ with 1,5-diphenylcarbazide was studied at various types of
electrodes such as glassy carbon, ultra-trace epoxy-graphite, chemically or un-modified
carbon-paste and dropping-mercury. The cyclic voltammetric behaviour of the complex
was also investigated.
In addition, the possibility of developing a chemical sensor, Le. an electrochemical
probe capable of sensing Cr6+ through its complexation with 1,5-diphenylacarbazide
was studied.
The conjugations of l-chloro-2,4-dinitrobenzene, 2,4-dichloronitrobenzene and
ethacrynic, which are electrophilic organochlorine compounds, with reduced
glutathione, were studied in order to test the bioreactor developed, based on the
immobilisation of glutathione s-transferase. This was carried out at different types of
electrodes such as glassy-carbon, gold, silver, platinum, epoxy-graphite, hanging-
mercury, and ferrocene-modified rotating-disc electrodes.
TABLE OF CONTENTS
Page
ACKNOWLEDGEMENTS
ABSTRACT
CHAPTER 1.0 SENSORS FOR HEAVY METALS MONITORING 1
1.1 What is a Sensor ? 2
. 1.2 Amperometric electrochemical detectors 4
1.2.1 Reference electrodes 4
1.2.2 Working electrodes 6
1.2.3 Polarography - Definition and basics 7
1.3 Stripping voltammetiy for heavy metals monitoring 9
1.3.1 Introduction 9
1.3.1.1 Stripping Voltammetry 11
1.3.1.2 Carbon-paste electrodes 13
1.3.1.3 Glassy carbon electrodes 15
1.3.1.4 Gold, micro-electrodes, over-oxidised polypyrrole film 15
1.3.1.5 Screen-printed electrodes 17
1.3.1.6 Flow-Injection Analysis 18
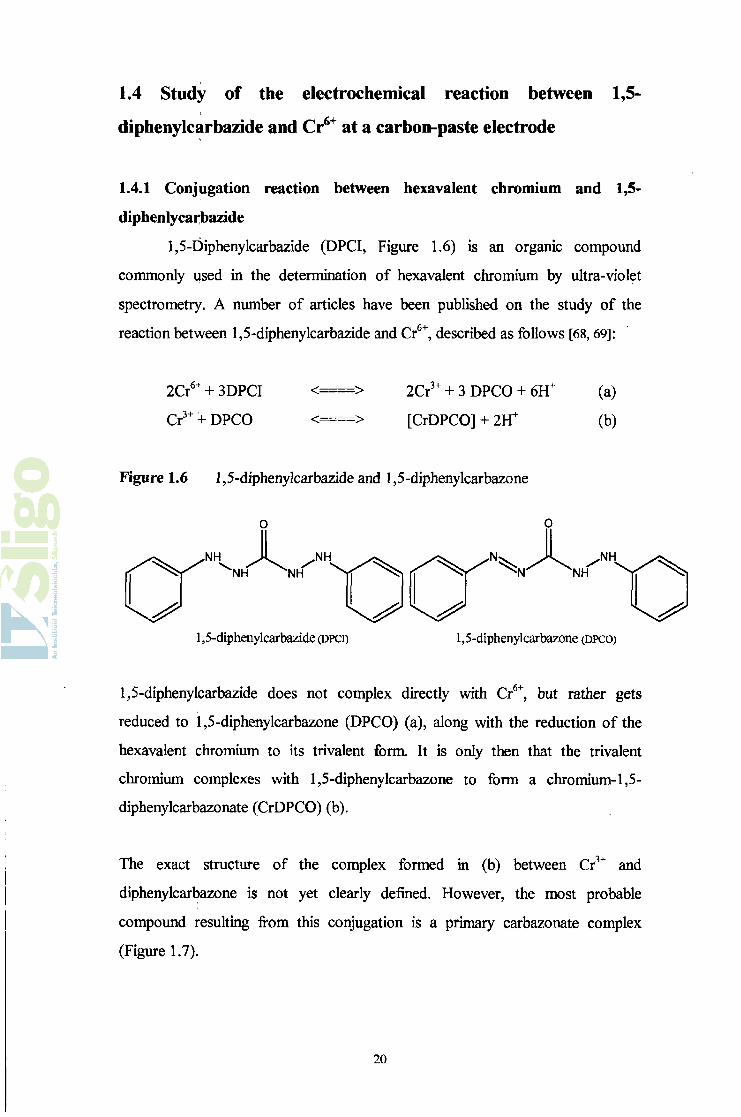
1.4 Study of the electrochemical reaction between
1,5-diphenylcarbazide and Cr6* at a carbon-paste electrode 20
1.4.1 Conjugation reaction between hexavalent chromium
and 1,5-diphenylacarbazide 20
1.4.1.1 UV/Vis investigation of the chromium-diphenylcarbazonate
complex 21
1.4.1.1 Materials and Method 21
1.4.1.3 Results 22
1.4.2 Study of the Chromium-diphenylcarbazonate complex
by cyclic voltammetry 23
1.4.2.1 Materials and Method 23
1.4.2.2 Results 24
1.4.3 Determination of the Cr/DPCI complex by Cathodic Stripping
analysis at an epoxy-graphite electrode 26
1.4.3.1 Materials and Method 26
1.4.3.2 Results 27
1.5 Development of a 1,5-diphenylcarbazide chemically-modified
carbon-paste electrode 29
1.5.1 Modification of an epoxy-graphite electrode 28
1.5.1.1 Materials and Method 29
1.5.1.2 Results 30
1.5.2 Preparation of a chemically-modified electrode based
on 1,5-diphenylcarbazide 30
1.5.2.1 Materials and Method 31
1.5.2.2 Results 31
1.6 Study of the use of over-oxidised polypyrrole as a
chromium sensor 32
1.6.1 Materials and Method 32
1.6.2 Results 33
1.7 Study of the determination of trivalent chromium by
2.1.1 Sensing organochlorine and organic compounds ? . 4 1
2.2 Enzyme Characteristics and Kinetics 46
2.2.1 Activation Energy and Transition State - Role of an Enzyme 46
2.2.2 Enzyme Dénaturation 50
2.2.3 Enzyme Immobilisation 50
2.3 Reduced Glutathione and glutathione s-Transferase 52
2.4 Experimental study of reduced glutathione by
polarography and voltammetry 57
2.4.1 Introduction 57
2.4.2 Study of the polarographic behaviour of reduced glutathione
at the dropping mercury electrode 57
2.4.2.1 Effect of buffer pH 57
2.4.2.1.1 Materials and Method 58
2.4.2.1.2 Results 58
2.4.2.2 Effect of the concentration of the buffer 60
2.4.2.2.1 Materials and Method 60
2A2.2.2 Results 60
2.4.2.3 Effect of the pulse time 61
2.4.2.3.1 Materials and Method 61
2A2.3.2 Results 61
2.4.2.4 Determination of the effect of the modulation frequency
of the signal on the GSH response 63
2.4.2.4.1 Materials and Method 63
63
64
64
64
65
65
65
67
67
67
69
69
70
71
71
71
72
73
74
76
77
2.4.2.4.2 Results
2.4.2.5 Determination of the effect of the scan rate on the GSH
response
2.4.2.5.1 Materials and Method
2A2.5.2 Results
2.4.2.6 Calibration of a solution of GSH in 2 x 10"2 mol.1'1 citrate
buffer pH 4.0 by square wave voltammetry at a dropping
mercury electrode (DME)
2.4.2.6.1 Materials and Method
2.4.2.6.2 Results
2.4.2.7 Investigation of the calibration of GSH response by cyclic
voltammetry at a hanging mercury electrode by cyclic
voltammetry
2.4.2.7.1 Materials and Methods
2.4.2.7.2 Results
Electron Mediators
Modification of glassy, ultra-trace, silver, platinum and gold
rotating disk electrodes with ferrocene
Modification of glassy, ultra-trace and gold rotating disk
electrodes with mercury-film
Investigation of the behaviour of reduced and oxidised
glutathione by cyclic voltammetry
Materials and Method
Results at a glassy-carbon rotating disc-electrode
Results obtained at the ultra-trace epoxy-graphite rotating disc
electrode
Results obtained at the mercury-modified ultra-trace electrode
Results obtained at the silver rotating disc electrode
Results obtained at the mercury-gold amalgam rotating disc
electrode
Cyclic Voltammetry analysis of reduced glutathione
78
78
79
79
80
82
82
83
85
85
85
88
88
88
89
89
90
91
93
93
93
Development of the immobilised glutathione s-transferase
reactor for on-line conjugation of organochlorine
compounds with GSH
immobilised of glutathione s-transferase (GsT) on aminopropyl
porous glass beads
Investigation of the activity of the immobilised glutathione
s-transferase towards l-chloro-2?4-dmitrobenzene,
2,4-dichloro-nitrobenzene and ethacrynic acid - Preparation of an
enzyme reactor
2.6.2.1 Materials and Method
2.6.2.2 Spectrophotometry
Quantitative analysis of the conjugation product of CDNB with
GSH by UV
2.6.3.1 Materials and Method
2.6.3.2 Resultsi
Qualitative analysis of CDNB conjugate with GSH by HPLC
2.6.4.1 Materials and Method
2.6.4.2 Results
2.6.4.3 Quantitative analysis of CDNB conjugate with GSH by
HPLC
2.6.4.3.1 Materials and Method
2.6.4.3.2 Results
Electrochemical investigation of the conjugation of CDNB
with GSH
2.6.5.1 Materials and Method
2.6.5.2 Electrochemical oxidations of glutathione at the
glassy-carbon, gold and silver electrode
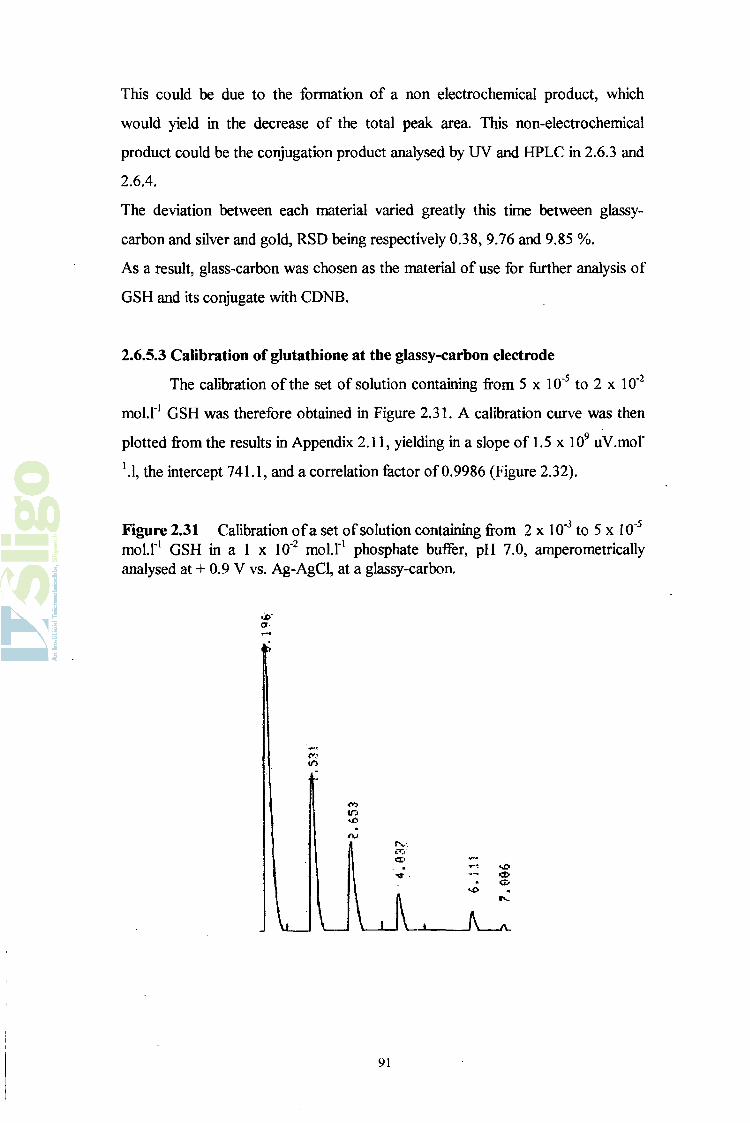
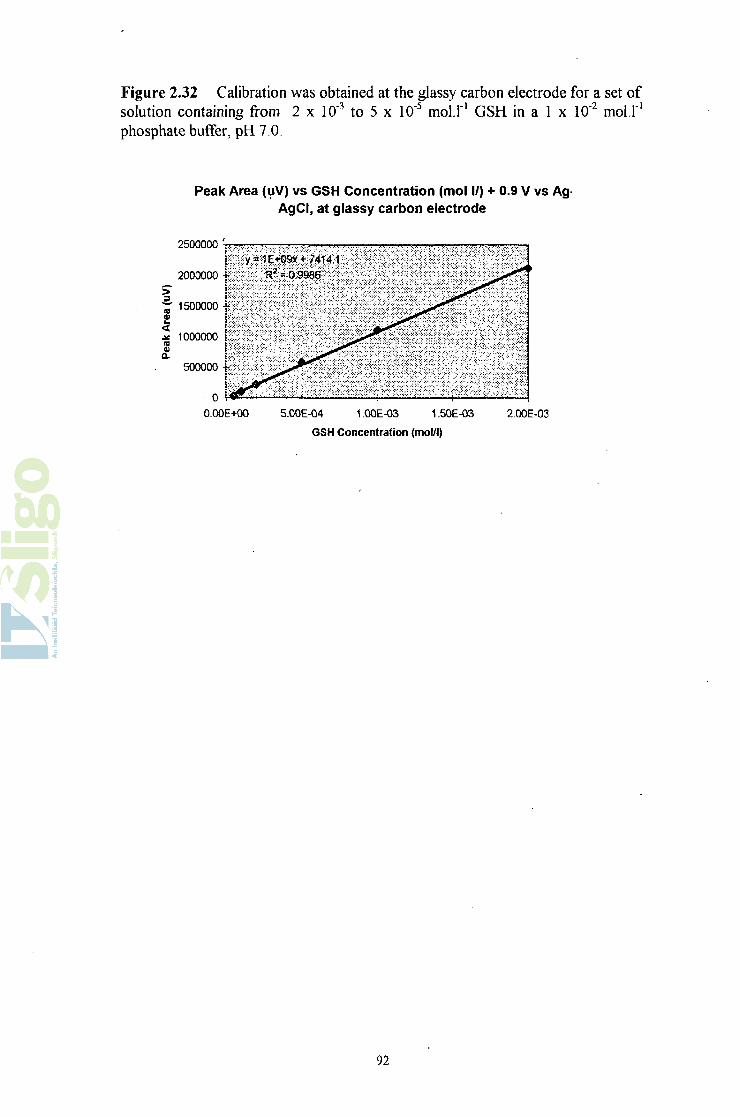
2.6.5.3 Calibration of glutathione at the glassy-carbon electrode
2.6.5.4 Flow-through system
2.6.5.4.1 Materials and Method
2.6.5.4.2 Results
2.7 Discussion 96
CHAPTER 3.0 CONCLUSION 101
REFERENCES 105
APPENDICES 111
2.6.5.5 On-line determination of the conjugate 95
CHAPTER 1.0
SÉNSORS FOR HEAVY METALS
MONITORING
1
1.1 What is a Sensor ? :
A sensor can be described in different ways, such as a ‘device for sensing \
or a 6device using a sensing process such that information on material(s) tested
can be obtained’ [1]. This is a device that converts a physical, chemical, or
biological change usually into an electrical signal, which may be relayed to a
computer, integrator or printer [2] (Figure 1.1).
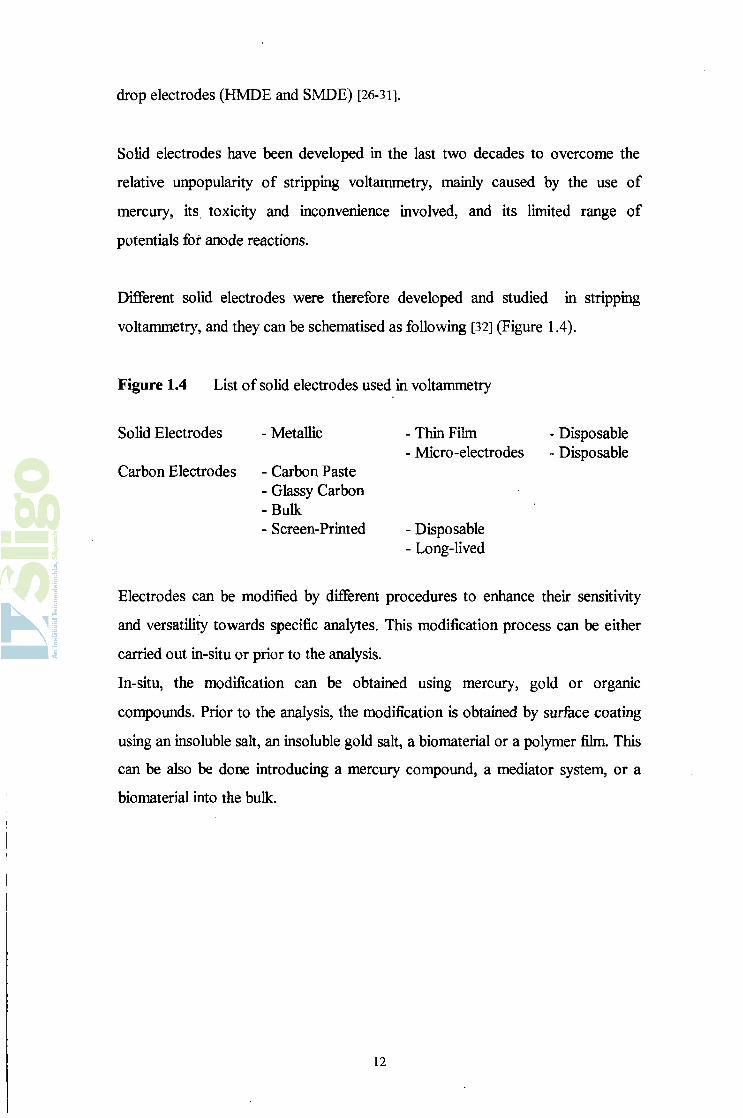
Figure 1.1 Sensor Schematic
Selective Sensing Head Transducer Electronics ComputerJPrintertRead-Out
The different types of sensors can be classified as physical, chemical or biological
(biosensors),« depending on their characteristics :
i) Physical Sensors, which measure a physical change occurring (resulting from ai
chemical reaction) in the sample such as temperature, pressure, volume,
displacement, density, or mass;
ii) Chemical, Sensors, which measure a chemical change occurring in the sample
such as pH, concentration, chemical composition; and
iii) Biological Sensors or Biosensors, which measure a chemical and/or biological
change occurring in the sample such as pH, concentration, chemical composition.
This is done by coupling the bio-component with either a chemical or physical
transducer. The biologically-sensitive part of this device can either be one or a
few enzymes, an organelle, a membrane component, a bacterial cell or a cell, an
antibody or an antigen, or even plant or mammalian tissues.
Sensing processes are based on the exchange of energy, matter or energy and
matter between the sample and the sensing device. The sensor response time is
dependent on various factors, such as pressure and temperature, as well as by
convection and diffusion.
2
The sensor response should ideally be limited to analyte concentration.
The main sensing processes used for the development of sensors are
electrochemical, thermal, spectrophotochemical, mass spectrochemical or
radiochemical transducers:
i) Electrochemical, where the electroactivity of the sample is monitored, yielding
an information about the species present in the sample. This is obtained by
measuring the change in potential of an electrochemical cell through specific
interaction at an electrode/solution interface. The change in current can also be
monitored, depending on the mass transport of species to and from an electrode
surface;
ii) Thermal, based on the measure a temperature change; and
iii) Spectroscopic, based on the measure of absorbance, reflection, refraction,
transmittance, or emission [3],
Sensors have been of interest for a wide range of applications (Table 1.1), from
the glucose oxidase sensor designed for diabetics, to environmental, clinical, or
even military purposes.
Table 1.1 Examples of Sensor Applications
Application Areas
Clinical and Medical
Industrial
Environmental
Veterinary
Examples
Glucose [4-8], Dopamine [9], Blood
Banks, HIV, Hepatitis B, TBC [10].
Process Monitoring [11,12], Drug or Food
Processing, Quality Control,
Contaminants Monitoring.
Water, Air and Soil Monitoring
(pesticides, pH, nitrates, nitrites), BOD
Testing.
Animal Diseases, Quality Control in meat.
3
1.2 Amperometric electrochemical detectors
Most amperometric electrochemical sensors use a three electrode system
(reference, working and auxiliary) in which a fixed potential difference is applied
between the working electrode and the reference electrode. This applied potential
difference speeds up the sensing process by speeding up the redox reaction at the
surface of the working electrode.
It is the current generated at the working electrode which is amplified and plotted
as a function of time : any current generated by redox reaction is plotted and a
peak is observed on the recording device. The potential applied at the working
electrode is set against the reference electrode.
1.2.1 Reference electrodes
Different reference electrode have been developed and used with time, the
most important being the standard hydrogen electrode, the calomel electrode and
the silver/silver chloride. Other reference electrodes of lower importance have
also been developed such as the mercury/mercurous or the hydrogen/palladium
electrode. All electrode potentials are measured relative to the Standard Hydrogen
Electrode, which has a potential of 0.00 V.
The standard hydrogen electrode was the first to be developed, and many
standard half-reaction redox potentials of metals present in handbooks were
obtained using this type of electrode. It is however very impractical and
cumbersome, so that other types of electrodes have been developed since.
The silver/silver chloride electrode is a so-called ’wet* electrode of the silver
metal/silver insoluble salt type. In a flow-through system, it is generally placed
downstream from the working electrode, making electrical contact with the
electrolyte via a micro-porous plug.
AgCl (s) + e « Ag(s) + Cf
4
The main disadvantage of this type of reference electrode over the other types is
that it requires to be placed far away from the working electrode, as excessive
noise, instabUity and non-linear response would arise from multiple junction
potentials and ohmic (iR) drops. Another drawback of this type of electrode as a
reference comes from the charging currents produced at the solution/electrodeii
surface when a potential is applied to the working electrode. Such currents decay
exponentially, taking a long time before reaching zero, and involve a considerable
analytical down-time if this detector is turned off. A solid silver wire coated with
silver chloride has been recently studied as reference electrode, but revealed to be
fairly unstable and increase the system noise as well as the corrosion of the
system.
The calomel electrode, based on mercury/mercurous chloride, is similar to the
Ag-AgCl, but suffers many of this latest drawbacks, as well as using highly toxic
salts.
HgO (s) + H20 + 2e Hg (liq) + 20IT
Another reference electrode, based on mercury/mercury sulphate is based on a
similar reaction.
HgS04 + 2e Hg (liq) + S042‘
A novel type of reference electrode, called hydrogen/palladium reference
electrode was designed to overcome the drawbacks from the silver/silver chloride
electrode. It is a very small electrode that can be placed close from the working
electrode, is maintenance free, stable, and not easily poisoned.
5
1.2.2 Working electrodes
Working electrodes will only function properly within a specific window
dictated by the material of the electrode (Table 1.2) as well as the pH of the
electrolyte. For example, the electrolysis of many compounds on a glassy-carbon
working electrode can be done up to approximately + 1.3 V vs. Ag-AgCI without
experiencing difficulties.
However, potentials of + 5.0 V vs. Ag-AgCI or higher applied to this same glassy-
carbon working electrode would alter its surface or even destroy the electrode.
Another limitation to the maximum reduction potential at which each electrode
can be used comes from the excessive current due to oxygen present in the buffer,
which gets reduced to water. It is however possible to overcome by nitrogen
bubbling. Therefore, strong reduction potential will only be used if the dissolved
oxygen is first removed from the electrolytes by nitrogen bubbling.
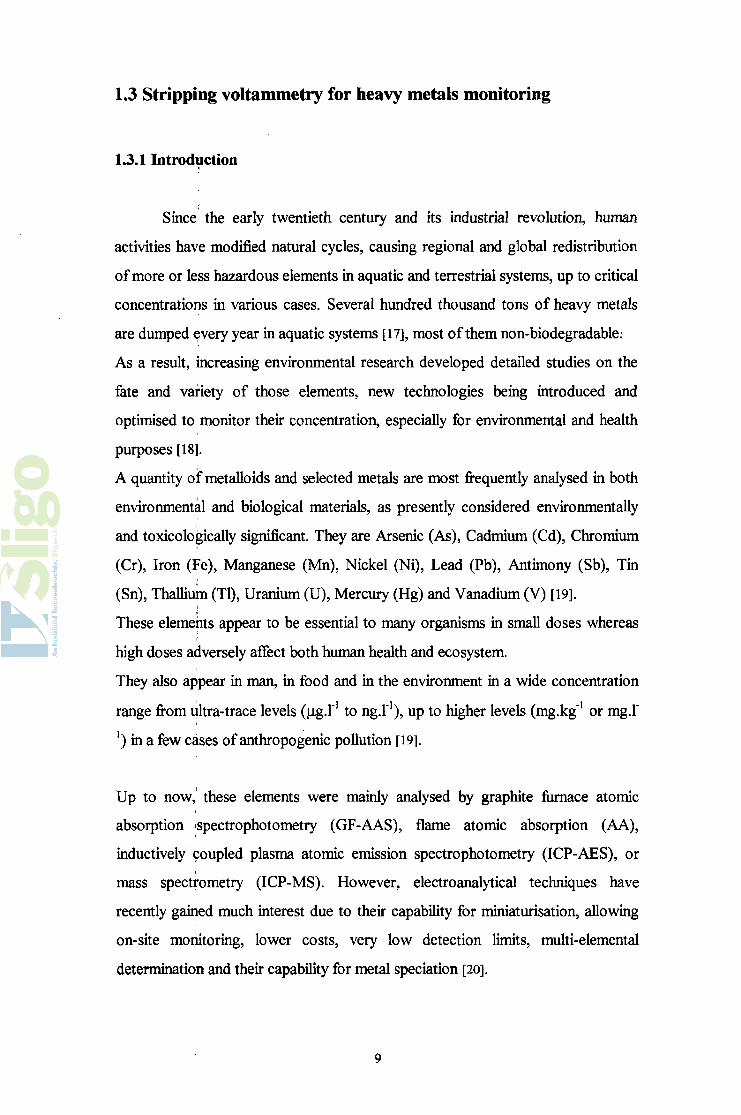
Table 1.2 Potential window of mercury, platinum, graphite, glassy-carbon and gold Working Electrodes under basic, neutral and acidic conditions (vs. Ag- AgCl) [13J:
Condition Platinum
(V )
M e rc u ry (V ) G la ssy
C a rb o n (V )
C a rb o n (V ) G o ld (V )
Acidic + 0.4 to -1.2 + 1.3 to -0.4 + 1.3 to -0 .8 + 1.5 t o - 0.2 + 1.2 to -0.5
Neutral + 0.2 to - 1.8 + 0.8 to - 0.7 - + 1.0 to - 1.3 + 0.8 to - 1.1
Basic O to-2 .0 + 0.5 to - 1.0 + 0.6 to - 1.5 + 1.7 to -0 .8 + 0.7 to - 1.3
There are two different type of processes occurring at the interface between the
electrode and the solution, the faradaic and non-faradaic processes.
The processes in which reduction and oxidation occur follow Faraday's law and
are commonly called faradaic processes. In such cases, the magnitude of the
current will be determined by the extent of redox reaction occurring.
Processes not involving electrolysis, such as adsorption or desorption, can occur
at a potential at which charge transfer reactions do not occur (either
thermodynamically or kinetically unfavourable), are called non-faradaic processes
6
(as they do not involve any electron-transfer).
Assuming the total current flowing through the cell is called ir, and the faradaic
and non-faradaic current are called iF and W,
il = ip + iNF
1.2.3 Polarography - Definition and basics
Polarography is as an electrochemical technique invented in 1922 by
Jaroslav Heyrovsky [14], based on the measurement of the current that flows in
solution as a function of an applied voltage. The electric potential (commonly
called voltage) is varied in a regular manner between two sets of electrodes
(reference and working), while the current is monitored. This method is useful in
detecting and determining substances simultaneously, and is applicable to
relatively small concentrations (10-6 to 10‘2 moll*1). Polarography is a specific
example of voltammetry,
Voltammetry can be defined as ‘an electrochemical technique in which a
faradaic current passing through the electrolysis solution is measured while an
appropriate potential is applied to the polarizable or indicator electrode ’ [15].
Figure 1.2 Basic two-electrode voltammetric cell, appropriate for use in solutions of low resistance and micro-electrodes [16].
7
The voltammetric cells can either be two or three-electrode based (Figure 1.2 and
Figure 1.3).
Figure 1.3 Three-electrode voltammetric cell [16]
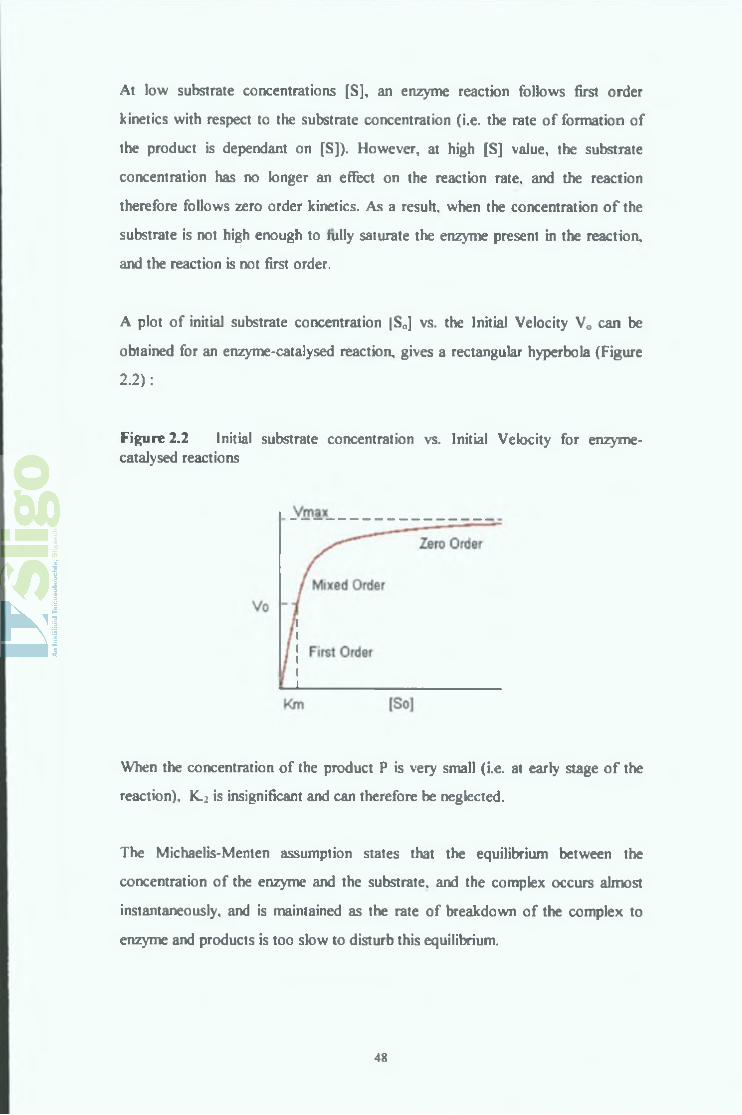
In a polarographic or voltammetric cell, the decrease of the reactant concentration
at the electrode surface during electrolysis is dependant on diffusion, convection
and migration currents. During electrolysis, cations move towards the cathode
and anions towards the anode as well as any species being oxidised or reduced if
charged via convection or diffusion. Depending on the charge of the species, the
mass transfer process of the electroactive species will be modified via migration,
which current can be negative, zero or positive.
8
1.3 Stripping voltammetry for heavy metals monitoring
1.3.1 Introduction
Since: the early twentieth century and its industrial revolution, human
activities have modified natural cycles, causing regional and global redistribution
of more or less hazardous elements in aquatic and terrestrial systems, up to critical
concentrations in various cases. Several hundred thousand tons of heavy metals
are dumped every year in aquatic systems [17], most of them non-biodegradable.
As a result, increasing environmental research developed detailed studies on the
fate and variety of those elements, new technologies being introduced and
optimised to monitor their concentration, especially for environmental and health
purposes [18].
A quantity of metalloids and selected metals are most frequently analysed in both
environmental and biological materials, as presently considered environmentally
and toxicologically significant. They are Arsenic (As), Cadmium (Cd), Chromium
(Cr), Iron (Fe), Manganese (Mn), Nickel (Ni), Lead (Pb), Antimony (Sb), Tin
1,5-diphenylcarbazide does not complex directly with Cr6+, but rather gets
reduced to 1,5-diphenylcarbazone (DPCO) (a), along with the reduction of the
hexavalent chromium to its trivalent form. It is only then that the trivalent
chromium complexes with 1,5-diphenylcarbazone to form a chromium-1,5-
diphenylcarbazonate (CrDPCO) (b).
The exact structure of the complex formed in (b) between Cr3+ and
diphenylcarbazone is not yet clearly defined. However, the most probable
compound resulting from this conjugation is a primary carbazonate complex
(Figure 1.7).
20
Figure 1.7 Most probable developed formula of the chromium-carbazonate
primary complex
+
1.4.1.1 UV/Vis investigation of the chromium-diphenylcarbazonate complex:
The complex formed from the conjugation of 1,5-diphenylcarbazide and
chromium (VI) according to the reaction (a) and (b) is coloured (presence of
chromophore as schematised on Figure 1.7). Therefore, this compound is typically
quantitatively studied by ultra-violet visible spectrophotometry (UV/VIS). It has
also been shown to be electroactive, and its electrochemical behaviour has been
investigated [68-69,71],
1.4.1.2 Materials and Methodi,
1,5-diphenylcarbazide (DPCI), sulphuric acid , and potassium dichromate
were purchased from Sigma Aldrich. Diphenylcarbazide was purified by
recrystallisation from ethanol absolute (Sigma-Aldrich).
21
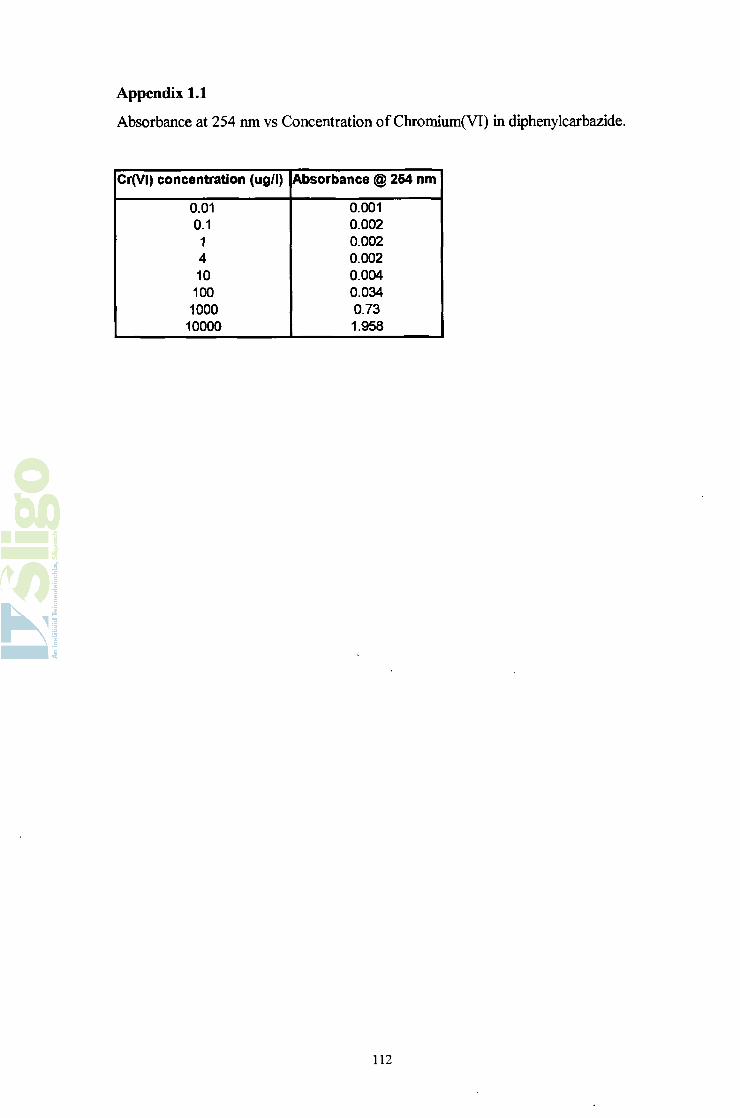
15 ml of the water sample containing 0.01, 0.1, 1, 4, 10, 100, 1000 and 10000
ug.f1 chromium(VI) were prepared and pipetted in 25 ml volumetric flasks. 1 ml
of 3 mol.r1 H2SO4 were pipetted and added to the flasks, and the contents were
filled to the mark with a solution o f 4 x 10“* mol.1*1 DPCI (in 0.015 m oll1
H2SO4). The contents were left reacting for 5 minutes and the absorbance
measured at 254 nm.
1.4.13 Results
From the results obtained, it was noticed that the greater the amount of
hexavalent chromium present with a constant amount of 1,5-diphenylcarbazide,
the greater the absorbance measured at 254 nm (Figure 1.8, Appendix 1.1).
This suggests the capability of 1,5-diphenilcarbazide to conjugate quantitatively
with hexavalent chromium, to yield a coloured and hence measurable compound
by ultra-violet and visible spectrophotometry.
Figure 1.8 Absorbance at 254 nm vs. concentration of Chromium (VI) in 1,5- diphenylcarbazide
Absorbance @ 26 nm vs. Concentration of Cr(VI) in diphenylcarbazide
Cr(VI) (ug/l)
22
1.4.2 Study of the chromium-diphenylcarbazonate complex by Cyclic
Voltammetry
Chromium- 1,5-diphenylcarbazonate can be adsorbed onto graphite, mainly
due to the presence of its phenyl groups (these groups are often used in order to
improve the adsorptivity of metal ligands onto graphite). This allows the complex
to be pre-concentrated onto a graphite electrode, prior being analysed by stripping
voltammetry.
Some researchers investigated the behaviour of 1,5-diphenylcarbazide, 1,5-
diphenylcarbazone and the primary chromium carbazonate complex by
voltammetry.
This project aimed at the investigation of the reaction between chromium and 1,5-
diphenylcarbazide by electrochemistry, to determine the feasibility of the
development of a chromium sensor based on this conjugation process, as well as
on the electrochemical characteristics of such a conjugate.
Cathodic Stripping Cyclic Voltammetry of the Chromium-1,5-i
diphenylcarbazonate complex was carried out after a pre-concentration step. The
reversibility of the conjugation reaction was also investigated [68,69].
The purpose of this study was to get familiar with the instrument, as well as find
out the optimal conditions for the determination of the chromium-
diphenylcarbazonate complex.
1.4.2.1 Materials and Methodii
The polarographic instrument used was a Metrohm 693 VA-Processor,
with 694 VA-Stand and 685 Dosimat. The system was composed of an epoxy
graphite, also called the ‘ultra-trace graphite electrode’ for working electrode, an
Ag-AgCl 3 mol.1'1 reference electrode, and a glassy carbon auxiliary electrode.
23
1,5-diphenylcarbazide (DPCI), sulphuric acid , and potassium dichromate were
purchased from Sigma Aldrich. 1,5-diphenylcarbazide was purified by
recrystallisation from ethanol absolute (Sigma-Aldrich).
A solution of 100 fig.l"1 Cr and 4 x 10⁻⁴ mole.l"1 in DPCI, in 1.5 x 10'2 mol.l'1
H2SO4 was prepared.
Linear Sweep Voltammetry (DCT) was used at an epoxy-graphite (‘Ultra-Trace’,
Metrohm, Switzerland). The deposition step was carried for 300 s at + 0.35 V vs.
Ag-AgCl, at a rotational speed of 3000 rpm. The cyclic sweep was then carried
out at a sweep rate of 40 mV.s"1 from + 0.35 to +0.35 V vs. Ag.AgCl. The
voltage step used during the sweeping was 5 mV, with a time step of 0.10 s. Each
voltammogram was obtained after 2 preparation cycles and 5 measuring cycles .
1.4.2.2 Results
The cathodic-anodic-cathodic voltammogram of hexavalent chromium in 1,5-
diphenylcarbazide can be observed in figure 1.9.
Figure 1.9 Cathodic-anodic-cathodic voltammogram of 100 jxg.l'1 Cr6+ and 4 x lO^mole.r1 DPCI in 1.5 x 1 O'2 mole.l'1 H2S04. Pre-concentration time : 300 s at + 0.35 V vs. Ag-AgCl. Initial voltage + 0.35 V, with a ramp up to + 1 V, down to - 0.8 V, and finally back to + 0.35 V.
Oxidation dr reduction of the chromium-diphenylcarbazonate complex were
obtained when the potential scan applied to the system went towards more
positive (oxidation peaks 2) or negative (reduction peak 1) potential values
referring to the + 0.35 V vs. Ag-AgCl adsorption potential. Previous research
work attributed the oxidation peak 3 to the oxidation of un-reacted
diphenylcarbazide. This peak was not observed when diphenylcarbazone was used
as complexing agent.
The cyclic voltammograms obtained show the semi-reversibility of the reactions
occurring between 1,5-diphenylcarbazide and Cr6+ (Figure 1.9).
Reduction Peak 1 - 0.256 V,
Oxidation Peak 2 + 0.283 V,
Oxidation Peak 3 + 0.363 V.
25
1.4.3 Determination of the Cr/DPCl complex by Cathodic Stripping analysis
at an epoxy-graphite electrode
1.4.3.1 Materials and Method
The same instrument and reagents than in 1.4.2.1 were used in this study.
The determination of the chromium-diphenylcarbazonate complex was carried out
by linear sweep voltammetry at the epoxy-graphite rotating disc electrode
(Metrohm, Switzerland), at a rotational speed of 3000 rpm.
A pre-concentration step was carried out at a voltage of + 0.35 V vs. Ag-AgCl
for 300 s, followed by a linear stripping from + 0.35 V to - 0.5 V vs, Ag-AgCl, at
sweep rate of 40 mV.s'1.
A 1 g.r1 Cr(VI) standard solution was prepared by dissolving 0.2830 g of
potassium dichromate in 100 ml ultra-pure water.
A Cr-complex standard (1 ml = 0.5 jug.I'1) was then obtained by pipetting 2.5 ml
of 3.0 mol.l' 1 H2SO4 and 0.025 ml of the Cr(VI) standard solution into a 50 ml
volumetric flask, which was then diluted to volume with 4 x 10⁴ mol.l' 1
diphenylcarbazide (in 0.015 mol.l' 1 H2SO4).
15 ml of a 20 jug.l"1 Cr6+ solution was pipetted into a 25 ml volumetric flask. 1 ml
of 3 mol.I' 1 sulphuric acid was added to the flask, and 1.0 ml of the
diphenylcarbazide solution. The solution was then brought up to volume with
ultra-pure water, and left to stand for 15 minutes, and then analysed by standard
addition.
26
1.4.3.2 Results
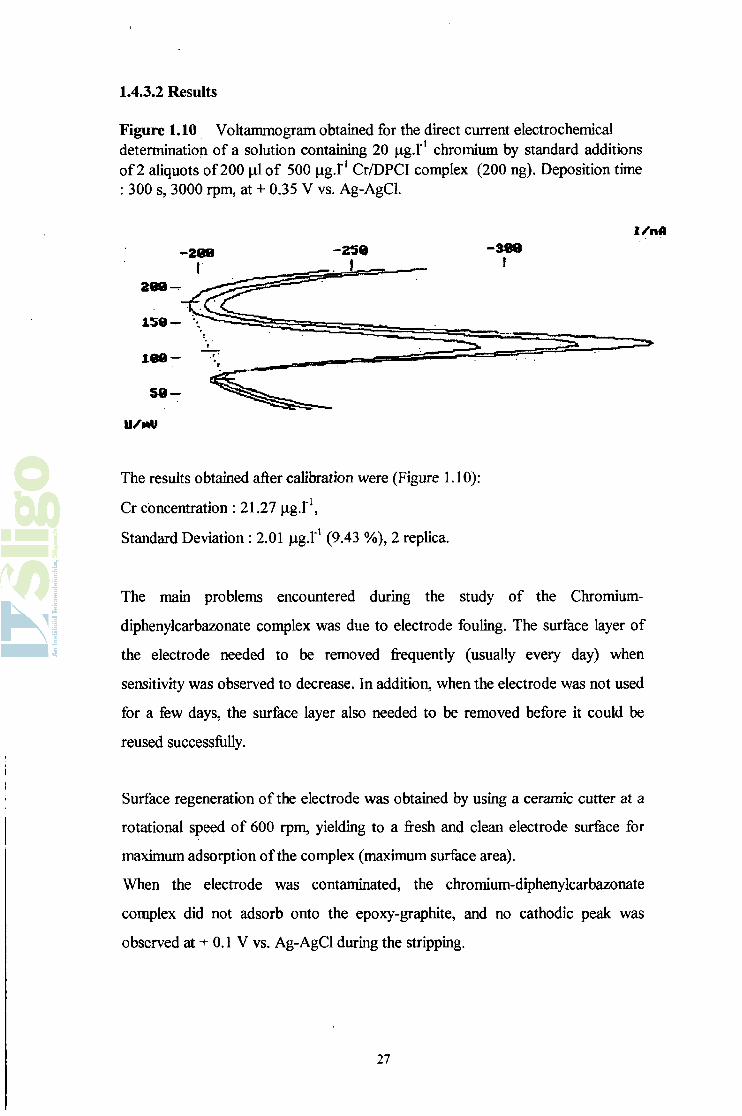
Figure 1.10 Voltammogram obtained for the direct current electrochemical determination of a solution containing 20 jig.l’1 chromium by standard additions of 2 aliquots of 200 of 500 jug.l"1 Cr/DPCI complex (200 ng). Deposition time : 300 s, 3000 rpm, at + 0.35 V vs. Ag-AgCl.
I / n A
The results obtained after calibration were (Figure 1.10):
Cr concentration : 21.27 jig.l'1,
Standard Deviation : 2.01 jxg.f1 (9.43 %), 2 replica.
The main problems encountered during the study of the Chromium-
diphenylcarbazonate complex was due to electrode fouling. The surface layer of
the electrode needed to be removed frequently (usually every day) when
sensitivity was observed to decrease. In addition, when the electrode was not used
for a few days, the surface layer also needed to be removed before it could be
reused successfully.
Surface regeneration of the electrode was obtained by using a ceramic cutter at a
rotational speed of 600 rpm, yielding to a fresh and clean electrode surface for
maximum adsorption of the complex (maximum surface area).
When the electrode was contaminated, the chromium-diphenylcarbazonate
complex did not adsorb onto the epoxy-graphite, and no cathodic peak was
observed at + 0.1 V vs. Ag-AgCl during the stripping.
27
The determination of chromium was successfully carried out down to trace levels
(1 jug.!’1) on the epoxy-graphite electrode.
Optimal adsorptive accumulation of the chromium/1,5-diphenylcarbazide complex
was observed with a deposition time of 300 s rather than the preferred 60 s, as
described in the method commercialised by Metrohm.
The main disadvantage of this method for the analysis of chromium is poor
portability for on-site analysis.
The next step focused on the formation of the complex and its direct stripping at
the electrode surface. The possibility of developing a carbon-paste or an epoxy
graphite electrode modified with 1,5-diphenylcarbazide was also investigated.
Such an electrode may allow stripping and analysis on-site.
28
1 .5 D e ve lo p m e n t o f a 1,5 -d ip h e n y lc a rb a zid e c he m ically-m o dified
carbon-paste electrode
The possibility of determining chromium by using a 1,5-diphenylcarbazide
chemically-modified carbon-paste electrode was investigated. In order to develop
chemically-modified carbon-paste electrode, different methods of preparation
were studied.
1.5.1 Modification of an epoxy-graphite electrode
1.5.1.1 Materials and Method
The reagents and chemicals used for the preparation of the chemically-
modified carbon-paste electrode were graphite powder (1-2 micron, synthetic),
1,5-diphenylcarbazide (Aldrich), and dibuthylphtalate (Sigma).
Preparation 1
The procedure used to prepare the 1,5-Diphenylcarbazide chemically-modified
carbon-paste „was based on the article from Brainina and al. [6 8 , 6 9 ] . In brief, 0.5 g
of graphite powder was mixed with 1 ml of solution of 10'2 mole.l'1 1,5-
diphenylcarbazide in acetone and stirred until the acetone had completely
evaporated. 0.15 ml of dibuthylphtalate was further added as a pasting liquid. This
was stirred well to obtain a uniform paste.
Preparation 2
The procedure used to prepare this 1,5-diphenylcarbazide chemically-modified
carbon-paste was based on the article from Paniaga and al. [ 3 4 ] .
0.4 g of graphite powder was added to 17.5 ml of 1 % 1,5-diphenylcarbazide
solution in 95 % ethanol (in water), in an agate mortar and stirred until the
ethanol had evaporated. 400 jil of Nujol were added to the paste as a liquid
binder.
29
Preparation 3
200 mg carbon powder and 100 mg 1,5-diphenylcarbazide were added to 120 mg
of Nujol and thoroughly mixed in a mortar and pestle. This method was derived
on the previous two methods.
The metrohm ultra-trace carbon-paste electrode was dipped into the carbon-paste
obtained in the three cases, so that its tip was fully covered by a thin smear of the
paste (< 1 mm, measured with a ruler). This smear was changed after every
voltammogram to ensure electrode fouling did not affect the results obtained..
1.5.1.2 Results
A solution of 100 jxg.l"1 Cr+6 in 1.5 x 10'2 mole.l'1 phosphate buffer was
studied by cyclic voltammetry as previously described. However, no oxidation or
reduction peak could be observed due to the magnitude of the background current
vs. peak current obtained.
However, it could be seen that the chromium-diphenylcarbazonate complex was
obtained in this case, due to the appearance of its characteristic pink colour,
showing that the reaction occurred. The problem may have arisen from the feet
that the complex could not adsorb onto the chemically-modified carbon-paste
electrode or that the peak was hidden by the high background current. It could
also be that the reaction only occurred from leakage of 1,5-diphenylcarbazide to
the solution, or that the electrode was not electrically functional.
These observations were obtained for the three electrode types. No significant
difference in the background current could be observed.
30
1.5.2 Prepáration of a chemically-modified electrode based on 1,5-
diphenylcarbazide
The development of a 1,5-diphenylcarbazide chemically-modified carbon-
paste electrode was the next step of the project, which should be a cheap and a
reusable electrode. This was carried out even though the previous step happened
to be unsuccessful.
1.5.2.1 Materials and Method
The carbon-paste was prepared as previously mentioned (preparation 2),
and packed in 1 ml surgical disposable syringes (insulin type). The electrical
contact was made by using a silver wire at the centre of the electrode.
A solution of 100 in Cr6 in 1.5 x 10‘2 mol. ! ' 1 H2 S 0 4 was prepared for
testing. The Metrohm 693 VA-Processor and 694 VA-Stand were used, and the
polarographic conditions were the same as previously stated in 1 .4.2.1.
1.5.2.1 Results
High background currents were obtained so that no oxidation or reduction
peaks were observable. A lower electrolyte (1.5 x 1 0 ' 3 mol.l' 1 H2 S04) was tested,
still giving high background currents, and not allowing any reduction or oxidation
to be observed.
Large background currents may be caused by large surface area. In order to
reduce this parameter, the paste was packed more tightly into the electrode body.
Another attempt was carried out using a glass pasteur pipette as electrode body,
the tip only being approximately 1 mm in diameter. However these alterations did
not affect the background current in any way.
Different amounts ofNujol were used from 100 mg to 400 mg with 0 . 1 g of DPCI
and 0.5 g of carbon powder, in order to increase the resistance of the electrode.
However, this had no apparent effect on the intensity of the background current.
31
This constant background current was probably due to the lack of flexibility of the
polarographic system used. The development of an electrode based on the
chemical modification of a graphite-paste was therefore not investigated further.
1 .6 S tu d y o f the use o f over-oxidised p o ly p y rro le as a c h ro m iu m
sensor
The aim of this part of the project was to try to determine whether over
oxidised polypyrrole could be used as a electrode material for the development of
an hexavalent chromium sensor. It was carried out by coating a layer of
polypyrrole at the surface of a gold electrode; the polymer film was then over
oxidised by scanning to anodic potentials.
1.6.1 Materials and Method
The instrument used in this part of the project was a metrohm 693 VA-
Processor with a 694 VA-Stand. The working electrodes used were gold or glassy
carbon rotating disc electrodes, a 3 mol.l' 1 Ag-AgCl reference electrode, and a
The procedure was based on the article from Wallace and al. [5 9 ] : polypyrrole
was deposited onto a gold rotating disc electrode at + 0.8 V vs. Ag-AgCl (DCT
Mode) at a rotational speed o f2000 rpm for 2 min, from a solution of 10' 1 mol.l" 1
pyrrole and 1 0 ' 1 mol.l*1 NaN03. The fresh layer o f polypyrrole was then over
oxidised in 10' 2 mol.l' 1 H2 SO4 by scanning potential from - 0.4 to + 1.3 V vs. Ag-
AgCl for 30 min.
32
Preparation 2
A polypyrrole film was deposited onto a glassy carbon rotating disc electrode
from a fresh solution of 10"1 mol.I'1 pyrrole in 10'1 mol.F1 potassium nitrate at a
potential of + 0.8 V vs. Ag-AgCl [61]. The film was then over-oxidised in aqueous
10'1 mol I"1 sodium hydroxide by cyclic voltammetry between 0 and + 1.2 V vs.
Ag-AgCl.
The freshly polymerised films were investigated as potential chromium sensors
using a 100 fxg.l’1 Cr6+ solutioa Pre-concentration was carried out for 180 s at a
potential of + 0.8 V vs. Ag-AgCl in both cases to the modified electrode (2000
rpm) in order to amplify the stripping of the Cr6+ response.
A pre-concentration step was carried out by direct current mode, with a voltage
step of 0.5 s, a scan rate of 10 mV.s'1, a modulation amplitude of 100 mV, a pulse
width of 50 ms, and a rest time o f 10 s.
The stripping of the Cr6+ was carried out by differential pulse voltammetry, with a
step width of 0.5 s, a scan rate of 10 mV.s“1, a modulation amplitude of 100 mV,
a pulse width of 50 ms, a time measurement of 20 ms. The sweep rate was 12
mV.s'1 and the potential step was 6 mV.
1.6.2 Results
Background noise appeared to be an omnipresent and major problem
during the stripping of the Cr6+ solution, hiding its response, assuming a response
existed. ji
Lowering the strength of the electrolyte did not have any noticeable effect on the
background current. As a result, the freshly prepared polypyrrole coated electrode
was not valid as chromium sensor.
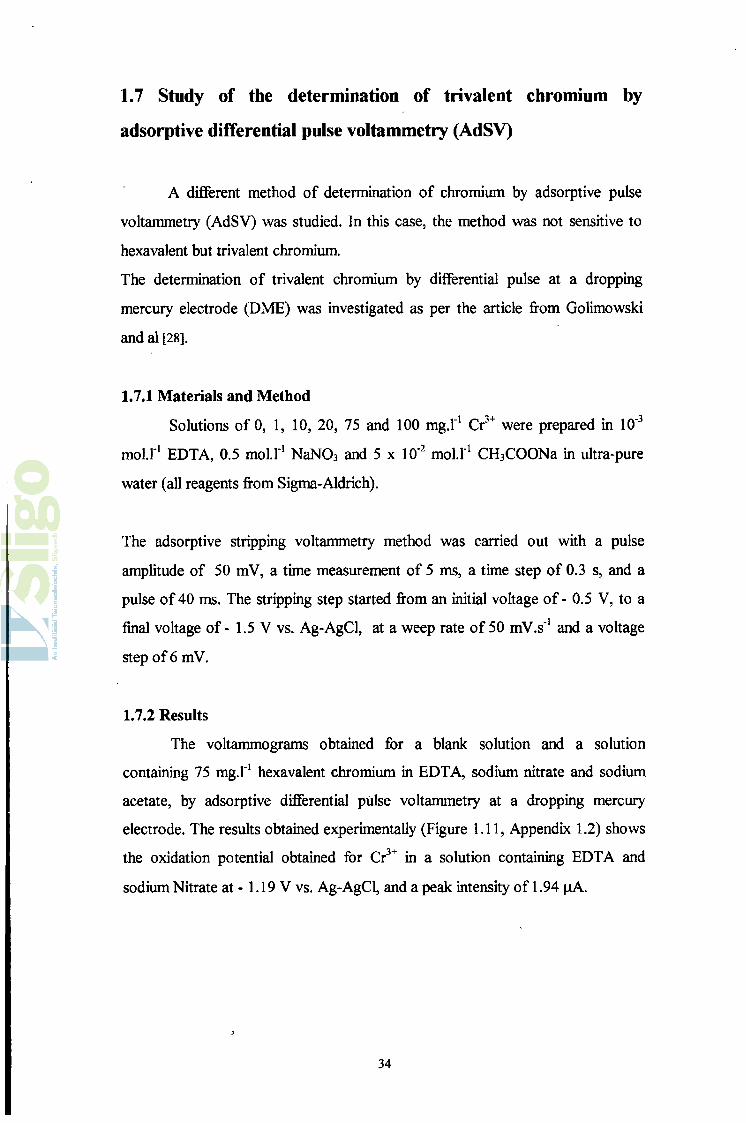
1 .7 S tu d y o f the d e te rm in atio n o f triv a le n t c h ro m iu m b y
adsorp tive d iffe re n tia l pulse v o lta m m e try ( A d S V )
A different method of determination of chromium by adsorptive pulse
voltammetry (AdSV) was studied. In this case, the method was not sensitive to
hexavalent but trivalent chromium.
The determination of trivalent chromium by differential pulse at a dropping
mercury electrode (DME) was investigated as per the article from Golimowski
and al [28].
1.7.1 Materials and Method
Solutions of 0, 1, 10, 20, 75 and 100 mg.l'1 Cr3+ were prepared in 10"3
m oll'1 EDTA, 0.5 mol.1"1 NaN03 and 5 x 10'2 moll-1 CH3COONa in ultra-pure
water (all reagents from Sigma-Aldrich).
The adsorptive stripping voltammetry method was carried out with a pulse
amplitude of 50 mV, a time measurement of 5 ms, a time step of 0.3 s, and a
pulse of 40 ms. The stripping step started from an initial voltage of - 0.5 V, to a
final voltage of - 1.5 V vs. Ag-AgCl, at a weep rate of 50 mV.s'1 and a voltage
step of 6 mV.
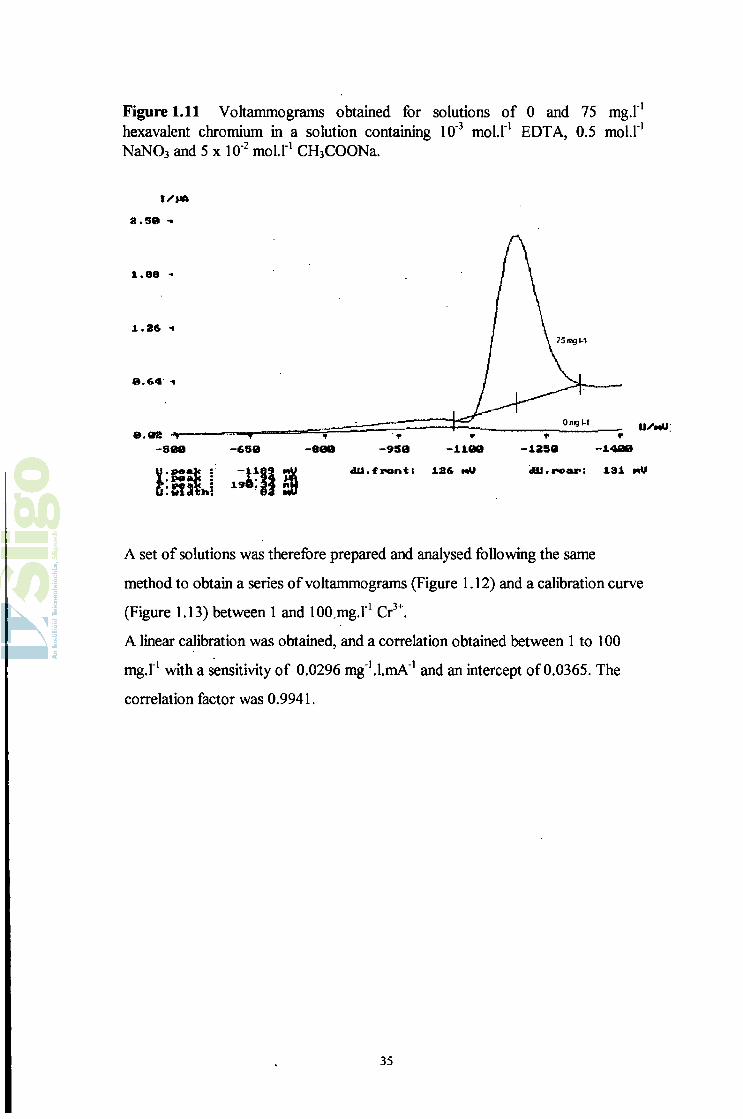
1.7.2 Results
The voltammograms obtained for a blank solution and a solution
containing 75 mg.l"1 hexavalent chromium in EDTA, sodium nitrate and sodium
acetate, by adsorptive differential pulse voltammetry at a dropping mercury
electrode. The results obtained experimentally (Figure 1.11, Appendix 1.2) shows
the oxidation potential obtained for Cr3+ in a solution containing EDTA and
sodium Nitrate at -1.19 V vs. Ag-AgCl, and a peak intensity of 1.94 (iA.
34
Figure 1.11 Voltammograms obtained for solutions of 0 and 75 mg.l'1 hexavalent chromium in a solution containing 10'3 moü"1 EDTA, 0.5 mol.1'1 NaN03 and 5 x 10'2 mol.l1 CH3COONa.
I/'MAÎ Î . S 0 -•
u.peak : -1189 nU dU.frontt 12& mU dU.ro«r; 131 mU
A set of solutions was therefore prepared and analysed following the same
method to obtain a series of voltammograms (Figure 1.12) and a calibration curve
(Figure 1.13) between 1 and 100.mg.I'1 Cr3+.
A linear calibration was obtained, and a correlation obtained between 1 to 100
mg.l'1 with a sensitivity of 0.0296 mg'^l.mA'1 and an intercept of 0.0365. The
correlation factor was 0.9941.
35
Figure 1.11 Linear calibration o f solutions of 1, 10, 20, 75 and 100 mg. I’1 Cr3' in 10‘* mol.!'1 EDTA, 0.5 mol.l'1 NaNOi and 5 x 10*2 mol.!*1 CHjCOONa, by adsorptive differential pulse voltammetry at a dropping mercury electrode :
r /m4 . r a «
». 99
1 . 9 8
» . 9 7
-1W2W - 1 1 3 0
OU . i r o n t : 1 3 0 nU
U'mU- îa - ia - u s a
a u . M a r : i a a «u
-«.048 0 0 9 1 0
Figure 1.12 Calibration curve for 1, 10, 20. 75 and 100 m g.l1 Cr3' in a solution 10‘3 mol.l'1 EDTA, 0.5 moLf* NaNOj and 5 x 10’2 mol.l'1 CHjCOONa.
Current (uA) vs Cr(lll) concentration (mg/l)
Cit+lll) concentration (mg/l)
36
1.8 Discussion
This part of the project was aimed principally at the investigation and
study on the development of sensors for the analysis of heavy metals. An extended
literature study was carried out which covered the definition of sensors (physical,
chemical and biological), and their main applications for heavy metals monitoring.
It also covered the definitions of stripping voltammetry, polarography, and
defined the most widely used working and reference electrodes, as well as the
main electroanalytical techniques used for heavy metals determination.
This part of the project was principally a theoretical and experimental
familiarisation of the techniques and electrochemical principles involved in the use
of solid electrodes. The determination of chromium in water was studied by using
different solid state electrodes such as epoxy-graphite, glassy-carbon, or mercury
electrodes.
Qualitative and quantitative investigation of the chromium-diphenylcarbazide
complex was also obtained by ultraviolet and visible spectrophotometry.
The main problems encountered during the electrochemical study were centred
around the highly rigid and non-user-friendly aspects of the metrohm polarograph.
The procedure for the determination of chromium by adsorptive stripping carried
out on the epoxy-graphite ‘Ultra-Trace5 electrode developed by metrohm was
successfully carried out. Such electrode was specially developed for the
instrument for this analysis, based on the articles studied in 1.4, and therefore met
particular specifications, which could not always be met by other electrodes
designed in the lab.
Samples containing chromium concentrations as low as 1 ug.l"1 can successfully
be analysed using this particular method.
The cyclic voltammetric behaviour of the complex formed between 1,5-
diphenylcarbazide and chromium was also investigated at the epoxy-graphite
electrode. One reduction peak was observed, whereas two oxidation peaks were
present. The results obtained indicates the semi-reversibility of the reaction as well
as the absorption of 1,5-diphenylcarbazide to the electrode [67].
37
Other modified electrodes developed during this experimental study showed high
background currents or could not be recognised by the instrument used. More
versatile potentiostats are presently on the market (some of them being portable
for on-site analysis), and would allow more flexibility which would facilitate
research.
Using the 1,5-diphenylcarbazide chemically-modified carbon-paste electrodes
developed at the laboratory, the reaction between the chromium ions and 1,5-
diphenylcarbazide was obtained (i.e. presence of the coloured complex), but the
stripping current was covered up by high background current. Different chromium
concentrations were investigated, but the high background noise did not allow any
successful analysis.
It was therefore impossible to determine whether the complex obtained was
effectively adsorbing at the electrode surface, and if it was stripped. Different
types of carbon-pastes were tested (3 types), as well as the area of the electrode
surface, but no electrochemical change could be observed.
Future work which could be undertaken on this part of the project should focus
on the manufacture of wax based electrodes (i.e. candle wax, modifier and
graphite embedded), as this type of electrode possesses characteristics such as low
background current, uniform dispersion of the modifier, and the possibility of
surface regeneration by scrapping. Besides, the ultra-trace electrode developed by
Metrohm for the determination of chromium using 1,5-diphenylcarbazide is based
on this type of material, and suggest more suitable characteristics than carbon-
paste.
The investigation of the complexation reaction between hexavalent chromium and
1,5-diphenylcarbazide was carried out in depth at various solid and mercury
electrodes. From the results obtained in the project, it can be said that future work
could focus on the development of disposable screen-printed carbon-paste
electrodes, modified with 1,5-diphenylcarbazide. Such devices may allow on site
electrochemical analysis and speciation of Cr6+ over Cr3+.
38
The monitoring of trivalent chromium could be also investigated by developing
similar sensors modified with 1,5-diphenylcarbazone.
However, most interest should be given to 1,5-diphenylcarbazide chemically-
modified carbon-paste screen-printed sensors, which would allow the
determination of the hexavalent chromium, which has the greater adverse
environmental impact.
39
C H A P T E R 2 .0
USE OF GLUTATHIONE
s-TRANSFERASE FOR THE
DEVELOPMENT OF AN ORGANOCHLORINE
FLOW-THROUGH SENSING SYSTEM
40
2.1 Introduction :
Environmental pollution in the last century
As stated in 1.3, human activities and industrial revolution have modified natural
cycles, causing regional and global redistribution of more or less hazardous
elements in aquatic and terrestrial systems, up to critical concentrations in various
cases. Human history has never seen a greater chemical load placed on the
environment as there is today, and the chemical industry continues to generate an
ever-increasing amount of pollutants. It is estimated that between 50,000 and
100,000 chemicals are now commonly used world-wide (Table 2.1). Substantial
evidence has arisen about the contamination of the environment by waterways,
soil and air, as well as our bodies, with toxic chemicals.
2.1.1 Sensing organochlorine and organic compounds ?
Table 2.1 Production data for the UNEP Persistent Organic Pollutants (POPs) pesticides [72]
O rganochlorine
Pesticides
In it ia l Producer Y e a r of Introduction G lo b a l Use (tonnes)
Aldrin/Dieldrin Shell 1948-50 > 130,000
Endrin Velsicol and Shell - > 2,300
Chlordane Velsicol 1947 3,000,000
DDT Ciba-Geigy AG 1946 30,000*
HCB . 1945 > 100,000
Heptachlor Velsicol 1952 N/A
Mirex Allied Chemical Co. 1946 N/A
Hooker Chemical 1958-59 > 1,500
Toxaphene Hercules Powder Co. 1946 1,333,000
* Production estimated (WWF 1998) and believed to be taking place in India and China.
Pollution by organochlorine compounds is an important environmental and health
feature, and an extensive number of these organic compounds are listed in the
76/464/EEC Directive, also known as the ’Dangerous Substance Directive' [73].
41
Use o f organochlorine compounds as pest control
Huge amounts of organochlorine compounds are used as pesticides, as well as in
chemical, pharmaceutical and halide industries. Many of these organochlorine
compounds possess carcinogenic and/or teratogenic characteristics, and are
therefore a threat to the public health and to the quality of ground, river and lake
water. The organochlorine pesticides were introduced in Australia in the mid
40's, in different forms (wettable powders, liquids), and include DDT, dieldrin,
heptachlor and chlordane.
Many of these pesticides are listed within the ’List of 129 compounds’ and in the
UNEP POPs, due to :
i) their resistance towards chemical, physical and biological means of degradation,
their half-lives ranging from months to years, to decades in some cases. Aldrin,
dieldrin, endrin, chlordane, HCB, heptachlor, mirex, toxaphene are classified as
Persistent Organic Pollutants (POP's). POP's are defined as compounds that will
find their way into the environment, even many years after production may have
ceased (i.e. pesticides, industrial chemicals, and unattended by-products of
combustion and industrial processes);
ii) their toxicity to human and other animals, and most aquatic life, and their
short-term or long-term impacts at low concentrations; and
iii) their bio-accumulation in the fatty tissues of plants and animals. This means
that animals higher in the food chain such as birds of prey or humans accumulate
higher levels of the pesticides than animals lower down the food chain.
It is therefore essential to obtain a fast and sensitive way to determine this type of
compound. On the other hand, in situ determination appears primordial in the
case of effluent monitoring, as most organochlorine pollutants are produced in
the chemical, mill, pulp and paper industries, sludge incinerators, oil refining (used
as catalysts) or steel and iron industries, where fast action may be required in the
case of release of high pollutant concentrations.
42
A good indication of the persistence of compounds in the environment is their
absence from remote areas such as the Arctic or deep oceans. Many POPs were
identified in the Arctic (Table 2.2) by the Arctic Monitoring and Assessment
Programme (AMAP, 1998), which is of concern because of their global
distribution via air and water currents [ 7 4 - 7 6 ] .
Table 2.2 Some of the world leading companies involved in the manufacture of one or more POPs contaminating the Arctic [ 7 7 ]
Glutathione s-aryl transferase combines with a substrate so that a hydrogen halide
is eliminated (e.g. dichloronitrobenzene, chlorodinitrobenzene). Important
degradation reactions catalysed by this type of enzyme are linked with pesticides
such as atrazine and some other chlorinated triazine derivatives in plants.
In contrast, glutathione s-alkyl transferase catalyses reactions in which glutathione
attaches to what was the smallest part of the original molecule. It will however
react with the alkyl halides in a similar manner to the previous group of
transferase. This reaction is particularly interesting for methyl removal in organo
phosphorous pesticides such as methyl parathion, mevinphos or dichlorvos.
Glutathione s-epoxide transferase catalyses reactions in which an epoxide ring is
opened to enable the attachment of glutathione. This type of enzyme is
particularly important in the pesticide pathway of carcinogenic compounds such
as dieldrin, endrin, heptachlor epoxide as well as all organochlorine epoxides
[ 1 0 7 ] .
Other related enzymes are the glutathione peroxidases (enzyme whic catalyses the
degradation of hydrogen and organic peroxides), glutathione synthesise (which
catalyses the activation of the carboxyl group of cysteine by ATP) and glutathione
reductase (catalyses the reduction of the oxidised glutathione to the reduced
glutathione).
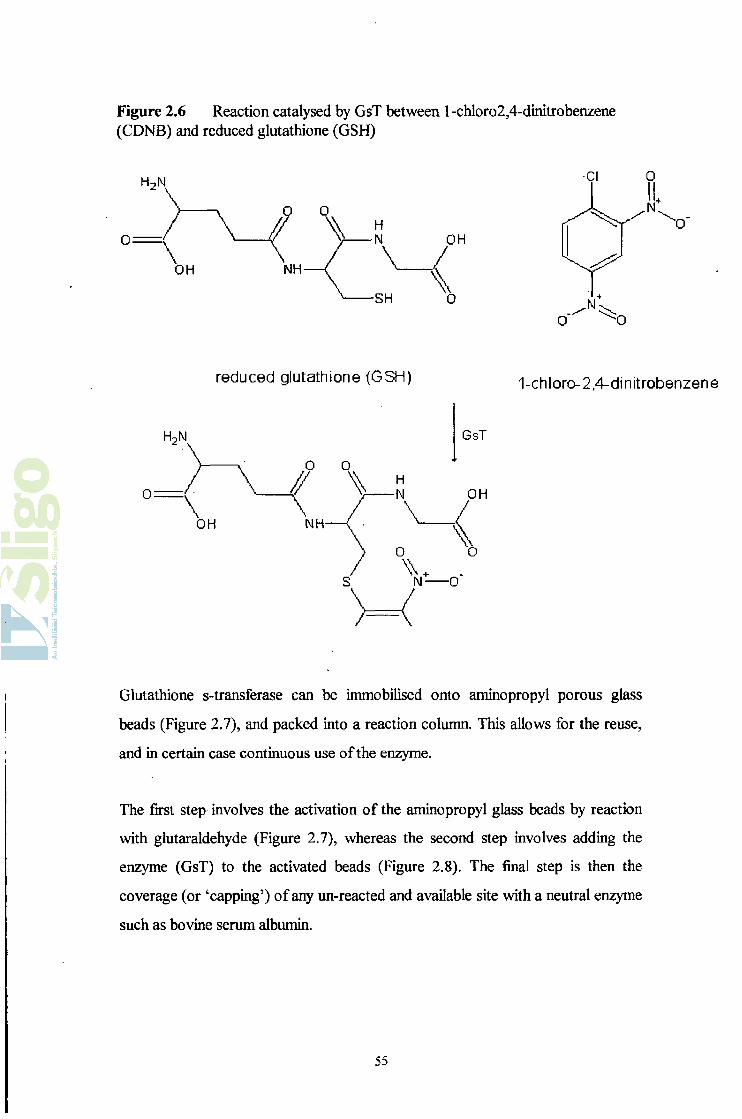
The conjugation reaction of GSH with l-chloro-2,4-dinitrobenzene (Figure 2.6)
occurs more rapidly than any other organochlorine compound, and has been
thoroughly studied. This substrate is most commonly studied as its speed of the
reaction with GSH is faster relative to other substrate.
54
Figure 2.6 Reaction catalysed by GsT between 1 -chloro2,4-dinitrobenzene (CDNB) and reduced glutathione (GSH)
h2n
0:\
OH
Cl 0I!
"0
O' 'O
0:
reduced glutathione (GSH)
\OH
GsT
1-chloro-2,4-dinitrobenzene
Glutathione s-transferase can be immobilised onto aminopropyl porous glass
beads (Figure 2.7), and packed into a reaction column. This allows for the reuse,
and in certain case continuous use of the enzyme.
The first step involves the activation of the aminopropyl glass beads by reaction
with glutaraldehyde (Figure 2.7), whereas the second step involves adding the
enzyme (GsT) to the activated beads (Figure 2.8). The final step is then the
coverage (or ‘capping5) of any un-reacted and available site with a neutral enzyme
such as bovine serum albumin.
55
Figure 2.7 Protein immobilisation onto aminopropyl porous glass beads
CH
l l O Si (C H 2) 3NH + (CH ) ►
l ICH
Aminopropyl Glass Beads Glutaraldehyde
O
H2N-P*otdn |^ O Si (CH 2) 5N ------- CH(C H 2)3C H -------N - Protein
O
Enzymed-Linked Glass Beads
The reaction between CDNB and GSH is catalysed by the GsT immobilised on
the glass beads. The main interest in immobilising the enzyme onto aminopropyl
porous glass beads is the acceleration of the conjugation of GSH with CDNB. As
all thiol, GSH is an electrochemically active compound and this electrochemical
activity may be altered upon complexation to the CDNB molecule.
■si — (CH2)3N ^ ch(ch2)3chO
56
2 .4 E x p e rim e n ta l stu d y o f reduced glutathione b y p o la ro g ra p h y
an d v o lta m m e try
2.4.1 Introduction
Reduced glutathione has been widely studied at mercury electrodes, GSH forming
an amalgam with mercury. The following work focused on the investigation of the
electroanalytical analysis of GSH at a dropping mercury electrode by square-wave
voltammetry, by varying parameters such as pH, ionic strength, concentration of
buffer, time step, frequency of signal, time measurement.
This was carried out to understand the behaviour of this organic compound and
maximise the detection limits of its analysis by polarography and voltammetry.
A calibration curve and a dynamic range were obtained at the dropping mercury
electrode, by square-wave voltammetry at a dropping mercury electrode.
Reduced glutathione will then be investigated by cyclic voltammetry at various
other electrode types to determine their relative effectiveness, in view of a future
use in a flow-cell.
2.4.2 Study of the polarographic behaviour of reduced glutathione at the
dropping mercury electrode
2.4.2.1 Effect of buffer pH
pH is known to influence the oxidation of reduced glutathione in an
important extent. Most methods to date use acidic buffer (citrate) : however, the
effect of pH on the determination of reduced glutathione was determined by
monitoring the peak intensity as well as the shape of the oxidation peaks (Figure
2.8, Appendix 2.1).
57
2.4.2.1.1 Materials and Method
Solutions of reduced glutathione 50 x 10‘6 mol.l'1 in citrate (pH 3.13 to
4.99), phosphate (pH 7.17-7.95) and sodium chloride/sodium hydroxide/Glycine
(pH 8.41-11.22) were prepared.
The determination of glutathione was then carried out by square-wave
voltammetry, with a voltage amplitude of 50 mV. a time step of 0.5 s, a
measurement time of 0.5 ms, a frequency of 100 Hz. The oxidation peak was
obtained during the sweep from 0 to + 0.9 V vs. Ag-AgCl, with a voltage step of
4 mV, and a sweep rate of 8 ms.s"1.
The polarographic instrument was a Metrohm 693 VA-Processor, 694 VA-Stand,
with a Ag-AgCl 3 mol I"1 reference, and a Glassy Carbon auxiliary electrode.
Square-wave voltammetry was chosen over differential pulse polarography due to
its greater sensitivity towards reduced glutathione.
2.4.2.1.2 Results
The Figure 2.8 shows the effect of the pH of the buffer on the peak
current for the oxidation of reduced glutathione by square-wave voltammetry at
the dropping mercury electrode.
Optimal intensity and peak shape are obtained between pH 3 and 5 (Appendix
2.1). Higher pH lead to poor peak shapes (large width and poor resolution) and
are therefore not appropriate for the analysis of reduced glutathione by square
wave voltammetry at a dropping mercury electrode.
58
Figure 2.8 Effect of the pH of buffer on the peak intensity (|iA) of 50 pig 1 1 reduced glutathione in 10 '’ mol I'1 buffer by square-wave voltammetry at the dropping mercury electrode (carried out in triplicate).
Peak Intensity of 50 uM GSH at dme (uA) vs pH of buffer
pH of buffer
It is also interesting to note that the higher the pH, the more cathodic the
oxidation peak occurs at (Figure 2.9)
Figure 2.9 Oxidation Potential (mV) vs electrolyte pH
Oxidation Potential (mV) vs. pH
The shift of the oxidation peak towards more cathodic oxidation potential is
observed to be greater from pH 3 to pH 8, where increasing the pH of buffer does
not have an important impact on the oxidation peak of reduced glutathione
59
2.4.2.2 Effect of the concentration of the buffer
In a similar way, the effect of the concentration of the buffer is an
important parameter for electrochemical analysis, and was therefore investigated.
2.4.2.2.1 Materials and Method
Different citrate (pH 4.0) buffer concentrations (from 0.01 to 0.1 mol I 1)
were used to prepare solutions containing 5 x 10'5 mol f 1 reduced glutathione.
These solutions were analysed to investigate a possible impact of the buffer
concentration on the peak current (Figure 2.10).
2.4.2.2.2 Results
Figure 2.10 Effect of the concentration of buffer on the peak current (piA) of 50 ng.r1 reduced glutathione by square-wave vohammetry at dropping mercury electrode (carried out in triplicate).
Peak Current of a 50 uM GSH solution at dme (uA) vs Buffer Concentration (mol/l)
Buffer Concentration (moll)
The higher the concentration of the buffer (Figure 2.11), the lower the peak
intensity of the oxidation peak of GSH (see Appendix 2.2). The buffer
concentration used for future work were therefore set at 10': mol.l '.
60
Figure 2.11 Oxidation Potential (mV) vs. Electrolyte Concentration (mol.!*1)
Oxidation Potential (mV) vs Electrolyte Concentration (M)
5 -3 50 -
i -3605 -3 70
° -380
E le c t r o d e C o n c e n t r a t io n (M )
One can also notice that the higher the buffer concentration, the lower negative
the voltage occurred.
2.4.2.3 Effect of the pulse time
The effect of the pulse time on the peak intensity of measurement was
investigated in order to define the best conditions for the determination of the
oxidation of GSH at a dropping mercury electrode, by square wave voltammetry.
2.4.2.3.1 Materials and Method
The peak currents obtained from the oxidation of a solution containing 50
x 10"* m oir1 GSH in 10'2 mol.I"1 citrate buffer pH 4.0 were obtained for pulse
time ranging from 0.2 to 1 ms.
2.4.2.3.2 Results
The peak currents obtained from the oxidation of a solution containing 50
x 10"* mol.l1 GSH in 10: mol.I1 citrate buffer pH 4.0 were plotted versus the
pulse time (ms) defined in the method to study the effect of this parameter (Figure
2. 12).
61
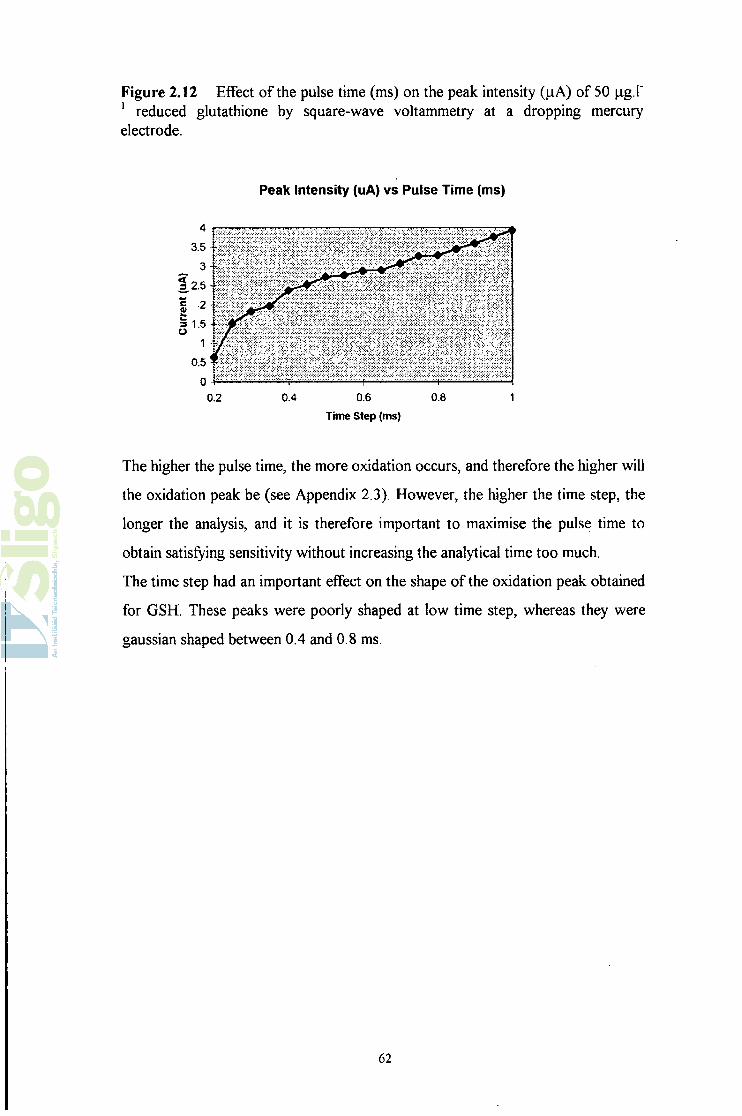
Figure 2.12 Effect of the pulse time (ms) on the peak intensity (jiA) of 50 jig.P 1 reduced glutathione by square-wave voltammetry at a dropping mercury electrode.
Peak Intensity (uA) vs Pulse Time (ms)
Time Step (ms)
The higher the pulse time, the more oxidation occurs, and therefore the higher will
the oxidation peak be (see Appendix 2.3). However, the higher the time step, the
longer the analysis, and it is therefore important to maximise the pulse time to
obtain satisfying sensitivity without increasing the analytical time too much.
The time step had an important effect on the shape of the oxidation peak obtained
for GSH. These peaks were poorly shaped at low time step, whereas they were
gaussian shaped between 0.4 and 0.8 ms.
62
2.4.2.4 Determination of the effect of the modulation frequency of the signal
pulse on the GSII response
2.4.2.4.1 Materials and Method
The investigation of the effect of the modulation frequency of the signal
pulse on the intensity of the peak produced by the oxidation of a solution 5 x 10 '
mol I'1 GSH in 2 x 10'* molT1 citrate buffer pH 4.0 by square wave voltammetry
at a dropping mercury electrode was investigated.
2.4.2 4.2 Results
The peak intensities obtained for the 5 x 10'5 mol I*1 GSH (Appendix 2.4)
were plotted against the modulation frequency to determine the optimum
frequency (Figure 2.13):
Figure 2.13 Effect of the modulation frequency (Hz) of the signal pulse on the peak intensity (|iA) of 50 ng I'1 reduced glutathione by square-wave voltammetry at a dropping mercury electrode.
Peak Intensity (uA) vs Modulation Frequency (Hz)
Modulation Frequency (Hz)
An optimum peak intensity was obtained in this case for a modulation frequency
range from 130 to 160 Hz. The analytical modulation frequency was set up at 140
Hz for future analysis.
63
2.4 .2 .5 D eterm ination o f the effect o f the scan rate on the G SH response
2.4.2.5.1 Materials and Method
The effect of the scan rate was also investigated for the determination of a
solution containing 5 x 10'5 mol.I'1 GSH in 2 x 10'2 mol.I'1 citrate buffer pH 4.0 by
square wave voltammetry at a dropping mercury electrode (Figure 2.14).
2.4.2.5.2 Results
Figure 2.14 Effect of the scan rate (ms) on the peak intensity (jiA) of 50 jig. I'1 reduced glutathione by square-wave voltammetry at a dropping mercury electrode.
Peak Intensity (uA) vs Scan Rate (ms)
Time Measurement (ms)
From the results in Appendix 2.5 and the Figure 2.14, it can be observed that the
greater the scan rate, the greater the peak intensity observed for the oxidation of
reduced glutathione.
A linear calibration was obtained in this case for scan rate between 0.1 to 3 ms,
yielding in a correlation coefficient of 0.9952 with sensitivity of 0.2988 10'3 A s '1.
Therefore, the faster the scan rate, the greater the current obtained for the analysis
of reduced glutathione by square-wave voltammetry at a dropping mercury
electrode.
64
2.4.2.6 Calibration of a solution of GSH in 2 x 10² m oll1 citrate buffer pH
4.0 by square wave voltammetry at a dropping mercury electrode (DME)
2.4.2.6.1 Materials and Method
Solutions of GSH in 2 xl0 : mol.I*1 citrate buffer pH 4.0 were freshly
prepared (as GSH oxidises at the atmospheric air) and their calibration was
investigated.
The voltammetric parameters during this calibration were chosen from all the
previous studies, to attain maximum sensitivity. The voltage amplitude chosen
was 50 mV, the modulation frequency o f the signal of 140 Hz, the pulse time was
0.5 ms, a Scan Rate of 1 ms and the Voltage Step was 4 mV.
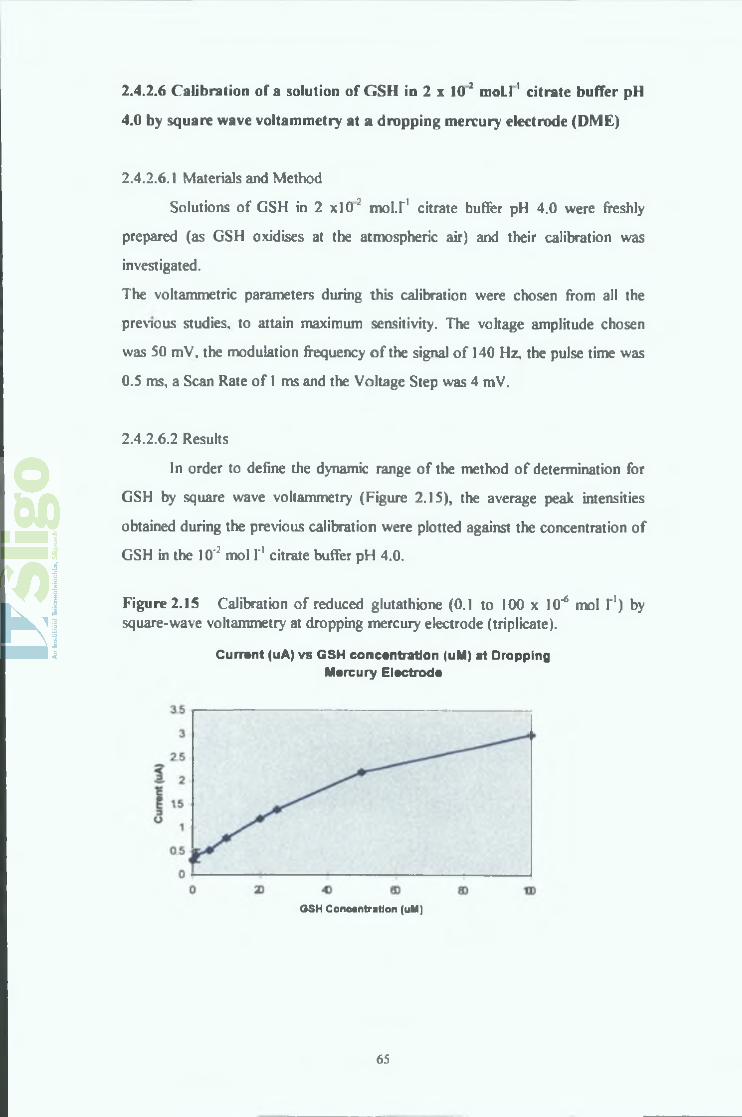
2.4.2.6.2 Results
In order to define the dynamic range of the method of determination for
GSH by square wave voltammetry (Figure 2.15), the average peak intensities
obtained during the previous calibration were plotted against the concentration of
GSH in the 10': mol I'1 citrate buffer pH 4.0.
Figure 2.15 Calibration of reduced glutathione (0.1 to 100 x 10"6 mol I'1) by square-wave voltammetry at dropping mercury electrode (triplicate).
Current (uA) vs GSH concentration (uM) at Dropping Mercury Electrode
OSH Concentration (uM)
65
From the results in Appendix 2.6 and the Figure 2.15, it can be seen that the peak
intensities obtained for the oxidation of GSH appear to increase linearly for
concentration in GSH ranging from 0.1 to 25 x W 6 mol I'1, so that a calibration
graph could:be plotted for the oxidation of GSH at a dropping mercury electrode
by square wave voltammetry, according to the previously mentioned parameters
(Figure 2.16).
Figure 2.16 Linear calibration of reduced glutathione (0.1 to 25 x 10"6 molX1) by square-wave voltammetry at dropping mercury electrode.
Current (uA) vs GSH Concentration (uM) at Dropping MercuryElectrode
GSH Concentration (uM)
A linear calibration for the determination of reduced glutathione (GSH) was
therefore obtained by square wave voltammetry at the dropping mercury electrode
(Appendix 2.6) between 0.1 and 25 x 10'6 molX1. This calibration showed a
correlation coefficient r2 of 0.9964 with a sensitivity of 0.0423 A.mol'1.!.
66
2.4.2.7 Investigation of the calibration of GSH response by cyclic
voltammetry at a hanging mercury electrode by square wave voltammetry
2 A.2.1.1 Materials and Method
In order to investigate the influence of the concentration in GSH on the
oxidation peak obtained by cyclic voltammetry, GSH containing standards were
made up in 2 x 10 mol.r1 citrate buffer and their peak intensities were recorded
by square wave voltammetry.
The voltage amplitude chosen was 50 mV, with a voltage step of 0.5 s, a
measurement time of 0.5 ms, a voltage step of 4 mV. The modulation frequency
of the voltage signal was set at 140 Hz, and an intensity range of 140 nA.
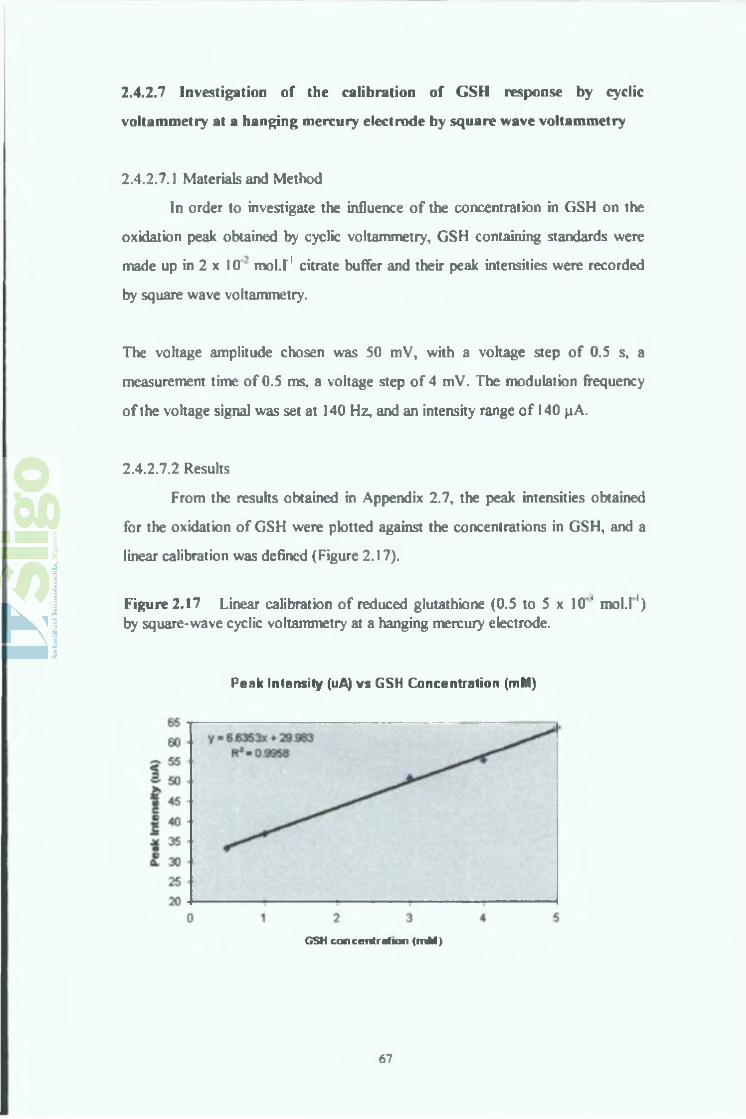
2A2.7.2 Results
From the results obtained in Appendix 2.7, the peak intensities obtained
for the oxidation of GSH were plotted against the concentrations in GSH, and a
linear calibration was defined (Figure 2.17).
Figure 2.17 Linear calibration of reduced glutathione (0.5 to 5 x 10'' mol.l1) by square-wave cyclic voltammetry at a hanging mercury electrode.
Peak Intensity (uA) vs GSH Concentration (mM)
G SH concen tration (m M )
67
A linear calibration was obtained also in this case within the concentration range
from 0.5 and 5 x 10"3 mol.l’1. The correlation coefficient r2 obtained was 0.9958
and the sensitivity was 6.6353 10"3 A.mol'1.l.
One can note that the sensitivity of the hanging mercury electrode towards
reduced was much lower than obtained for the dropping mercury electrode.
68
2.4 .3 E lectron M ediators
Electron mediators are low molecular weight organic compounds that
shuttle electrons between the redox centre of the enzyme and the working
electrode. Ideally, a mediator for the use in an electrochemical device should react
quickly with the enzyme, possess reversible heterogeneous kinetics and have a
low overpotential for regeneration.
Figure 2.18 Reaction scheme depicting the role of an electron mediator (E is the enzyme, „and Med the mediator)[l07].
E(red)
E(ox)
Substrate
Product
Ferrocene is used widely as an electron mediator, and its role in the mediation of
Glucose Oxidase (GODred) is as follows :
GODred + 2FeCp2R+ GODox + 2FeCp2R + 2H+
2FeCp2R 2 FeCp2R+ + 2e"
2.4.4 Modification of glassy, ultra-trace, silver, platinum and gold rotating
disk electrodes with ferrocene
The aim of this part of the project was to investigate the effect of modifying the
material of the working electrodes (gold, glassy-carbon, ultra-trace, silver and
platinum) with a non water-soluble electron mediator, ferrocene.
Ferrocene commonly acts as an electron mediator, and induces the oxidation of
reduced glutathione at the different electrode surfaces.
69
The tip of the glassy-carbon, silver, gold and platinum electrodes were first
polished with 2 pm alumina, and then carefully cleaned with ultra-pure water, to
attain smooth surfaces.
In the case of the ultra-trace electrode, the tip of the electrode was renewed
everyday using the ceramic scrapper at disposal by metrohm to get a fresh new
outer surface.
After the polishing or scrapping of the electrodes, which aimed at creating a
renewed electrode surface, these were modified by applying 10 (ils volumes of 10“
1 mol.l'1 ferrocene solution in toluene onto their surfaces. The toluene was then
allowed to evaporate at room temperature, the ferrocene staying on the electrodes
surface as a thin smear.
2.4.5 Modification of glassy, ultra-trace and gold rotating disk electrodes
with mercury-film
The glassy-carbon and gold rotating disc electrodes were pre-treated in
the same way than in 2.4.3.
Mercury-modified electrodes were obtained using a mercury Hg2+ solution of 10'1
mol.l'1 potassium nitrate and 5 x 10'3 mol.l'1 mercuric nitrate in ultra-pure water.
The deposition step of the mercury layer at the electrode surface was carried out
applying a potential of - 1.0 V vs. Ag-AgCl 3 mol.l"1 for 2 minutes.
The electrodes were cleaned at + 1.5 V vs. Ag-AgCl for 5 minutes after use to
remove the mercury from the surfaces. In the case of the ultra-trace electrode, the
scrapping of the outer layer was carried out to ensure total renewal of the surface.
70
2 .5 In vestig atio n o f the b e h a vio u r o f reduced and oxidised
glutathione b y cyclic v o lta m m e try
2.5.1 Materials and Method
The cyclic behaviour of reduced glutathione at various types of rotating-disc
electrodes was determined by Square-wave Cyclic Mode. The voltage amplitude
was 50 mV, with a Sweep Rate of 25 mV.s'1, a modulation frequency of 140 Hz,
and an intensity range of 140 |iA. The pulse time was 2 s, with a voltage step of 5
mV, a scan rate of 0.2 ms.
2 x 10’2 mol.l"1 citrate buffer pH 3.0, 6 x 10'2 moll'1 reduced glutathione (GSH)
and 6 x 10'2 mol.1"1 oxidised glutathione (GSSG) in the previous buffer were
prepared.
The polarographic instrument was a Metrohm 693 VA-Processor, 694 VA-Stand,
with a Ag-AgCl 3 mol'1 reference electrode. Several rotating disc electrodes were
used, such as glassy-carbon, ultra-trace epoxy-graphite, and silver.
The possibility of using a mercury-film deposited on the surface of the ultra-trace
and the gold electrodes at a potential of -1.0 V vs. Ag-AgCl for 300 s was also
investigated.
2.5.2 Results at the glassy-carbon rotating disc-electrode
From the cyclic voltammograms obtained, it was observed that no oxidation or
reduction occurred at a noticeable level at the surface of the glassy-carbon
electrode.
The glassy-carbon rotating disc electrode was therefore modified by the addition
of ferrocene, an electron mediator, at the surface of the electrode. However, the
cyclic voltammograms did not change in any way.
71
However, the cyclic voltammograms were not affected in any way, and no
oxidation or reduction peak were obtained.
It was therefore concluded that modified and unmodified glassy-carbon electrodes
were not suitable electrode material for the determination of glutathione by square
wave cyclic voltammetry.
2.5.3 Results obtained at the ultra-trace epoxy-graphite rotating disc
electrode
Cyclic voltammograms of 2 x 10‘2 mol.l*1 citrate buffer pH 3, 6 x 10'2 mol.l'1
oxidised glutathione (GSSG) and finally 6 x 10'2 mol.l"1 reduced glutathione
(GSH) were obtained between - 1.0 to + 1.0 V vs. Ag-AgCl at the ultra-trace
RDE (Figure 2.18).
Figure 2.18 Cyclic voltammograms of a) 10"2 mol.T1 citrate buffer pH 3.0 b) 10'2 mol.l'1 citrate buffer pH 3.0 + 6 x 10"2 mol.l'1 reduced glutathione at the ultratrace epoxy-graphite electrode.
u/v
72
No oxidation nor reduction peak were observed for the cyclic voltammetry of the
citrate buffer on its own. The addition of GSSG to the citrate buffer increased the
magnitude of the intensities at - 1.0 and + 1.0 V vs. Ag-AgCl. However, no
reduction peak was obtained as expected in the negative sweep.
A broad oxidation peak of intensity 13 pA is observed in the positive sweep of the
GSH solution at + 0.33 V vs. Ag-AgCl.
2.5.4 Results obtained at the mercury-modified ultra-trace electrode
The cyclic voltammogram obtained for 2 x 10'2 mol.l*1 citrate buffer pH 3.0
(Figure 2.19) shows an oxidation peak at + 0.565 V vs. Ag-AgCl of 16.25 ¿iA
during the positive sweep. On the reverse scan, a large reduction peak is obtained
at + 0.24 V vs. Ag-AgCl (42.5 *iA).
The cyclic voltammogram obtained for the 6 x 10'2 mol.l'1 GSSG solution in
citrate buffer showed a small oxidation peak at + 0.3 Y (6.25 pA) and a small
reduction at + 0.075 V vs. Ag-AgCl (1.25 jiA).
In the same way, an oxidation and a reduction peak were observed at + 0.375 V
vs. Ag-AgCl (17.5 jiA) on the positive sweep and at + 0.14 V (2.5 |xA) for the
cyclic voltammetry of a solution of 6 x 10'2 mol.l-1 GSH in 2 x 10'2 mol.l'1 citrate
buffer.
73
Figure 2.19 Cyclic voltammograms of a) IO"2 mol.1'1 citrate buffer pH 3.0 b) IO'2 mol.1"1 citrate buffer pH 3.0 + 6 x IO"2 mol.1'1 reduced glutathione at the mercury-modified ultra-trace electrode
u/u
This type of electrode cannot effectively be used for the determination of GSH as
GSSG also shows an oxidation peak on the positive sweep (+ 0.3 V and + 0.375
V vs. Ag-AgCl respectively).
2.5.5 Results obtained at the silver rotating disc electrode
The cyclic voltammetric behaviour of the 2 x 10'2 mol.l"1 citrate buffer pH 3.0 was
studied between - 0.7 V and + 0.7 V vs. Ag-AgCl by cyclic voltammetry. No
noticeable oxidation nor reduction peak were obtained in this case.
A reduction peak was observed for the negative sweep of 6 x 10"2 mol.l'1 GSSG at
a potential of + 0.1 V vs. Ag-AgCl (7.80 fiA), which corresponds to its reduction
to GSH (figure 2.20).
74
In the case of 6 x 10'2 mol.l'1 GSH, an oxidation peak is obtained at + 0.32 V vs.
Ag-AgCl while a reduction peak occurs at + 0.185 V. The peak intensities are
difficult to determine in this case, however, the current obtained appeared to be
subsequently larger than for GSSG or the buffer (Figure 2.20).
Figure 2.20 Cyclic voltammograms of a) 10'2 mol.1'1 citrate buffer pH 3.0 b) 10"2 mol.r1 citrate buffer pH 3.0 + 6 x 10‘2 mol.l"1 reduced glutathione at a silver electrode.
From such results, one can conclude that reduced glutathione can be successfully
analysed at the rotating silver electrode.
75
The cyclic voltammogram obtained for the 2 x 10"2 moll"1 citrate buffer pH 3.0
between - 0.7 V and + 1.0 V vs. Ag-AgCl showed a small oxidation peak (6.20
|iA) on the positive sweep at + 0.495 V and a bigger reduction peak (24.65 jiA)
on the negative sweep at + 0.295 V vs. Ag-AgCl (Figure 2.21).
In the case of 6 x 10’2 moll'1 GSSG, the oxidation peak observed on the positive
sweep of the buffer disappears whereas the reduction peak observed on the
negative sweep switches to + 0.67 V vs. Ag-AgCl (30.80 jllA).
The oxidation peak for 6 x 10"2 mol.l'1 GSH was obtained at + 0.78 V vs. Ag-
AgCl (123 nA) in the positive sweep, whereas a reduction peak occurred at -
0.122 V (58.6 |iA) the negative sweep (Figure 2.21).
Figure 2.21 Cyclic voltammograms of a) 10'2 mol.1"1 citrate buffer pH 3.0 b) 10'2 mol.l'1 citrate buffer pH 3.0 + 6 x 10'2 mol.1"1 reduced glutathione at a mercury-gold amalgam electrode.
2.5 .6 R esults obtained at the m ercury-gold am algam rotating disc electrode
This electrode can be successfully investigated for the determination of GSH by
square wave voltammetry as the peak intensity obtained for this later is larger than
for the buffer.
76
2.5 .7 C yclic voltam m etric analysis o f reduced glutathione :
Cyclic voltammetric investigations of the behaviour of reduced glutathione,
oxidised glutathione and the citrate buffer were conducted at a range of different
rotating disc electrodes.
Paradoxically, glassy carbon electrode could not be used successfully, as no
oxidation or reduction could be observed for either GSH or GSSG. Ferrocene
was therefore used as an electron mediator, however unsuccessfully.
The ultra-trace epoxy-graphite electrode rotating disc electrode showed no
reduction nor oxidation for either the buffer nor GSSG. However, GSH showed a
clear and important oxidation peak at + 0.33 V vs. Ag-AgCl. Therefore, this
electrode material could be successfully used for the oxidation of GSH by square
wave voltammetry.
When modified with a mercury film, the epoxy-graphite material shows a higher
background current and therefore is not satisfactory for this type of analysis.
The mercury-gold modified rotating disc electrode showed high oxidation and
reduction peaks for GSH and therefore could be used for the determination of
GSH by square-wave cyclic voltammetry.
The silver material was the last to be investigated and showed an important
difference between the GSH and GSSG, but however could not be of use for the
determination of GSH by square-wave cyclic voltammetry.
77
2 .6 D e ve lo p m e n t o f the im m obilised glutathione s-transferase
re a cto r fo r on-line conjugation o f organochlorine com pounds w ith
G S H
2.6.1 Immobilisation of glutathione s-transferase (GsT) on aminopropyl
porous glass beads :
Glutathione s-transferase, porous amino propyl glass beads (170 and 700 A), glutaraldehyde, Tris(HCl), bovine serum albumin (BSA), l-chloro-2,4-
ethacrynic acid, also containing 2.5 x 10'3 mol.I'1 GSH were prepared in 1 x 10"2
mol.l'1 phosphate buffer pH 7.0.
Each solution was eluted at a flow rate of 2 ml.min-1 through the enzyme reactor
in the following manner : 10 ml of 1 x 10“2 mol.l'1 phosphate buffer pH 7.0 was
eluted to condition the enzyme reactor (the last 5 ml of which were collected),
then by 20 ml of the sample solutions, followed by another 10 ml of the phosphate
buffer (the first 5 ml of which were also collected).
79
In a similar way, each solution was eluted through the blank reactor. The two
sets of solutions obtained (each sample being approximately 30 ml) were studied
qualitatively by UV arid by HPLC.
2.6.2.2 Spectrophotometry
UV spectra were obtained for each samples between 200 and 400 nmona
UV/Visible UV-160A spectrophotomèter (Shimadzu).
Figure 2.22 Ultraviolet/visible spectra of 10'3 mol.l'1 l-chloro-2,4- dinitrobenzene in 2.5 x 10"3 mol.l"1 reduced glutathione in 0.01 mol.l'1 phosphate buffer pH 7.0, a) before and b) after elution through glutathione s-transferase.
+ 2 . 80f t *
Ô . 5 0 8
+ 0 . 6 0 A *
5 0 N K I / D I U . > 4 0 0 . 0
When comparing the spectra obtained for the elution products through the blank
and GsT immobilised reactor, one can notice the appearance of a greater
absorbance at 330 nm in the latest (Figure 2.22). This shows the evidence of a
greater conjugation between CDNB and GSH when eluted and put in contact
with the immobilised glutathione s-transferase than when put in contact with blank
beads. However, it is noticeable that some conjugation is obtained : the enzyme in
fact speeds up the reaction which would occur at a smaller speed when not
catalysed.
80
Figure 2.23- Ultraviôlet/visible spectra of 10'3 moLl'* 2,4-dichloronitrobenzene in 2.5 x 1 0'^mol.l'1 reduced glutathione in 0:01 mol-1"1 phosphate buffer pH 7.0, a) before andb) after elutiôn through glutathione s-transferase.
+ 2 . 0 0 A
-Ô0A2 0 8 - 0
In the case of 2,4-dichloronitrobenzene (DNB), a change in spectra was also
observed upon elution through the enzyme immobilised reactor when compared to
the-blank reactor (Figure. 2:23). These results suggest the evidence that the
conjugation between DNB .and GSH (observed ̂ at. 270 . nm) occurred when in
contact with the enzyme immobilised in the enzyme reactor. In this case no
conjugation product was observed in the elution products from the:blank reactor,
mainly due to the fact that the speed of reaction between DNB arid GSH is lower
than between CDNB and GSH,
However, in the case of ethacrynic acid, no sigriificant change in the spectra
obtained for the elution of GSH/ethacrynic acid through the blank and the enzyme
immobilised reactor could be observed. This suggests that the enzyme reactor
cannot catalyse the conjugation between ethacrynic acid and GSH during their
elution.
81
Figure 2.24 Ultraviolet/visible spectra of 10'3 mol.l"1 ethacrynic acid in 2.5 x 10" 3 mol.1’1 reduced glutathione in 1 x 10"2 mol.1’1 phosphate buffer pH 7.0, a) before and b) after elution through glutathione s-transferase.
+ 2 , 0 8 » *
2.6.3 Quantitative analysis of the conjugation product of CDNB with GSH
byUV:
The conjugation of CDNB with GSH was carried out through the elution
of sample solutions of different concentration in CDNB in the enzyme reactor.
Quantitative analysis was important in this case to determine if the enzyme
immobilised in the reactor reacted to a range of different concentrations of
CDNB.
2.6.3.1 Materials and Method
A set of solutions containing l-chloro-2,4-dinitrobenzene concentrations
of 0, 0.1, 0.2, 0.4, 0.6 and 0.8 x 10'3 mol.1'1 was prepared in 10'2 mol.1'1 Tris.HCl
pH 7.0 / 10'3 mol.1"1 reduced glutathione. A test solution only containing 0.8 x 10'3
mol.1’1 was prepared in 1 x 10'2 mol.1'1 Tris.HCl, pH 7.0.
82
These solutions were eluted at a flow rate of 4 ml.min“1, through the described
glutathione s-transferase enzyme reactor prepared in 2.6.1. The column was
previously conditioned with 10 ml of 1 x 10"2 mol.l'1 Tris.HCl, pH 7.0 buffer (the
last-5 mlofwhich werercollected),. folio wed by 20 ml of the sample (from the set
of solutions prepared above), followed by another 10 ml of buffer (the first 5 ml
of which were also collected). The set of eluted samples was then tested by UV at
330 nm.
2.63.2 Results
The spectra obtained for this calibration can be observed in Figure 2.25.
Figure 2.25 Ultraviolet/visible spectra of the conjugation product of 1-chloro- 2,4-dinitrobenzene (8 x 10"5 mol.l'1 to 4 x 10⁻⁴ mol.l-1) with 10'3 mol.l'1 reduced glutathione,'after elution through the glutathione s-transferase reactor.
d >
From the results observed in Figure 2.25 and the Appendix 2.8, a linear
calibration was be plotted (Figure 2.26), and sensitivity of 2488.8 absorbance.mol'
1.L, intercept and correlation determined (0.9981).
83
Figure 2.26 Linear calibration of the Absorbance @ 330 nm of the conjugation product of l-chloro-2,4-dinitrobenzene (8 x 10"5 mol.l'1 to 4 x 10“4 moll'1) with 10'3 mol“1 reduced glutathione, after elution through the glutathione s-transferase reactor
Absorbance @ 330 nm vs Concentration of CDNB (mol/i) insamples
CDNB concentration (mol/I)
84
2.6.4 Qualitative determination of the conjugation of CDNB product with
GSH by HPLC
2.6.4.1 Materials and Method
The l-chloro-2,4-dinitrobenzene, ethacrynic and 2,4-dichloronitrobenzene
solutions prepared for the qualitative determination of the conjugates obtained
with GSH upon elution were analysed by HPLC.
LC-10 AS, coupled with a SPD-10A ultraviolet/visible detector (Shimadzu).
Column : Allsphere ODS-1 54 (250 mm x 4.6 mm I.D.).
Mobile phase : 49.5:49.5:1 % Methanol : Water : Acetic Acid.
Flow rate : 1 mLinin1.
These solutions were first eluted at a flow rate of 4 ml.min_1 through the
glutathione s-transferase containing enzyme reactor as described previously. The
column was conditioned with 10 ml of 1 x 10'2 mol.I"1 Tris.HCl, pH 7.0 buffer
(the last 5 ml were collected), followed by 20 ml of sample (from the set of
solutions mentioned above), followed by another 10 ml of buffer (the first 5 ml
were also collected).
A set of eluted samples (approximately 30 ml each) was therefore collected and
tested by HPLC (@ 254 and 330 nm).
2.6.4.2 Results
The analysis of the eluate obtained for the solution of CDNB after elution
through the enzyme reactor as described above were compared with the eluate
obtained after elution through a blank reactor.
The chromatograms obtained in Figure 2.27 show that the conjugation of CDNB
with GSH (6.12 minutes) appeared greater after elution through the enzyme
containing reactor than through the blank reactor. However, one can noticed that
85
the analysis of the elution product through the blank reactor showed evidence of
conjugation product.
Figure 2.27 High performance liquid chromatograph of 10"3 mol.l"1 1 -chloro- 2,4-dinitrobenzene with 2.5 x 10‘3 mol.I'1 reduced glutathione in 10‘2 mol.l*1 phosphate buffer pH 7.0 a) before and b) after elution through glutathione s- transferase reactor. Mobile phase : 49.5:49.5:1 % (Me0H:H20:AcC00H).
In a similar way, the elution products obtained for DNB through the blank and
enzyme containing reactors were compared in Figure 2.27. These chromatograms
show the evidence of the conjugation being obtained between GSH and DNB (7.8
minutes) through the enzyme immobilised reactor, rather than in the blank reactor.
;i
86
Figure 2.27 ■ High performance liquid chromatograph of 10"3 moll'1 2,4- dichloronitrobenzene with 2.5 x 10"3 mol.l"1 reduced glutathione in 10'2 mol.l"1 phosphate buffer pH 7.0 a) before and b) after elution through glutathione s- transferase reactor. Mobile phase : 49.5:49.5:1 % (Me0H:H20:AcC00H).
OS"i- <*> in oia>
x k k , CT* ® vO
cu . va rvflj
(a)
m rx. ^v *-< <r>op 03
v£*
The same analysis was carried out for ethacrynic acid, however no change could
be observed after elution through the blank or the enzyme reactor, proving that
the results previously obtained by UV/VIS.
Figure 2.28 High performance liquid chromatograph of 10"3 mol.l"1 ethacrynic acid with 2.5 x 10’3 mol.l’1 reduced glutathione in 10‘2 mol.l'1 phosphate buffer pH7.0 a) before and b) after elution through glutathione s-transferase reactor.Mobile phase : 49.5:49.5:1 % (Me0H:H20:AcC00H).
n S I C O W 1. 0 3 <KI ■* tn ooC *rr • «> w cu ^
. <VJ - . . .sp fs. qc
J V .
87
1.8.
642
2.6.4.3 Q uantitative analysis o f C D N B conjugate w ith G SH by HPLC
2.6.4.3.1 Materials and Method
A set of solutions containing concentrations of 0, 0.1, 0.2, 0.4, 0.6 and 0.8
x 10 ? mol.l'1 1 -chloro-2,4-dinitrobenzene was prepared in a 1 x 10'2 mol.r1
Tris.HCl pH 7.0 / 1 x 10'3 mol.l’1 GSH buffer solution. A test solution only
containing 0.8 x 10 ’ moU1 CDNB was prepared in 1 x 10*2 mol.l'1 Tris.HCl, pH
7.0 buffer. The results obtained can be observed in Appendix 2.9.
2.6.4.3.2 Results
Figure 2.29 Calibration curve obtained for a range of 1-chloro-2,4- d¡nitrobenzene (from 0 to 0.8 x 10 ' mol.l1) in constant concentration of reduced glutathione (1 x 10" mol.l1) after elution through glutathione s-transferase reactor, analysed by high performance liquid chromatography, at 254 nm.Mobile phase : 49.5:49.5:1 % Me0H:H20:AcC00H.
Peak Area of unreacted CDNB (blue) and CDNB/GSH conjugate (pink) @ 264 nm vs. concentration of CDNB in 0.01 M TrisHCI
buffer pH 7.0/1 mM GSH (triplicate)
8 8
2.6 .5 E lectrochem ical investigation o f the conjugation o f C D N B w ith G SH
2.6.5.1 Materials and Method
A 1.5 x 10'3 mol.1"1 solution of GSH in phosphate buffer (1 x 10"2 moll'1,
pH 7.0) was prepared and injected into a flow-through electrochemical cell (BAS
CC-5, Cross-Flow, BAS Technicol) with phosphate buffer as electrolyte. Three
solid electrode materials (gold, glassy carbon and silver) were tested for the
electrochemical determination of GSH at + 0.9 V vs. Ag-AgCl, to experimentally
optimise the analysis.
Another solution containing 1.5 x 10'3 mol.1"1 solution of GSH in phosphate buffer
(1 x 10"2 mol.1"1, pH 7.0) and 1 x 10‘3 mol.1"1 was gravity eluted through the
enzyme reactor developed in 2.6.1. The eluted solution was then also
electrochemically analysed at gold, glassy carbon and silver electrodes (+ 0.9 V
vs. Ag-AgCl).
A set of GSH standards in the concentration range 2 x 10‘3 to 5 x 10"5 mol.1"1 were
also prepared in phosphate buffer, and analysed at + 0.9 V vs. Ag-AgCl at the
glassy carbon electrode.
89
2.6.5.2 Electrochemical oxidations of glutathione at the glassy-carbon, gold
and silver electrode
Figure 2.30 Amperometric oxidation of a 10"3 mol.1'1 1 -chloro-2,4-dinitrobenzene and 1.5 x 10"3 mol.1'1 reduced glutathione in 10'2 moll’1 phosphatebuffer pH 7.0, at + 0.9 V vs. Ag-AgCl, before elution through the aminopropylporous glass beads glutathione s-transferase reactor respectively (triplicate)al) glassy-carbon electrode, a2) enzyme reactor / glassy-carbon,bl) gold electrode, b2) enzyme reactor / gold,cl) silver electrode, c2) enzyme reactor / silver electrode.
LJ(al)
L(a2) (0 1) (t>2) (C1)
One can observed from the results in Appendix 2.10 and the Figure 2.30 that the
differences between each electrode material upon the electrochemical
determination of GSH and the CDNB/GSH conjugate obtained after elution
through the enzyme reactor.
From the results obtained before the elution through the reactor, it can be
concluded that glassy-carbon and gold would be suitable materials for the analysis
of GSH in the flow-cell , with RSD of 1.02 and 1.00 % respectively. The RSD
obtained for the same solution at the silver material showed higher at 2.72 % and
therefore should not be used over the other two types.
After elution of the CDNB and GSH containing solution through the enzyme
reactor, an electrochemical change was observed. The intensity of the peaks
obtained decreased suggesting a change in the chemistry of the solution.
90
This could be due to the formation of a non electrochemical product, which
would yield in the decrease of the total peak area. This non-electrochemical
product could be the conjugation product analysed by UV and HPLC in 2.6.3 and
2.6.4.
The deviation between each material varied greatly this time between glassy-
carbon and silver and gold, RSD being respectively 0.38, 9.76 and 9.85 %.
As a result, glass-carbon was chosen as the material of use for further analysis of
GSH and its conjugate with CDNB.
2.6.5.3 Calibration of glutathione at the glassy-carbon electrode
The calibration of the set of solution containing from 5 x 10'5 to 2 x 10'2
mol.l1 GSH was therefore obtained in Figure 2.31. A calibration curve was then
plotted from the results in Appendix 2.11, yielding in a slope of 1.5 x 10⁹ uV.mol"
1.1, the intercept 741.1, and a correlation factor of 0.9986 (Figure 2.32).
Figure 2.31 Calibration of a set of solution containing from 2 x 10'3 to 5 x 10‘5 mol.l"1 GSH in a 1 x 10"2 mol.l"1 phosphate buffer, pH 7.0, amperometrically analysed at + 0.9 V vs. Ag-AgCl, at a glassy-carbon.
ijt?
91
Peak
Ar
ea
(uV)
Figure 2.32 Calibration was obtained at the glassy carbon electrode for a set of solution containing from 2 x 10'3 to 5 x 10'5 mol.I"1 GSH in a 1 x 10'2 mol.I'1 phosphate buffer, pH 7.0.
Peak Area (uV) vs GSH Concentration (mol I/) + 0.9 V vs Ag- AgCI, at glassy carbon electrode
GSH Concentration (mof/I)
92
2.6.5.4.1 Materials and Method
The bioreactor was placed into a flow-through system as schematised in
Figure 2.33.
2.6 .5 .4 F low -through system
Figure 2.33 Instrumental schematic
4
1 Integrator2 Potentiostat3 Flow-cell/Electro chemical Detector4 Waste
5 Injection valve
6 Sample inlet7 Peristaltic pump8 Electrolyte
A set of solutions consisting of 0, 0.1, 0.2, 0.4, 0.6 and 0.8 x 10‘3 mol.l'1 1-chloro-
2,4-dinitrobenzene were prepared in a 1 x 10’2 mol.l'1 Tris.HCl pH 7.0 containing
1 x 10'3 mol.1'1 GSH.
The solutions were injected through the reactor column at a flow rate of 4 ml.min’
\ as described in 2.6.2, and off-line electrochemical detection followed the elution
through the enzyme reactor at the glassy carbon at + 0.9 V vs. Ag-AgCi. The
results obtained were plotted on the Figure 2.34.
2.6.5.4.2 Results
The results in Appendix 2.12 and the calibration plot in Figure 2.34 show
the evidence that the greater the concentration in CDNB in the solution before
elution, the lower the oxidation in the eluted solutions.
93
The electrochemical compound present in the solutions before elution changes to
a non-electrochemical compound after elution through the bioreactor. This
suggests that the conjugation between CDNB and GSH forms a non-
electrochemical compound.
One can also observed a trend in the decrease, showing a linear relationship
between the increase of the concentration in CDNB and the increase of
conjugation catalysed by the enzyme reactor.
Figure 2.34 Amperometric calibration of solutions of l-chloro-2,4- dinitrobenzene from 0.1 to 0.8 x 10'3 mol.l'1 in 10'3 mol.1'1 reduced glutathione in 10‘3 mol.l'1 Tris.HCl, after elution through the glutathione s-transferase reactor. Determined at a glassy carbon electrode, at + 0.9 V vs. Ag-AgCl.
Peak Areas (uV) vs Concentration of CDNB (mM) in 1 mM GSH, after elution through bioreactor at + 0.9 V vs Ag-
AgCI, at glassy carbon electrode
CDNB Concentration (mM)
94
2.6.S.5 On-line determination of the conjugate
The next step in the development of the analysis of CDNB on-line by
conjugation with GSH, and electrochemical determination at the silver electrode,
was to investigate if adding GSH to the buffer would be possible. The aim of this
step was to determine if a constant signal could be obtained for GSH, which
would be altered upon conjugation with CDNB, which would be directly injected
prior to the enzyme reactor. A Rheodyne Omnifit injection valve with a loop of
1.2 x 10“4 dm3 was used to inject the sets of solutions.
Solutions of l-chloro-2,4-dinitrobenzene from 0.1 to 0.8 x 10"3 mol.l'1 in 10'3
mol.l"1 reduced glutathione in 10'3 mol.l"1 Tris.HCl, were prepared for this
purpose. They were then injected directly through the rheodyne just prior to the
enzyme reactor placed between the injector valve and the electrochemical detector
(Figure 2.33).
This analysis was not feasible due to an increase in the background noise from the
GSH present in the buffer, resulting in electrode fouling, which rendered the flow
cell unusable. The only change observed in the signal was a constant drift towards
zero response due to the fouling or caking of the electrode tip of the
electrochemical detector.
95
2.7 Discussion
As described above, the capacity of the immobilised enzyme to catalyse
the conjugation of 1 -chloro-2,4-dinitrobenzene, 2,4-dichloronitrobenzene and
ethacrynic acid with reduced glutathione was investigated by ultraviolet-visible
spectrophotometry, HPLC and electrochemical detection.
Ultra-violet spectrophotometric analysis
From the spectra obtained, the conjugation of CDNB with GSH catalysed by the
immobilised glutathione-s-transferase was observed in the eluates @ 330 nm. A
much smaller conjugation was observed in the case of 2,4-dichloronitrobenzene @
345 nm.
However, nothing could be observed in the eluate of ethacrynic acid. This could
be due to the highest molar extinction coefficient value Ae (9.6 mM'1.cm'1) of
CDNB over the other two compounds (8.5 and 5.0 x 10'3 mol.I"1.cm'1 for 2,4-
dichloronitrobenzene and ethacrynic respectively), or that the conjugation did not
occur to the same extent.
A linear calibration was obtained for the conjugation of the samples of 1-chloro-
2,4-dinitrobenzene ranging from 8 x 10⁻⁵ mol.I1 to 4 x 10^ mol.l“1 in phosphate
buffer pH 7.0, and in presence of 10'3 mol.l-1 reduced glutathione, after their
elution through the enzyme reactor.
HPLC
For the separation of the above samples by HPLC, a peak was separated for a
solution of 1 x 10'3 moLl1 CDNB and 2.5 x 10‘3 moLl'1 GSH in 1 x 10'2 mol.l'1
phosphate buffer. After 1 day at room temperature, this peak was observed to be
even greater. A peak is clearly obtained for CDNB at 8.488 min, and a second
peak is observed at 6.194 min. However, this peak can’t be accounted for GSH,
which does not absorb at 330 nm. This peak could however be due to the
conjugation between CDNB and GSH. The conjugation of CDNB with GSH can
occur without catalysis, however, glutathione s-transferase speeds up the reaction.
96
The analysis of the same standard solution after elution through the enzyme
reactor showed no peak at 8.488 min, but an increase of the size of the peak at
6.13 min. All the CDNB present in the solution had disappeared, and therefore,
the peak at 6.19 min can be attributed to the conjugate between CDNB and GSH.
Therefore, much greater conjugation was observed when CDNB and GSH were
put in contact with the enzyme, during their elution through the enzyme
immobilised reactor.
In a similar manner, 2,4-dichloronitrobenzene (DNB) eluted at 16.9 min; however
no other peak was observed. After elution through the enzyme reactor, a peak
was obtained at 7.80 min, which would account for the conjugate of DNB with
GSH, as the peak observed at 16.9 min had disappeared.
No conjugation was however observed for ethacrynic acid by HPLC, both
chromatograms displaying peaks at 11.6 min.
UV/VIS and HPLC analyses showed the ability of the glutathione s-transferase
reactor to catalyse the conjugation of 1 -chloro-2,4-dinitrobenzene and 2,4-
dichloronitrobenzene to reduced glutathione under the specified conditions
(2ml.min'1, 1 x 10'2 mol.1'1 phosphate buffer, pH 7.0). However, no evidence was
observed of any conjugation between ethacrynic acid and reduced glutathione.
This was surprising as ethacrynic acid has been extensively used as substrate for
the determination of the activity of glutathione s-transferase.
Quantitative analysis of the CDNB/GSH conjugate by HPLC
The following step in the project was the quantitative investigation by HPLC of
the conjugation between 1-chloro-2,4-dinitrobenzene with reduced glutathione
after elution through the enzyme reactor. A fixed concentration of GSH was
therefore used (1 x 10‘3 mol.f1) and variable amounts of CDNB were eluted
through the enzyme reactor.
97
In this case, the conjugation reaction was carried out at a higher flow rate (4
ml.min“1) in order to speed up the time of analysis.
The conjugation reaction was not complete as some CDNB was still observed in
the eluted samples. Another column was also used in this case, leading in different
retention times. CDNB was eluted at 5 min, and the conjugate at 12.9 min, which
suggests the lower polarity of the conjugate than CDNB. The sets of solutions
were analysed both at 254 nm and 330 nm, the latest showing higher absorbance
and therefore peak area for CDNB and its conjugate with GSH.
It was observed that, with a constant concentration of GSH (1 x 10'3 moll'1), the
increase of CDNB (from 0 to 0.8 x 10'3 mol.I'1) yields in an increase in the
conjugate peak in the eluates.
Electrochemical behaviour of GSH
The electrochemical behaviour of GSH at glassy carbon, gold and silver electrode
was investigated. The gold and glassy carbon electrodes displayed similar
sensitivity towards GSH, while the sensitivity of the silver electrode was lower.
Glassy carbon and gold electrodes also gave more reproducible peak heights with
relative deviation of 1.02 % and 1.00 % respectively, compared to 2.72 % for
silver.
Electrochemical behaviour of the conjugate
Passing the solution of GSH alone, and with CDNB through the enzyme reactor,
prior to injection into the electrochemical flow-cell, resulted in a 33.91 % and
32.96 % decrease in the signal obtained at the glassy carbon and gold electrodes
respectively. However, the decrease observed at the silver electrode was only
6.21 %. High sensitivity towards GSH at the working electrode is sought to
detect the smallest amounts of conjugation between GSH and CDNB. The highest
sensitivity of glassy carbon and gold materials towards GSH, as well as their
reproducibility (1.02 and 1.00 % respectively), compared to those attained with
the silver material, induced the choice of glassy carbon electrode over silver.
Glassy carbon was chosen over gold for its ease of cleaning. The determination of
98
GSH at the glassy-carbon was then investigated, and a linear calibration obtained
between 5 x 10'5 to 2 x 10'3 moU"1.
Quantification o f the conjugate
The determination of the conjugation of CDNB (0 to 0.8 x 10'3 mol I"1) with GSH
(1 x 10"3 mol I“1) was monitored after the enzyme reactor by spectrophotometry
(i.e. the determination of the conjugate at 330 nm) and by electrochemistry at a
glassy carbon at + 0.9 V vs. Ag-AgCl.
However, CDNB nor its complex with GSH possess any electrochemical
properties at + 0.9 V vs. Ag-AgCl, so that changes in GSH concentrations must
be monitored. By setting a constant concentration of GSH (1 x 10‘3 mol I*1) in the
set of solutions, and varying the concentration of CDNB (from 0 to 0.8 x 10‘3 mol
I-1), CDNB could be determined as a decrease in the signal given off from GSH.
The samples obtained from the elution of the standards through the enzyme
reactor were monitored off-line through the electrochemical cell, at a glassy
carbon electrode. The higher the CDNB concentration in an excess GSH (10‘3
mol I'1), the lower the peak area of the oxidation peak obtained at the glassy
carbon electrode. These results were plotted and a linear calibration in the
concentration range from 0 and 0.8 x 10'3 mol I'1 was obtained, with a correlation
coefficient r2 of 0.9581, and a sensitivity of -5 x 10⁴ mol'11.
The linear relationship between the decrease of the peak area obtained with an
increase of the CDNB concentration could be accounted for the increase in the
complexation catalysed by the immobilised beads. These results suggest the
possibility of using immobilised glutathione s-transferase sensors for the
determination of CDNB by electrochemistry.
Direct on-line determination of the conjugation product between CDNB and
GSH, as catalysed by immobilised GsT present in the reactor, was investigated.
However, no significant change in the background signal could be observed. This
99
could be due to the band broadening of the compounds through the column
during the elution.
The same problem was encountered when injecting CDNB on its own, with GSH
present in the mobile phase. This was due to the fouling of the electrode occurring
rapidly after elution, which was due to the formation of layer of decomposition
compounds arising from the oxidation of GSH.
Another project should therefore focus on the development of disposable screen-
printed carbon-paste or glassy-carbon electrode, modified by a fixed
concentration of glutathione s-transferase and reduced glutathione.
100
C H A P T E R 3 .0
CONCLUSION
101
The undertaken project aimed at the development of sensing systems for
environmental monitoring. This was split between the development of a sensing
system for the determination of chromium (+VI) and the development of a sensing
system for 1 -chloro-2,4-dinitrobenzene. Both parts of the projects were
introduced through extensive literature reviews covering the essential research
and theoretical research carried out up to now.
The electrochemical investigation of the conjugation product between 1,5-
diphenylcarbazide and chromium (+VI) was carried out at an epoxy-graphite,
chemically-modified carbon-paste and over-oxidised polypyrrole gold electrode.
Cyclic voltammetric study of the conjugate was obtained at the epoxy-graphite
electrode, and quantitative analysis by cathodic adsorptive voltammetry was
obtained for solutions as low as 1 ug.l'1 in chromium (+VI). The method
investigated was based on an application study carried out by the supplier of the
polarograph, and qualitative and quantitative results were obtained.
The electrochemical determination of chromium (III) was also investigated at the
dropping mercury, between 1 to 100 mg.l"1.
Of all the types of electrode materials investigated, ultra-trace graphite material
proved to the best, because it allowed fast and sensitive determination of
hexavalent chromium (down to 1 ug.l-1).
For trivalent chromium, adsorptive differential pulse voltammetry (AdSV) at the
dropping mercury electrode was found to be the better option. However, this
analysis suffered from lower detection limits than the electrochemical method
developed for hexavalent chromium.
A very important part of the research was that both methods of analysis allow for
speciation of trivalent and hexavalent chromium. This should be used in order to
differentiate the hexavalent form, which represents the most threat to health and
environment, from the trivalent form, which doesn’t.
Future work on this part of the project should focus on the development of an
1,5-diphenylcarbazide modified screen-printed disposable electrode. The
102
feasibility of using this sensor for the determination of hexavalent chromium
should be investigated in depth.
The second part of the project focused on the investigation of the use of
glutathione s-transferase (GsT) for the development of an enzyme reactor,
capable of determining organochlorine compounds. This enzyme is commonly
used for the catalysis of substrates such as 1-chloro-2,4-dinitrobenzene,
ethacrynic acid, and 2,4-dichloronitrobenzene, with reduced glutathione (GSH).
The objective was to immobilise this enzyme and pack it into a reactor to develop
an enzyme reactor. The capacity of this reactor was thoroughly investigated and
its capacity to catalyse the conjugation of the 3 substrates with GSH determined.
This was obtained by Ultra-violet and visible spectrophotometry, as well as high-
performance liquid chromatography, and electrochemistry, for the three
substrates. The reactor was shown to be capable of catalysing the conjugation of
1-chloro-2,4-dinitrobenzene and 2,4-dichloronitrobenzene with GSH. However, it
was not capable of catalysing the reaction between ethacrynic acid with GSH.
This was probably due to its lower molar extinction coefficient when compared to
the other two substrates, hence inducing a longer conjugation.
Quantitation by UV/Vis and HPLC were successfully obtained for the conjugation
between 1-chloro-2,4-dinitrobenzene and GSH obtained upon their elution
through the GsT immobilised reactor.
The ' electrochemical behaviour of reduced glutathione was investigated at
different chemically-modified and un-modified substrates such as gold, silver,
glassy-carbon and carbon-paste. Cyclic voltammetry was carried out to determine
the electrode material which would optimal electroanalytical parameters for the
determination of GSH.
Of all the electrode materials investigated for the determination of reduced
glutathione (glassy-carbon, silver and gold), the results obtained for the glassy-
carbon material proved to better than for the others, and was therefore preferred.
103
In a similar way, the electrochemical of a GSH solution was monitored before and
after conjugation with GsT, obtained upon elution through the enzyme containing
reactor. Of the three different electrode materials examined for the determination
of the product of the conjugation between reduced glutathione and 1 -chloro-2,4-
dinitrobenzene, glassy-carbon showed better sensitivity and repeatability.
The quantitative conjugation between reduced glutathione and 1-chloro-2,4-
dinitrobenzene was electrochemically investigated at the glassy-carbon electrode,
and a decrease of the signal upon conjugation was obtained. This is due to the
lack of electrochemical nature of the conjugation product, as catalysed by the
immobilised glutathione s-transferase. This proved that the immobilisation process
as described in the project, can be successfully carried out for the development of
an enzyme sensing system, capable of the determination of 1-chloro-2,4-
dinitrobenzene.
From the qualitative results obtained, one can suggests that the developed enzyme
reactor should be capable of catalysing the conjugation between reduced
glutathione and 2,4-dichlorobenzene, but not for ethacrynic acid.
To determine the feasibility of using the developed sensing system for the
determination of other organochlorine compounds one would need to investigate
thoroughly the electrochemical properties of DNB and its conjugate with GSH,
which was not carried out during the project. Ethacrynic acid did not show any
conjugation properties with reduced glutathione upon elution through the enzyme
immobilised sensing reactor.
A wider electrochemical investigation would need to be carried out to determine
if changing characteristics such as the pH and concentration of the buffer, could
allow such a conjugation to take place.
Future work on a similar project should also focus on the development of
disposable GsT and GSH immobilised carbon-paste sensors, for the determination
of l-chloro-2,4-dinitrobenzene and may be 2,4-dichloronitrobenzene
104
REFERENCES :
[1] McArdle F. (1996), Modem Electroanalytical Techniques - Electrochemical i Sensors. ESF Training of Trainers, Sligo RTC.[2] Edelman P.G. (1992), Wang J., Biosensors & Chemical Sensors - Optimizing Performance through Polymeric Materials.[3] Aboul-Enein H.Y., Raluca-Ioana S., van Staden J.F. (1999), Chemi- luminescence-based (Bio)Sensors - An Overview, Critical Reviews in Analytical Chemistry, 29 (4), 323-331.[4] Quinto M., Losito I., Palmisano F., Zambonin C.G. (2000), Disposable interference-free glucose biosensor based on electropolymerised poly(pyrrole) permselective film, Analytica ChimicaActa, 420 (1), 9-17.[5] Yang Y., Zhang S.F., Kingston M.A., Jones G., Wright G., Spencer S.A. (2000), Glucose sensor with improved haemocompability, Biosensors & Bioelectronics, 15 (5-6), 221-227.[6] Wu J., Suls J., Sansen W. (1999), Amperometric glucose sensor with enzyme covalently immobilised by sol-gel technology, Analytical Sciences, 15 (10), 1029- 1032.[7] Lee C.H., Seo H.I., Lee Y.C, Cho B.W., Jeong H , Sohn B.K. (2000), All solid type ISFET glucose sensor with fast response and high sensitivity characteristics, Sensors & Actuators, B64 (1-3), 37-41.[8] Sugwama K., Takano T., Tanaka S. (2000), Glucose sensing by a carbon-paste electrode containing chitin modified with glucose oxidase, Journal of Electroanalytical Chemistry, 482 (1), 81.[9] Deshande M.V., Hall E.A.H. (1990), Electrochemically grown polymer as an immobilisation matrix for whole cells : Application in an amperometric dopamine sensor, Biosensors and Bioelectronics, 5 (6), 431-448.[10] Kalvoda R. (2000). Environmental Electroanalytical Chemistry. Contemporary trends and Prospects. Critical Reviews in An. Chem., 30 (1), 31- 35.[11] (2000). Process Control, Food processing, 61 (1), 66.[12] (2000). Magnetorestrictive sensor technology proven in process applications, Oil and gas journals 98 (21), 77.[13] BAS Technicol, W. Lafayette, USA.[14] Heyrovsky J. (1922), Chem. Listy, 16, 256.[15] McGraw, Hill, Dictionnary of Scientific and Technical Terms, 4rth Edition, Paker.[16] Bard A.J., Zoski C.G. (2000), Voltametry Retrospective, Analytical Chemistry, 346A-352A.[17] Muller-Ackermann E., Panne U., Niessner R., A fiber optic sensor array for the fluorometric detection of heavy metals. Analytical Methods and Instrumentation, 2 (4), 182-189, 1995.[18] Niessner R. (1991), Chemical sensors for environmental analysis. Trends in Analytical Chemistry, 10 (10).[19] Miller-Ihli N.J. (1992), Hazardous metals I the environment. Techniques and instrumentation in analytical chemistry, Stoeppler M., 12.[20] Ashley K. (1994), Electroanalytical applications in occupational and environmental health, Electroanalysis, 6, 805-820.
105
[21] Tercier M.L., Buffle J. (1993), In situ voltammetric measurements in natural waters : future prospects and challenges, Electroanalyis, 5, 187-200.[22] Brainina K., Neyman E. (1993), Electroanalytical stripping methods, A series of monographs on analytical chemistry and its applications, 126.[23] Paneli M.G., Voulgaropoulos A. (1993), Applications of adsorptive stripping voltammetry in the determination of trace and ultra-trace metals, Electroanalysis, 5, 355-373.[24] Van den Berg C.M.G. (1991), Potentials and potentialities of cathodic stripping voltammetry of trace elements in natural waters, Analytica-Chimica Acta, 250, 265-276.[25] Correia dos Santos M.M. (1996), Simoes Goncalves M.L., Capelo S., Cadmium and lead coplexation by anodic stripping voltammetry with a mercury microelectrode, Electroanalysis, 8 (2), 178-182.[26] Romanus A., Muller H., Kirsch D. (1991), Applications of adsorptive stripping voltammetry (AdSV) for the analysis of trace metals in brine, Fresenius Journal of Analytical Chemistry, 340, 363-370.[27] Torrance K., Gatford C. (1987), Determination of soluble chromium in simulated PWR coolant by differential-pulse adsorptive stripping voltammetry, Talanta, 34(11), 939-944.[28]Golimowski J., Valenta P., Nürnberg H.W. (1985), Trace determination of chromium in various water types by adsorption differential pulse voltammetry, Fresenius Journal of Analytical Chemistry, 322, 315-322.[29] Eguiarte I., Alonso R.M., Jimenez R.M. (1996), Determination of total arsenic by differential-pulse voltammetry, Analyst, 121, 1835-1838.[30] Whitney L.M., Hynes M.J. (1997), Determination of lead leaching from crystal glass by square wave stripping voltammetry, Current Separations, 16 (3), 75-77.[31] Perez-Pena J., Hemadez-Brito J.J., Herrera-Melian J.A., Collado-Sanchez C., Van den Berg C.M.G. (1994), High-performance adsorptive cathodic stripping voltammetry of nickel and cobalt in seawater, Electroanalysis, 6, 1069-1076.[32] Brainina K.Z., Malakhova N.A., Stojko N.Y. (2000), Stripping voltammetry in environmental and food analysis, Fresenius J. An. Chem, 368, 307-325.[33] Adams N.R. (1958), Analytical Chemistry, 36, 241.[34] Paniagua A.R., Vasquez M.D., Tascon M.L., Banatero P.S. (1993), Determination of chromium(VI) and chromium(III) by using a diphenylcarbazide- modified carbon-paste electrode, Electroanalysis, 5 (2), 155-163.[35] Kalcher K. (1990), Chemically modified carbon paste electrodes in voltammetric analysis, Electroanalysis, 2, 419-433.[36] Brainina K.J., Bond A.M. (1995), Characterization of thick-layer graphite disposable voltammetric electrodes, Analytical Chemistry, 67, 2586-2591.[37] Hart J.P., Wring S.A. (1997), Recent developments in the design and application of screen-printed electrochemical sensors for medical, environmental and industrial analysis, Trends in Analytical Chemistry, 16 (2).[38] Kalcher K., Kauffinann J.M., Wang J., Svancara I., Vytras K. (1995), Sensors based on carbon paste in electrochemical analysis : A review with particular emphasis on the period 1990-1993, Electroanalysis, 7(1), 5-22.
106
[39] Baldwin R.P., Christiensen J.K., Kryger L. (1986), Voltammetric determination of traces of nickel (II) at a chemically-modified electrode based on dimethylglyoxime-containing carbon-paste, Analytical Chemistry, 58. 1790.[40] Thomsen K.N., Kryger L., Christiensen J.K. (1988), Voltammetric determination of traces of nickel (II) with a medium exchange flow dimethylglyoxime, Analytical chemistry, 60, 151.[41] Malakhova N.A., Popkova G.N., Wittmann G., Kalnichevskaia, Brianina K.J. (1996), Anodic stripping voltammetry of tungsten at graphite electrodes, Electroanalysis, 8 (4), 375-380.[42] Scanvara I., Vytras K., Hua C.? Smyth M.R. (1992), Voltammteric determination of mercury (II) at a carbon-paste electrode in aqueous solutions containing tetraphenylborate ion, Talanta, 39 (4), 391-396.[43] Rocha M.M.G.S., Neto M.M.P.M., Torres M.O., de Varennes A. (1997), Square-wave adsorptive stripping voltammetry of nickel (II) in flowing systems at a wall-jet mercury film electrode plated in situ, Electroanalysis, 9 (2).[44] Tsymbal M.V., Tuijan I.Y., Temerdashev Z.A., Brianina K.J. (1994), Crown ethers in stripping voltammetry of palladium, Electroanalysis, 6,113-117.[45] Labuda J., Vanickova M. (1993), The effect of complexation equilibria on the response of chemically modified electrodes for the determination of silver, Electroanalysis, 5, 141 -144.[46] Stadlober M., Kalcher K , Raber G. (1997), Anodic stripping voltammetric determination of vanadium (V) using a carbon-paste electrode modified in situ with ceryltrimethylammonium bromide, Electroanalysis, 9 (3), 225-230.[47] Wang C., Li H. (1998), Voltammetric behavior of mercury (1,11) ions at an amide-functionalized humic acids modified carbon-paste electrode, Electroanalysis, 10 (1), 44-49.[48] Wring S.A., Hart J.P., Bracey L., Birch B. (1990), Development of screen- printed carbon electrodes, chemically modified with cobalt phtalocyanine, for electrochemical sensor applications, Analytica ChimicaActa, 231, 203-212.[49] Ulakhovich N.A., Shaidarova L.G., Medyantseva E.P., El-Gakhri M.A. (1996), Electroactive carbon-paste electrode for use in analysis o f chromium (III), Industrial Laboratory, 62 (9), 542-544.[50] Wang J., Naser N. (1995), Modified carbon-wax composite electrode, Analytica Chimica Acta, 316, 253-259.[51] Brainina K.Z. (1995), Sensors and sample preparation in stripping voltammetry, Analytica Chimica Acta, 305, 146-153.[52] Bott A.W. (1997), Practical problems in voltammetry : preparation of working electrodes, Current Separations, 16 (3), 79-83.[53] Economou A., Fielden P.R. (1993), Simultaneous determination of nickel (II) and cobalt (II) by square-wave adsorptive voltammetry on a rotating disc mercury film electrode, Analyst, 118, 47-51.[54] Economou A., Fielden P.R. (1993), Adsorptive stripping voltammetry on mercury film electrodes in the presence of surfactants, Analyst, 118, 47-51.[55] Sun B., Fitch P.G. (1997), Nitrate ion-selective sensor based on electrochemically prepared conducting polypyrrole films, Electroanalysis, 9 (6).[56] Ramirez M.T., Morales-Perez A., Rojas-Hemandez A., Gonzales I. (1996), Electrochemical study of 1,5-diphenylcarbazide and 1,5-diphenylcarbazone in 0.3M HC104, Journatl o f Electroanalytical Chemistry, 410, 203-212.
107
[57] Limson J.. Nyokong T. (1997), Voltammetric behavior of cysteine and metalothionein on cobalt(II) tetrasulfonated phtalocyanine modified glassy carbon electrodes, Electroanalysis, 9 (3).[58] Jayaratna H.G. (1997), Determination of trace mercury(Hg(II)) by anodic stripping voltammetry, Current Separations, 16 (3).[59] Zhang G.H., Wallace G.G. (1992), Use of overoxidised polypyrrole as a chromium (VI) sensor, Analytical Letters, 25 (3), 429-441.[60] Turyan I., Mandler D. (1997), Selective determination Cr(VI) by a selfassembled monolayer-based electrode, Analytical Chemistry, 69, 894-897.[61] Artigan D.W.M, Lowens M.J. (1998), Studies of the application of overoxidised polypyrrole films in anodic stripping voltammetry, Analytical Communications, 35, 61-62.[62] Wang J., Tian B. (1992), Screen-printing voltammetric/potentiometric electrodes for decentralized testing of trace lead, Analytical Chemistry, 64, 1706- 1709.[63] Wang J. (1994), Decentralized electrochemical monitoring of trace metals : from disposable strips to remote electrodes - Plenary Lecture, Analyst, 119.[64] Wang J., Pamidi P.V.A. (1997), Sol-Gel derived gold composite electrodes, Analytical Chemistry, 69, 4490-4494.[65] Valcarcel M., Luque de Castro M.D. (1987), Ellis Horwood Ltd, John Wiley & Sons.[66] Ruzicka J., Hansen E.H. (2000), Flow Injection Analysis, Analytical Chemistry, 212A-217A.[67] Os W. (2000), Fiber-Optical chemical sensors and biosensors, Analytical Chemistry, 72 (12), 81R-89R.[68] Malakhova N.A., Chernysheva A.V., Brainina K.Z. (1991), Adsorptive stripping voltammetry of chromium 1,5-diphenylcarbazonate, Electroanalysis, 3, 803-814.[69] Malakhova N.A., Chernysheva A.V., Brainina K.Z. (1991), Adsorption and electrochemical transformations of diphenylcarbazide and diphenylcarbazone on graphite electrodes, Electroanalysis, 3, 691-698.[70] Bond AM. (1980), Modem Polarographic Methods in Analytical Chemistry.[71] Chromium at Ultra-Trace Graphite Electrode by cathodic stripping voltammetry, Metrohm Application Bulletin No 243/le.[72] (1997), UNEP POPs, United Nations Environment Programme, Vancouver 1995, ATSDR.[73] ‘List of 129 chemicals’, 76/464/EEC directive.[74] (2001), Bioaccumulation of persistent organic pollutants in Lichen - Caribou - Wolf food chains of Canada’s central and western arctic, Environmental Science and Technology, 35 (2), 325.[75]. (2000), United Rations expands research into persistent organic pollutants, Water Environmental an$ Technology, 12(11), 17.[76] (2000), Persistent organic pollutants, Chemical and Engineering News, 78(48), 15.[77] Bras I., Santos L., Alves A. (2000), Monitoring organochlorine pesticides from the landfill leachates by gas chromatography electron-capture detection after solid-phase microextraction, Journal o f Chromatography -A, 891 (2), 305-311.[78] Drinking Water Directive, 80/778/EEC.
108
[79] World Health Organisation web site, www.who.org[80] Correta M., Delerue-Matos C. (2000), Alves A., Multi-residue methodology for pesticide screening in wines, Journal of Chromatography -A, 889 (1-2), 59- 67.[81] (1982), Environment Monitoring and Support Laboratory Test Method for organic chemical analysis of municipal and industrial wastewater, Method No 608 and 625, Cincinnati, OH, US Environmental Protection Agency.[82] (1978), Environment Monitoring and Support Laboratory Test Method for organochlorine pesticides in drinking water. Methods for organochlorine pesticides and chlorophenoxy acid herbicides in drinking water and raw source water. Interim report July 1978, Cincinnati, OH, US Environmental Protection Agency.[83] Mastovska K., Majslova J., Kocourev V. (2001), Fast temperature programming in routine analysis of multiple pesticide residues in food matrices, Journal o f Chromatography A., 907 (1/2), 235.[84] Valcerde A. (2000), Chromatographic pesticide residue analysis, Introduction, Journal o f aoac International, 83 (3), 679.[85] Hada M., Takino M., Yamaguchi K.(2000), Trace analysis of pesticide residues in water by high-speed narrow-bore capillary gas-chromatography - mass spectrometry with programmable temperature vaporizer, Journal o f Chromatography A., 874 (1), 81.[86] Walker A.E., Holman R.E., Leidy R.B. (2000), ELISA and GC/MS analyses of pesticide residues in north Carolina, Journal o f the american water resources associate, 36 (1), 67.[87] USA EPA Methods No 505, 506, 507, 515.2, 608, 8080.[88] Volante M., Pontello M, Colzani L. (2000), Application of solid-phase microextraction (SPME) to the analysis of pesticide residues in vegetables, Pest Management Science, 56 (6/8).[89] Hogendoom E., Van Zoonen P. (2000), Recent and future development of liquid chromatography in pesticide trace analysis, Journal o f Chromatography A., 892(112), 435.[90] Katsoudas E., Abdelmesseh H.H. (2000), Enzyme inhibition and enzyme- linked immuno-sorbent assay methods for carbamate reisude analysis in fresh products, Journal of food protection, 63 (12), 1758.[91] (1993), Evaluation of ELISA for the multi-analytes analysis of s-triazines in pesticide waste and rinsate, Journal o f Agricultural and Food Chemistry, 41 (2), 322.[92] Byfield M.P., Abuknesha R.A. (1994), Biochemical aspects of biosensors, Biosensors & Bioelectronics, 9 , 373-400.[93] (1985), Immobilised cells and enzymes : A practical approach, Ed. J. Woodward, IRL Press Ltd.[94] Stryer L. (1988), Biochemistry, Illrd Edition, W.H. Freeman and Company, New York.[95] Mairesse-Ducarmois C.A., Patriarche G.J., Vandelbalck J.L. (1975), Contribution à P électrochimie des thiols et des disulphures - Partie II : Polarographie D.C., AC. et impulsionnelle différentielle du glutathion, Analytica- Chimica Acta, 76, 199-308.
[96] Le Gall A.C., Van den Berg C.M.G. (1993), Cathodic stripping of glutathione in natural waters, Analyst, 118,1411-1415,[97] Jin W., Wang Y. (1997), Capillary Zone Electrophoresis with end-column amperometric detection for the determination of glutathione at a gold/mercury amalgam microelectrode without deoxigenation, Analytica-Chimica Acta, 343, 231-239.[98] Wring S.A., Hart, J.P., Birch B.J. (1989), Development of an improved carbon electrode chemically modified with cobalt phtalocyanine as are-usable sensor for glutathione, Analyst, 114, 1563-1570.[99] Cox A.J., Gray T J. (1990), Flow-Injection of cysteine and glutathione at an electrode modified with a ruthenium containing inorganic film, Electroanalysis, 2, 107-111.[100] Satoh I., Arakawa S., Okamoto A. (1988), Flow-Injection determination of glutathione with amperometric monitoring of the enzymatic reaction, Analytica Chimica Acta, Short Communication, 214, 415-419.[101] Hou W.5 Wang E. (1991), Liquid chromatography with electrocatalytic detection of cysteine, N-acetylcysteine and glutathione by a prussian blue film- modified electrode, J. Electroanalytical Chemistry, 316, 155-163,[102] Wring S.A., Hart J.P.,Birch B.J. (1991), Voltammetric behaviour of screen- printed electrodes, chemically modified with selected mediators, and their application as sensors for the determination of reduced glutathione, Analyst, 116, 123-129.[103] Shimabukuro R.H., Frear D.S., Swanson H.R., Walsh W.C. (1971), Glutathione Conjugation - An enzymatic Basis for Atrazine resistance in com, Plant Physiology, 47,10-14.[104] Mozer T.J., Tiemeier D.C., Jarowski E.G. (1983), Purification and characterization of com glutathione s-transferase, Biochemistry, 22, 1068-1072.[105] Jung U., Cho Y.S., Seong H.M., Kim S.J., Kim Y.C., Chung A.S. (1996), Characterization of a novel glutathione s-transferase from pseudomonas sp. DJ77, Journal o f Biochemistry and Molecular Biology, 29 (2).[106] Field J.A., Thurman E.M. (1996), Glutathione conjugation and contaminant transformation - Critical Review, Environmental Science & Technology, 30 (5), 1413-1418.[107] Kenneth A.H. (1990), The biochemistry and uses of pesticides. Structure, metabolism, Mode of action and uses in crop protection, Ilnd Edition, MacMillan.[108] Spichiger-Keller U.E. (1998). Chemical sensors and biosensors for medical and biological applications, Wiley.
110
A P P E N D I C E S
111
Appendix 1.1
Absorbance at 254 nm vs Concentration o f Chromium(VI) in diphenylcarbazide.