SHRP-A-685 Development of SHRP Asphalt Research Program Climatic Databases Mansour Solaimanian The University of Texas Austin, Texas Strategic Highway Research Program National Research Council Washington, D.C. 1994
Transcript
SHRP-A-685
Development of SHRPAsphalt Research Program
Climatic Databases
Mansour SolaimanianThe University of Texas
Austin, Texas
Strategic Highway Research ProgramNational Research Council
Washington, D.C. 1994
SHRP-A-685
Contract A-001Product no. 1012
Program Manager: Edward T. HarriganProject Manager: Edward T. HarriganProgram Area Secretary: Juliet NarsiahProduction Editor: Katharyn L. Bine
April 1994
key words:
air temperatureasphalt cement concreteclimatic database
pavement performance
pavement temperature
Strategic Highway Research ProgramNational Research Council2101 Constitution Avenue N.W.
Washington, DC 20418
(202) 334-3774
The publication of this report does not necessarily indicate approval or endorsement by the National Academy of
Sciences, the United States Government, or the American Association of State Highway and TransportationOfficials or its member states of the findings, opinions, conclusions, or rec,ommendations either inferred orspecifically expressed herein.
The research described herein was supported by the Strategic Highway Research Program(SHRP). SHRP is a unit of the National Research Council that was authorized by section 128of the Surface Transportation and Uniform Relocation Assistance Act of 1987.
iii
Contents
Abstract .................................................. vii
Development of Databases ........................................ 1I. The Summary Database ........................................ 1
Database Elements and Structure .................................... 2
The Lowest Air Temperature .................................. 2The Highest Seven-Day Averaged DailyHigh Air Temperature ...................................... 3Other Database Parameters ................................... 5
Seven-day Averaged Maximum TemperatureVersus Monthly Averaged Maximum Temperature .................... 5
II. The Daily Temperature Database .................................. 6Database Elements and Structure ............................... 7
Ten-Year Period Daily Temperature Files .......................... 7Annual Averaged Daily Temperature Files ......................... 7Selection of Weather Stations ................................. 7
Temperature Intervals and Binder Specification ........................... 8
Appendix A. Contents of the summary database and examples of the contents ....... 13
Appendix B. Distribution of the lowest temperature of the year andaverage daily maximum temperature for some major cities in the United States . . 21
Appendix C. Average seven-day maximum temperature versus average monthlymaximum temperature for different regions and some example cities ........ 35
Appendix D. Documentation for climatic databases ........................ 45
V
Abstract
This report describes the development of two climatic databases for use in performanceprediction models. The summary weather database includes a number of statistical parameterson seven-day maximum air temperatures and lowest annual temperatures for over 6,000weather stations in the United States and about 1,800 weather stations in Canada. The dailytemperature database contains the maximum and minimum daily temperature data for tenyears and the average annual maximum and minimum daily temperatures for each station.The percent coverage of the United States for different temperature intervals is presented. Ananalysis of the average seven-day maximum air temperature versus the average monthlymaximum temperature is included.
vii
Executive Summary
One of the important goals of the asphalt research program of the Strategic HighwayResearch Program was to develop a series of performance-based specifications and designsystems. As part of the program, a series of climatic databases was created. These databasesare divided into two categories: summary weather data; and daily temperature data. Theformer includes a number of statistical parameters on seven-day maximum air temperaturesand lowest annual temperatures for over 6,000 weather stations in the United States andabout 1800 weather stations in Canada. The weather data from this database is used in
calculation of the pavement temperature as well as selection of the appropriate binder grade.The latter database includes the maximum and minimum daily temperature data for ten yearsas well as the average annual maximum and minimum daily temperatures for each station.The data from this database is used as input for performance prediction models. In addition,the percent coverage of the United States for different temperature intervals is presented. Ananalysis is also included on comparison of the average seven-day maximum air temperatureversus the average monthly maximum temperature.
ix
Introduction
One of the important goals of the asphalt research program of the Strategic HighwayResearch Program was to develop a series of performance-based specifications and designsystems. The environmental conditions are very diverse, and research has shown that theseconditions significantly influence pavement performance. Therefore, the effect of climaticfactors is incorporated into the specifications and asphalt mix design system developed bySHRP.
SHRP created a number of environmental databases for both the development of
specifications and the prediction of pavement performance. Efforts were made to identify theenvironmental parameters required for this purpose. Two databases were created for theSuperpave mix design system.
Development of Databases
Historical weather data can be used to predict weather patterns. For this reason, such datawere used to create required databases. Two environmental databases were developed: theSummary Database and the Daily Temperature Database. The first attempt was to identifythe climatic parameters required for each database. The former database is to be used inconjunction with selection of the appropriate binder grade for a particular site and also inconjunction with the test criteria that need to be satisfied for both binder and mixture. Thelatter database includes parameters for use in conjunction with the performance predictionmodels under the Superpave system.
The minimum and maximum pavement temperatures are determined in the Superpave systemusing the minimum and maximum air temperatures provided in the database for eachlocation. The results are used to select the appropriate binder grade to resist low temperaturecracking and permanent deformation.
The Summary Database
Once climatic elements were identified, Earthlrtfo Inc. of Boulder, Co was designated to
develop the database. The data were computed, customized, and retrieved from four compactdisks covering weather data provided by National Climatic Data Center (NCDC) for over15,000 stations in the United States. For Canada, data from approximately 6700 stationswere used. The documentation provided by EarthInfo for both the United States and Canadaclimatic databases are presented in Appendix D.
Database Elements and Structure
The data files were created both in ASCII and dBase III formats. The entries for the main
database include stations with more than twenty years of data (total of approximately 6000for the United States and 1,800 for Canada). However, another database was created forweather stations with fewer than twenty years of data just in case there is demand for thisdata due to unanticipated situations. The geographic data attributes for each station (state,county, longitude, latitude and elevation) are included in the database. The U.S. databaseincludes 45 fields as outlined in Appendix A. The Canada database has similar data with the
addition of snow data (total of 52 fields). Some examples are also given in Appendix A forcontents of the database fields. Stations with very strange temperature values (about 30stations) and stations with missing values for latitude (about 10 stations) were removed fromthe database.
The Superpave database uses 10 of the available 45 parameters: state, county, station name,longitude, latitude, elevation, average lowest air temperature, standard deviation for thelowest air temperature, average highest seven-day maximum air temperature, and standarddeviation for the average highest seven-day maximum air temperature. These temperaturesare used to determine the minimum and maximum pavement _.emperatures.
The lowest pavement temperature and the highest 7-day averaged daily high pavementtemperature are used in selection of the appropriate binder to resist low temperature crackingand permanent deformation, respectively. The lowest air temperature can be directly tied intothe lowest pavement temperature, and highest 7-day averaged daily high air temperature canbe used to estimate maximum pavement temperature once the latitude of the site is known.
The Lowest Temperature
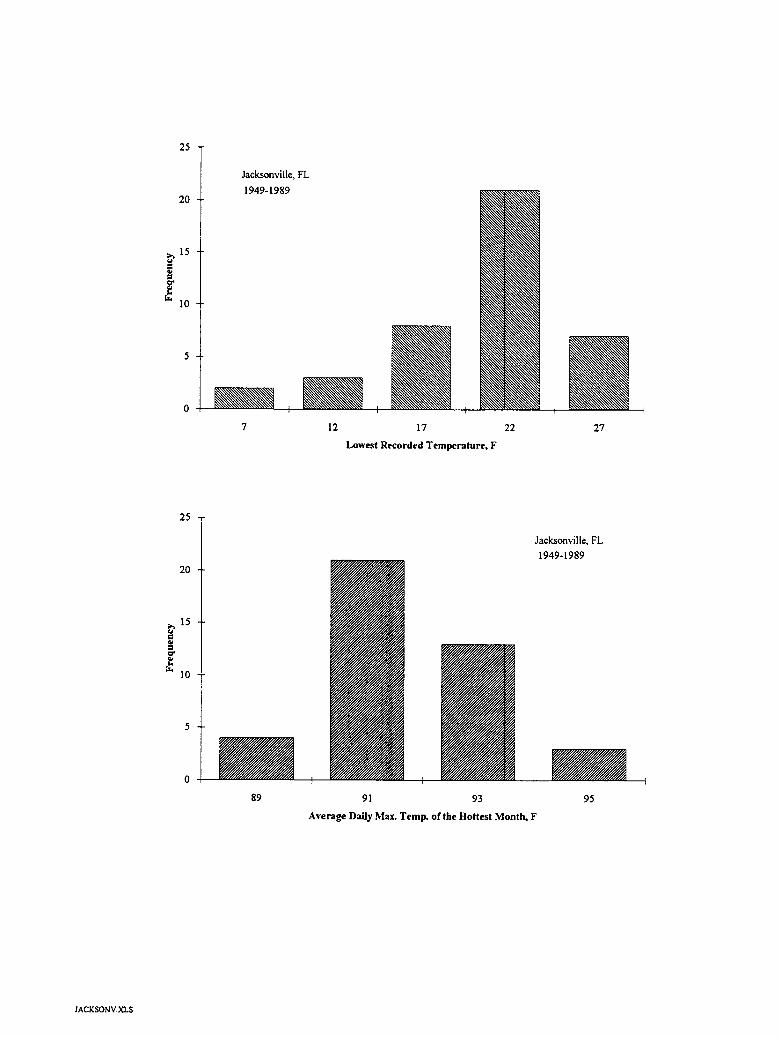
The lowest pavement temperature at a site is determined based on the lowest air temperature.For this purpose, the lowest air temperature data recorded in the weather stations throughoutthe United States and Canada with more than 20 years of data were used. However, ratherthan recording data for all the years in the database it seemed logical to use the average valuewith some statistical parameters to yield a reasonable distribution for the lowest temperatureprediction. In order to determine what parameters are required a number of cities throughoutthe United States with diverse environmental conditions were selected. For each city thelowest annual temperature was obtained for the years for which records were available. ForMinneapolis/St Paul, 100 years of records were available. For most, as many as 30 to 40years of data were available. Here, the lowest annual temperature is defined as the lowestsingle temperature recorded throughout the whole year. The figures in Appendix B exhibitthe frequency distribution of the lowest recorded temperatures for some of the cities.Analysis of these data by the asphalt research program statisticians revealed that a weibulldistribution fits data better than a normal distribution. However, a normal distribution is also
believed to yield reasonable results. Therefore, it was decided to collect the following fiveparameters for prediction of the lowest temperature:
2
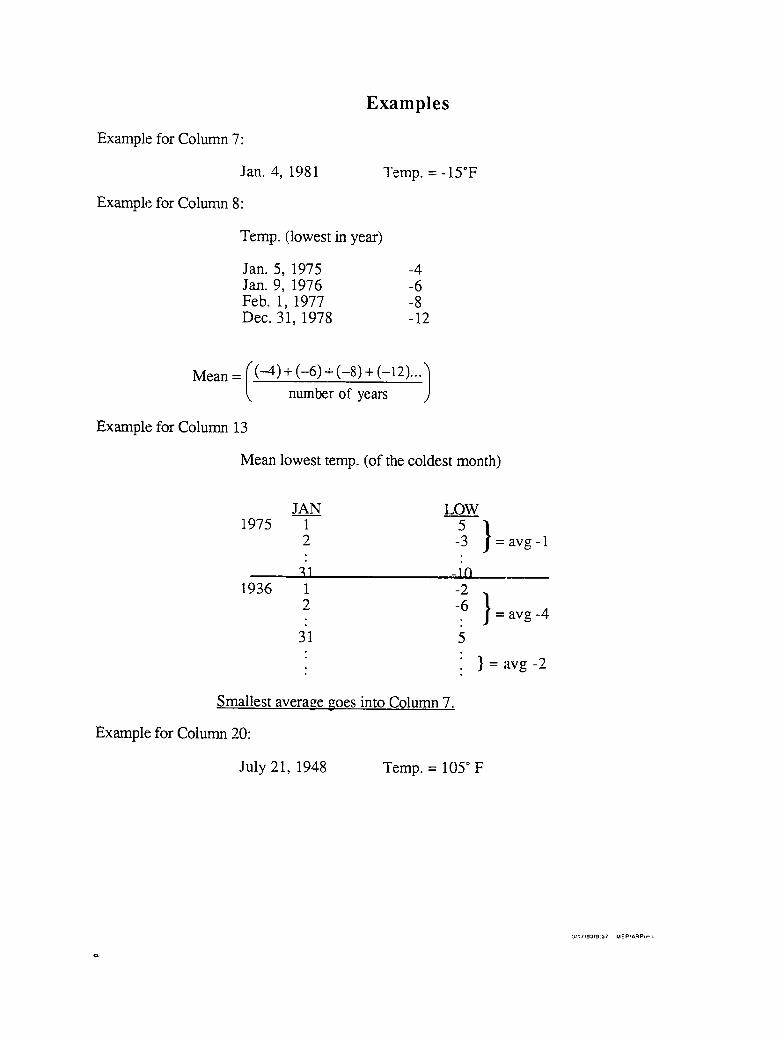
1. The lowest temperature ever recorded (TMin)2. The mean of all lowest temperatures (The summation divided by number of years of
record)3. The median of all lowest temperatures4. The standard deviation of all lowest temperatures5. The number of years of records used to determine the above parameters.
To improve reliability in predictions only stations with more than 20 years of records wereselected. For any year, the lowest temperature recorded in the station is found. The processis repeated for all the years for which data are available. The lowest values obtained this wayfor all the years are averaged.
Example:Lowest Air Temperature in 1940 -16°C (on Dec 23)
1941 -20°C (on Jan 7)1942 - 4°C (on Jan 21)..o,
1990 -260C (on Feb 2).............................
Average -150C
The average lowest air temperature obtained this way is converted into the pavementtemperature.
The Highest 7-Day Averaged Daily High Temperature
The permanent deformation is believed to correlate better with the highest seven-dayaveraged daily maximum pavement temperature rather than highest monthly maximumpavement temperature. Here, the average seven-day maximum air temperature in a year isdefined as the average value of maximum daily air temperatures for seven consecutive daysin a year. In any year, seven consecutive days are selected. The maximum air temperaturefor each of these seven days is found. The average of these maximum temperatures isdetermined. A marching forward in time takes place, i.e. the first day of the seven-daysequence is dropped and one day is added to the end to complete the set again, and thecalculations are repeated. This way, a large number of average seven-day maximum airtemperatures are obtained. The largest of all these averages for that particular year is selectedas the 'Highest Averaged seven-day Daily Maximum Air Temperature'. The process isrepeated for all the years for which temperature records are available. For example, if thereare 30 years of record at one station, 30 values will be obtained for 7-day maximumtemperature, one for each year. The mean value of these 30 numbers will be calculated, andconverted into pavement temperature.
Example:Year: 1940
Temp.(°C)Day 210 (July 29) 37
211 39212 41213 38214 35215 35216 37
Average 37.4 (call it THIGH1)
Assume the above average is the highest maximum temperature for seven consecutivedays in 1940.
Repeat for all other years (example: 1940 through 1990 which gives 51 years of record).Find the average of all the values (THIGH1 through THIGH51) and convert it into pavementtemperature.
As was the case for the lowest temperature, statistical parameters were selected for futurepredictions of maximum temperature rather than using calculated values for all the years. Toinvestigate the distribution of maximum temperature throughout the years, the averagemaximum temperature of the hottest month (the highest mean maximum temperature) foreach year was determined. This monthly temperature parameter was used because at the timethe seven-day maximum temperature was not available to investigate the distribution. Thefrequency distributions are shown in Appendix B. Statistical analysis of this data indicatedthat a normal distribution will be sufficient for prediction purposes. To be consistent with thelowest temperature category, however, the same kind of parameters were also selected forthe maximum temperature as follows:
1. The highest average seven-day maximum air temperature2. The mean value of all average seven-day maximum air temperatures3. The standard deviation for all years of record4. The median of all average seven-day maximum air temperature5. Number of years of record used to determine the above parameters
Other Database Parameters
Even though the lowest air temperature and the average seven-day maximum temperaturewere the main parameters to be included in the database, some other useful factors were alsoincluded for comparison purposes as well as for unanticipated needs. Appendix A presents allthe parameters covered in the summary database, as well as some examples of databasefields.
4
Seven-Day Maximum Temperature versus Monthly Average Maximum
Temperature.
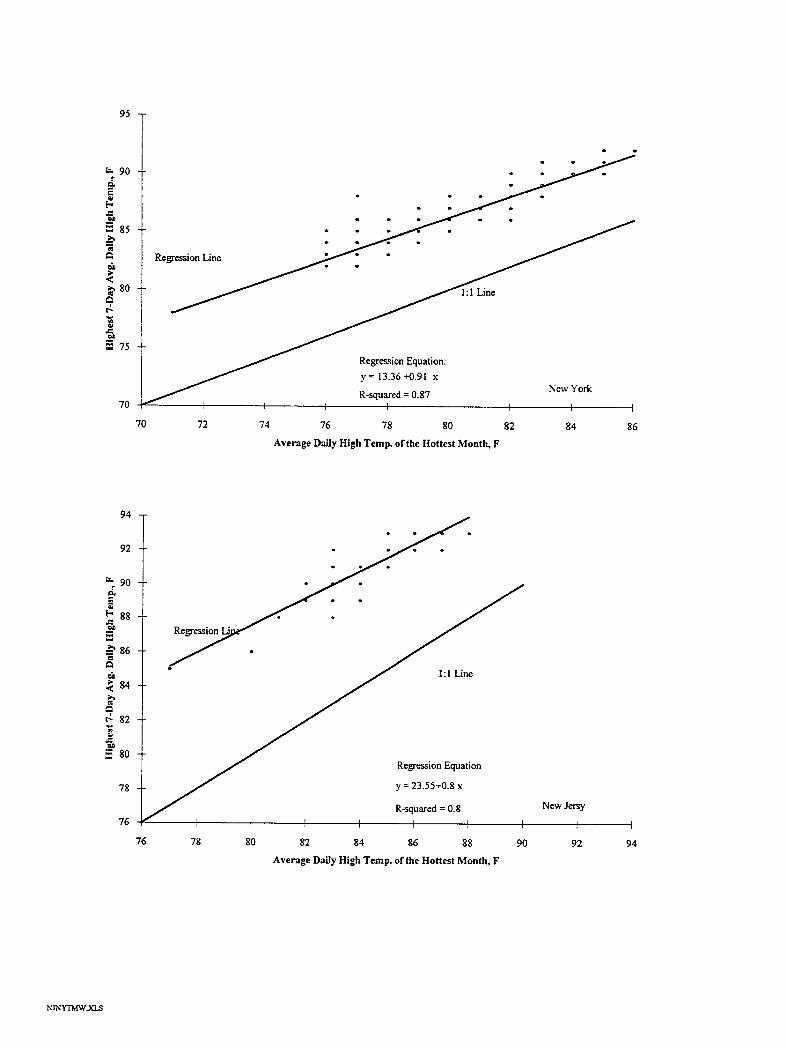
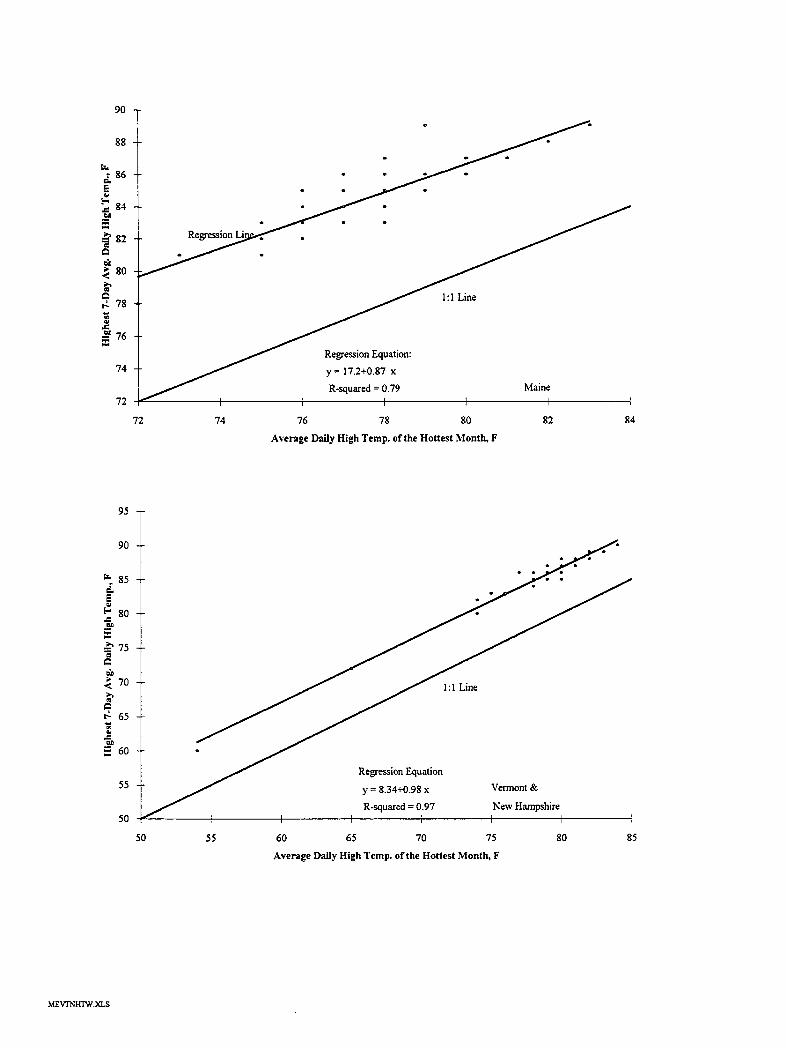
As mentioned before, the SHRP recommendation is to use the average-highest seven-daymaximum temperature at a site as the environmental criterion in selection of the appropriatebinder to resist permanent deformation. It has also been a subject of interest to investigatehow the permanent deformation is related to the monthly maximum temperature. For thisreason, it was decided to compare monthly maximum and seven-day maximum temperaturesand evaluate their correlations. Here, the seven-day temperature is defined as was discussedbefore. The monthly average maximum temperature is considered to be the averagemaximum temperature of the hottest month of the year (average daily maximum temperatureof the hottest month). For regional comparison, the United States was divided into sixdifferent regions and a plot of seven-day maximum temperature versus monthly maximumtemperature was obtained for each region based on the available climatic data. A regressionanalysis was carded on for each region and the R2 value was determined. The regions andthe corresponding regression equations and R2 values are presented in Tables 1 and 2,respectively. The corresponding graphs are presented in Appendix C. The correlation is alsoreported for all the stations combined together throughout the United States. It can be seenthat the highest correlation exists for the West and Rockies regions (R2higher than 0.85).The overall correlation for U.S. yields an R2 of 0.90. Monthly maximum and 7-daymaximum temperatures are also correlated for some of the cities as shown in figures ofAppendix C. In general, it can be seen that 7-day and monthly temperatures have a strongcorrelation in most cases. On the average, the 7-day temperature is about 5 to 7°F higherthan the monthly temperature. However, in some of the states (such as in Wisconsin andNebraska, as can be seen in the figures of Appendix C), there are a small number of stations(compared to the total number in that state) that give a considerably higher difference than 5to 7°F. These areas tremendously influence the correlation between the 7-day and monthlytemperatures and result in a poor R2 value, the relationship will be highly improved if thesefew stations are not included in the analysis.
Table 1. Categorizing states in different regions for comparing 7-day maximumtemperature versus average daily maximum temperature.
Region States
West AZ, CA, NV, OR, UT, WARockies CO, ID, MT, NM, WYMidwest IL, IA, KS, MI, MN, MO, ND, NE, SD, WYSouth AL, AR, FL, GA, LA, MS, OK, TXNortheast CT, DE, MA, MD, ME, NH, NJ, NY, PA, RI, VTNorth Central IN, KY, NC, OH, SC, TN, VA, WV
Table 2. Regression Equations obtained for each region
Tw = Mean Highest 7-Day Averaged Daily High TemperatureT m = Mean Highest Monthly Averaged Daily High Temperature
II. The Daily Temperature Database
The performance based models are used as part of the Superpave system to predict the futurepavement performance. Among the variables required as input to these models is the dailypavement temperature distribution throughout the year. These pavement temperatures arecalculated by integrated model of the climatic effects on pavements, which requires daily airtemperature as an input. Therefore, it became necessary to create a series of data filescontaining daily minimum and daily maximum air temperatures for appropriate stations.These files are used along with a series of other files as input to the integrated model.
Data Elements and Structure
Ten-Year Period Daily Temperature Files
Each file of the database includes three columns. The first column includes the day of theyear. Numbers 1 through 365 are in this column, with number 1 indicating January 1. Thesecond and third columns include daily minimum and daily maximum temperatures at eachstation for each day of the year, respectively. The data are provided for 10 consecutive yearsin 10 different files. There are 3 lines of header information at the top of each file. Theselines include information on state, country, identification, latitude, longitude, and elevationof the station. Contents of the database and the format of the data structure are shown in
Appendix B. These files are used as input for permanent deformation analysis.
Annual Average Daily Temperature Files
For each station there is an additional file covering average daily minimum and maximumtemperatures for 365 days of the year. This file also has the same header information and thesame data structure as for the daily temperature file. These files are used as input forpermanent deformation analysis.
6
Selection of Weather Stations
Certain criteria needed to be satisfied in the process of selecting appropriate weather stations.Ideally, it was desired to select all the stations with 100 percent coverage (i.e. with no singleday of missing data during the 10-year period). However, such a restriction would not yieldsufficient distribution of stations throughout each state. On the other hand, loose restrictionswould yield too dense a population of stations on one hand, and considerable amount of
missing data for some stations on the other hand. Therefore, a compromise had to be madein the selection process.
First, all the stations with fewer than 10 years of data were eliminated; then it was decided toinclude only stations with at least a certain percent coverage during the 10 year period (forexample, stations with at most 182 days missing during the 10-year period for 95 percentcoverage and stations with at most 146 days missing for 95 percent coverage). In addition,no more than seven consecutive days were allowed to be missing in a month and no morethan 18 days total were allowed to be missing in a year. If percent coverage was satisfied butthe single month or single year criterion, as explained above, was not, then two attemptscould be made to replace that particular year with a preceding year with sufficient data. If asatisfactory year could not found, that station would be dropped and would not be included inthe database.
Summary Files
In addition to the ten-year period daily temperature file and annual average daily temperaturefiles, a summary data file was created for each state to include information on all the stateweather stations used in the daily temperature database.
Temperature Intervals and Binder Specification
The SHRP performance-based binder and mixture specifications were developed based on thetests related to the pavement performance under different climatic conditions. The effect ofenvironmental conditions on specifications is taken into account by considering varioustemperature regions. It is possible for two places that have the same air temperatureconditions but are at different geographically locations to have different pavementtemperatures. In specifications, the regions are developed based on the highest seven-dayaveraged daily maximum pavement temperature and the lowest mean pavement temperature.For this reason, however, the binder and mixture specifications are tied to the pavementtemperature rather than the air temperature.
The binder specification would be very simple if we could produce an asphalt that was highlyresistant to rutting in the hottest areas of the country and at the same time performed well inthe coldest regions. Such an asphalt does not yet exist or is not feasible to produce. It is anecessity to produce different binder grades for different climatic conditions. It is importantto know how low and high air temperatures are distributed throughout the country in order todevelop realistic ranges for pavement temperature and to determine how many different
7
binder grades are required. The number of different binder grades for specification purposesalso depends on the cost and feasibility of producing a certain grade.
Using wider temperature ranges results in fewer number of grades. This has advantages inbinder production and storage because fewer binders need to be produced. Such advantage isgained at the cost of probably being too conservative and using more expensive asphalt toresist permanent deformation or cracking at a place where a binder with a lower distressresistance capability might perform satisfactorily. Using very narrow temperature ranges (i.e.using a larger number of climatic regions) results in a larger number of different bindergrades. Even though this has the advantage of probably using a more suitable binder at theright place, it has two disadvantages: on one hand, production and storage of a large numberof different grades may not be feasible or economical. On the other hand, some bindergrades might be rarely used because only a limited number of areas might fall in a certaincategory of temperature ranges to require a certain grade of asphalt. Therefore, there is somecompromise involved in selecting appropriate temperature ranges, in addition to the criteriadiscussed before. As a first step to develop pavement temperature ranges for specifications,the mean highest seven-day air temperature distribution and the lowest air temperaturesdistribution throughout the United States are investigated.
About 6,000 weather stations throughout the country were selected. Ninety-eight percent ofthese stations have air temperature records for more than 20 years. The remaining twopercent have records for more than ten years. The numerical distribution of temperatures isgiven in Table 3. Temperature ranges both for mean highest seven-day and mean lowesttemperatures are selected at 5 °C intervals. It can be noticed that as expected, the majorconcentration of stations is almost in the middle part of the table. The following interestingstatistics are derived based on the data represented in Table 1.
Approximately 95 % of stations report the mean highest seven-day temperaturebetween 25 and 40°C.
Approximately 86 % of stations report mean highest seven-day temperaturebetween 30 and 40°C.
Approximately 75 % of stations have their mean highest seven-day temperaturebetween 30 and 40°C while, at the same time, have their lowest recordedtemperature between -45 and -15 °C.
The largest concentration of mean lowest temperature is in the range of -25 ° to -40°C forplaces where mean highest seven-day temperature varies between 30°C and 35°C (about30% of all stations).
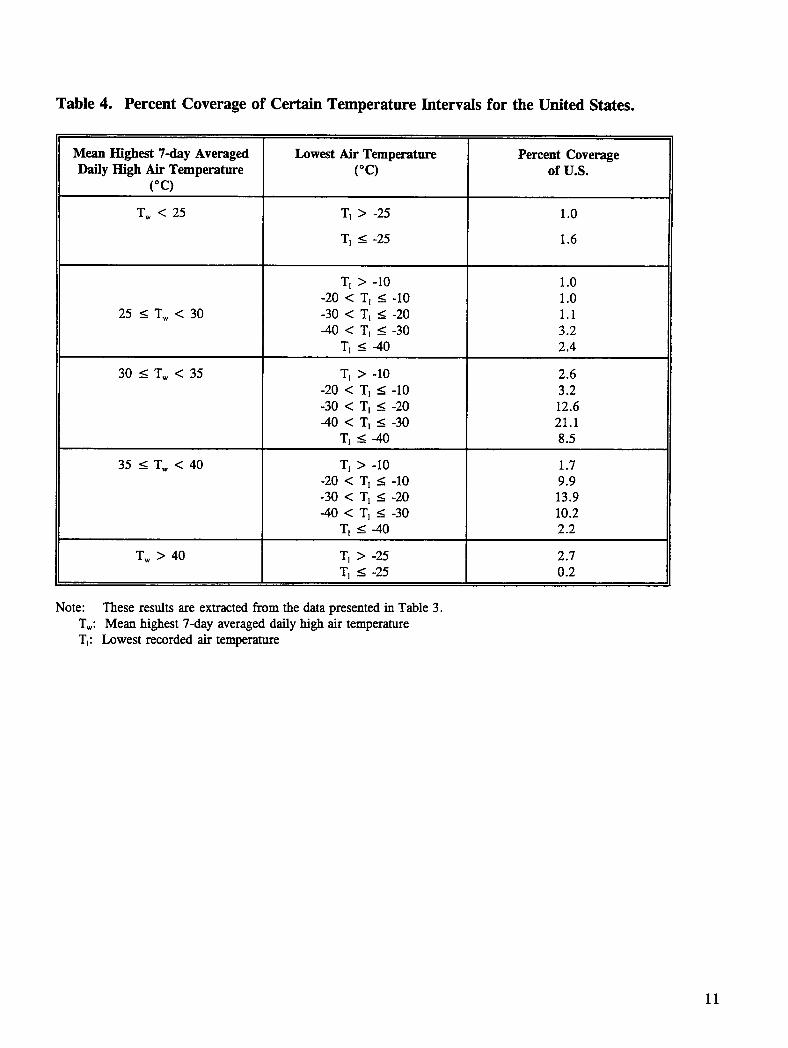
This data is presented in Table 2 in a combined and summarized form. The percent coveragecolumn in this table indicates number of weather stations falling in a certain category as apercent of total number of stations. This column approximately indicates area coverage in theUnited States as a percent of total area for each temperature range category. Consideringdistribution of these coverages is important in deciding how naany different binder grades arerequired and which grades will be most heavily used. This table indicates that 58 percent of
the total area belongs to the 30 ° to 40°C range (mean highest seven-day air temperature) and -20 °to -30°C range (the lowest recorded air temperature).
The lowest pavement temperature is expected to be, in most cases, slightly higher than or equal tothe lowest air temperature. Under rare conditions, the lowest air temperature might slightly exceedthe lowest pavement temperature. Even if such a case might occur, the difference between the twowill be trivial. For these reasons, it seems reasonable and safe to assume that the lowest pavement
temperature is equal to the lowest air temperature. However, conversion of the mean highest seven-day air temperature to the pavement temperature is not so straight forward a matter. Quite often,maximum pavement temperature can be significantly higher than the maximum air temperature.Pavements at different latitudes will have different temperatures under the same environmentalconditions and the same ambient temperature conditions because of the significant effect ofradiation. At lower latitudes (southern regions) the pavement temperature during hot, sunny dayscan reach, on the average, about 25 °C higher than the air temperature, whereas at higher latitudes(northern regions), the difference, on the average, would be around 15°C. Therefore, the pavementtemperature distribution does not have the same coverage throughout the United States as the onegiven for the air temperature in Table 4. This table can be used, however, as a guideline for theselection of reasonable pavement temperature ranges to cover the United States in the mostappropriate manner. Cost and feasibility of production and storage, as well as technical aspects, areamong important factors in the selection of appropriate temperature intervals.
10
Table 4. Percent Coverage of Certain Temperature Intervals for the United States.
Mean Highest 7-day Averaged Lowest Air Temperature Percent CoverageDaily High Air Temperature (°C) of U.S.
(°C)
T_ < 25 T, > -25 1.0
T_ _< -25 1.6
Tt > -10 1.0-20 < T_ _< -10 1.0
25 <_Tw < 30 -30 < T,_<-20 1.1-40 < T_ _< -30 3.2
T_ _< -40 2.4
30 < Tw < 35 Tt > -10 2.6-20 < T_ < -10 3.2
-30 < T_ < -20 12.6-40 < T_ < -30 21.1
TI _< -40 8.5
35 _< Tw < 40 T, > -10 1.7-20 < Tx < -10 9.9
-30 < T_ _< -20 13.9-40 < T_ < -30 10.2
T, _< -40 2.2
Tw > 40 T_ > -25 2.7% <-25 0.2
Note: These results are extracted from the data presented in Table 3.Tw: Mean highest 7-day averaged daily high air temperatureTt: Lowest recorded air temperature
11
Appendix A. Contents of the summary database and examplesof the contents
13
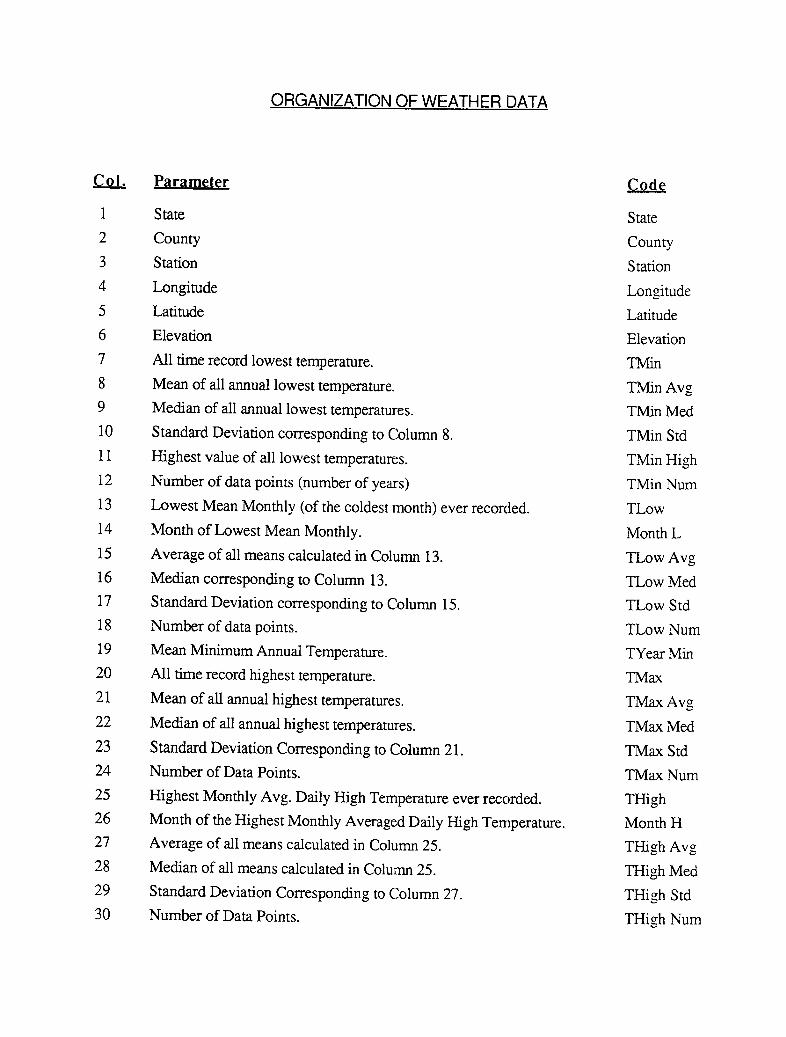
ORGANIZATION OF WEATHER DATA
{_QI. Parameter Code
1 State State
2 County County
3 Station Station
4 Longitude Longitude
5 Latitude Latitude
6 Elevation Elevation
7 All time record lowest temperature. TMin
8 Mean of all annual lowest temperature. TM.inAvg
9 Median of all annual lowest temperatures. TMin Med
10 Standard Deviation corresponding to Column 8. TMin Std
11 Highest value of all lowest temperatures. TMin High
12 Number of data points (number of years) TMin Num
13 Lowest Mean Monthly (of the coldest month) ever recorded. TLow
14 Month of Lowest Mean Monthly. Month L
15 Average of all means calculated in Column 13. TLow Avg
16 Median corresponding to Column 13. TLow Med
17 Standard Deviation corresponding to Column 15. TLow Std
18 Number of data points. TLow Num
19 Mean Minimum Annual Temperature. TYear Min
20 All time record highest temperature. TMax
21 Mean of all annual highest temperatures. TMax Avg
22 Median of all annual highest temperatures. TMax Med
23 Standard Deviation Corresponding to Column 21. TMax Std
24 Number of Data Points. TMax Num
25 Highest Monthly Avg. Daily High Temperature ever recorded. THigh
26 Month of the Highest Monthly Averaged Daily High Temperature. Month H
27 Average of all means calculated in Column 25. THigh Avg
28 Median of all means calculated in Column 25. THigh Med
29 Standard Deviation Corresponding to Column 27. THigh Std
30 Number of Data Points. THigh Num
31 Highest 7-Day Averaged Daily High Temperature ever recorded. THighW
32 Average of all highest 7-Day Temperatures as defined in Column 31. THighW Avg
33 Median corresponding to Column 31. THighW Meal
34 Standard Deviation corresponding to Column 31. THighW Std
35 Number of Data Points. THighW Num
36 Mean Maximum Annual Temperature TYear Max
37 Highest total annual precipitation ever. PRCP Max
38 Lowest total annual precipitation. PRCP Min
39 Mean of annual precipitations. PRCP Avg
40 Median of total annual precipitations. PRCP Med
Average of seven consecutive days in a year giving the highest temperature(record highest ever)•
Say: July, 1956 103
Example for Column 37:
Highest total annual precipitation happened in 1981 and it was equal to 53inches.
Example for Column 38:
Lowest total annual precipitation happened in 1953 and it was equal to 24inches.
Example for Column 39:
Inches ofPrecipxation1935 401936 45
1982 28
40 + 45 + ..... + 28 +....avg. =number of years
3_' 7193t9 37 MEPIARPI-..
c,
THE DAILY TEMPERATUREDATABASE: FILE FORMATAND CONTENTS
File Format
STATE LONGITUDE ID
COUNTY LATITUDE YEAR BEG
STATION ELEVATION YEAR END
1985 (or AV) TM.k-N T_M.AX1 29 45?
243 61 87
365 34 50
File Name: TX387685
Explanation of characters for the file name:Characters 1 and 2: State AbbreviationCharacters 3 through 6: Station I'D (if a station has a single digit ID,
use zeros, example: If ID is 7, use 0007)Characters 7 and 8: Year for which data is reported in the file, or
if the file is for average temp, use 'AV'
Above Example: State TX, Station 3876, Year 1985)
Labeling Diskettes: TXMMT-1/4
Explanation of characters for the diskette label:Characters 1 and 2: State AbbreviationCharacters 3 through 6: Always use 'MMT-'Character 7: Diskette NumberCharacter 8: Always use symbol 'fCharacter 9 Total number of Diskettes for the State
Summary File
State County Station ID Latitude Longitude Elevation CoverageYear FileNameTX Travis ....... 1234 ...................... 1985 TX123485
Appendix B. Distribution of the lowest temperature of the yearand average daily maximum temperature for some major citiesin the United States
21
_°T18 _- Albany, NY
t
1939-198916
14
_12
1o4
2
o i, I I q I _ !-28 -23 -18 -13 -8 -3
Lowest Recorded Temperature, F
18
16
14 +
12 a. Albany, NY1952-1989
_io -)-
°+2
80 82 84 86 88 90
Average Daily Max. Temp. ofthe Hottest Month, F
I/6J94ALBANY.XLS
20 -1-!
18 _- Austin, TX1931-1989
16
14
10 --
U. 8
6
4
-2 3 8 13 18 23 28
Lowest Recorded Temperature, F
18 _-
16 Austin, TX
1931-198914
12 n-I
:IO T
4 +
0 I i I I i
92 94 96 98 100
Average Daily Max. Temp. ofthe Hottest Month, F
AUSTIN.XLS
14 -r1
12 _ Denver, CO1949-1989
I0
!
t_ 6
2
0 ! i _ I
-25 -20 -15 -10 -5 0 5 10 15 20
Lowest Recorded Temperature, F
lg
16 Denver, CO
1949-198914
12
>_10 I_ 8
6
N0 I I ! _ I
83 85 87 89 91
Average Daily Max. Temp. of the Hottest Month, F
DENVER_XLS
I0 1952-1989
8
" 6
4
2
0 , _ ',
-23 -18 -13 -8 -3 2 7
Lowest Recorded Temperature, F
14
Flagstaff, AZ12 1952-1989
_ g
g
26 I
4
0 i ', I i ',
78 80 82 84 86
Average Daily Max. Temp. of the Hottest Month, F
FLAGSTAF.XLS
25T[ Jacksonville,FL
20 I 1949-1989
_ 10
' // N7 12 17 22 27
Lowest Recorded Temperature, F
25
Jacksonville, FL
1949-1989
10 --
5
0 _ ; I
89 91 93 95
Average Daily Max. Temp. ofthe Hottest Month, F
JACKSONV.XLS
14
T| Lexington. KY
12 I- 1949-1989
10
0 I [ 1 _ 1 1 '
-21 -16 -II -6 -I 4 9
LowestRecordedTemperature,F
16
T/ Lexington, KY
14 + 1949-1989I
10
[ g
6
2 T --
0 , 1
81 83 85 87 89 91
Average Daily Max. Temp. of the Hottest Month, F
LE)flNO"TN.XLS
30
25 Minneap°li_St'PauI, MN1891-1989
20
_ 15
5
-34 -29 -24 -19 -14 -9
Lowest Recorded Temperature, F
16 T
14 _- Minneapolis/St.Paul, MN1891-1989
12
10
= 8
t._
6
79 81 83 85 87 89 91 93
Average Daily Max. Temp. of the Hottest Month, F
STPAUL.XLS
14
Phoenix, AZ
12 1950-1989
10
8
t_
0 I ; : ; ; l ' ;
17 20 23 26 29 32 35
LowestRecordedTemperature,F
16 T
Phoenix, AZ
14 I 1950-1989
il0 I
4
NN NN0 _ ] I ' ', 1 ] I
99 101 103 105 107 109
Average Daily Max. Temp. ofthe Hottest Month, F
PHOENIX.XLS
t Portland, OR12 1942-1989
10
_ 6
0 , ----- ' I 1 ] F !
-3 2 7 12 17 22 27
Lowest Recorded Temperature, F
12 -rJ
I Portland, ORI0 1942-1989
73 75 77 79 81 83 85 87
Average Daffy Max. Temp. of the Hottest Month, F
PORTLAND.XL$
14
Rapid City, SD
12 1948-1989
10
8
4
24
0 , E I I
-29 -24 -19 -14 -9
Lowest Recorded Temperature, F
12
Rapid City, SD
I0 1948-1989
8
I
0 ] I I I ! _ i I
81 83 85 g7 89 91 93
Average Daily Max. Temp. of the Itottest Month, F
RAPIDCIT.XLS
lg
16 Tallahassec, FL1949-1989
14
12
I0
c_
6
4
0 i p I I
6 11 16 21
Lowest Recorded Temperature, F
Ig
16
14 Tallahassee, FL1949-1989
12
g
6 I1
2,',*
0 ! i I
90 92 94
Average Daily MaL Temp. of the Hottest Month, F
TALAHASE.XLS
14 I Washington, IX:
12 _- 1949-1989
t8 1
_ 6
4
' N0 ' ' ' 1 ' ' 1
-I0 -5 0 5 10 15 20
Lowest Recorded Temperature, F
16 ii
Washington, DC12 1949-1989
10 -4-
6
2
0 i I
85 87 89 91 93
Average Daily Max. Temp. of the Hottest Month, F
WASHINGT.XLS
Appendix C. Average seven-day maximum temperature versusaverage monthly maximum temperature for different regionsand some example cities
35
100 i
i "_o . -.-. i_.i_.._ 80
= 70
_ 60
! _ I.I Line
r_
4o=
30 Regression Equation:
2O I , , I I
20 30 40 50 60 70 80 90 100
Average Dally High Temp. of the Itottest Month, F
100
l ": - ...'::"90 • i : ._: ! :'-" .
E- 80
_=
__,_.,___._605070 1 _ " J North E40
40 45 50 55 60 65 70 75 80 85 90
Average Daily High Temp. of the Hottest Month, F
NORTH.XLS
ii0 T
io5
_- I00
_ 95
_- 90
_" g5
<_ go
_ 75
_ 70
65
60
60 65 70 75 gO 85 90 95 100 105
Average Daily ltigh Temp. ofthe Hottest Month, F
110
l • •I0O • • -:=:"
•" 90
[=,
80
7o<
_ 6o
_ 5o
40
30 I I i I
30 40 50 60 70 80 90 I00
Average Daily Iligh Temp. of the Hottest Month, F
SOUTH.X.LS
II0
I00
t_
90e_
_ 80
4O
30 I
30 40 50 60 70 80 90 1O0
Average Daily High Temp. of the Hottest Month, F
120 --,-
t "II0 - : *
100 -- . :" "
o.o
90
--,_ . . I:1 Line
< gO *-m,
e_ -
70-*- -: -"o e.
" Regression Equation60
[ y= 12.68-_0.93 x
WestR-squared = 0.96
50 I t I
50 60 70 80 90 100 110 120
Average Daily High Temp. of the Hottest Month, F
WEST.XLS
95! i90
. .
_ 80tZ
70 , I i I I I
70 72 74 76 78 80 g2 84 $6
Average Daily High Temp. offlle Hottest Month, F
94
9_t :!i _-90 'eL
E- g$
_" 86
s4
r_ 82
= g0
78
New Jersy
76 ! I
76 7g 80 82 84 g6 88 90 92 94
Average Daily High Temp. ofthe Hottest Month, F
N.rNYTMW.XLS
92
90
88E_ 86
_"84
_ 82
n: I I
_ 80
76 i i
'76 7"7 78 79 80 81 82 83 84 85 86
Average Daily High Temp. of the ltottest Month, F
93 _ •
91 •
87
=
_85< 83
e_t_ 81
_- 79
77 -1- y = 2.77+1.04 x
R-squared = 0.85 Massachusetts75 l E l I I i I ! I
75 76 77 78 79 80 81 82 83 84
Average Daily High Temp. of the Hottest Month, F
RIMATMW.XLS
90 T
.=_ g2
_ 80
tZ 78
= 76
74
72 [ I I I I [
72 74 76 78 80 82 84
Average Daily High Temp. of the Hottest Month, F
95
90
r_ 85
r..
t- 80
_ 75
_ 70
_ 65
QID
_. 60
55
50 [ I J I I
50 55 60 65 70 75 80 85
Average Daily High Temp. of the Hottest Month, F
MEV'I'NHTW2_,S
100 .
98
k_
eL
E 96
=
__ 94
•_ 92
86 I i
g6 87 88 g9 90 91 92 93 94 95
Average Daily High Temp. of the Hottest Month, F
118 I113 " . "
o
108 _ " .:"-- I
103±
_= 98
N i_ 93N -_- 1:1 Line
tgg
"_ 83
_. ,
Regression Equation
73 y = 14.08+0.91 x
R-squared = 0.93 Arizona6g
68 73 7g 83 g8 93 98 103 108 I 13
Average Daily High Temp. of the Hottest Month, F
ARAZI'MW.XLS
95 -_i
i
90 T --:::"
, o onLi o .. . ."
_ 75_"70
tZ
/ / Regression Equation:
50 _- J y =66.95+0.26 x/ _ Wisconsin
] / R-squared = 0.4845 , I I i I I I [ I I
45 50 55 60 65 70 75 80 85 90
Average Daily High Temp. of the Hottest Month, F
105
100
:2
,,_ Regression Lme
=>. _. _ . . .
• 1: 1 Line
<_ 90 -
t_
-= 85 -
y = 73.01+0.26 xR-squared = 0.41 Nebraska
80 I i I , i t i
80 82 84 86 g$ 90 92 94
Average Daffy High Temp. of the Hottest Month, F
WINE'I'MW.XLS
Appendix D. Documentation for climatic databases
Provided by EarthInfo, Inc.
45
UNITED STATESWEATHER DATABASE
DOCUMENTATION FORSHRP
ASPHALT RESEARCH PROGRAMPROVIDED BY EARTHINFO, INC.
AUGUST 1991
BIG.TXT, SMALL.TXT, AND ALL STATE FILES
Fill0 Old Field Type Contents1 1 CHAR State postal abbreviation.2 2 CHAR County name3 3 CHAR Station name4 4 CHAR Longitude (ddd.mm)5 5 CHAR Latitude (ddd.mm)6 6 FLOAT Elevation of station, in feet.
7 7 INT Smallest TMIN ever.8 8 FLOAT Mean of smallest TMIN's.9 9 FLOAT Median of smallest TMIN's.10 10 FLOAT Std. Dev. of smallest TMIN's.11 11 INT Largest TMIN ever.12 12 INT Number of TMIN years, for above.
13 13 INT Smallest mean monthly TMIN.14 CHAR Month of smallest mean monthly.15 14 FLOAT Mean of mean monthly TMIN's.16 15 FLOAT Median of mean monthly TMIN's.17 16 FLOAT Std. Dev. of mean monthly TMIN's.18 17 INT Number of mean monthly TMIN's.
19 33 FLOAT Daily average TMIN.
20 18 INT Largest TMAX ever.21 19 FLOAT Mean of largest TMAX's.22 20 FLOAT Median of largest TMAX's.23 21 FLOAT Std. Dev. of largest TMAX's.24 22 INT Number of TMAX years, for above.
25 23 INT Largest mean monthly TMAX.26 CHAR Month of largest mean monthly.27 24 FLOAT Mean of mean monthly TMAX's.28 25 FLOAT Median of mean monthly TMAX'S.29 26 FLOAT Std. Dev. of mean monthly TMAX's.30 27 INT Number of mean weekly TMAX's.
31 28 INT Highest mean weekly TMAX.32 29 FLOAT Mean of mean weekly TMAX's.33 30 FLOAT Median of mean weekly TMAX's.34 31 FLOAT Std. Dev. of mean weekly TMAX's.35 INT Number of mean weekly TMAX's.
36 32 FLOAT Daily average TMAX.
37 34 FLOAT Maximum annual PRCP.
CONTINUATION
38 35 FLOAT Minimum annual PRCP.39 36 FLOAT Mean of annual PRCP.40 37 FLOAT Median of annual PRCP's.41 38 FLOAT Std. Dev. of annual PRCP's.42 39 INT Number of PRCP years, for above.
xx.TXT Data extracted from BIG.TXT by state,where xx is the state postal code.
TMINBIG. TXT Data for one parameter where that station has 20 years or moreTMAXBIG.TXT of data for that parameter.PRCPBIG.TXT
TMINSMAL.TXT Data for all stations with parameters of less than 20 years.TMAXSMAL.TXTPRCPSMAL.TXT
File Format
Each file is in a format known as "comma-delimited". This format is a ASCII textfile, containing readable data. Each line constitutes one record. Within a record canbe (virtually) any number of fields, of either the text or numeric variety. Each field isseparated by a comma. The end of the record has a carriage-return/linefeed but notrailing comma. A text string is text surrounded by double quotes. A period orminus sign. A numeric field does not have quotes. This file format is accepted bymost database management programs as well as most spreadsheets. It can be editedusing any ASCII editor.
Data Anomalies
The originating database contains errors and other potentially serious anomalies. Usethe percent coverage variables to determine the "worthiness" of the data. If anypercent is zero, then the corresponding (TMAX, TMIN, PRCP) data should beignored. Extremely small percent coverages should also be suspect. Occasionally astation may have one data year, with all data valued being "invalid data". Needless tosay, this can throw off some calculations. Some stations are unidentified, thesestations are named "????" and have elevations of 9999 and latitude/lon_tudes of zero.For further reading on the potential data anomalies, consult your climate data manual.Any value of 9999 or -9999 is invalid. Any data with a count of 0 or 1 should not beused.
Data F'ormulas
Field 7
The smallest TMIN ever is the smallest TMIN value for the entire period of record.The smallest TMIN for each year is saved in an array for use in generating the mean,median, and standard deviation.
Field 11
The largest TMIN ever is the largest TMIN value for the entire period of record.
Fields 13,14
The smallest mean monthly TMIN is generated by first taking the mean of a month'sworth of TMIN values. The smallest mean monthly for a year is saved in an array,one value per year of the period of record. The month that the lowest mean occurredis also saved. Field 13 is the smallest mean from the array, with Field 14 being themonth the smallest mean occurred.
Field 19
This field is taken from the summary record and is the yearly daily average TMIN.
Field 20
The largest TMAX ever is the largest TMAX value for the entire period of record.The largest TMAX for each year is saved in an array for use in generating the mean,median, and stard deviation.
Fields 25, 26
The largest mean monthly TMAX is generated by first taking the mean of a month'sworth of TMAX values. The largest mean monthly for a year is saved in an array,one value per year of the period of record. The month that the highest mean occurredis also saved. Field 25 is the largest mean from the array, with Field 26 being themonth the largest mean occurred.
Field 28
This field contains the highest mean weekly TMAX. The value is generated by f'u'stcollecting all TMAX data for May, June, July, August, and September. a 7-daysliding window is used to generate a weekly mean. The highest weekly mean for ayear is saved in an array for statistics. This value is the largest mean from that array.
Field 36
This field is taken from the summary record and is the yearly daily average TMAX.
Field 37, 38
The total annual precipitation for each year is saved in an array. These two fields arethe largest and smallest of these values, respectively.
General Means
The routine that calculates the mean is presented with an array of values, and a countof values. All values in the array are summed, then divided by the count.
General Median
Using the same array (& count) as the mean, the array is sorted. If there are an oddnumber of elements, the median is the "middle" element of the array. If there is aneven number of elements, then the two in the "middle" are averaged to generate themedian.
General Standard Deviation
This routine uses the same array of values as the mean and the median. For eacharray element, the square of the difference between the element and the mean issummed, these values are then divided by the number of elements minus one. Thesquare root of this result is the standard deviation. The formula used is from theCRC handbook.
Data Values
All temperature values are stored and reported in degrees fahrenheit. All precipitationvalues are stored as hundredths of an inch. These values are converted to inches andreported as a floating point number.
CANADAWEATHER DATABASEDOCUMENTATION FOR
SHRPASPHALT RESEARCH PROGRAM
PROVIDED BYEARTHINFO, INC.
JANUARY, 1992
17 14 :12 :i0 1992 CANADIAN WEATHER DATA SUMMARY Page 1
There are two GROUPS of data files provided. The first groupcontains data similar to the first contract with the additionof SNOW data. The second group of files contains maximum andminimum humidity data and 12 element arrays for each of theseparameters: WIND, TMAX and TMIN.
Each file is provided in two formats, comma delimited ASCIIand a dBASE compatible DBF style.
Field descriptions of files in first group:
BIGI.TXT, SMALLI.TXT, and all (Province) l.TXT files.Field Type Contents
1 CHAR State postal abbreviation.2 CHAR County name.3 CHAR Station name.4 CHAR Longitude (ddd.mm)5 CHAR Latitude (ddd.mm)6 INT Elevation of station, in feet.
7 INT Smallest TMIN ever.8 FLOAT Mean of smallest TMIN's.9 FLOAT Median of smallest TMIN's.i0 FLOAT Std. Dev. of smallest TMIN's.ii INT Largest TMIN ever.12 INT Nnmher of TMIN years, for above.
13 FLOAT Smallest mean monthly TMIN.14 INT Month of smallest mean monthly.15 FLOAT Mean of mean monthly TMIN's.16 FLOAT Median of mean monthly TMIN's.17 FLOAT Std. Dev. of mean monthly TMIN's.18 INT N1mher of mean monthly TMIN's.
19 FLOAT Daily average TMIN.
20 INT Largest TMAX ever.21 FLOAT Mean of largest TMAX's.22 FLOAT Median of largest TMAX's.23 FLOAT Std. Dev. of largest TMAX's.
17 14 :12 :i0 1992 CANADIAN WEATHER DATA SUMMARY Page 2
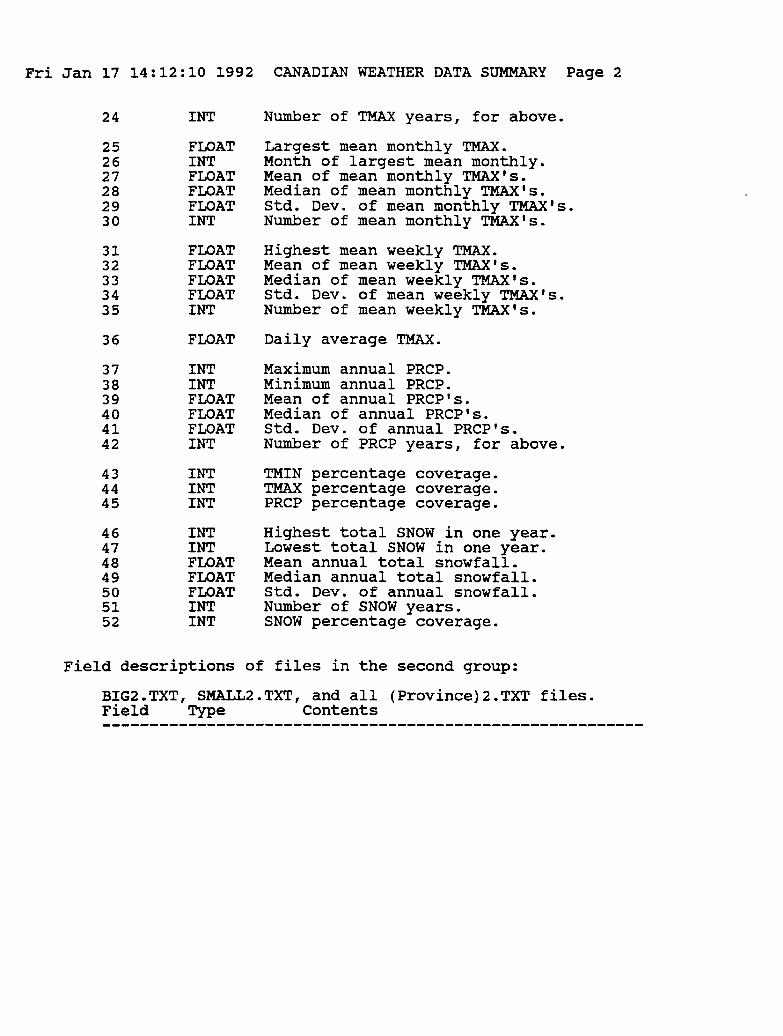
24 INT Number of TMAX years, for above.
25 FLOAT Largest mean monthly TMAX.26 INT Month of largest mean monthly.27 FLOAT Mean of mean monthly TMAX's.28 FLOAT Median of mean monthly TMAX's.29 FLOAT Std. Dev. of mean monthly TMAX's.30 INT Number of mean monthly TMAX's.
31 FLOAT Highest mean weekly TMAX.32 FLOAT Mean of mean weekly TMAX's.33 FLOAT Median of mean weekly TMAX's.34 FLOAT Std. Dev. of mean weekly TMAX's.35 INT Number of mean weekly TMAX's.
36 FLOAT Daily average TMAX.
37 INT Maximum annual PRCP.38 INT Minimum annual PRCP.39 FLOAT Mean of annual PRCP's.40 FLOAT Median of annual PRCP's.41 FLOAT Std. Dev. of annual PRCP's.42 INT Number of PRCP years, for above.
43 INT TMIN percentage coverage.44 INT TMAX percentage coverage.45 INT PRCP percentage coverage.
46 INT Highest total SNOW in one year.47 INT Lowest total SNOW in one year.48 FLOAT Mean annual total snowfall.49 FLOAT Median annual total snowfall.50 FLOAT Std. Dev. of annual snowfall.51 INT Number of SNOW years.52 INT SNOW percentage coverage.
Field descriptions of files in the second group:
BIG2.TXT, SMALL2.TXT, and all (Province)2.TXT files.Field Type Contents
Fri Jan 17 14 :12 :l0 1992 CANADIAN WEATHER DATA SUMMARY Page 3
1 CHAR State postal abbreviation.
2 CHAR County name.3 CHAR Station name.
4 CHAR Longitude (ddd.mm)5 CHAR Latitude (ddd.mm)
6 INT Elevation of station, in feet.7 FLOAT Avg daily MAX rel humidity8 FLOAT Std dev of above.
9 FLOAT Avg daily MIN rel humidityI0 FLOAT Std dev of above.
Ii - 35 FLOAT[24] Avg WIND speed and std for each month.36 - 47 FLOAT[12] Avg monthly TMIN for each month48 - 59 FLOAT[12] Avg monthly TMAX for each month
The following files are derived from group 1 files where the BIGfiles have stations with 20 or more years of data:
TMINBIG.TXT, TMINSML.TXT
1-6 From above fields 1-6.7-19 From above fields 7-19.20 From above field 43.
TMAXBIG.TXT, TMAXSML.TXT
1-6 From above fields 1-6.7-23 From above fields 20-36.24 From above field 44.
PRCPBIG.TXT, PRCPSML.TXT
1-6 From above fields 1-6.
7-12 From above fields 37-42.13 From above field 45.
SNOWBIG.TXT, SNOWSML.TXT
1-6 From above fields 1-6.7-12 From above fields 46-51.13 From above field 52.
Fri Jan 17 14:12:10 1992 CANADIAN WEATHER DATA SUMMARY Page 4
FILE NAMES: where # is 1 or 2, indicating the file group:
BIG#.TXT All data from all stations withany one parameter having at least20 years of daily data.
SMALL#.TXT All data from all other stations.
xx#.TXT Data extracted from BIG#.TXT by province,where xx is the province abbreviation.
TMINBIG.TXT Data for one parameter where thatTMAXBIG.TXT station has 20 years or more of dataPRCPBIG.TXT for that parameter.SNOWBIG.TXT
TMINSML.TXT Data for all stations with parametersTMAXSML.TXT of less than 20 years.PRCPSML.TXTSNOWSML.TXT
File Format
Each file is either a dBASE compatible DBF filewith extension ".dbf" or it is "comma-delimited"with an extension of ".txt". "comma-delimited"format is a ASCII text file, containing readabledata. Each line constitutes one record. Within arecord can be (virtually) any n1_mher of fields, ofeither the text or numeric variety. Each field isseparated by a comma. The end of the record has acarriage-return/linefeed but no trailing comma. Atext string is text surrounded by double quotes. Anumeric field is text containing either digits or aperiod or minus sign. A numeric field does not havequotes. This file format is accepted by most databasemanagement programs as well as most spreadsheets. Itcan be edited using any ASCII editor.
Data Anomalies
The originating database contains errors and other potentiallyserious anomalies. Use the percent coverage variables to
Fri Jan 17 14:12:10 1992 CANADIAN WEATHER DATA SUMMARY Page 5
determine the "worthiness" of the data. If any percent iszero, then the corresponding (TMAX, TMIN, PRCP) data shouldbe ignored. Extremely small percent coverages should also besuspect. Occasionally a station may have one data year, withall data values being "invalid data". Needless to say, thiscan throw off some calculations. Any value of 9999 or -9999is invalid.
Data Formulas
Field 7
The smallest TMIN ever is the smallest TMIN value for theentire period of record. The smallest TMIN for each yearis saved in an array for use in generating the mean, median,and standard deviation.
Field ii
The largest TMIN ever is the largest TMIN value for theentire period of record.
Fields 13, 14
The smallest mean monthly TMIN is generated by first takingthe mean of a month's worth of TMIN values. The smallestmean monthly for a year is saved in an array, one value peryear of the period of record. The month that the lowestmean occurred is also saved. Field 13 is the smallest meanfrom the array, with Field 14 being the month the smallestmean occurred.
Field 19
This field is calculated as the sum of all daily TMIN'sdivided by the number of TMIN readings over the life ofthe station.
Field 20
The largest TMAX ever is the largest TMAX value for theentire period of record. The largest TMAX for each yearis saved in an array for use in generating the mean, median,and standard deviation.
Fri Jan 17 14 :12 :I0 1992 CANADIAN WEATHER DATA SUMMARY Page 6
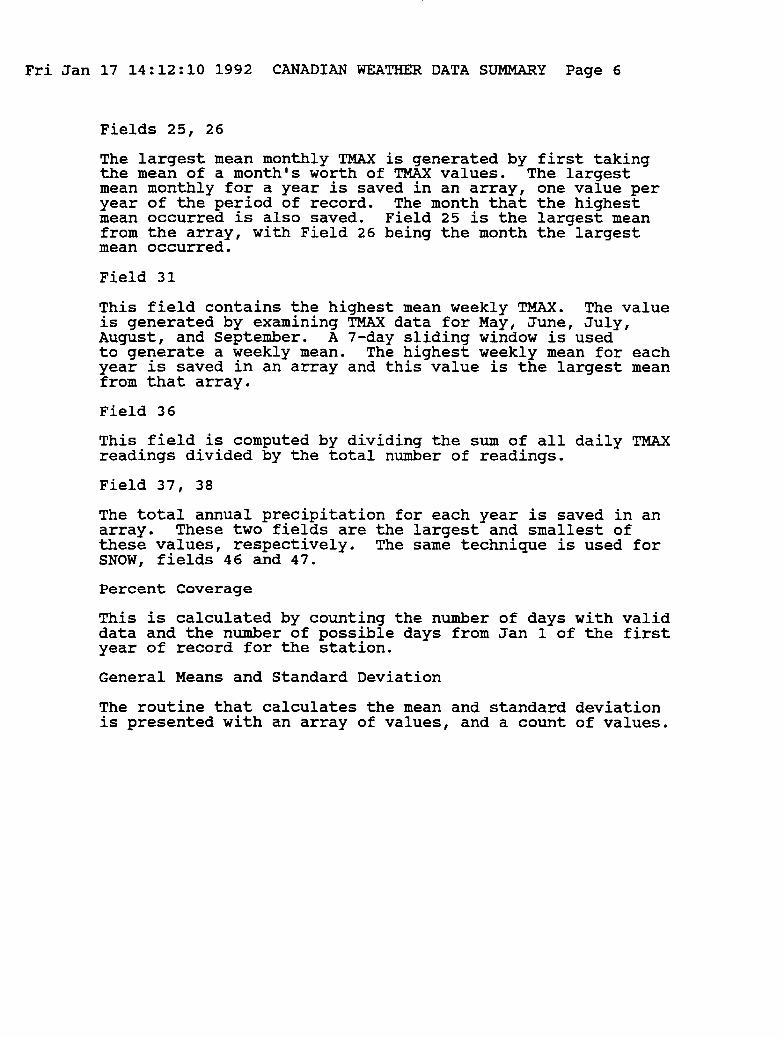
Fields 25, 26
The largest mean monthly TMAX is generated by first takingthe mean of a month's worth of TMAX values. The largestmean monthly for a year is saved in an array, one value peryear of the period of record. The month that the highestmean occurred is also saved. Field 25 is the largest meanfrom the array, with Field 26 being the month the largestmean occurred.
Field 31
This field contains the highest mean weekly TMAX. The valueis generated by examining TMAX data for May, June, July,August, and September. A 7-day sliding window is usedto generate a weekly mean. The highest weekly mean for eachyear is saved in an array and this value is the largest meanfrom that array.
Field 36
This field is computed by dividing the sum of all daily TMAXreadings divided by the total nnmber of readings.
Field 37, 38
The total annual precipitation for each year is saved in anarray. These two fields are the largest and smallest ofthese values, respectively. The same technique is used forSNOW, fields 46 and 47.
Percent Coverage
This is calculated by counting the number of days with validdata and the number of possible days from Jan 1 of the firstyear of record for the station.
General Means and Standard Deviation
The routine that calculates the mean and standard deviationis presented with an array of values, and a count of values.
_ri Jan 17 14 :12 :I0 1992 CANADIAN WEATHER DATA SUMMARY Page 7
All values in the array are summed, then divided by the countto produce the mean. At the same time the squares of eachelement are summed. The std. dev. is then calculated bysqrt( (sum-of-squares -(sum-squared / n) ) / n -I ).Means and std. dev. are reported in the same units as the data.Std. dev. is displayed with one decimal place but the unitsremain the same. Ie: a mean of 345.6 in PRCP data is3.456 centimeters since PRCP is reported in hundredths ofcentimeters.
General Median
Using the same array (and count) as the mean, the array issorted. If there are an odd number of elements, the medianis the "middle" element of the array. If there is an evennumber of elements, then the two in the "middle" are averagedto generate the median. Medians are reported in the same unitsas the data.
Data Values
Data are the same units as provided by Canadian Climate Center.Temperature values are in degrees and tenths Centigrade:321 is 32.1 degrees C. All precipitation values arein hundredths of a centimeter and snow values are in tenthsof a centimeter. Humidity is in whole percent. Wind speedis is Kilometers per hour.
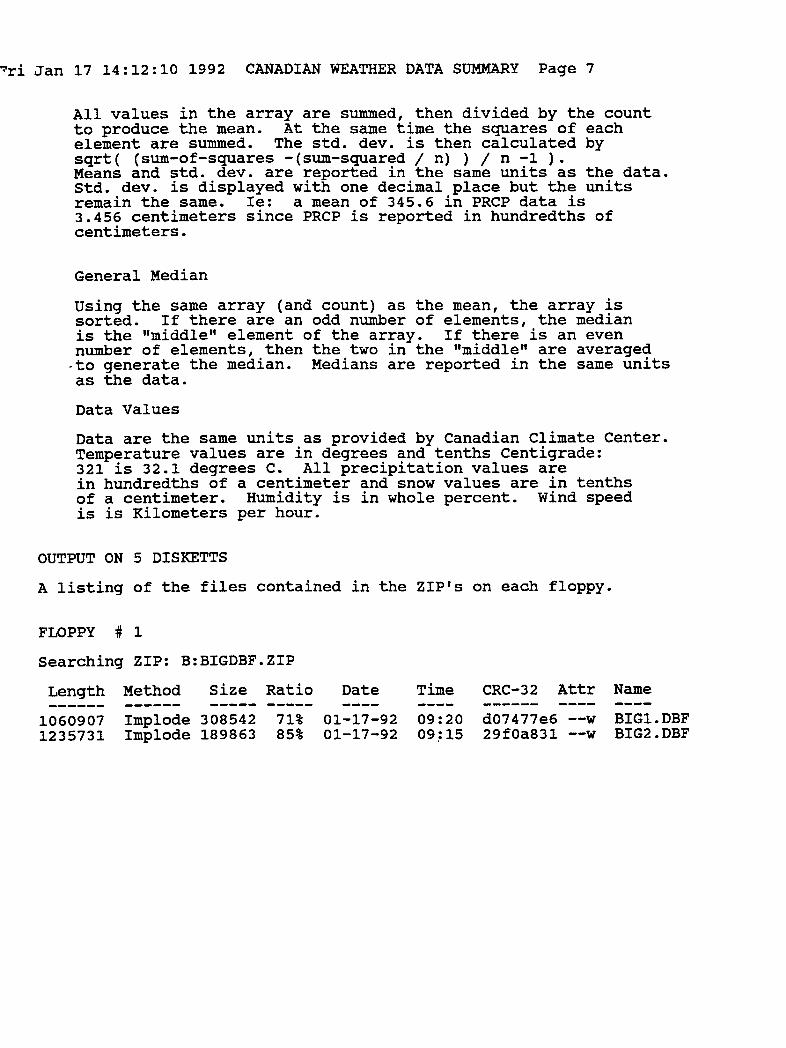
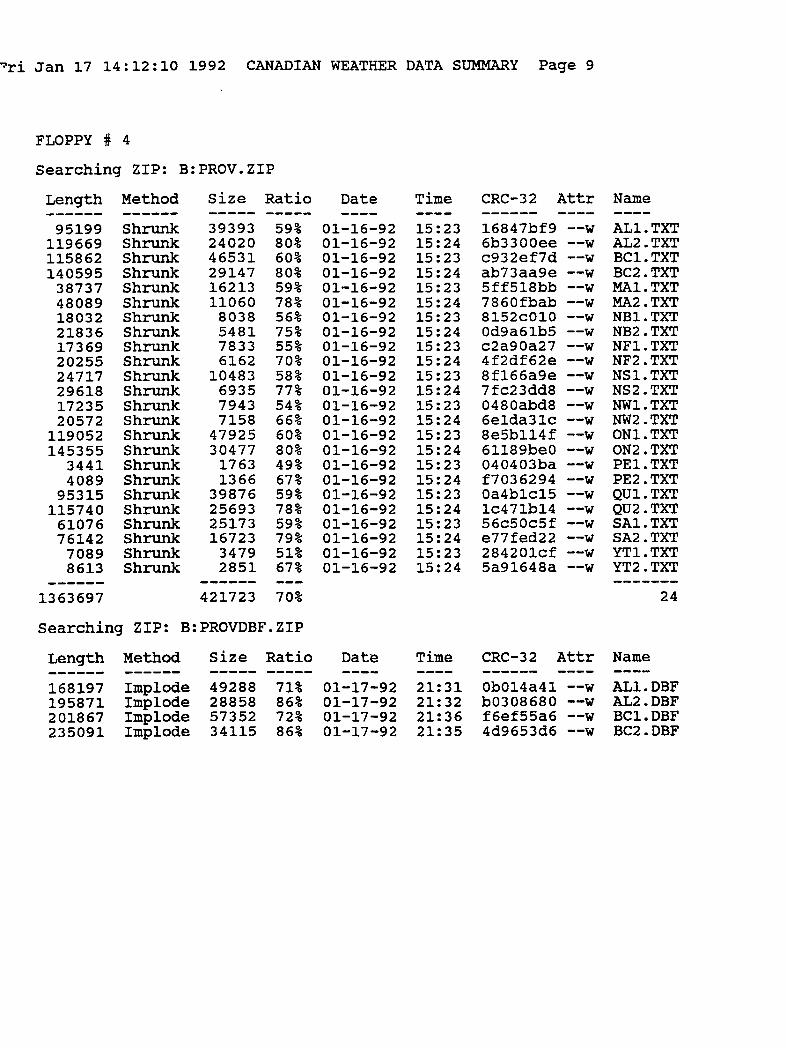
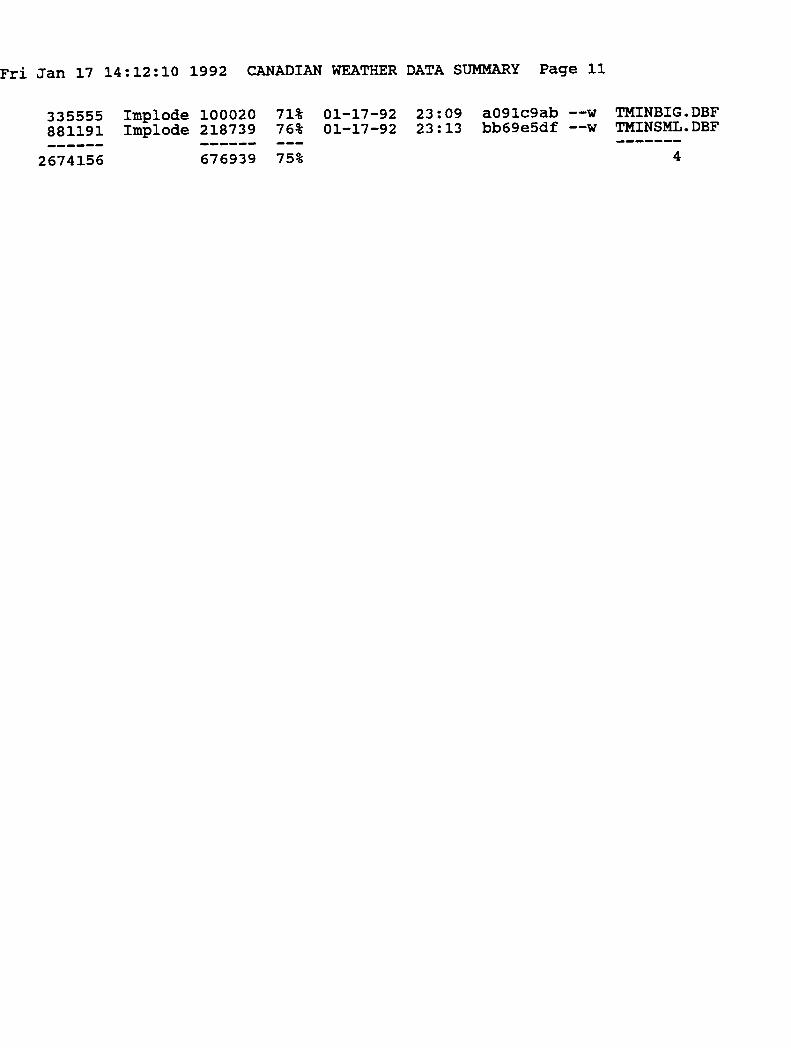
OUTPUT ON 5 DISKETTS
A listing of the files contained in the ZIP's on each floppy.
FLOPPY # 1
Searching ZIP: B:BIGDBF.ZIP
Length Method Size Ratio Date Time CRC-32 Attr Name