22
Development of Strategies to Increase Recycled Asphalt Pavement Mixtures in Oregon Erdem Coleri, Ph.D. Assistant Professor Shashwath Sreedhar, Sogol Haddadi, Matthew Haynes, and Sunny Lewis

Development of Strategies to Increase Recycled Asphalt Pavement Mixtures in
Oregon
Erdem Coleri, Ph.D. Assistant Professor
Shashwath Sreedhar, Sogol Haddadi, Matthew Haynes, and Sunny Lewis

OUTLINE
• INTRODUCTION AND LITERATURE REVIEW• EXPERIMENT TYPES AND OBJECTIVES
• BINDER GRADE AND BINDER CONTENT• BLENDING EVALUATION
• IMPACT OF ROUGHNESS AND STRUCTURALRESPONSE ON FUEL ECONOMY
• SUMMARY
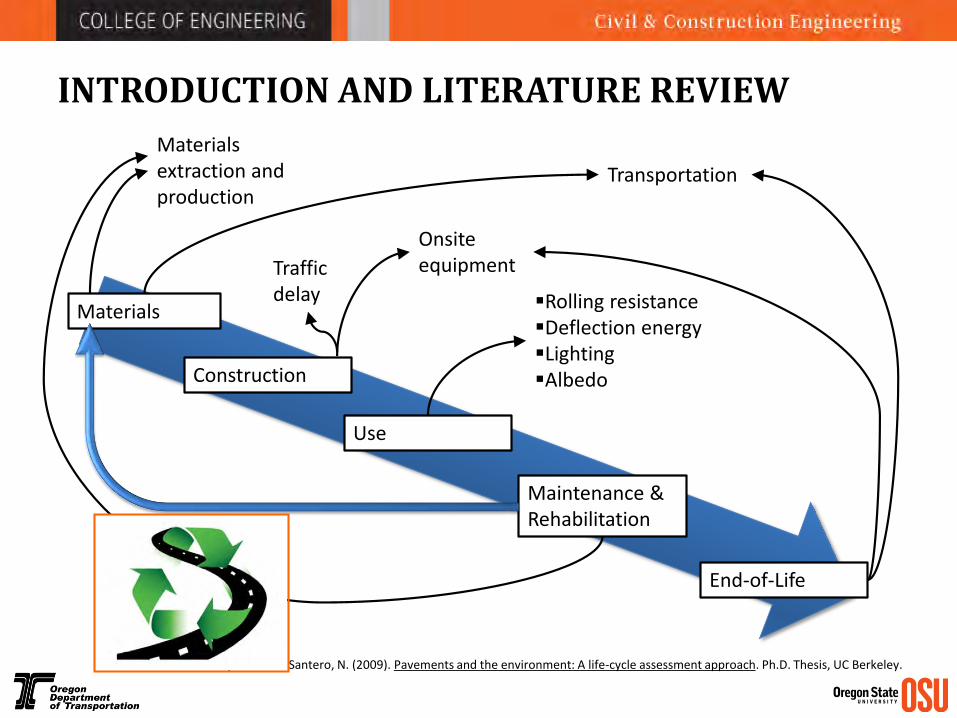
INTRODUCTION AND LITERATURE REVIEW
Materials
Construction
Use
Maintenance & Rehabilitation
End-of-Life
Materials extraction and production
Traffic delay
Onsite equipment
Transportation
Rolling resistanceDeflection energyLightingAlbedo
Adapted from: Santero, N. (2009). Pavements and the environment: A life-cycle assessment approach. Ph.D. Thesis, UC Berkeley.

An EPD (Environmental Product Declarations) is a third-party certified label that discloses the quantified environmental impacts of producing a product. • Primary energy (MJ) • Global warming potential • Ozone depletion• Acidification potential etc.
INTRODUCTION AND LITERATURE REVIEW
National Asphalt Pavement Association (NAPA) EPD Program
http://www.asphaltpavement.org/EPD

INTRODUCTION AND LITERATURE REVIEW
• Hansen and Copeland (2014)• In 2014, the use of RAP/RAS on U.S. roads displaced
20M barrels of oil and 68M tons of aggregate • A savings of $2.8B based on binder cost of $550/ton
and aggregate cost of $9.50/ton
• NCAT – Willis (2015)• Utilizing recycled asphalt results in a 9-26% energy
savings and a 5-29% reduction in CO2 emissions• A 19-42% energy savings and a 6-39% reduction in CO2
emissions were realized when using RAP along with locally sourced materials

INTRODUCTION AND LITERATURE REVIEW
HOW CAN WE INCREASE RAP CONTENT?
• Softer virgin binder grade (binder-grade bumping)
• Increased binder content• Recycling agents• Polymer and rubber modifiers• Warm mix asphalt
Currently 10 to 30% RAP is allowed. Higher RAP ~ Lower durability

INTRODUCTION AND LITERATURE REVIEW
OTHER BENEFITS OF INCREASED RAP?
• For the limited budget scenario, More recycling = reduced construction cost
= paving more roadway sections every year
= increased road user comfort
= reduced road used costs2 to 4% reduction in road user costs (NCHRP 720)

OUTLINE
• INTRODUCTION AND LITERATURE REVIEW• EXPERIMENT TYPES AND OBJECTIVES
• BINDER GRADE AND BINDER CONTENT• BLENDING EVALUATION
• IMPACT OF ROUGHNESS AND STRUCTURALRESPONSE ON FUEL ECONOMY
• SUMMARY

OREGON STATE UNIVERSITY ASPHALT MATERIALS
PERFORMANCE LABORATORY

OREGON STATE UNIVERSITY ASPHALT MATERIALS
PERFORMANCE LABORATORY

EXPERIMENTS USED IN THIS STUDYBEAM FATIGUE TEST

EXPERIMENTS USED IN THIS STUDYDYNAMIC MODULUS AND FLOW NUMBER TESTS
Dynamic modulus: Determine mix stiffness at different temperatures and load frequencies
Conduct flow number experiment at high temperatures to determine rutting resistance

OBJECTIVESRAP CONTENT, BINDER GRADE, AND BINDER CONTENT
• Identify the effects of binder-grade bumping and higher binder content on RAP/RAS performance
• Determine the impact of these alternatives on increasing RAP/RAS contents
• Evaluate the effect of blending on mixture performance
• Evaluate the cost and benefits of using binder-grade bumping and higher binder content to increase RAP/RAS.

INITIAL TEST RESULTS – SCB – FLEXIBILITY INDEX
0
5
10
15
20
25
30%RAP-6%AC 30%RAP-6.4%AC 30%RAP-6.8%AC 40%RAP-6%AC 40%RAP-6.4%AC 40%RAP-6.8%AC
Flex
ibili
ty In
dex
PG58-34
PG64-22
PG76-22
Perfect but what about rutting?
Limit for acceptance?

BLENDING EVALUATION
Image: Zhao et al. (2016) Materials and Design

Binder extraction
Binder recovery
BLENDING EVALUATION
OUTLINE
• INTRODUCTION AND LITERATURE REVIEW• EXPERIMENT TYPES AND OBJECTIVES
• BINDER GRADE AND BINDER CONTENT• BLENDING EVALUATION
• IMPACT OF ROUGHNESS AND STRUCTURALRESPONSE ON FUEL ECONOMY
• SUMMARY

IMPACT OF ROUGHNESS AND STRUCTURAL RESPONSE ON FUEL ECONOMY
UC DavisLead University
John Harvey Lead PI
Analyze how pavement structure affects vehicle fuel economy and GHG emissions through the pavement deflection and roughness.
Phase I: Work with modelers from OSU, MIT, and MSU to obtain the modeling results.
Phase II: Field experiments in California and verify the modeling results. Develop a database for fuel economy evaluation
Funded by Caltrans.

IMPACT OF ROUGHNESS AND STRUCTURAL RESPONSE ON FUEL ECONOMY
DEVELOPMENT OF DECISION-MAKING TOOLS
Road Length (miles)
Traffic (AADT)
Percent trucks (%)
Roughness (in/mile)
Condition
1 1 12,000 25% 130 65
2 1 40,000 25% 100 78
Target IRI = 60 in/mile
Road 1: Annual user cost benefit = (12,000 x 0.25 x 1 x 365 x 0.243) + (12,000 x 0.75 x 1 x 365 x 0.056) = 450,000$/mile
Road 2: Annual user cost benefit = (40,000 x 0.25 x 1 x 365 x 0.138) + (40,000 x 0.75 x 1 x 365 x 0.032) = 854,000$/mile
costs used are from World Bank HDM4
0.00
1.00
2.00
3.00
4.00
5.00
6.00
7.00
8.00
9.00
10.00
0 100 200 300 400 500 600
International Roughness Index (inches/mile)
Ro
ad
Us
er
Co
st
($/m
ile
)
Cars 2-axle
4-axle 5-axle
3-axle

Materials
Production
Construction
Operations
Preservation and
Rehabilitation
Reconstruction
and Recycling
Design
Rubberized asphalt
concrete
Permeable
pavements
Recycled asphalt
pavements
Pavement deflection
and fuel economyA decision making
tool
LIFE CYCLE ASSESSMENT
MORE FUEL EFFICIENT PAVEMENTS
• Sample preparation and testing will be completed soon
• Performance modeling and cost analysis will follow
• Development of a decision making tool to quantify benefits of RAP – Pactrans research project
SUMMARY

GO BEAVS!
Q & AThank you!
This study is sponsored by Oregon Department of Transportation (ODOT). This funding is gratefully acknowledged.


