Development of the Eating Choices Index (ECI)
GK Pot1, CJ Prynne1, M Richards2, AM Stephen1
1MRC Human Nutrition Research, Cambridge UK
2MRC Unit for Lifelong Health and Ageing, London UK
Background
• Capture diet in one measure
• Numerous diet quality tools:
• Healthy Eating Index (HEI)
• Mediterranean Diet Score (MDS), etc.
• Mostly targeted at meeting recommendations in terms of nutrients or consumption of specific types of food
• Existing diet indices not aimed at dietary behaviour
Objective
• To develop an score that
• discriminates between overall healthy and unhealthy dietary behaviour
• can be applied to dietary assessments of various types (including diet diaries and repeated 24HR)
• can also be used as a short questionnaire to categorise individuals in large surveys
Elements of Eating Choices Index (ECI)
1. Frequency of Breakfast consumption
• Important indicator of healthy diet
• Often not assessed in FFQs
2. Type of milk
• Consumption of low-fat milk associated with overall dietary intake lower in fat and higher in fibre
3. Type of bread
• Associated with improved dietary quality
4. Fruit intake
• Important component of healthy diet
• Easier to quantify than vegetable intake
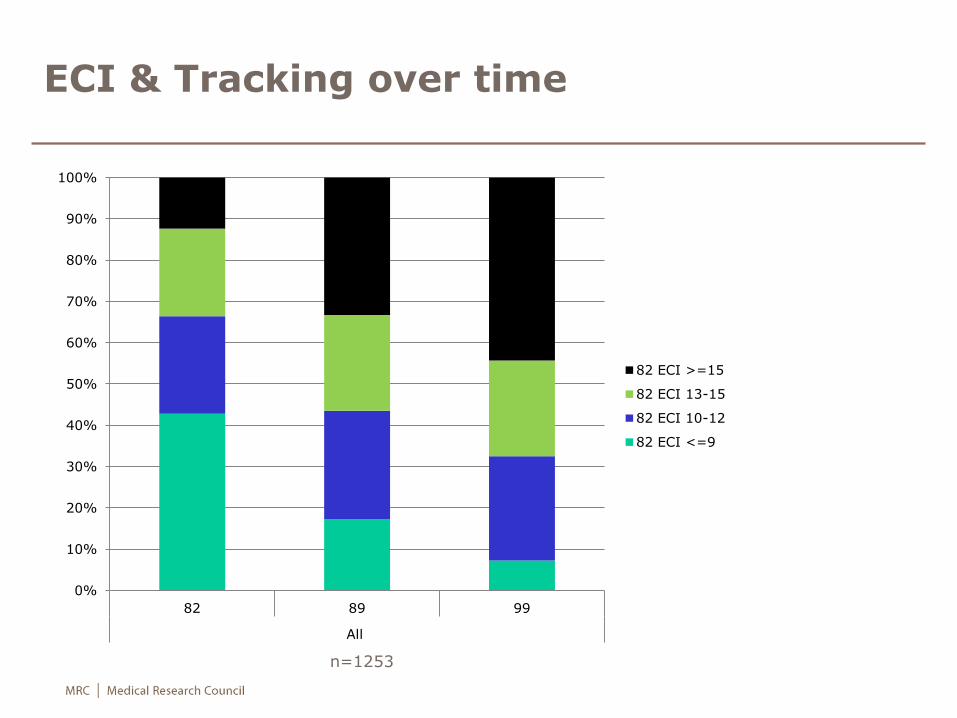
MRC National Survey of Health and Development 1946 British Birth Cohort
1946 Birth
36 4 BF M 43 53
= Dietary Assessment
63
2007-1
1
n=2256
n=1253
N=16,695
n=5632
http://www.nshd.mrc.ac.uk/default.aspx
Components of Eating Choices Index (ECI)
Factor Factor name Category 1 Category 2 Category 3 Category 4 Category 5
1 Frequency of
Breakfast
No days Some days
but not all
days
All days
Score 1 3 5
2 Type of milk
consumed
Whole (min
3.5%) only
Some whole,
some semi-
skimmed (1.7%)
1.Semi-
skimmed only
Some semi-
skimmed, some
skimmed
Skimmed
only (0.1%)
Score 1 2 3 4 5
3 Type of bread
consumed
White only Some white,
some brown or
granary
1.Brown or
granary only
2. Some
white, some
wholemeal
Some brown or
granary, some
wholemeal
Wholemeal
only
Score 1 2 3 4 5
4 Fruit intake
portions (per day)
0 >0 <1 1 >1 ≤ 2 ≥3
Score 1 2 3 4 5
Higher score, healthier dietary behaviour
Methods
• Correlations and quartiles of ECI score with indicator nutrients including macronutrients, and fibre, vitamin C, iron, calcium and folate
• Tracking over time (n=1253)
• Exploration of subgroup analyses of
• Low and high social class (manual vs. non-manual)
• BMI (based on WHO cut-offs)
• Four fruits vs. total fruits
Components of ECI
0 2 4 6 8 10 12 14
ECI
Fruit factor
Bread factor
Milk factor
Breakfast factor
ECI score
Women
Men
ECI correlates well with macronutrients
r CHO
All 0.25
Men 0.26
Women 0.22
r Protein
All 0.18
Men 0.13
Women 0.21
34
35
36
37
38
39
40
41
42
43
q1 q2 q3 q4 q1 q2 q3 q4 q1 q2 q3 q4
ALL men women
Fat
(%
FE
)
Fat (%food energy)
r Fat
All -0.22
Men -0.13
Women -0.31
Similar for protein
35
36
37
38
39
40
41
42
43
44
45
q1 q2 q3 q4 q1 q2 q3 q4 q1 q2 q3 q4
ALL men women
Carb
oh
yd
rate
(%
FE
)
Carbohydrate (% food energy)
0
2
4
6
8
10
12
14
16
18
20
q1 q2 q3 q4 q1 q2 q3 q4 q1 q2 q3 q4
ALL men women
Fibre: Total NSP (g/d)
ECI correlates well with fibre and micronutrients
All Men Women
NSP 0.51 0.53 0.54
Vitamin C 0.37 0.37 0.37
Iron 0.29 0.35 0.35
Calcium 0.24 0.25 0.32
Folate 0.21 0.21 0.35
ECI & Tracking over time
0%
10%
20%
30%
40%
50%
60%
70%
80%
90%
100%
82 89 99
All
82 ECI >=15
82 ECI 13-15
82 ECI 10-12
82 ECI <=9
n=1253
ECI and socio-economic status
P trend <0.001
In 1989, 43y
n=432 n=565 n=492 n=615
Missing data n=152
0%
10%
20%
30%
40%
50%
60%
70%
80%
90%
100%
89 ECI <=9 89 ECI 10-12 89 ECI 13-15 89 ECI >=15
Manual
Non manual
ECI and BMI
P trend <0.001
In 1989, 43y
Missing data n=13
n=615 n=432 n=565 n=492
0%
10%
20%
30%
40%
50%
60%
70%
80%
90%
100%
ECI <=9 ECI 10-12 ECI 13-15 ECI >=15
obese (>=30.0)
overweight (25-29.9)
normal weight (18.5-24.9)
underweight (<18.5)
Four fruits vs. total fruit
• 64% of total fruit intake from four fruits: apples, pears, bananas, and oranges
• Correlations with indicator nutrients very similar
Nutrient r ECI four fruits r ECI total fruit
Fat (% FE) -0.22* -0.22*
Protein (% FE) 0.15* 0.18*
CHO (% FE) 0.29* 0.25*
NSP # 0.51* 0.51*
Vitamin C # 0.32* 0.37*
Iron 0.29* 0.29*
Calcium 0.25* 0.24*
Folate 0.23* 0.21*
# data transformed, * p< 0.001
Discussion
• Generalizability
• Comparison to other ‘Diet quality’ scores
• Tracking over time:
• Changes in food availability
• Dietary recommendations
• Ageing of population
• Total fruit consumption vs. four fruits
Conclusion
• We have developed a score that
• Discriminates between overall healthy and unhealthy behaviour
• Can be applied to dietary assessments of various types
• Can also be used as a short questionnaire to categorise individuals in large surveys
• Next
• Validate as short questionnaire
• Relate to health outcomes longitudinally
• Examine in other population groups
Acknowledgements
• NSHD cohort members
• NSHD Interviewers & Researchers
• MRC Unit for Lifelong Health and Ageing