1 Development of Wireless Sensor Networks for Underground Communication and Monitoring Systems (The Cases of Underground Mine Environments) Mohammad Ali Moridi a , Mostafa Sharifzadeh a , Youhei Kawamura b , Jang Hyongdoo a a Department of Mining Engineering and Metallurgy Engineering, Western Australian School of Mines (WASM), Curtin University, 6433, Australia b Graduate School of Engineering and Resource Science Department of Materials-process Engineering and Applied Chemistry Environment, Akita University, 010-8502, Japan Abstract The challenges of maintaining safe workplaces and improving operations and services in underground mines are unique. These have largely been mitigated by implementing new technology of wireless sensor networks (WSNs) in the last few years. Establishment and development of a reliable monitoring and communication network through such hostile environments are still major concerns. In this study, a more comprehensive monitoring and communication system for underground mine environments using ZigBee network are developed. To this regard, experiments with real systems and prototypes are applied. The controllable and uncontrollable parameters of both underground environment and network for the establishment of ZigBee network are also assessed. Then, a practical method to design a model of an underground mine monitoring and communication system is proposed. This model was verified by testing system functions and applications for example, temperature, humidity and illumination readings, text messaging, and controlling ventilation fans throughout an underground mine in Western Australia. The monitoring and communication systems operated successfully and it demonstrated the reliable outcomes of their function and application for underground mines. Key words: underground mine, monitoring and communication system, wireless sensor network, ZigBee network
Transcript
1
Development of Wireless Sensor Networks for Underground Communication and
Monitoring Systems (The Cases of Underground Mine Environments)
Mohammad Ali Moridi a, Mostafa Sharifzadeh a, Youhei Kawamura b, Jang Hyongdoo a
a Department of Mining Engineering and Metallurgy Engineering, Western Australian School of Mines (WASM),
Curtin University, 6433, Australia b Graduate School of Engineering and Resource Science Department of Materials-process Engineering and
Applied Chemistry Environment, Akita University, 010-8502, Japan
Abstract
The challenges of maintaining safe workplaces and improving operations and services in
underground mines are unique. These have largely been mitigated by implementing new
technology of wireless sensor networks (WSNs) in the last few years. Establishment and
development of a reliable monitoring and communication network through such hostile
environments are still major concerns. In this study, a more comprehensive monitoring and
communication system for underground mine environments using ZigBee network are
developed. To this regard, experiments with real systems and prototypes are applied. The
controllable and uncontrollable parameters of both underground environment and network
for the establishment of ZigBee network are also assessed. Then, a practical method to
design a model of an underground mine monitoring and communication system is proposed.
This model was verified by testing system functions and applications for example,
temperature, humidity and illumination readings, text messaging, and controlling ventilation
fans throughout an underground mine in Western Australia. The monitoring and
communication systems operated successfully and it demonstrated the reliable outcomes of
their function and application for underground mines.
Key words: underground mine, monitoring and communication system, wireless sensor
network, ZigBee network
2
1 Introduction
The development of a wireless sensor network (WSN) model is hugely beneficial for the
practical design of underground mine monitoring and communication systems. This is
mostly owing to the large variety of networking variables, the rapid technological
advancement of sensor nodes, and considerable changes in environmental parameters from
one mine site to another one.
Thus, a recognition of entire variables is a key component for the evaluation of the reliability
of the WSNs’ functions and applications in an underground mine. Ben Maissa, Kordon,
Mouline, and Thierry-Mieg (2013) emphasised the necessity of investing in WSNs’
performance, based on model analysis and validation, before handling more critical
functions. Stanley-Marbell et al. (2008) observed the impact of the WSNs’ operation taking
into account the variables of the hardware, software and physical limitations. They focused
on the importance of recognising the uncontrollable parameters of the environment and run-
time parameters in order to develop a more realistic model and evaluate the performance of
WSNs under a system model. This work attempted to provide models of WSNs which
predicted system properties and challenges associated with cost and time effectiveness on a
real project. This study will demonstrate a practical system design for establishing a reliable
WSN for required underground functions and applications in underground environments. In
particular, it shows that how the confirmation and calibration of a WSN model using ZigBee
network is developed based on the field investigations. The controllable and uncontrollable
parameters of both the network and underground environments are considered so as to
establish and further develop wireless monitoring and communication systems in
underground openings.
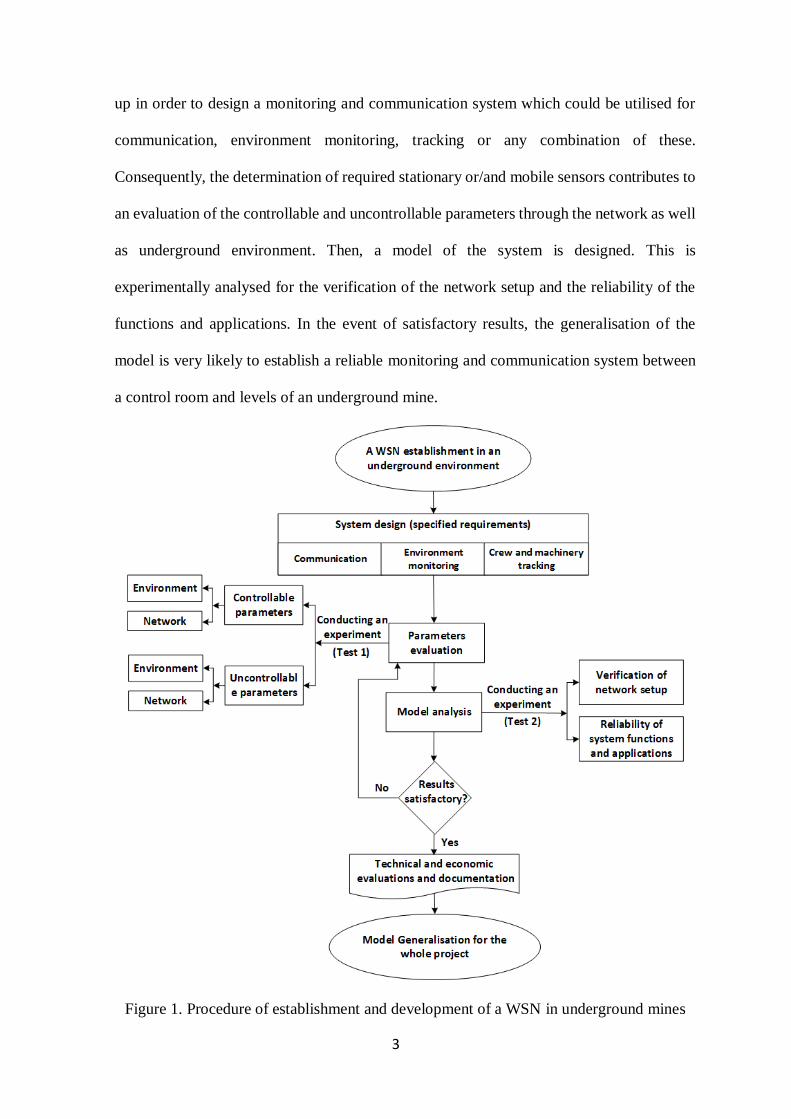
The procedure of establishment and development of a WSN in an underground mine is
illustrated in Figure 1. The specification of the underground network should be first drawn
3
up in order to design a monitoring and communication system which could be utilised for
communication, environment monitoring, tracking or any combination of these.
Consequently, the determination of required stationary or/and mobile sensors contributes to
an evaluation of the controllable and uncontrollable parameters through the network as well
as underground environment. Then, a model of the system is designed. This is
experimentally analysed for the verification of the network setup and the reliability of the
functions and applications. In the event of satisfactory results, the generalisation of the
model is very likely to establish a reliable monitoring and communication system between
a control room and levels of an underground mine.
Figure 1. Procedure of establishment and development of a WSN in underground mines
4
The remainder of this paper is organised as follows. The effective parameters for the
establishment of a ZigBee network in an underground mine is first evaluated. Then, a system
design and model is developed based on the classification of results from an experiment
undertaken at an underground mine in Western Australia. Following that, another
experiment is conducted to physically verify the reliability of the proposed ZigBee network
model in this particular mine. This is performed by testing the system’s functions and
applications including messages texting and controlling ventilation fan operations as a
model. Finally, the results of experiments are discussed with a subsequent of the directional
line of sight and non-line of sight and the position of the nodes.
2 ZigBee Network Modelling in Underground Mines
In order to implement an underground monitoring and communication system, building a
model is necessary for the assessment of technical and economic evaluations. This is based
on determining required functions and applications, and the recognition of the variables of
network metrics and environmental variables in the specified environment.
2.1 Parameters evaluation
Moridi, Kawamura, Sharifzadeh, Chanda, and Jang (2014) selected and simulated ZigBee
networks for monitoring and communication in underground environments and concluded
that recognising and assessing the effective parameters is crucial in a network design. Zarei,
Uromeihy, and Sharifzadeh (2013) posited a method for assessing the principal parameters
of tunnels water inflow. Accordingly, the controllable and uncontrollable parameters of a
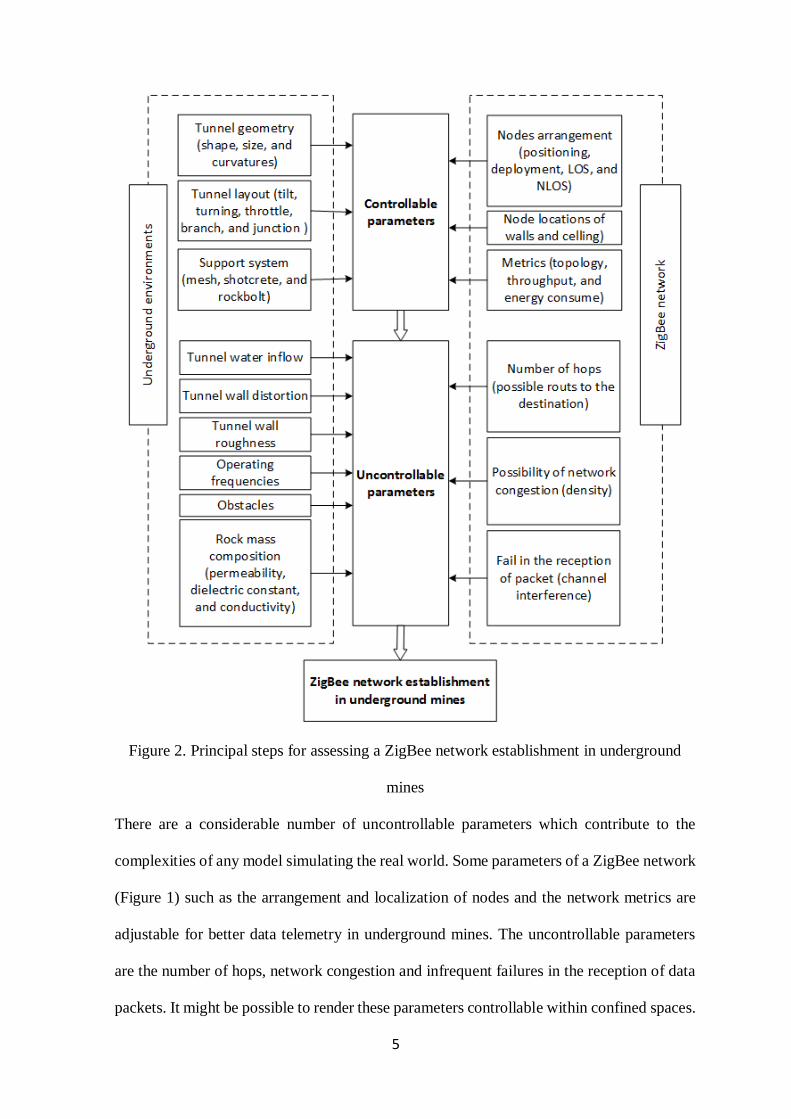
ZigBee network and the surrounding environment are illustrated in Figure 2.
5
Figure 2. Principal steps for assessing a ZigBee network establishment in underground
mines
There are a considerable number of uncontrollable parameters which contribute to the
complexities of any model simulating the real world. Some parameters of a ZigBee network
(Figure 1) such as the arrangement and localization of nodes and the network metrics are
adjustable for better data telemetry in underground mines. The uncontrollable parameters
are the number of hops, network congestion and infrequent failures in the reception of data
packets. It might be possible to render these parameters controllable within confined spaces.
6
There are also environmental variables of tunnels that are uncontrollable in ZigBee network
design as opposed to the known or controllable parameters of tunnel geometry, layout and
employed system support. Such uncontrollable parameters include the rate of water inflow
fluctuation, the degree of wall surface distortion and roughness, the radio frequency
interferences of operating and communication systems, obstacles like dump trucks, boggers,
and air compressors, as well as the variation rate of permeability, dielectric constants, and
conductivity in the surrounding rock mass along openings.
Therefore, a ZigBee network can efficiently be established after determining the
underground effective parameters that influence ZigBee communication signals, and finding
the maximum reliable communication distance between nodes in different underground
openings with all variables considered. Thus, quantifying all of the above parameters is a
prerequisite for the design of a reliable ZigBee network for underground openings.
2.2 System design and modelling
In order to design an underground monitoring and communication system using a ZigBee
network, the system design criteria must be selected based on the results of the entire
network behaviour experiment at that particular level of the underground mine. The conduct
of such an experiment is crucial because of varying effects of underground environmental
features and ongoing mining on the complexity of radio communication distances.
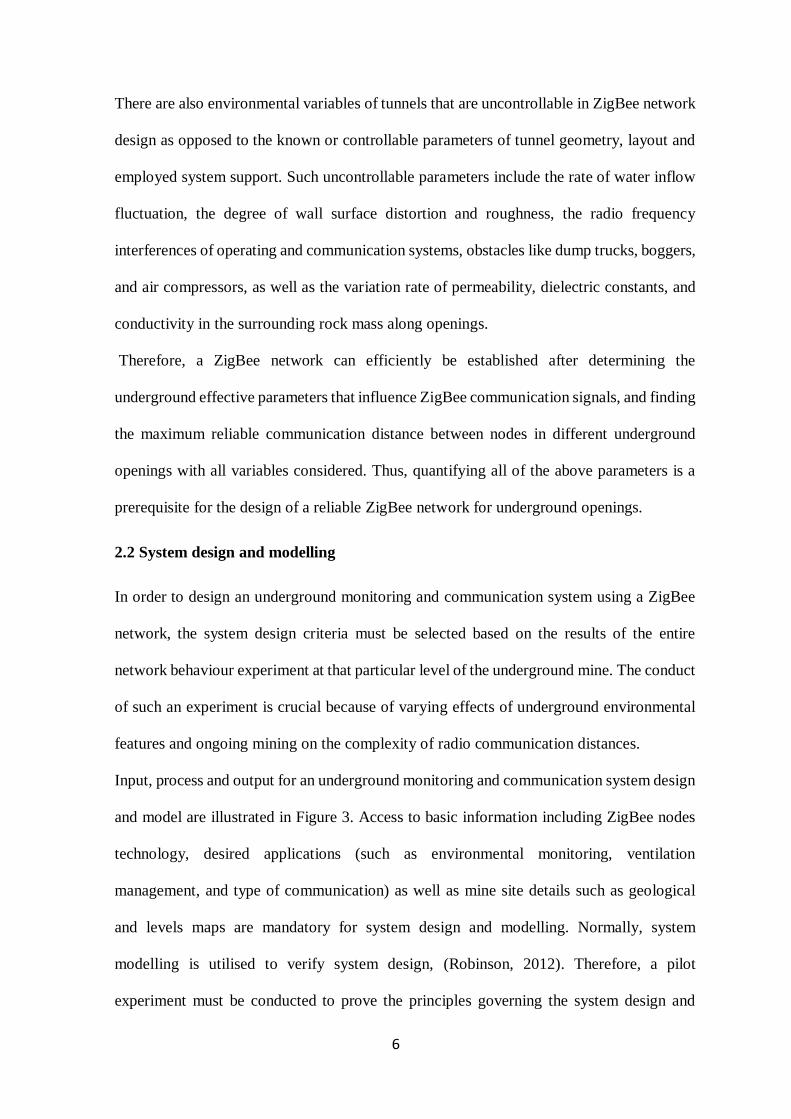
Input, process and output for an underground monitoring and communication system design
and model are illustrated in Figure 3. Access to basic information including ZigBee nodes
technology, desired applications (such as environmental monitoring, ventilation
management, and type of communication) as well as mine site details such as geological
and levels maps are mandatory for system design and modelling. Normally, system
modelling is utilised to verify system design, (Robinson, 2012). Therefore, a pilot
experiment must be conducted to prove the principles governing the system design and
7
modelling of an underground ZigBee network. The output of the model will lead to a reliable
indicative outcome for required functions and applications.
Figure 3. Diagram of system design and model of an underground mine monitoring and
communication system
2.3 Model generalisation
The aim of generalising the ZigBee model in underground mines is to be able to implement
a systematic feasibility study of technical and economic evaluations, based on the system
design and modelled results. This procedure is illustrated in Figure 1. Investigations of the
ZigBee network model applied in underground spaces can be empirically verified.
Numerous running and adjusting ZigBee functions and applications may be required before
an adequately reliable system design is achieved. Results documentation of the process
would undoubtedly be valuable to justify any investment which might convince mine
managers of the benefits of such an innovative system.
3 Case study I - An Underground Environment Experiment for System Design
An experiment is designed to investigate the reliability of a wireless underground mine
monitoring and communication system. To this end, the maximum distance of radio
8
communication is evaluated in different conditions of underground environments and
ZigBee nodes arrangement and location. After analysis of the measurements and
classification of results, the system design for a reliable ZigBee network can be developed
for underground application.
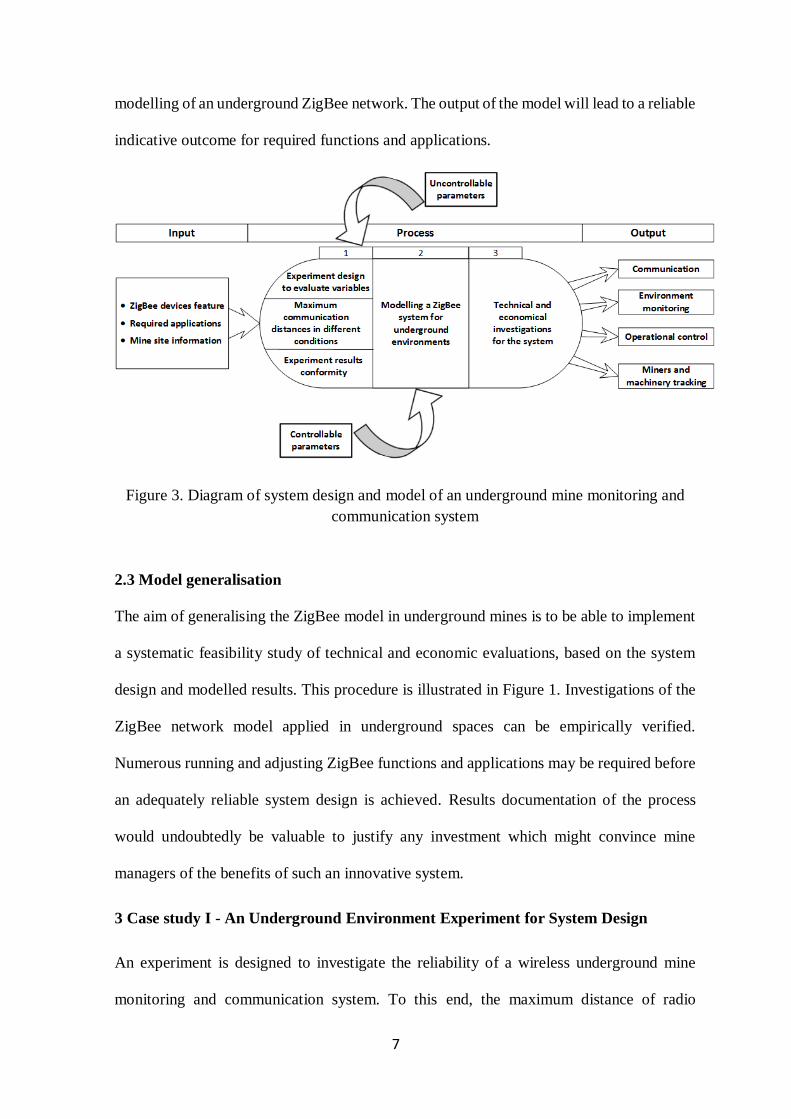
An experiment was conducted in Tunnel 11 at level 9415 of a nickel underground mine in
Western Australia at a depth of approximately 1000 metres. A layout of the test location in
this level is illustrated in Figure 4. The test lines in the experiment were conducted in two
accesses (415 and 390) of this tunnel. Access 415 is a straight opening whereas access 390
is a curved opening.
Figure 4. Layout of test location in tunnel 11at level 9415m
3.1 Experiment preparation
In this experiment, IEEE 802.15.4 standard and ZigBee evaluation development kit (EDK)
based on TOCOS engine were employed. One ZigBee Coordinator (TWE-EK-002-LCD-SIP),
two ZigBee routers (TWE-EK-002-NLC-SIP), one laptop with software development
environment (SDK), the TOCOS-TagViewer, two tripods, and one measurement tape were
used. The employed ZigBee router (node) uses a default maximum transmitting power of 3
9
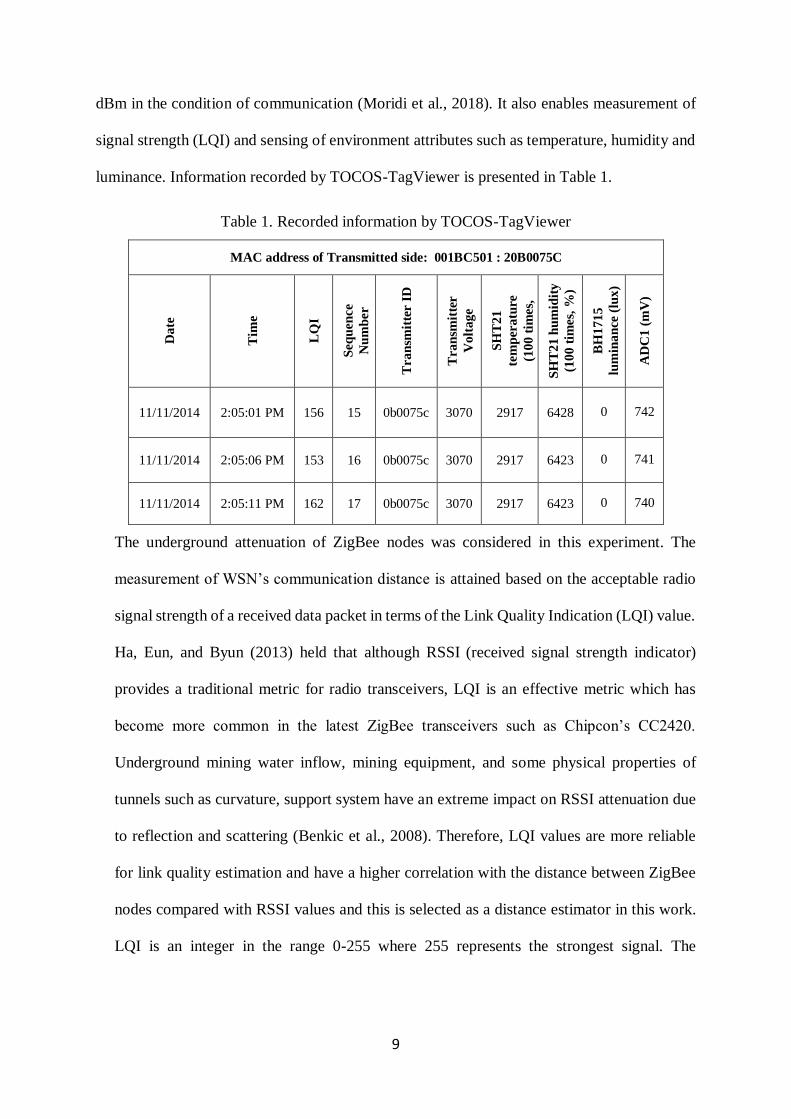
dBm in the condition of communication (Moridi et al., 2018). It also enables measurement of
signal strength (LQI) and sensing of environment attributes such as temperature, humidity and
luminance. Information recorded by TOCOS-TagViewer is presented in Table 1.
Table 1. Recorded information by TOCOS-TagViewer
MAC address of Transmitted side: 001BC501 : 20B0075C
The underground attenuation of ZigBee nodes was considered in this experiment. The
measurement of WSN’s communication distance is attained based on the acceptable radio
signal strength of a received data packet in terms of the Link Quality Indication (LQI) value.
Ha, Eun, and Byun (2013) held that although RSSI (received signal strength indicator)
provides a traditional metric for radio transceivers, LQI is an effective metric which has
become more common in the latest ZigBee transceivers such as Chipcon’s CC2420.
Underground mining water inflow, mining equipment, and some physical properties of
tunnels such as curvature, support system have an extreme impact on RSSI attenuation due
to reflection and scattering (Benkic et al., 2008). Therefore, LQI values are more reliable
for link quality estimation and have a higher correlation with the distance between ZigBee
nodes compared with RSSI values and this is selected as a distance estimator in this work.
LQI is an integer in the range 0-255 where 255 represents the strongest signal. The
10
relationship between the LQI value and the detected power, P, in dBm for the ZigBee node
in this experiment (JN5148), is approximately given by equation (1).
P= (7*LQI – 1970)/20 Equation (1)
Equation (1) is valid for 0 < LQI < 255. Reliable LQI for certain data transmission between
ZigBee nodes is practically assumed to be greater than 50 or over -80 dBm of RSSI values
(Moridi et al., 2014). Therefore, the recorded information in this experiment would be
analysed on this basis.
The experiment investigated the attenuation tendency of radio wave intensity. This includes
the estimation method of the maximum distance between ZigBee nodes in the different
underground conditions based on appropriate LQI for being cognisant of identifiable
variables. For this purpose, the test lines were designed where the distance between the two
ZigBee nodes increases continuously at certain intervals until the LQI drops lower than the
specified limit.
The procedure for LQI measurements in Tunnel 11 of the nickel mine are illustrated in
Figure 5. In this procedure, the coordinator was connected to the laptop (PC) for recording
data while the ZigBee nodes were mounted on tripods to gauge signal strength. For
consistency of the results, the measurements were repeated at least 5 times for each interval.
11
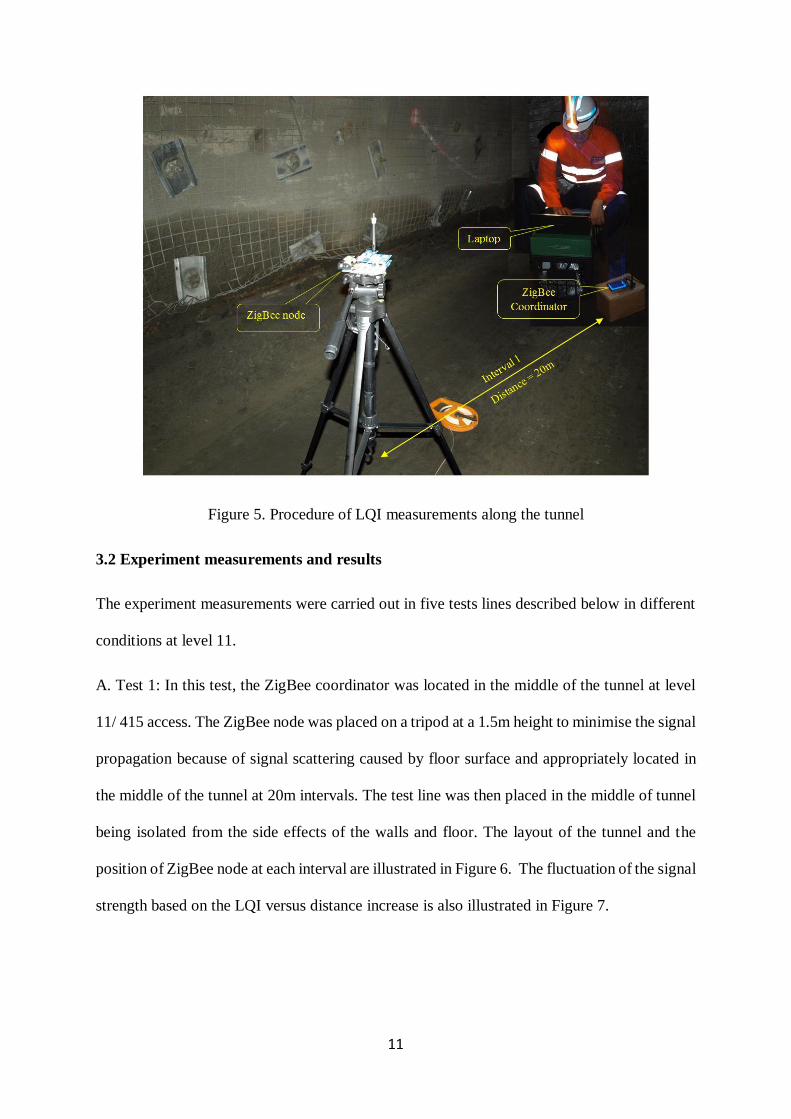
Figure 5. Procedure of LQI measurements along the tunnel
3.2 Experiment measurements and results
The experiment measurements were carried out in five tests lines described below in different
conditions at level 11.
A. Test 1: In this test, the ZigBee coordinator was located in the middle of the tunnel at level
11/ 415 access. The ZigBee node was placed on a tripod at a 1.5m height to minimise the signal
propagation because of signal scattering caused by floor surface and appropriately located in
the middle of the tunnel at 20m intervals. The test line was then placed in the middle of tunnel
being isolated from the side effects of the walls and floor. The layout of the tunnel and the
position of ZigBee node at each interval are illustrated in Figure 6. The fluctuation of the signal
strength based on the LQI versus distance increase is also illustrated in Figure 7.
12
Figure 6. Position of the ZigBee node and coordinator at the specified intervals in Test 1
Figure 7. Signal strength based on the LQI versus distance increase in Test 1
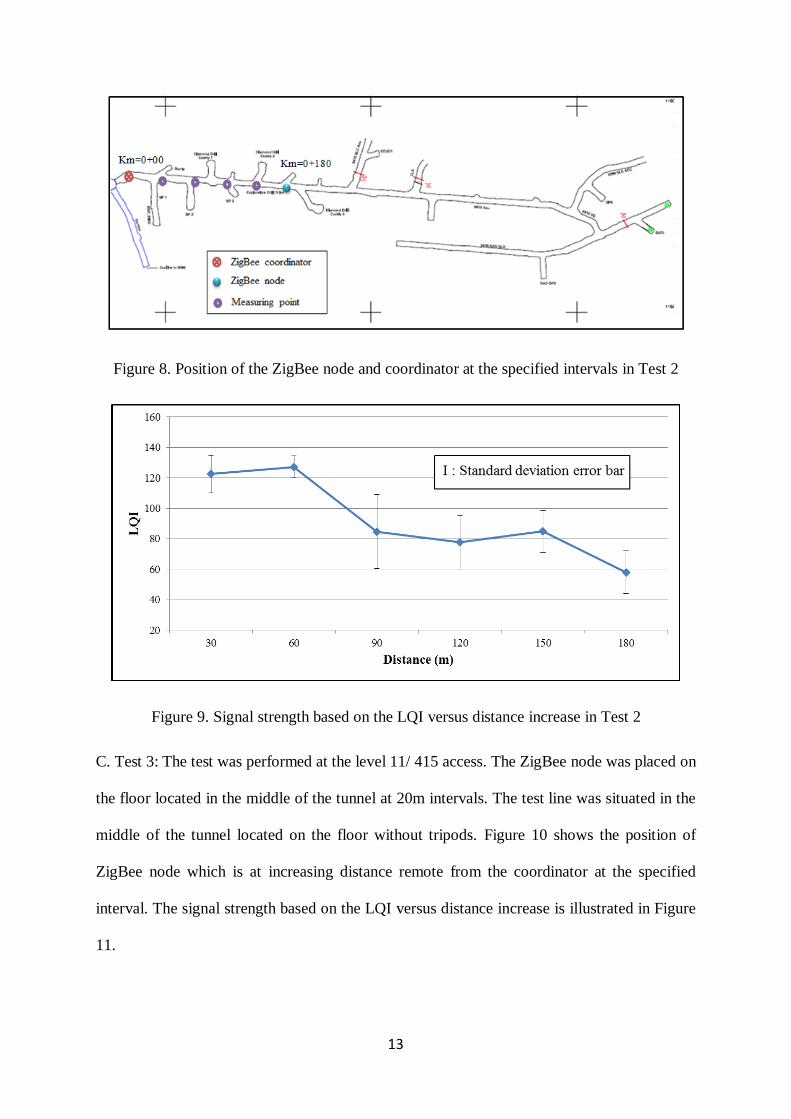
B. Test 2: The test was performed at the level 11/ 415 access and a ZigBee node was placed on
the tripod located close to the tunnel wall at 30m intervals. The coordinator was also close to
the wall. The test line was straight and located nearby the tunnel wall. Figure 8 shows the
position of the ZigBee node with increasing distance remote from the coordinator at the
specified interval. The signal strength based on the LQI versus distance increased is also
illustrated in Figure 9.
13
Figure 8. Position of the ZigBee node and coordinator at the specified intervals in Test 2
Figure 9. Signal strength based on the LQI versus distance increase in Test 2
C. Test 3: The test was performed at the level 11/ 415 access. The ZigBee node was placed on
the floor located in the middle of the tunnel at 20m intervals. The test line was situated in the
middle of the tunnel located on the floor without tripods. Figure 10 shows the position of
ZigBee node which is at increasing distance remote from the coordinator at the specified
interval. The signal strength based on the LQI versus distance increase is illustrated in Figure
11.
14
Figure 10. Position of the ZigBee node and coordinator at the specified intervals in Test 3
Figure 11. Signal strength based on the LQI versus distance increase in Test 3
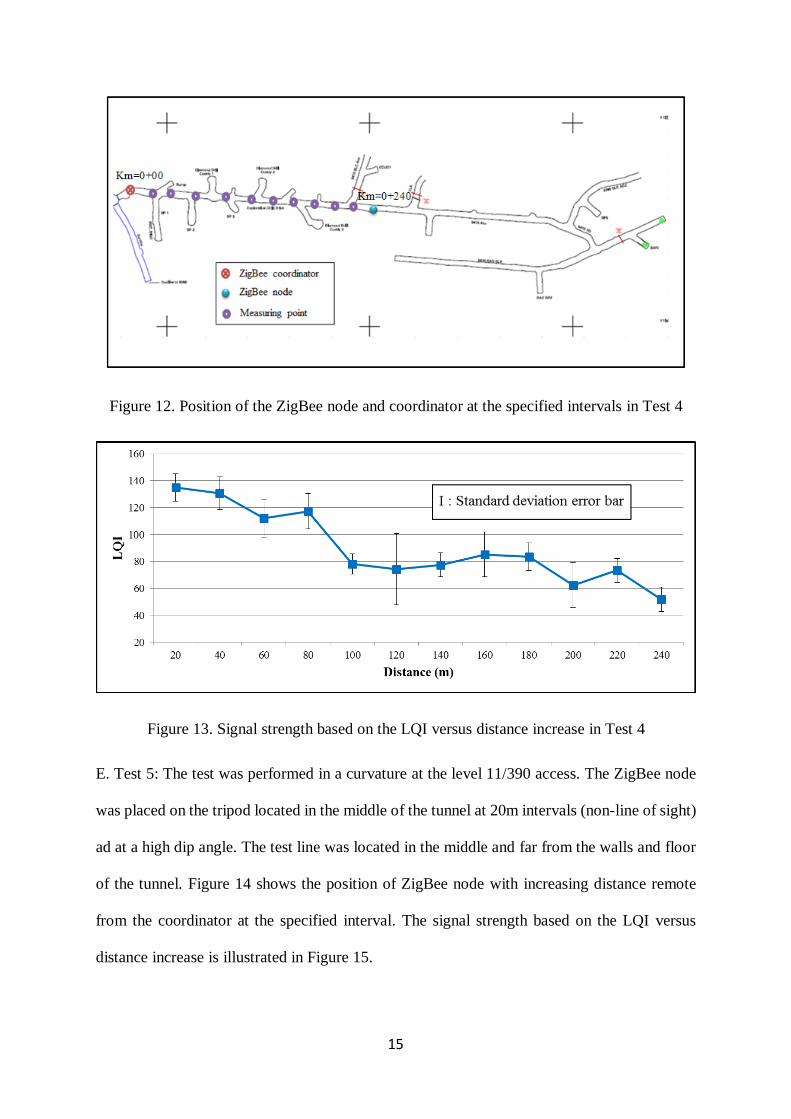
D. Test 4: The test was performed at the level 11/ 415 access. The ZigBee node was placed on
the tripod located close to the tunnel wall at 20m intervals. The coordinator was on the opposite
side to the node position (non-line of sight). Figure 12 shows the position of ZigBee node with
increasing distance remote from the coordinator at the specified interval. The signal strength
based on the LQI versus distance increase is illustrated in Figure 13.
15
Figure 12. Position of the ZigBee node and coordinator at the specified intervals in Test 4
Figure 13. Signal strength based on the LQI versus distance increase in Test 4
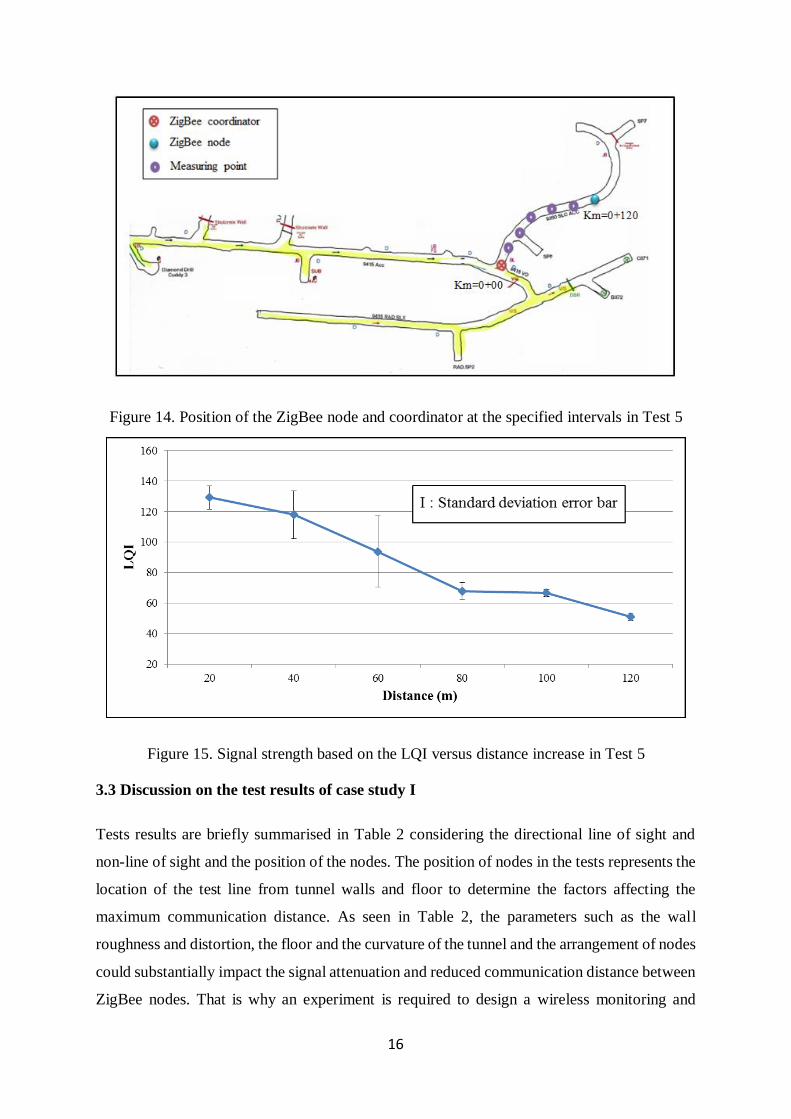
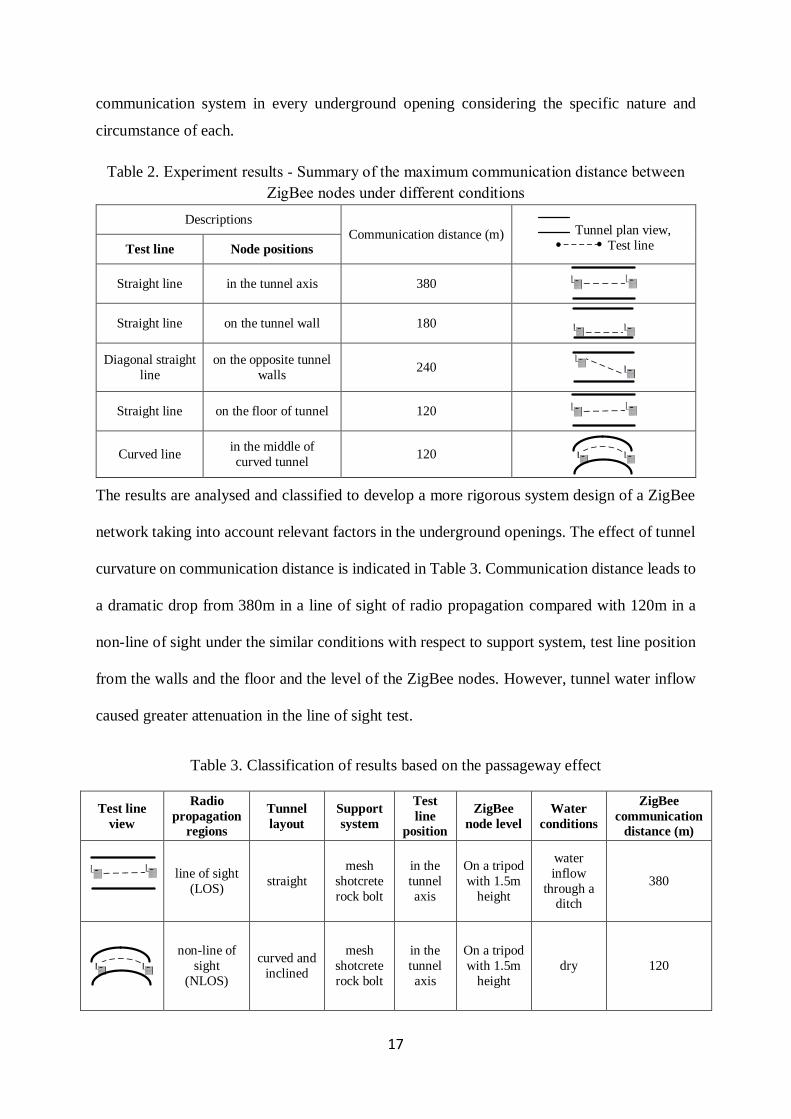
E. Test 5: The test was performed in a curvature at the level 11/390 access. The ZigBee node
was placed on the tripod located in the middle of the tunnel at 20m intervals (non-line of sight)
ad at a high dip angle. The test line was located in the middle and far from the walls and floor
of the tunnel. Figure 14 shows the position of ZigBee node with increasing distance remote
from the coordinator at the specified interval. The signal strength based on the LQI versus
distance increase is illustrated in Figure 15.
16
Figure 14. Position of the ZigBee node and coordinator at the specified intervals in Test 5
Figure 15. Signal strength based on the LQI versus distance increase in Test 5
3.3 Discussion on the test results of case study I
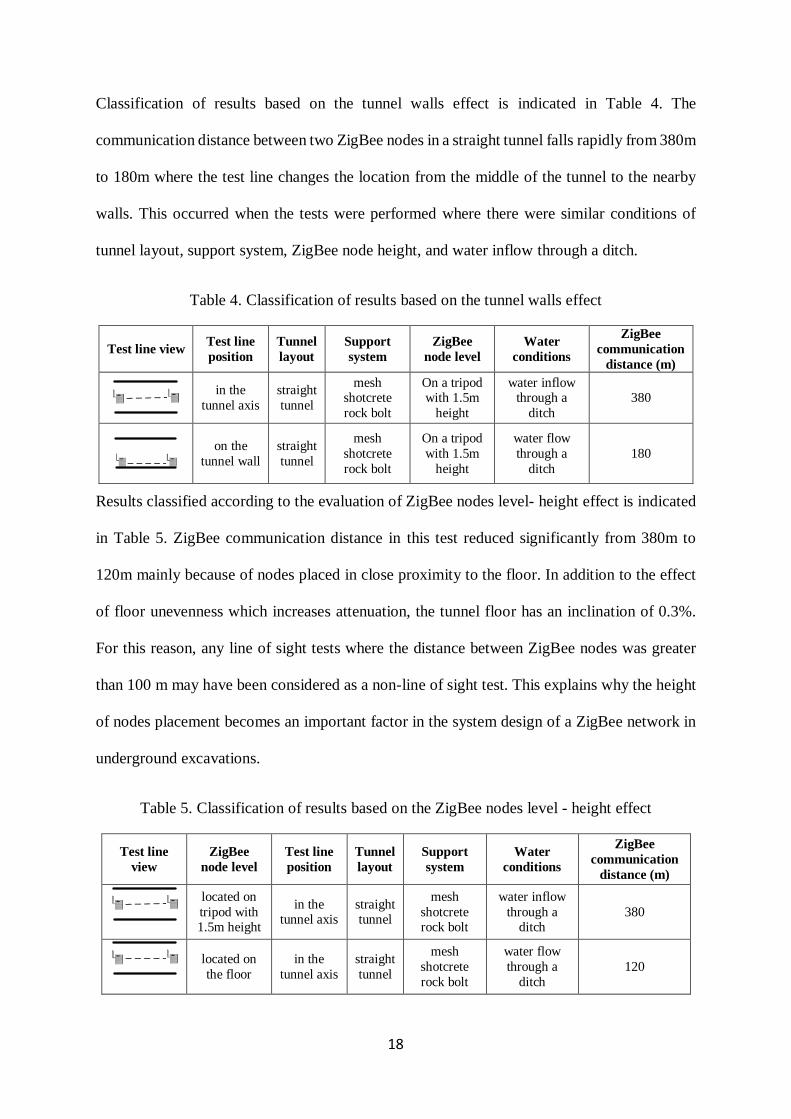
Tests results are briefly summarised in Table 2 considering the directional line of sight and
non-line of sight and the position of the nodes. The position of nodes in the tests represents the
location of the test line from tunnel walls and floor to determine the factors affecting the
maximum communication distance. As seen in Table 2, the parameters such as the wall
roughness and distortion, the floor and the curvature of the tunnel and the arrangement of nodes
could substantially impact the signal attenuation and reduced communication distance between
ZigBee nodes. That is why an experiment is required to design a wireless monitoring and
17
communication system in every underground opening considering the specific nature and
circumstance of each.
Table 2. Experiment results - Summary of the maximum communication distance between
ZigBee nodes under different conditions
Descriptions Communication distance (m) Tunnel plan view,
Test line Test line Node positions
Straight line in the tunnel axis 380
Straight line on the tunnel wall 180
Diagonal straight
line
on the opposite tunnel
walls 240
Straight line on the floor of tunnel 120
Curved line in the middle of
curved tunnel 120
The results are analysed and classified to develop a more rigorous system design of a ZigBee
network taking into account relevant factors in the underground openings. The effect of tunnel
curvature on communication distance is indicated in Table 3. Communication distance leads to
a dramatic drop from 380m in a line of sight of radio propagation compared with 120m in a
non-line of sight under the similar conditions with respect to support system, test line position
from the walls and the floor and the level of the ZigBee nodes. However, tunnel water inflow
caused greater attenuation in the line of sight test.
Table 3. Classification of results based on the passageway effect
Test line
view
Radio
propagation
regions
Tunnel
layout
Support
system
Test
line
position
ZigBee
node level
Water
conditions
ZigBee
communication
distance (m)
line of sight
(LOS) straight
mesh
shotcrete
rock bolt
in the
tunnel
axis
On a tripod
with 1.5m
height
water
inflow
through a ditch
380
non-line of
sight
(NLOS)
curved and
inclined
mesh
shotcrete
rock bolt
in the
tunnel
axis
On a tripod
with 1.5m
height
dry 120
18
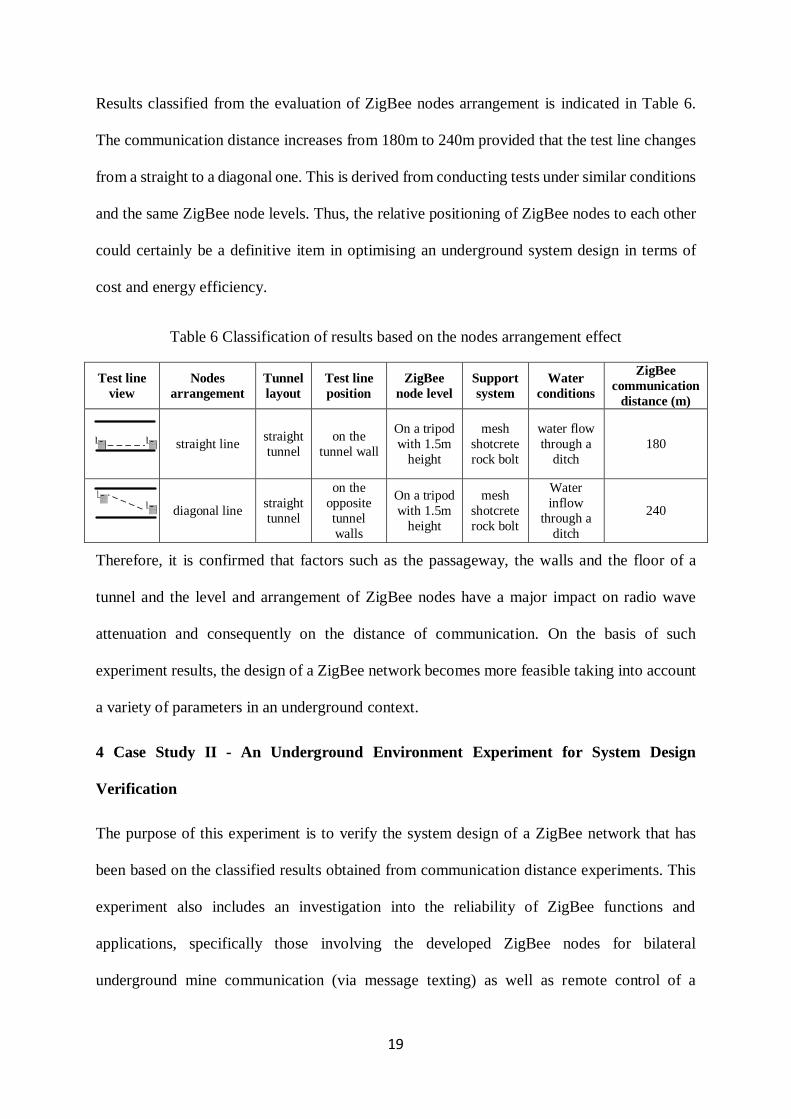
Classification of results based on the tunnel walls effect is indicated in Table 4. The
communication distance between two ZigBee nodes in a straight tunnel falls rapidly from 380m
to 180m where the test line changes the location from the middle of the tunnel to the nearby
walls. This occurred when the tests were performed where there were similar conditions of
tunnel layout, support system, ZigBee node height, and water inflow through a ditch.
Table 4. Classification of results based on the tunnel walls effect
Test line view Test line
position
Tunnel
layout
Support
system
ZigBee
node level
Water
conditions
ZigBee
communication
distance (m)
in the
tunnel axis
straight
tunnel
mesh shotcrete
rock bolt
On a tripod with 1.5m
height
water inflow through a
ditch
380
on the
tunnel wall
straight
tunnel
mesh
shotcrete
rock bolt
On a tripod
with 1.5m
height
water flow
through a
ditch
180
Results classified according to the evaluation of ZigBee nodes level- height effect is indicated
in Table 5. ZigBee communication distance in this test reduced significantly from 380m to
120m mainly because of nodes placed in close proximity to the floor. In addition to the effect
of floor unevenness which increases attenuation, the tunnel floor has an inclination of 0.3%.
For this reason, any line of sight tests where the distance between ZigBee nodes was greater
than 100 m may have been considered as a non-line of sight test. This explains why the height
of nodes placement becomes an important factor in the system design of a ZigBee network in
underground excavations.
Table 5. Classification of results based on the ZigBee nodes level - height effect
Test line
view
ZigBee
node level
Test line
position
Tunnel
layout
Support
system
Water
conditions
ZigBee
communication
distance (m)
located on
tripod with 1.5m height
in the tunnel axis
straight tunnel
mesh
shotcrete rock bolt
water inflow
through a ditch
380
located on
the floor
in the
tunnel axis
straight
tunnel
mesh
shotcrete
rock bolt
water flow
through a
ditch
120
19
Results classified from the evaluation of ZigBee nodes arrangement is indicated in Table 6.
The communication distance increases from 180m to 240m provided that the test line changes
from a straight to a diagonal one. This is derived from conducting tests under similar conditions
and the same ZigBee node levels. Thus, the relative positioning of ZigBee nodes to each other
could certainly be a definitive item in optimising an underground system design in terms of
cost and energy efficiency.
Table 6 Classification of results based on the nodes arrangement effect
Test line
view
Nodes
arrangement
Tunnel
layout
Test line
position
ZigBee
node level
Support
system
Water
conditions
ZigBee
communication
distance (m)
straight line straight
tunnel
on the
tunnel wall
On a tripod
with 1.5m
height
mesh
shotcrete
rock bolt
water flow
through a
ditch
180
diagonal line straight
tunnel
on the
opposite
tunnel
walls
On a tripod
with 1.5m
height
mesh
shotcrete
rock bolt
Water
inflow
through a
ditch
240
Therefore, it is confirmed that factors such as the passageway, the walls and the floor of a
tunnel and the level and arrangement of ZigBee nodes have a major impact on radio wave
attenuation and consequently on the distance of communication. On the basis of such
experiment results, the design of a ZigBee network becomes more feasible taking into account
a variety of parameters in an underground context.
4 Case Study II - An Underground Environment Experiment for System Design
Verification
The purpose of this experiment is to verify the system design of a ZigBee network that has
been based on the classified results obtained from communication distance experiments. This
experiment also includes an investigation into the reliability of ZigBee functions and
applications, specifically those involving the developed ZigBee nodes for bilateral
underground mine communication (via message texting) as well as remote control of a
20
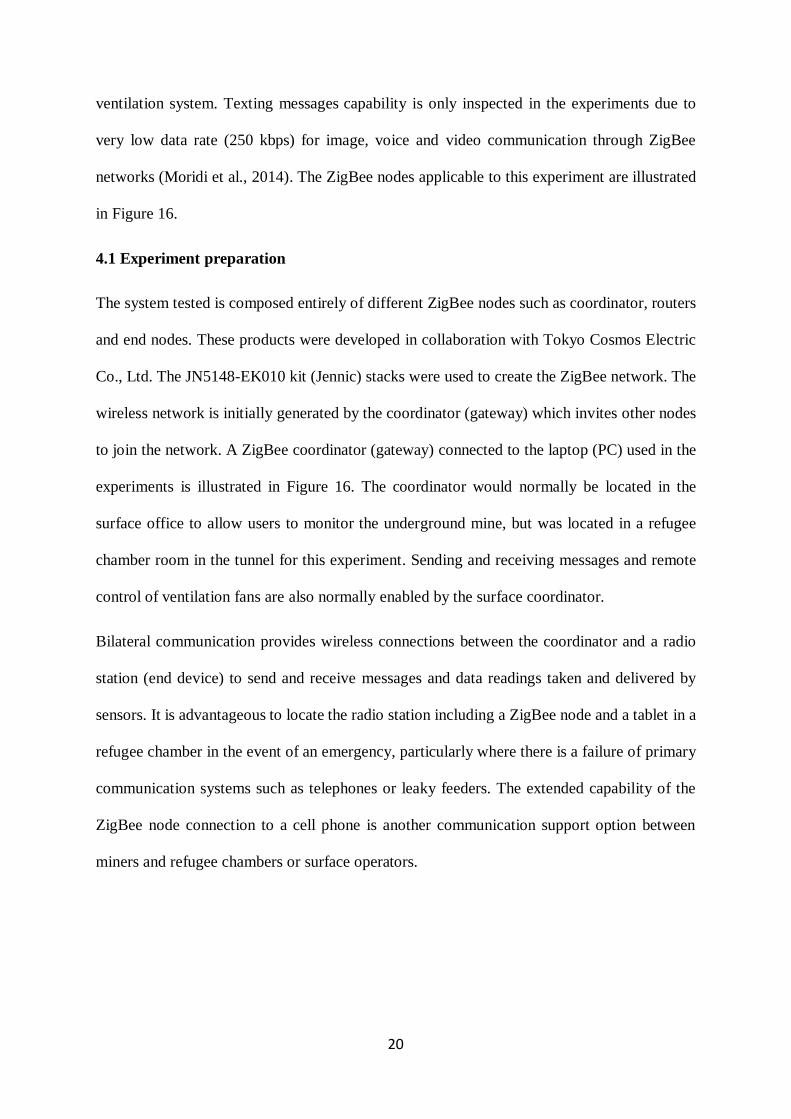
ventilation system. Texting messages capability is only inspected in the experiments due to
very low data rate (250 kbps) for image, voice and video communication through ZigBee
networks (Moridi et al., 2014). The ZigBee nodes applicable to this experiment are illustrated
in Figure 16.
4.1 Experiment preparation
The system tested is composed entirely of different ZigBee nodes such as coordinator, routers
and end nodes. These products were developed in collaboration with Tokyo Cosmos Electric
Co., Ltd. The JN5148-EK010 kit (Jennic) stacks were used to create the ZigBee network. The
wireless network is initially generated by the coordinator (gateway) which invites other nodes
to join the network. A ZigBee coordinator (gateway) connected to the laptop (PC) used in the
experiments is illustrated in Figure 16. The coordinator would normally be located in the
surface office to allow users to monitor the underground mine, but was located in a refugee
chamber room in the tunnel for this experiment. Sending and receiving messages and remote
control of ventilation fans are also normally enabled by the surface coordinator.
Bilateral communication provides wireless connections between the coordinator and a radio
station (end device) to send and receive messages and data readings taken and delivered by
sensors. It is advantageous to locate the radio station including a ZigBee node and a tablet in a
refugee chamber in the event of an emergency, particularly where there is a failure of primary
communication systems such as telephones or leaky feeders. The extended capability of the
ZigBee node connection to a cell phone is another communication support option between
miners and refugee chambers or surface operators.
21
Figure 16. Applicable ZigBee nodes for underground environments
Ventilation fan control is also provided by the ZigBee node with its ability to wirelessly
connect to the fans. A screenshot of the designed program showing on PCs (laptop and
tablet) with ON/OFF switches and receiving/sending messages is illustrated in Figure 18.
There are separate command icons for each auxiliary fan in the program. Routers are
manufactured with the ability of real-time sensing of the environment as well as relaying
communication signals throughout the network. A digital temperature, humidity and
luminance compound sensor on board of each JN5148, with advanced sensitivity and
continued stability, were utilised for the experiment. ZigBee nodes were placed in the boxes
to minimise adverse environmental effects on their operation.
Alternating current (AC) power was required for the ZigBee coordinator and radio station
(end-device). Therefore, the test line to establish the ZigBee network selected was based on
the availability of power points on level 11. Routers were used which were compatible with
22
direct current (DC) power between 9 and 32 volts. In this experiment, a 12-volt battery was
used with 3 dBm transmitting power.
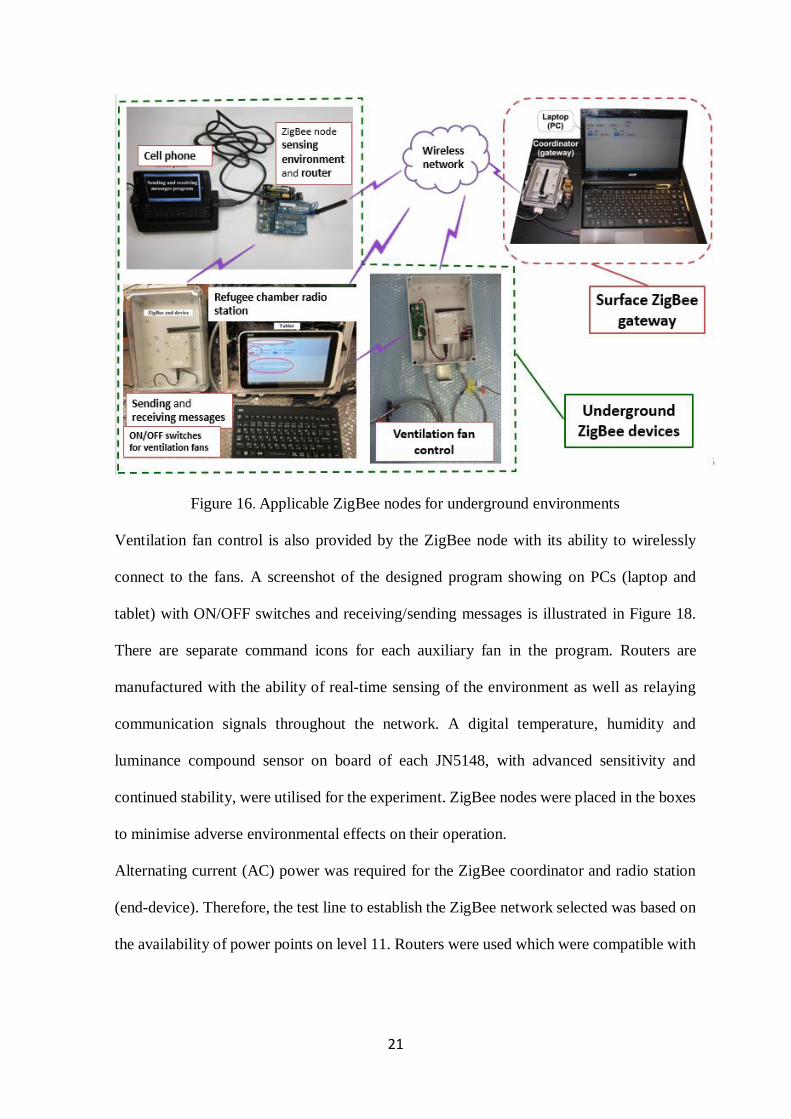
To set up the experiment, the coordinator was first turned on and connected to the laptop to
save and monitor data and also to establish an automatic wireless network to join routers
and end devices to the network. The applicable ZigBee nodes were arranged at level 11
based on the classification of results in table 2 in order to verify the system design. This is
illustrated in Figure 17. Also, the coordinator was located in refugee chamber connecting to
the power point which was supplied with 220 volts. The first router’s preferred location is
in a line of sight from the coordinator at the specified maximum distance otherwise, an
imbalance in the number of nodes in the system design will negatively affect network
performance.
Figure 17. Arrangement of ZigBee nodes for the verification of the system design
For example, if a ZigBee network with a high density of nodes is used, the ability to control
traffic congestion will be affected as well as impacting overall economic costs. On the other
hand, if there are fewer nodes over a greater communication distance, the reliability of
communication would be the principal concern for network performance. As a result, an
23
accurate appraisal of optimally arranged nodes for the ZigBee network, as was done during
the system design experiment, must include consideration of controllable and uncontrollable
parameters. The ZigBee network was constructed in accordance with the outcomes that
appraise the total length of the ZigBee network over 365m that had a total of 5 nodes through
level 11, as shown in Figure 17.
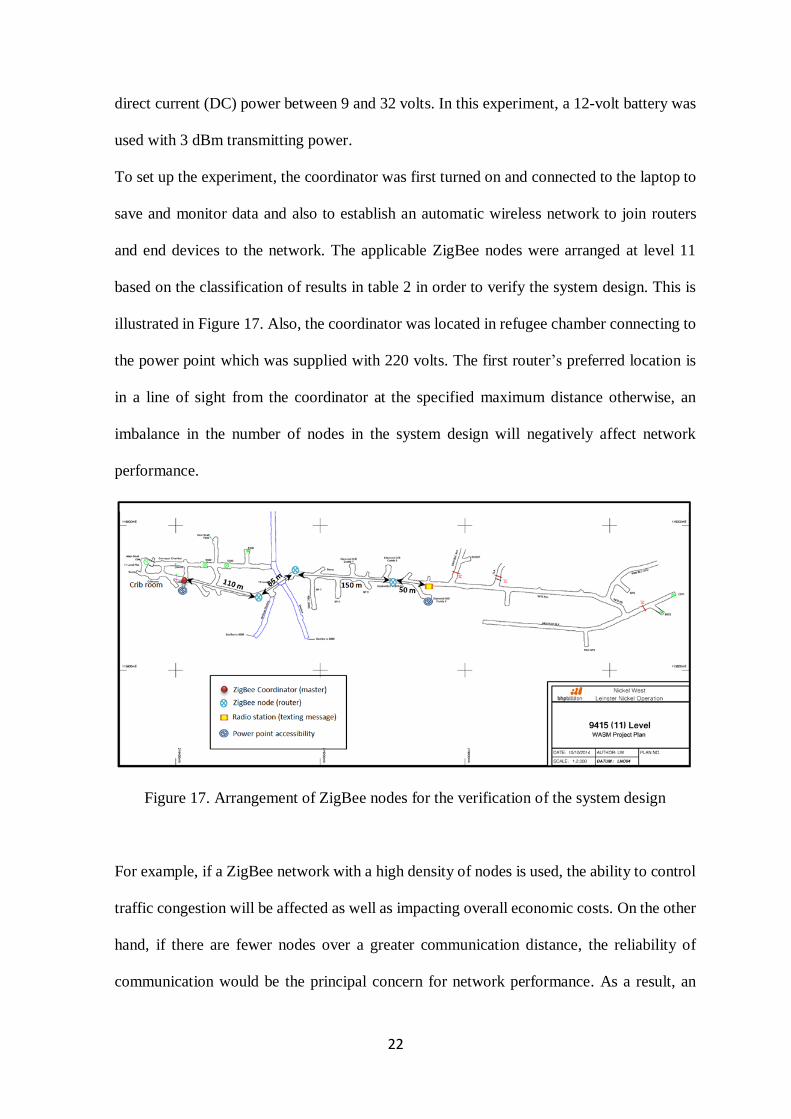
4.2 Experiment results
The radio station was mounted at the end of the test line to communicate with the
coordinator through the other nodes. Successful communication between coordinator and
radio station is illustrated in Figure 18 where the messages sent (as red) and received (as
blue) were transmitted from the coordinator to the radio station. As shown in Figure 18, the
ControlTerm program was configured both on the laptop which was connected to the
coordinator as well as the tablet connected to the radio station.
Figure 18. ControlTerm program to send (red) and receive (blue) messages from the
coordinator to the radio station
24
In summary, these experiments demonstrated that wireless sensor networks can significantly
improve the efficiency of underground monitoring regarding personnel, plant, and
equipment location, operational readings, and communications. They also verified that
ZigBee network performance of a carefully designed system is reliable for underground
wireless monitoring and communication systems. The results show that stable
communication distances for ZigBee nodes are sustainable up to 360 m and up to 120 m in
straight and curved tunnels, respectively. Additionally, the following outcomes were
successfully achieved: the real-time monitoring of underground spaces in terms of
temperature, humidity and illumination and the control of ventilation system by a master
node (coordinator) as well as communication between nodes.
5 Conclusions
This paper indicates the improvement of mine automation for a safe workplace utilising
WSNs. It suggests developing a methodology to establish a reliable ZigBee network for
monitoring and communication in an underground mine. The challenge of integrating
executable and analytic models performed within the underground mine in Western
Australia was addressed. The implementation of the ZigBee network is initially organised
based on the system design specifications. These specifications themselves are determined
from an investigation of reliable and maximum communication distances under different
conditions. Specifications cannot be determined unless the effects of all controllable and
uncontrollable parameters are appraised and assessed at maximum distances. The model
was verified by running experiments for temperature, humidity and illumination readings,
texting message, and controlling ventilation fan through the underground mine. Since every
underground mine site has varying controllable and uncontrollable parameters, experiments
have to be individually designed when developing a functional model. Technical and
economic evaluations can also be undertaken using this experimental model.
25
References:
Ben Maissa, Y., Kordon, F., Mouline, S., & Thierry-Mieg, Y. (2013). Modeling and Analyzing Wireless
Sensor Networks with VeriSensor: An Integrated Workflow. In M. Koutny, W. M. P. Aalst &
A. Yakovlev (Eds.), Transactions on Petri Nets and Other Models of Concurrency VIII (pp. 24-47). Berlin, Heidelberg: Springer Berlin Heidelberg. http://dx.doi.org/:10.1007/978-3-642-
40465-8_2
Benkic, K., Malajner, M., Planinsic, P., & Cucej, Z. (2008). Using RSSI value for distance estimation in wireless sensor networks based on ZigBee. 15th International Conference on Systems,
Signals and Image Processing. Slovenia. Doi.10.1109/IWSSIP.2008.4604427.
http://ieeexplore.ieee.org/document/4604427/
Ha, Y.-g., Eun, A.-c., & Byun, Y.-c. (2013). Efficient Sensor Localization for Indoor Environments Using Classification of Link Quality Patterns. International Journal of Distributed Sensor
Moridi, M. A., Kawamura, Y., Sharifzadeh, M., Chanda, E. K., & Jang, H. (2014). An investigation of underground monitoring and communication system based on radio waves attenuation using
ZigBee. Tunnelling and Underground Space Technology, 43(0), 362-369.
http://dx.doi.org/http://dx.doi.org/10.1016/j.tust.2014.05.011 Moridi, M. A., Kawamura, Y., Sharifzadeh, M., Chanda, E. K., Wagner, M., & Okawa, H. (2018).
Performance analysis of ZigBee network topologies for underground space monitoring and
communication systems. Tunnelling and Underground Space Technology, 71(0), 201-209.
http://www.sciencedirect.com/science/article/pii/S0886779815301115?via%3Dihub Robinson, K. (2012). System Modelling & Design Using Event-B. School of Computer Science and
Engineering: The University of New South Wales.
Stanley-Marbell, P., Basten, T., Rousselot, J., Oliver, R. S., Karl, H., Geilen, M., . . . Decotignie, J.-D. (2008). System models in wireless sensor networks (ESR-2008-06 ). Department of Electrical
Engineering Electronic Systems:
Zarei, H., Uromeihy, A., & Sharifzadeh, M. (2013). A new tunnel inflow classification (TIC) system
through sedimentary rock masses. Tunnelling and Underground Space Technology, 34, 1-12.