0
July, 2011
John A. Nunnery, Ed.D.
Old Dominion University
Steven M. Ross, Ph.D.
Johns Hopkins University
Shanan Chappell, Ph.D.
Shana Pribesh, Ph.D.
Elizabeth Hoag-Carhart
Old Dominion University
© 2011, July. The Center for Educational Partnerships,
Old Dominion University
The Impact of the NISL Executive
Development Program on School
Performance in Massachusetts:
Cohort 2 Results
1
Contents INTRODUCTION .................................................................................................. 2
Research questions .................................................................................................. 4
METHOD ............................................................................................................... 4
NISL schools ........................................................................................................... 4
Student achievement measures ............................................................................... 5
Comparison school weighting procedure ............................................................... 5
Analyses .................................................................................................................. 7
RESULTS ............................................................................................................... 7
School level analyses .............................................................................................. 7
Commonwealth comparison analyses - math ......................................................... 9
Commonwealth comparison analyses - ELA .......................................................10
FINDINGS AND DISCUSSION .........................................................................11
2
INTRODUCTION School leaders are increasingly being asked, whether by rhetoric or policy, to measurably
improve student achievement. The resultant need to assi school leaders in their ability to
improve teaching and learning for all students in their schools led to the establishment of the
National Institute of School Leadership’s (NISL's) Executive Development Program. The NISL
program emphasizes the role of principals as strategic thinkers, instructional leaders, and creators
of a just, fair, and caring culture in which all students meet high standards. The current national
focus on the importance of effective, instructional leadership has, in turn, led to calls for
principal evaluation to be tied directly to student achievement (Davis, Kearney, Sanders,
Thomas, and Leon, 2011). Within this milieu, effective and proven principal leadership
development programs are crucial.
NISL’s primary goal is to ensure that the participating school leaders have the
knowledge, skills, and tools to effectively set direction for teachers, support their staff in
improving instructional practices, and design an efficient organization that becomes a
professional learning community. Professional development goals are to provide high-quality
instruction (both online and face-to-face), an advanced research-based curriculum, and an
interactive approach to learning that includes self-assessments simulations, case studies, school
evaluations, and online activities.
The curriculum, designed by experts on leadership training across a number of fields,
reflects an $11 million investment and five years of research and piloting. Four courses teach
World-Class Schooling (Principal as a Strategic Thinker and School Designer, Standards-Based
Instruction); Teaching and Learning; Developing Capacity and Commitment; and Driving for
3
Results. Designed to be highly interactive, training sessions use simulations and assignment of
“pre-work” and applications (“homework”) to participants.
Prior evaluations of the Executive Development Program prove that the NISL program
can be implemented economically and with high fidelity (Meristem Group, 2009). Perhaps more
importantly, the research indicates that positive student achievement patterns have been
associated with program participation by school leaders. However, these prior studies have used
descriptive or correlational designs lacking comparison groups or strong controls over sample
selection bias.
More recently, Nunnery, Yen, and Ross (2011) conducted a carefully matched
comparison-group ex post facto design to examine NISL program effects in Pennsylvania. Their
findings indicate that program participation by school leaders was associated with statistically
significant improvement in student achievement for both mathematics and reading over a four-
year period. A study of schools from 2006-2009 in Massachusetts represented a further
enhancement in the rigor of the evidence regarding potential effects of the NISL program, as it
also is based on an ex post facto, matched comparison design (Nunnery, Ross, and Yen, 2010).
Preliminary estimates in the initial report found that NISL schools consistently surpassed the
comparison schools in math achievement gains at a statistically significant level from 2006-
2009, although no statistically significant effects were observed for English Language Arts
performance at that time. For identification purposes, we will define schools in the initial report
as Cohort 1 schools. This interim report includes a similar analysis of NISL schools compared to
schools across the commonwealth of Massachusetts. The NISL schools included in this report
will be identified as Cohort 2 schools.
4
Research questions The research questions addressed here were:
1. How did the 2007-2010 trends in school level performance in mathematics differ between
schools served by Cohort 2 of the NISL-trained principals and comparison schools at the
elementary and middle school levels?
2. How did the 2007-2010 trends in school level performance in English/Language Arts
(ELA) differ between schools served by Cohort 2 of the NISL-trained principals and
comparison schools at the elementary and middle school levels?
3. How did trends in math and ELA performance differ between Cohort 2 NISL schools and
the Commonwealth as a whole?
METHOD
NISL schools A total of 46 elementary, middle, or elementary-middle school principals participated in
cohort 2 of Massachusetts’ NISL program. The analysis sample included only those schools
whose principal began the NISL program in 2007, completed the NISL program, and remained at
the same school from 2007 through the end of the 2010 school year. Of the 46 participating
principals, complete test and demographic data were unavailable for 17% (n = 8) of the schools
represented by those principals. The final analysis sample included 38 NISL schools and 977
comparison schools at the elementary, middle, or elementary-middle school level.
Schools were classified into grade-level types on the basis of the lowest and highest
grades served. Schools serving grades three to four, three to five, or three to six were classified
5
as elementary schools. Schools serving grades five-, six-, or seven- to eight were classified as
middle schools, and schools serving grades three- or four- to eight were classified as elementary-
middle schools.
Student achievement measures The outcome measures included in the analysis were standardized scores (z-scores)
computed from raw scores on the Massachusetts Comprehensive Assessment Program tests in
English/Language Arts (ELA) and mathematics. Z-scores were computed separately for each
grade level by subtracting the state-mean from each individual student score, then dividing the
difference by the state-wide standard deviation. Individual z-scores were then aggregated across
grade levels served by each school, resulting in a single school performance index reflecting the
mean z-score for all tested students within each school. These performance indices were used as
the outcome variables in the analyses.
Comparison school weighting procedure Standardized mortality ratio (SMR) weights were used to construct a matched
comparison group to analyze the impact of the NISL program. SMRs are a calculation of the
observed values of a population and values which would be expected, based on certain
population characteristics (Fleis, 1973). For example, SMR weights can be applied to
comparisons of assessment scores of a study sample to those of a standard population, taking into
account traditional demographic indicators such as socio-economic, special education, and/or
Limited English Proficient (LEP) status (Fleis, Levin, and Paik, 2003). To calculate the SMR, a
binary logistic regression was conducted using the treatment group indicator (NISL or
comparison) as the outcome variable and 2006 ELA and math scores and the proportional values
of each school’s population of free- or reduced-price lunch, special education, and LEP students
6
as predictor variables. The predicted probability variables derived from the binary logistic
regression were saved for use in the construction of the SMRs.
Then, the SMR was calculated for each comparison school (n = 1,189) by dividing the
school’s predicted probability by one minus the predicted probability. The SMRs were then
normalized for each comparison school by dividing the SMR by the group SMR mean. The
normalized SMRs for all NISL schools (n = 38) were coded as one. The dataset was then
programmed to use the normalized SMR values as weights in the subsequent analyses. An
examination of the mean values by group (NISL/comparison) revealed that the groups were
essentially equivalent, using the normalized SMR weights, prior to the implementation of the
NISL program. Table 1 reports the mean weighted values by group for the 2006 ELA and math
z-scores, free- or reduced-price lunch proportions, special education proportions, and LEP
proportions.
Table 1
Mean weighted values on matching variables by NISL and comparison group
NISL
n = 38
Comparison
n = 1,189
M SD M SD
2006 ELA z-score -.54 .40 -.55 .51
2006 math z-score -.48 .40 -.49 .50
FRL .69 .24 .69 .27
Special Education .20 .10 .20 .10
LEP .13 .11 .13 .12
7
Analyses To determine trends in school level performance for math and ELA in NISL schools and
comparison schools, we conducted two 2 (NISL status) x 3 (school level) x 5 (outcomes from
2006-2010) repeated-measures analyses of variance. To compare math and ELA trends for NISL
and comparison schools for the Commonwealth as a whole, two 2 (NISL status) x 5 (outcomes
from 2006-2010) repeated measures analyses of variance were performed. Box’s test of equality
of variance and Levene’s test of homogeneity of variance were analyzed to test model
assumptions. Where these were violated, the Greenhouse-Geisser correction was performed to
yield conservative inferential tests of program effects. Cohen’s d effect size estimates were
computed using the NISL-Comparison school differences in 2010 mean z-scores adjusted for
2006 mean z-scores: d = (2010NISL – 2006NISL) – (2010Comp – 2006Comp). This difference directly
provides Cohen’s d because the outcome variables were already expressed in standard deviation
units derived from population values (z-scores). To control for experiment-wise alpha inflation,
Holme’s sequential Bonferroni approach was employed, resulting in a reduced alpha level of
0.025.
RESULTS
School level analyses The repeated measures analyses of variance for the math z-scores indicated no
statistically significant school level interaction for within-subject effects (F8,2012 = 0.21, p = .99)
or between-subject effects (F2,1008 = 0.13, p = .88). Similarly, the repeated measures analyses of
variance for the ELA z-scores indicated no statistically significant school level interaction for
within-subject effects (F8,2012 = 0.59, p = .78) or between-subject effects (F2,1008 = 0.49, p = .61).
Table 2 reports mean z-scores by school level for the NISL and comparison groups for both math
and ELA.
8
Table 2
Mean unweighted math and ELA scores by school level for NISL and comparison schools for
2007 - 2010
2007 2008 2009 2010
Math
Elementary
NISL
-.38
-.34
-.37
-.26
Comparison
-.54
-.52
-.54
-.51
Middle
NISL
-.56
-.54
-.50
-.42
Comparison
-.63
-.61
-.62
-.57
Elementary-Middle
NISL
-.75
-.67
-.70
-.60
Comparison
-.63
-.59
-.59
-.54
ELA
Elementary
NISL
-.48
-.48
-.43
-.34
Comparison
-.61
-.60
-.59
-.55
Middle
NISL
-.59
-.52
-.48
-.49
Comparison
-.68
-.66
-.62
-.64
Elementary-Middle
NISL
-.77
-.70
-.72
-.61
Comparison
-.62
-.65
-.62
-.59
9
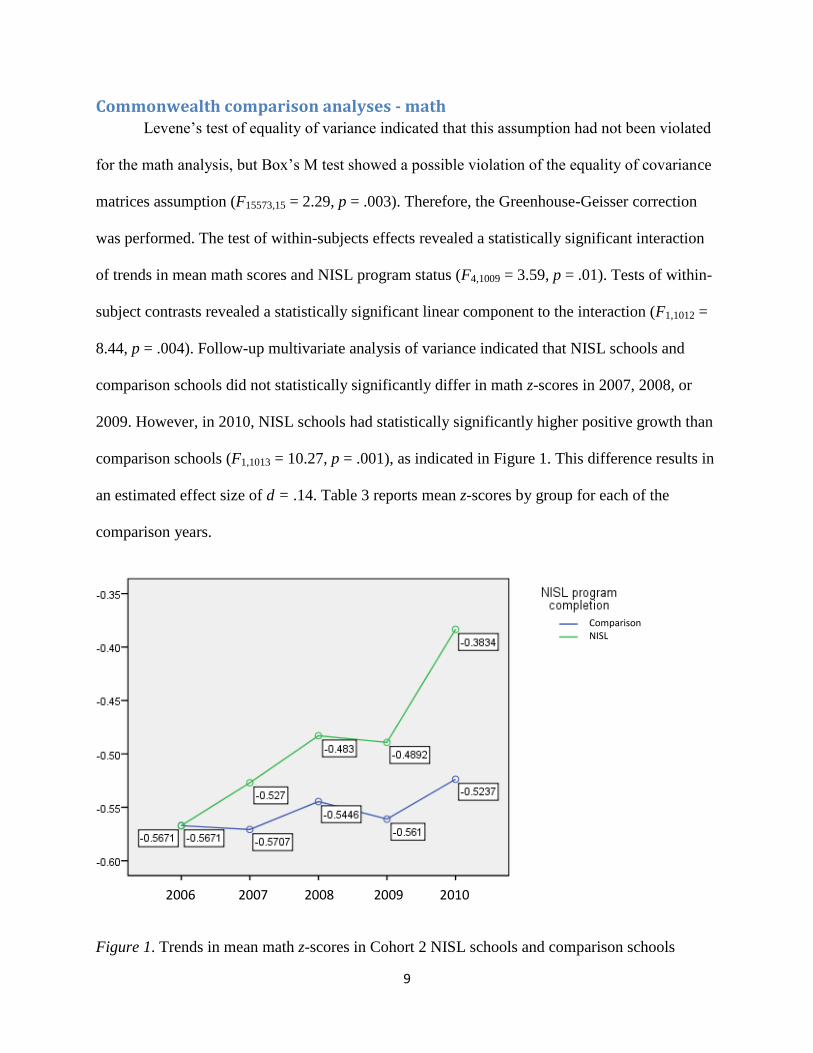
Commonwealth comparison analyses - math Levene’s test of equality of variance indicated that this assumption had not been violated
for the math analysis, but Box’s M test showed a possible violation of the equality of covariance
matrices assumption (F15573,15 = 2.29, p = .003). Therefore, the Greenhouse-Geisser correction
was performed. The test of within-subjects effects revealed a statistically significant interaction
of trends in mean math scores and NISL program status (F4,1009 = 3.59, p = .01). Tests of within-
subject contrasts revealed a statistically significant linear component to the interaction (F1,1012 =
8.44, p = .004). Follow-up multivariate analysis of variance indicated that NISL schools and
comparison schools did not statistically significantly differ in math z-scores in 2007, 2008, or
2009. However, in 2010, NISL schools had statistically significantly higher positive growth than
comparison schools (F1,1013 = 10.27, p = .001), as indicated in Figure 1. This difference results in
an estimated effect size of d = .14. Table 3 reports mean z-scores by group for each of the
comparison years.
Figure 1. Trends in mean math z-scores in Cohort 2 NISL schools and comparison schools
2006 2007 2008 2009 2010
Comparison NISL
10
Commonwealth comparison analyses - ELA Levene’s test of equality of variance indicated that this assumption had not been violated
for the ELA analysis, but Box’s M test showed a possible violation of the equality of covariance
matrices assumption (F15573,15 = 2.29, p < .001). Therefore, the Greenhouse-Geisser correction
was performed. The test of within-subjects effects revealed a statistically significant interaction
of trends in mean ELA scores and NISL program status (F4,1009 = 3.71, p = .01). Tests of within-
subject contrasts revealed a statistically significant linear component to the interaction (F1,1012 =
6.81, p = .01). Follow-up multivariate analysis of variance indicated that NISL schools and
comparison schools did not statistically significantly differ in ELA z-scores in 2007, 2008, or
2009. However, in 2010, NISL schools had statistically significantly higher positive growth than
comparison schools (F1,1013 = 8.55, p = .004), as indicated in Figure 2. This difference results in
an estimated effect size of d = .11 (see Table 3).
Figure 2. Trends in mean ELA z-scores in cohort 2 NISL schools and comparison schools
2006 2007 2008 2009 2010
Comparison NISL
11
Table 3
Mean SMR-weighted scores by NISL status and subject area with estimated effect sizes
2006 2007 2008 2009
2010 Effect Size
Math
.14
NISL
-.57
-.53
-.48
-.49
-.38
Comparison
-.57
-.57
-.55
-.56
-.52
ELA
.11
NISL
-.64
-.62
-.60
-.56
-.46
Comparison
-.64
-.62
-.62
-.60
-.57
FINDINGS AND DISCUSSION The purpose of the present study was to employ a rigorous ex post facto research design
to determine the effects of the NISL program in Massachusetts. The NISL sample consisted of
38 elementary, middle, or elementary-middle schools lead by principals who had participated in
the program and remained at the same school from 2007 to 2010. To construct the matched
comparison group, we used standardized mortality ratio (SMR) weights, which increases
statistical power and matching precision by including as the comparison sample all non-
treatment schools in a target population (i.e., State of Massachusetts) through weighting their
contribution to the analysis based on their similarity to the treatment group (NISL). The
resultant comparison group included 977 schools at the elementary, middle, or elementary-
middle school levels. Analysis of the weighted mean values on prior achievement, F/R lunch
status, and LEP confirmed that NISL and comparison groups were essentially equivalent.
12
The present results extend the findings from the prior Pilot Cohort study in Massachusetts
(Nunnery et. al., 2010a). This research indicated significant advantages for the NISL schools in
mathematics (with effect sizes in the .8 to .10 range) but no effects in reading. In contrast, NISL
advantages in the present study were significant in both subjects (both d’s = .08). When it is
considered such effects apply to an entire school and that the NISL program costs only about
$4,000 per participant principal, the educational value to individual schools and to multiple
schools state-wide is obvious.
The results acquire additional importance when interpreted from theoretical perspectives
regarding principal impacts. Although numerous research studies indicate a strong relationship
between principals’ leadership activities and student achievement, evidence regarding efforts to
improve the effectiveness of incumbent principals is much more limited (e.g., Leithwood, Louis,
Anderson, & Wahlstrom, 2004; Marzano, Waters, & McNulty, 2005; Murphy & Datnow, 2003;
Supovitz & Poglinco, 2001). An obvious challenge in evaluating principal effectiveness is that
principals are positioned two levels from the classroom. Their impacts on school quality occur
through their recruitment, development, and retention of teachers, creation of positive school
climates, and interpretation and enactment of federal, state, and district policies (Hallinger &
Heck, 1998). Increased knowledge and skills in these roles clearly take time to filter down from
principals’ activities to teacher attitudes and practices, to the quality of classroom instruction,
and ultimately, to improved student achievement on state assessments. The consistent and fairly
immediate achievement score gains demonstrated in this study and in prior studies (Nunnery et
al., 2010a; 2010b) for schools led by NISL-trained principals, therefore, acquire additional
significance for both practice and theory. Also from a practical standpoint, the NISL Executive
Development Program provides a viable alternative to the much harsher, seemingly riskier (and
13
less proven) strategy of trying to improve student achievement simply by changing school
leadership.
14
REFERENCES
Davis, S., Kearney, K., Sanders, N., Thomas, C., & Leon, R. (2011, July). The Policies and
Practices of Principal Evaluation: A Review of the Literature. Schools Moving Up -
WestEd. Retrieved July 15, 2011, from
http://www.schoolsmovingup.net/cs/smu/view/rs/26860
Fleis, J. (1973). Statistical methods for rates and proportions. New York: John Wiley and Sons.
Fleis, J., Levin, B., & Paik, M. (2003). Statistical methods for rates and proportions (3rd
ed.).
New York: John Wiley and Sons.
Hallinger, P., & Heck, R. H. (1998). Exploring the principal’s contribution to school
effectiveness: 1980–1995. School Effectiveness and School Improvement, 9, 157–191.
Leithwood, K., Louis, K. S., Anderson, S., & Wahlstrom, K. (2004). How leadership influences
student learning. St. Paul, MN: University of Minnesota, Center for Applied Research and
Educational Improvement & Toronto, Canada: Ontario Institute for Studies in Education.
Meristem Group (2009). National Institute for School Leadership (NISL): Massachusettes
program implementation 2005-2008. Boston, MA: Meristem Group.
Marzano, R. J., Waters, T., & McNulty, B. A. (2005). School leadership that works: From
research to results. Alexandria, VA: ASCD.
Murphy, J., & Datnow, A. (2003). Leadership lessons from comprehensive school reform. San
Francisco: Corwin Press.
Nunnery, J.A., Ross, S.M., & Yen, C. (2010). An Examination of the Effect of a Pilot of the
National Institute for School Leadership’s Executive Development Program on School
Performance Trends in Massachusetts. Norfolk, VA: The Center for Educational
Partnerships. (a)
15
Nunnery, J., Ross, S.M., & Yen, C. (2010). The Effect of the National Institute for
School Leadership’s Executive Development Program on School Performance Trends in
Pennsylvania. Norfolk, VA: The Center for Educational Partnerships at Old Dominion
University. (b)
Supovitz, J., & Poglinco, S. (2001). Instructional leadership in a standards-based reform.
Philadelphia: Consortium for Policy Research in Education.