1 Development Scenarios of Sustainability for Golf: The Algarve Case Antónia Correia § , Nuno Videira * , Inês Alves * , Catarina Ramires * , Rui Subtil * and Victor Martins ‡1 § Faculty of Economics, University of Algarve, Portugal, [email protected]* Faculty of Marine and Environmental Sciences, University of Algarve, Portugal ‡ ISEG – Technical University of Lisbon, Portugal Abstract Golf is becoming a major industry worldwide. The majority of the Portuguese golf courses are located in the Algarve region. Golf tourism has a great economic impact on the Algarve and is regarded by local tourism developers as a vehicle for tackling the seasonal patterns of “mass tourism”. In consideration of the concerns of those involved in regional tourism and golf, the University of Algarve has developed a prospective study on the sustainability paths of this activity, starting from an integrated analysis of reference conditions of golf in the Algarve, with respect to environmental, economic and social dimensions. In this paper we present the sustainability assessment framework developed in this study and the results from its application to the Algarve’s golf courses through the definition and evaluation of three alternative development scenarios and their associated impacts. The application of economic, social and environmental indicators was a key tool for the construction of the “baseline”, “moderate” and “intensive scenarios”. It was concluded that the development of further golf activity in the Algarve should be framed within high service and environmental quality standards. The sustainability area for golf course development should vary between 29 and 41 gold courses (equivalent of 18 holes). 1. Introduction The golf industry is experiencing growth worldwide. The number of affiliated golf players is estimated at around 60 million and the number of golf courses exceeds 31,600 (Portuguese Golf Federation, 2003). In Portugal there exist 55 golf courses and more than 12,000 registered golfers (Portuguese Golf Federation, 2002). The largest share of Portuguese golf courses is located in the Algarve region. 1 The authors acknowledge financial support from the Inovalgarve.
Transcript
1
Development Scenarios of Sustainability for Golf: The Algarve Case
Antónia Correia§, Nuno Videira*, Inês Alves*,
Catarina Ramires*, Rui Subtil* and Victor Martins‡1
§ Faculty of Economics, University of Algarve, Portugal, [email protected]
* Faculty of Marine and Environmental Sciences, University of Algarve, Portugal ‡ ISEG – Technical University of Lisbon, Portugal
Abstract
Golf is becoming a major industry worldwide. The majority of the Portuguese golf courses are located in the
Algarve region. Golf tourism has a great economic impact on the Algarve and is regarded by local tourism
developers as a vehicle for tackling the seasonal patterns of “mass tourism”. In consideration of the concerns of
those involved in regional tourism and golf, the University of Algarve has developed a prospective study on the
sustainability paths of this activity, starting from an integrated analysis of reference conditions of golf in the
Algarve, with respect to environmental, economic and social dimensions.
In this paper we present the sustainability assessment framework developed in this study and the results from its
application to the Algarve’s golf courses through the definition and evaluation of three alternative development
scenarios and their associated impacts. The application of economic, social and environmental indicators was a key
tool for the construction of the “baseline”, “moderate” and “intensive scenarios”. It was concluded that the
development of further golf activity in the Algarve should be framed within high service and environmental quality
standards. The sustainability area for golf course development should vary between 29 and 41 gold courses
(equivalent of 18 holes).
1. Introduction
The golf industry is experiencing growth worldwide. The number of affiliated golf players is estimated at around 60
million and the number of golf courses exceeds 31,600 (Portuguese Golf Federation, 2003). In Portugal there exist
55 golf courses and more than 12,000 registered golfers (Portuguese Golf Federation, 2002). The largest share of
Portuguese golf courses is located in the Algarve region.
1 The authors acknowledge financial support from the Inovalgarve.
2
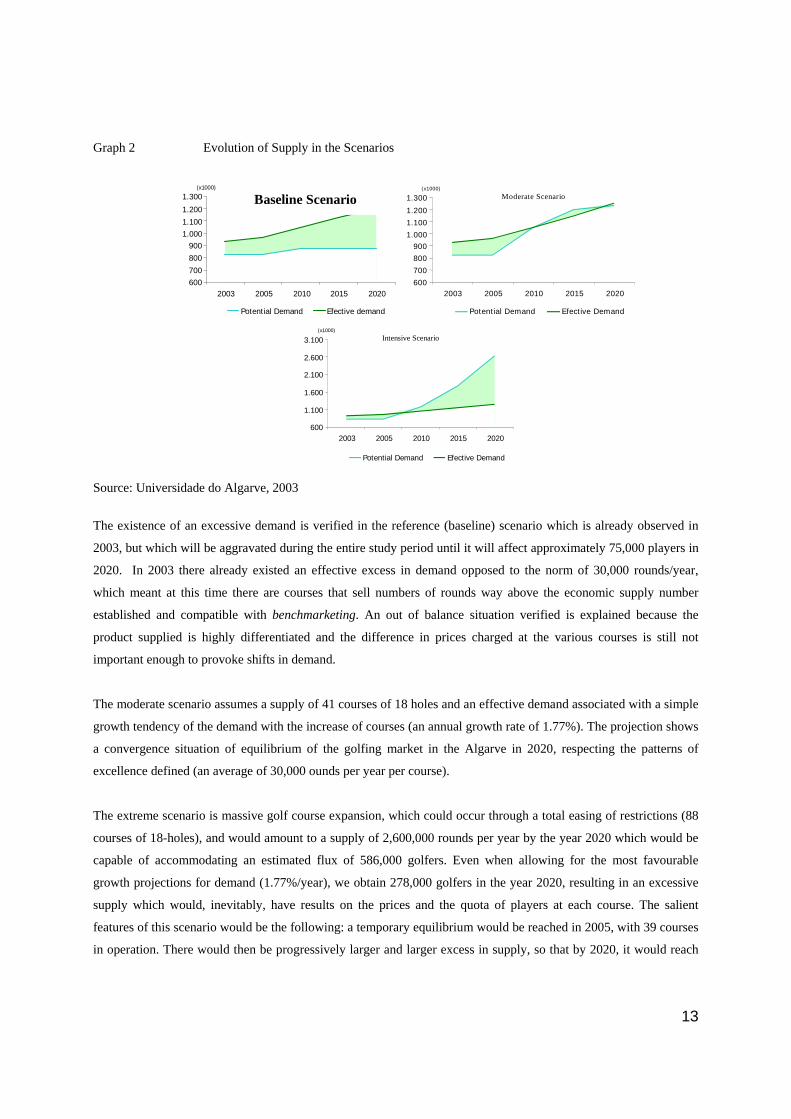
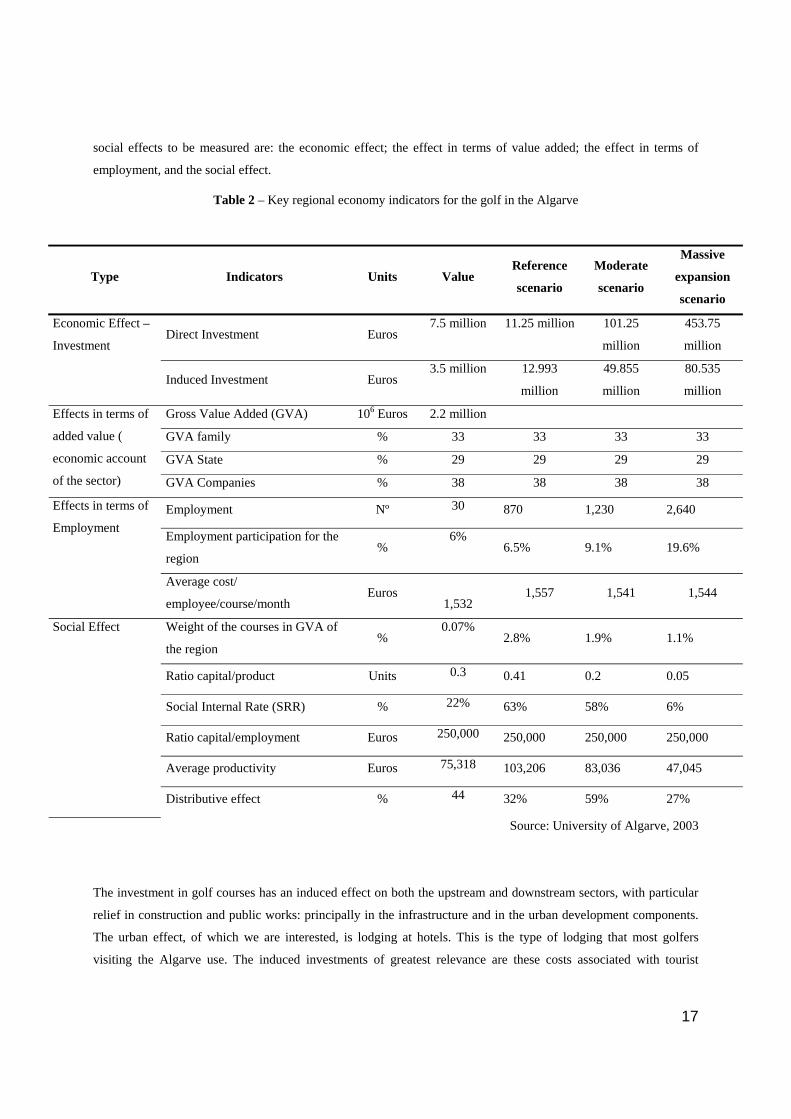
Regarded by tourism developers as a vehicle for overcoming the seasonal patterns of “mass tourism”, this activity
has a great economic impact in the Algarve region (University of Algarve, 2003). In 2002, more than 200,000
golfers visited the Algarve, which represented over 900,000 rounds sold (University of Algarve, 2003). The average
daily expenditure of a golf tourist that year was estimated at € 175.36, which is almost double the average
expenditure of a “regular” tourist (€ 91.78). (University of Algarve, 2003).
The mix of old golf courses and the increasing number of new golf projects, combined with the emergence of more
and more environmental pressures are raising awareness among managers (Videira et al., 2004). Given the concerns
of the regional tourism and golf authorities, the University of Algarve (2003) has developed a prospective study –
“Algarve Golf Study” - on the sustainability paths of the golf industry in this Portuguese region. This study was
based on an integrated analysis of the reference conditions of golf in the Algarve, with respect to environmental,
economic and social dimensions.
In this paper we present the results from the evaluation of development scenarios for the golf activity against three
dimensions of analysis: environment, business and regional economy. Considering these areas of impact, a
sustainability assessment framework was defined for the positioning of the regional performance of golf courses in a
sustainability triangle. This qualitative analysis was supported by the quantitative definition of indicators addressing
the key environmental, business and regional economy aspects for golf in the Algarve (Videira, et al, 2004).
In section 2 we review the existing literature on this theme, in section 3 we review the sustainability assessment
framework developed for the evaluation of the alternative development scenarios for the golf. Section 4 presents the
three scenarios and their underlying variables. The results from the simulation of the golf impact indicators in each
scenario are discussed in Section 5. The final section presents the main conclusions and possible development paths
for golf in the Algarve.
2. Literature Review
Improving the environmental performance of golf courses may be facilitated through the adoption and
implementation of several voluntary instruments. These may be divided into two categories: Environmental
Management Systems (EMS) and Environmental Management Programs (EMP). Examples of EMS include the ISO
14001 standard, and the Eco-Management and Audit Scheme (EMAS), whereas Audubon Cooperative Sanctuary
Program (ACSP), Committed to Green and Green Globe 21 fall into the EMP category. The implementation of these
environmental performance instruments offers many generic benefits for any organization, and in particularly for
golf clubs (Partidário & Lima, 2002).
The ISO 14001 standard, first published in 1996, may be applied to all types and sizes of organizations. It provides
the elements of an efficient and continuous environment management system that can be integrated with other
requirements of management, in order to help organizations to reach environmental and economic objectives (ISO,
3
1996). In the cases where the golf course is part of a larger tourist resort, the boundaries of the EMS implementation
are dependent upon the organization goals and their technical and economic capacity. The EMAS is a regulation of
the European Commission (EC 761/2001 of 19 March 2001). The ACSP for golf courses has been the leading
program in the United States of America to provide comprehensive environmental education and conservation
assistance to golf course managers and the industry (Audubon International Institute, 2003). The Committed to
Green is a pan-European EMP for golf facilities that was developed by the Unit of Ecology of European Golf
Association, following the guidelines developed by Audubon International. The targets of this program are the
existing golf courses, the new golf course projects and also the major golf events (Stubbs, 1997; EGA, 1999). Green
Globe constitutes an environmental management and awareness program, developed by the World Travel &
Tourism Council. Its requirements have been established in accordance with the principles of Agenda 21, and the
principles for sustainable development. The major goal of Green Globe is the promotion and implementation of the
Agenda 21 principles in the travel and tourism industry, by supporting affiliated companies in the improvement of
their environmental management practices (Green Globe, 2003).
Environmental Performance Evaluation (EPE) is an internal management process designed to provide management
with reliable and verifiable information, on an ongoing basis, to determine whether an organization’s environmental
performance is meeting the criteria set by the managers (ISO, 1999).
The definition of environmental indicators represents an essential tool for the operationalization of EPE in an
organization. In this context, an environmental indicator consists of a specific expression that provides information
about the environmental performance of an organization (ISO, 1999). In a broader sense, indicators may be defined
as parameters, or combinations of parameters, which are selected due to their ability to reflect the conditions of the
systems being studied (usually they are used after a preliminary treatment of the original data using simple
arithmetic or statistical operations) (DGA, 2000).
The Organization for Economic Cooperation and Development (OECD) has proposed a conceptual model
describing different types of indicators (OECD, 1993). This framework distinguishes between Pressure, State and
Response indicators (P-S-R model) (DGA, 2000; OECD, 1993) (Videira et all, 2004).The EEA extended this
approach by presenting the “D-P-S-I-R model”, which extends the OECD framework by considering additional
indicators for the Driving Forces (underlying needs which trigger human activities) and Impacts (effects of pressures
on human health, ecosystems and materials) (EEA, 1999).
The analysis of efficiency/profitability in the tourist industry is restricted to a small number of papers. Baker and
Riley (1994) suggest the use of ratios to analyse the performance of the lodging industry. Wejeysinghe (1993)
suggests the use of break-even analysis to analyse the profitability of tourism management. Brotherton and Mooney
(1992) and Donaghy et al (1995) suggest yield management to analyse the efficiency of hotel management. Morey
4
and Ditman (1995) analyse the efficiency of 54 hotels with DEA and Bell and Morey (1995) analyse 31 Travel
departments with DEA estimating the efficiency ratios. With up-to-date methods, Anderson et al. (2000) analyse the
efficiency of 48 hotels and estimate the allocative and technical efficiency using cross section data on prices, inputs
and outputs. In a related paper Anderson et al. (1999) analyse the efficiency of 48 hotels for the year 1994 with an
econometric stochastic translog frontier.
Specifically on golf, from a business perspective, no studies of a scientific nature were found. From the economic
perspective, The Patronato Turismo de Costa del Sol (2002) reflects the economic worries of the tourist economy of
the Costa del Sol. This analyses the golf situation in the region and relates it to the changes of supply and demand in
Malaga, pointing out its economic and social weight. Also, Stynes, D. J., Sun, Y. and Talhelm, D. R. (2001)
contribute to the analysis of the golf economy, studying visitors in Michigan. By examining primary data, they
compare the perceptions of the supply and demand sides quantifying the economic result of this activity for the
region. Melvin (2000) applies techniques to the hedonic prices of Rosen (1974) on the services offered by 17,000
golf courses in the United States between the years of 1995 and 1997. He concludes that with the correlation of 100
variables used, it is possible to fairly accurately estimate the prices of goods and services transacted at a golf course
and its composite characteristics, which confirms that golf is not a product endowed with usefulness in it, but it is
these characteristics that give it its usefulness. Golf represents, by itself, an important economic activity and
simultaneously induces other activities, principally those of a tourist undertaking – other constructions around its
periphery. Martinez (1992) lists the sub-sectors of the economy related to golf – productive, employment, real
estate, the holding of golf tournaments and golf tourism. The author affirms that the interconnection provokes a
diminution relative to public courses, in favour of private golf courses. He points out the difficulties encountered in
some of the new courses constructed in mountainous areas, which seem to contribute to the lowering demand by the
golf client, whose average age is above 45 years of age.
This bibliography is clearly short for such an important tourism issue. With this paper we intend to enlarge
knowledge of tourism, on its sustainability, and to call the attention of other researchers’ to this field of tourism. Our
paper departs from the previous literature by using a matrix of impact indicators to characterize and evaluate the
sustainability of golf from the business, environmental and regional perspective.
3. Sustainability Assessment Methodology for Golf in the Algarve
The methodology is seated on two fundamental areas: the building of scenarios and a strategic evaluation of the
sustainability of each of these scenarios.
The scenario, as meant above, constitutes a probable evolution of the golf activity in the Algarve, conditioned by
three types of entry data:
- The demand projected on the part of the golfers;
5
- The supply profile of new courses during the period of analysis;
- The legal aspects at the onset constituted by regulations that condition the location of the courses and the
regulations that determine how they operate.
The set of data provides for various possible development trajectories for golf, depending on the projections of
economic variables, supply and demand, and also future developments in the legal sector.
The principal problematic fixed variable for golf, at this moment, is found in the legal sector for the entire period.
This is not only because some of these regulations are of the European ambit, but also because these areas, dealing
with the environment, will have a tendency to become more and more restrictive. The indicators that were used in
the evaluation of sustainability are the indicators calculated at the beginning of the diagnosis (cf. Videira et all,
2004; Correia et all, 2004). On the other hand the hypotheses on the evolution of supply and the location of future
courses result from the consultation of the processes that are encountered in the phase of getting licenses and permits
that officially exist.
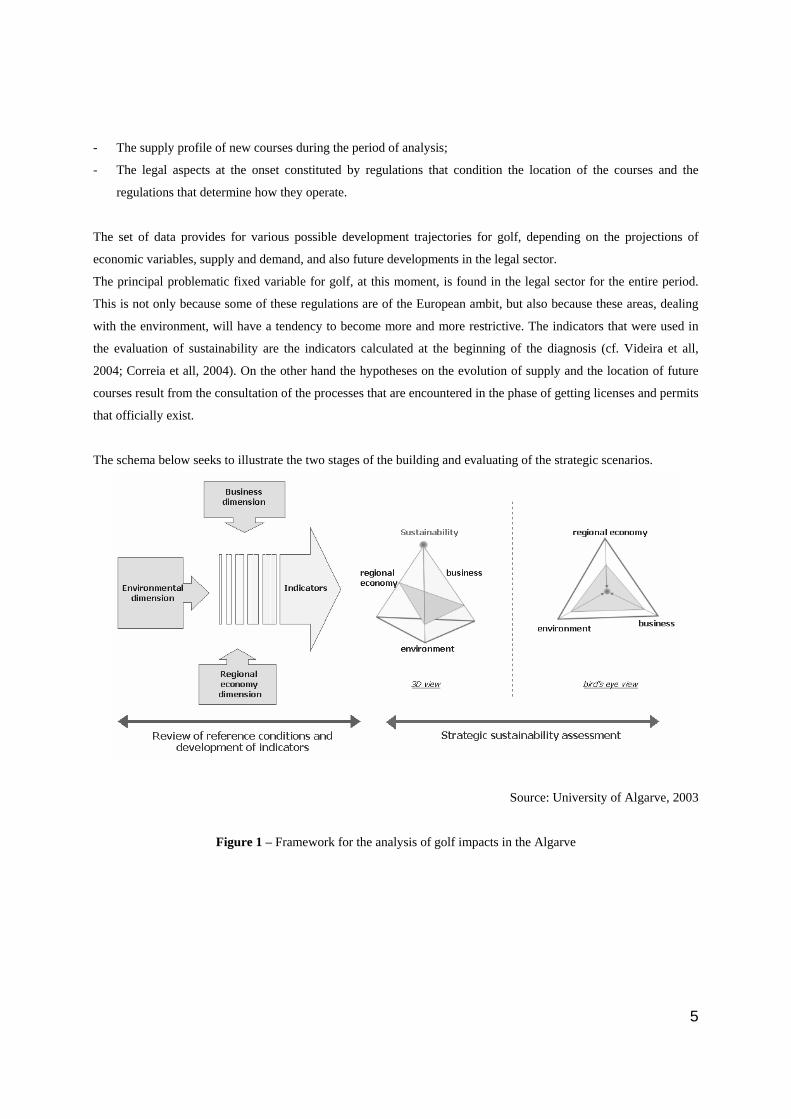
The schema below seeks to illustrate the two stages of the building and evaluating of the strategic scenarios.
Source: University of Algarve, 2003
Figure 1 – Framework for the analysis of golf impacts in the Algarve
6
The strategic sustainability analyis of golf in the Algarve region implies, before all else, that the concept of
“sustainable industry” be defined.
A sustainable industry is simulatneously: Competitive. The competitive capacity of an industry, in this case, is measured by its capacity to
maintain a market, generating profit in the medium and long term, and offering hgh quality services Environmentally responsible The golf industry may impact natural resources and ecosystem functions
through its transformation of land use, the consumption of water, the contamination of soils and
aquifers, and through possible effects on biodiversity, landscape and climate. The protection of these
natural resources is crucial, for this activity, since their quality and quantity represent a competitive
advantage for golf. Generating positive social and economic impacts. Golf is tourism and, as such, is within the principal
economic activity sector of the Algarve. In this sense, its balanced development can contribute to the
generation of a significant impact on the regional product, in employment and in hotel, restaurant and
cultural activity, all the more so in that the most intense period of this activity is during that time of the
year when there is the lowest tourist flow levels. Integrated into regional development. Golf extensively occupies land, and consequently the location of
courses is conditioned by the physical disposition of land and its aptitudes and uses. In addition there is
the obvious, that the activity induces investments in buildings and acceptable accessibility.
The definition of sustainability in the economic sector is not sufficient for practical purposes. For this reason there is
a need to create an approach that allows for the evaluation, if possible, to measure, through its impacts, the
contribution of each of the above mentioned domains: business, regional economy and environment. When an
industry has positive (non-negative) effects in all of the domains, then we can affirm that its development is, in fact.
sustainable.
From the methodological point of view it is necessary to measure, in practical terms, the effects of each scenario in
these diverse domains: Construct an impact chain of the activity for the mid- and long-term; Estimate, with an indicator base, the potential dimension of the impacts whether quantitatively or
qualitatively.
The applying indicators will measure the magnitude of these impacts through multipliers of consumption and
employment for the economic and regional areas, and through an analysis of average club profitability, and the
environmental indicators.
7
A qualitative comparison of scenarios will be performed, since an aggregation of the effects is not viable due to the
differentiated nature of the variables. The synthetic indicator here is the degree of sustainability of each scenario, in
the most simple form but also in most elucidative way, by situating each scenario in the so called “triangle” of
sustainability, presented in figure 1. The scenario is considered most sustainable, to the extent to which it is most
centered in the triangle, which means a greater degree of complementarity and not conflict among competing firms,
protection of the environment and regional development..
3. Variable Scenarios
The constructing of scenarios for golf is founded on this activity’s economic logic, as is the case with any other
industry, which is inserted in a competitive supply and demand based market.
The variable that permits a characterization of the supply and demand, is the number of golf rounds per year, at the
regional level, or sub-region, and at the level of the course. The price that characterizes the market is the average
price per 18-hole round. However, given the actual conditions under which this activity is practiced, this price is not
necessarily the over-the-counter price, which differs from course to course but an average, which is derived from
these prices, and from the prices implicit in the package deals sold.
The supply of rounds/year depends on the number of courses – the installed capacity – and certain other parameters,
which permit the calculation of the maximum number of rounds per year.
The maximum rounds/year needs is the taking into consideration of the estimated theoretical capacity (Universidade
do Algarve, 2003) with the economic capacity of courses. By economic capacity we mean the maximum number of
rounds that is possible to supply without negatively effecting such criteria as course quality or congestion, and, thus,
guaranteeing the profitabity of the business. The growth in supply depends on the price that can be practiced in the
market, the pressure of demand, but also, to a great extent, on the legal conditions of the new courses’ implantation
and location.
This restriction is sufficiently important, to our understanding, so that the supply aspect is decisively conditioned
and that the construction of scenarios must wholly consider everything with the legal element as problematically
uncertain.
3.1 Demand projections
Demand projections for such a long period cannot leave out the consideration of relevant factors such as: the effect of the tendency to incorporate elements of player inertia and fidelity; the effect of new golf courses that create new market diversity, inducing new players; the price effects, resulting from an increase in the number of new players that regularly use nearby golf
courses.
8
Beyond these factors it was assumed the following presuppositions of a qualitative nature: That the quality of the supply (present golf courses and future ones) will continue to exhibit an
equivalent average quality pattern as those existing presently; That the profile of new players will continued to be as defined in the Inquiry, that is: with the same
demands of quality and with the same buying power.
Taking into account these factors, evolution of demand (number of rounds/year) was estimated by an econometric
model (cf. Annex – Demand, Universidade do Algarve 2003) that led to the following results:
Projection without significant effect on the supply A growth of demand at an average rate of 1.55% per year between 2003 and 2020
Projection with an increase of supply A growth of demand at an aveage annual rate of 1.77% per year between 2003 and 2020
Regarding the evolution of average price per round, resulting from the interaction of demand and supply, it is
expected as obvious that the increase in supply would not be favourable to an increase in the real price. However,
the maintenance of quality will permit the maintenance of elevated of prices in some segments of the market which
are always sensitive to differentiation and the permanence of unique characteristics of some of the courses in the
region.
3.2 The legal and institutional framework
The legal and institutional framework for golf development in the Algarve is one of the base elements of the
sustainability scenarios, namely through the integration of the golf courses within the existing land use instruments.
In order to complement the analysis of golf’s supply and demand, a review of the most important legal criteria
related with the licensing process of golf courses is necessary.
According to the legislation concerning public use sporting installations (Decree-law no. 317/97, of 25 November
1997), the Algarve’s Regional Directorate for the Environment and Land Use (DRAOT-Algarve) is responsible for
giving an opinion prior to the location consent for a new golf course. The general criteria followed by this authority
for basing its opinion include the compliance of the proposed location with the municipal master plans (PDM) and a
favourable Environmental Impact Assessment (EIA) decision. A closer examination of the consent criteria indicated
that a positive decision from the DRAOT is also constrained to nature conservation criteria. Thus, the locations
overlapping Natura 2000 sites, national protected areas, aquifer protection zones and the National Ecological
Reserve (REN) are, in principle, subjected to strong restrictions.
9
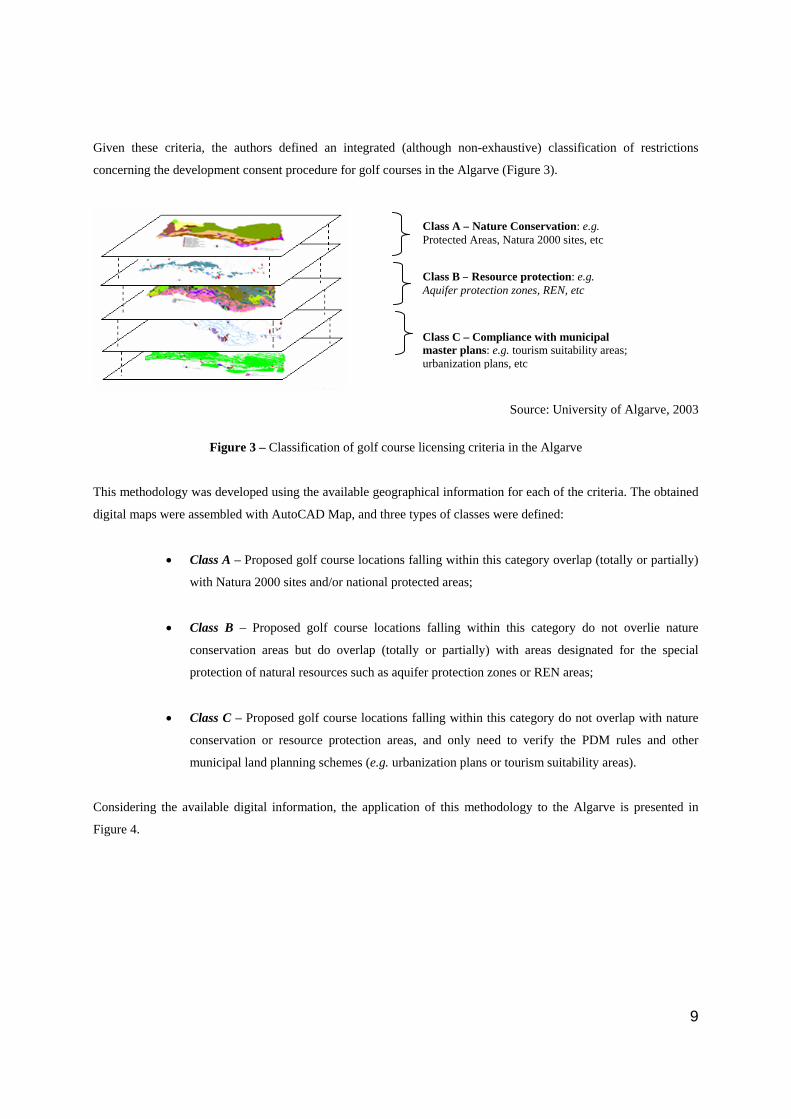
Given these criteria, the authors defined an integrated (although non-exhaustive) classification of restrictions
concerning the development consent procedure for golf courses in the Algarve (Figure 3).
Source: University of Algarve, 2003
Figure 3 – Classification of golf course licensing criteria in the Algarve
This methodology was developed using the available geographical information for each of the criteria. The obtained
digital maps were assembled with AutoCAD Map, and three types of classes were defined:
• Class A – Proposed golf course locations falling within this category overlap (totally or partially)
with Natura 2000 sites and/or national protected areas;
• Class B – Proposed golf course locations falling within this category do not overlie nature
conservation areas but do overlap (totally or partially) with areas designated for the special
protection of natural resources such as aquifer protection zones or REN areas;
• Class C – Proposed golf course locations falling within this category do not overlap with nature
conservation or resource protection areas, and only need to verify the PDM rules and other
municipal land planning schemes (e.g. urbanization plans or tourism suitability areas).
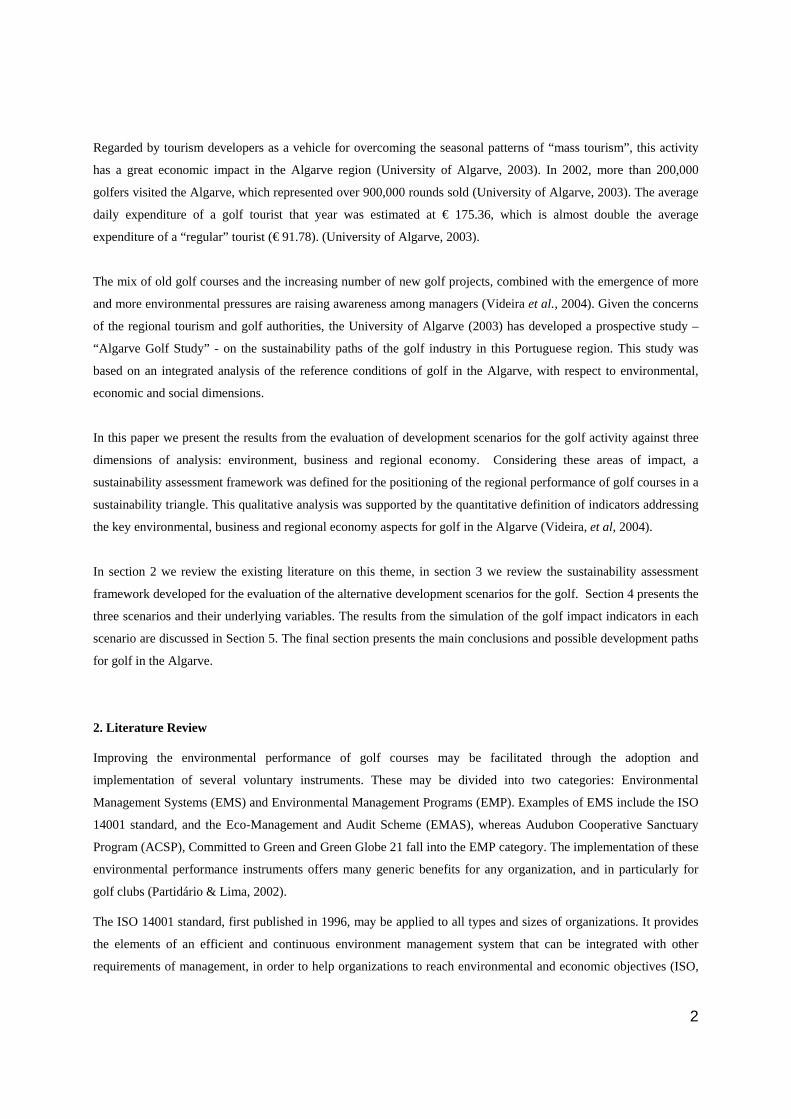
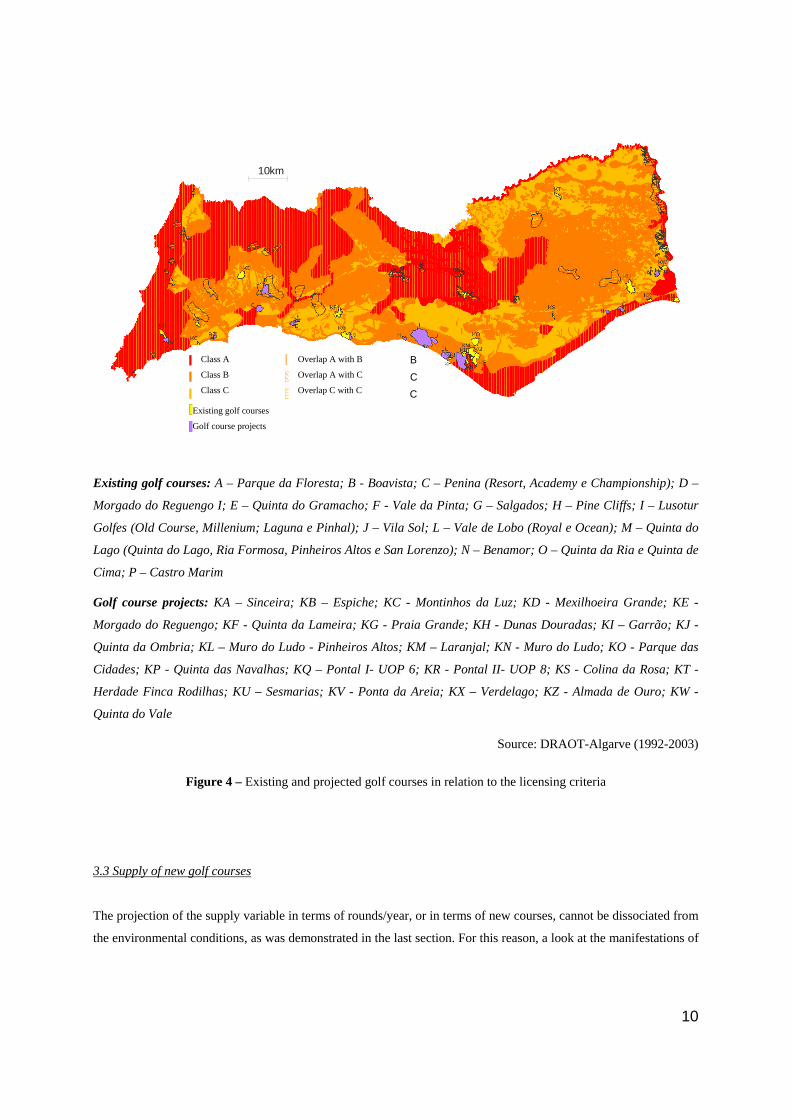
Considering the available digital information, the application of this methodology to the Algarve is presented in
Figure 4.
Class A – Nature Conservation: e.g. Protected Areas, Natura 2000 sites, etc
Class B – Resource protection: e.g. Aquifer protection zones, REN, etc
Class C – Compliance with municipal master plans: e.g. tourism suitability areas; urbanization plans, etc
10
Empreendimentos de golfe previstos
Empreendimentos de golfe em funcionamento
Classe C
Classe B
Classe A
Sobreposição de B com C
Sobreposição de A com C
Sobreposição de A com B
10km
Existing golf courses: A – Parque da Floresta; B - Boavista; C – Penina (Resort, Academy e Championship); D –
Morgado do Reguengo I; E – Quinta do Gramacho; F - Vale da Pinta; G – Salgados; H – Pine Cliffs; I – Lusotur
Golfes (Old Course, Millenium; Laguna e Pinhal); J – Vila Sol; L – Vale de Lobo (Royal e Ocean); M – Quinta do
Lago (Quinta do Lago, Ria Formosa, Pinheiros Altos e San Lorenzo); N – Benamor; O – Quinta da Ria e Quinta de
Cima; P – Castro Marim
Golf course projects: KA – Sinceira; KB – Espiche; KC - Montinhos da Luz; KD - Mexilhoeira Grande; KE -
Morgado do Reguengo; KF - Quinta da Lameira; KG - Praia Grande; KH - Dunas Douradas; KI – Garrão; KJ -
Quinta da Ombria; KL – Muro do Ludo - Pinheiros Altos; KM – Laranjal; KN - Muro do Ludo; KO - Parque das
Cidades; KP - Quinta das Navalhas; KQ – Pontal I- UOP 6; KR - Pontal II- UOP 8; KS - Colina da Rosa; KT -
Herdade Finca Rodilhas; KU – Sesmarias; KV - Ponta da Areia; KX – Verdelago; KZ - Almada de Ouro; KW -
Quinta do Vale
Source: DRAOT-Algarve (1992-2003)
Figure 4 – Existing and projected golf courses in relation to the licensing criteria
3.3 Supply of new golf courses
The projection of the supply variable in terms of rounds/year, or in terms of new courses, cannot be dissociated from
the environmental conditions, as was demonstrated in the last section. For this reason, a look at the manifestations of
Class A
Class B
Class C
Overlap A with B
Overlap A with C
Overlap C with C
Existing golf courses
Golf course projects
11
intentions to build new courses, in which some permission processes are found at an advanced stage with the public
entities, shows that the supply projection obeys the following proceeding:
a) The consideration of the extreme cases:
• on the minimal end of this continuum would be to project the 2020 supply from the number of courses
having received licenses by the end of 2003;
• the maximal end would be to count and consider all on-going licensing petitions and known pretensions
as eventually getting approval and the courses being operational by 2020.
b) The consideration of an intermediate situation is to admit that some of those present petitions for licensing
will eventually get approval, be built, and be part of a sustainable solution from the environmental, economic
and financial perspectives.
Looking at the existing locations and those petitions where there already exists a concrete location (See Figure 4),
three working hypotheses are elaborated that constitute many other projections of supply. The supply is measured in
equivalent courses (18 holes). The average period considered, from the initial request for licensing of the golf course
till it is fully functioning, is between three and four years in the typical processual situation.
3.4 Development hypothesis
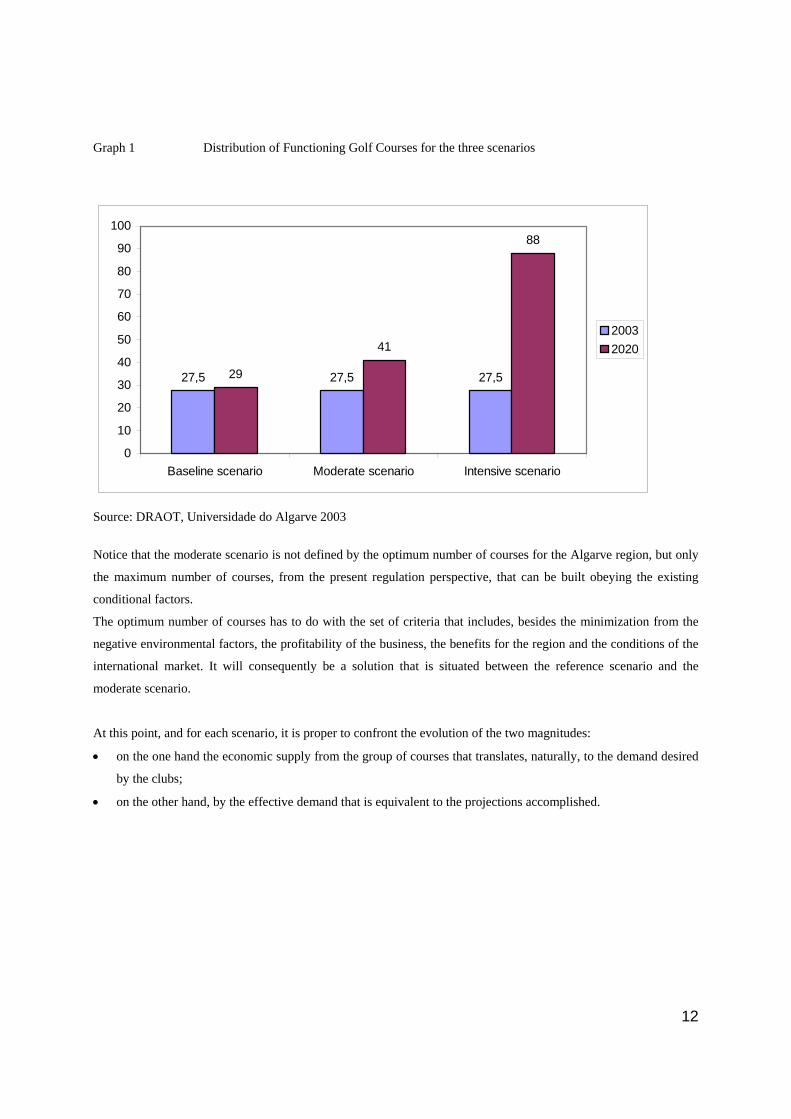
In the designated baseline reference scenario includes the courses presently in operation, the courses in construction
and those whose licenses were predicted to be concluded with approval by the end of 2003. This comprises a total of
32 courses (equivalent to 29 eighteen-hole courses).
In the designated intensive sceanrio there are 91 courses (equivalent to 88 eighteen-hole courses) in this scenario
which considers all of the functioning courses and all of the intended courses as approved and running by 2020. This
constitutes the extreme case in the easing of restrictions and the implantation of golf courses.
The moderate scenario considers a maximum limit of 44 courses (equivalent to 41 eighteen-hole courses). This
includes those courses presently operating, the courses in construction, those whose licensing process consultations
show a high probability of approval, and also, whose intentions concerned with location respect the conditions
presented on the previously presented map summary.
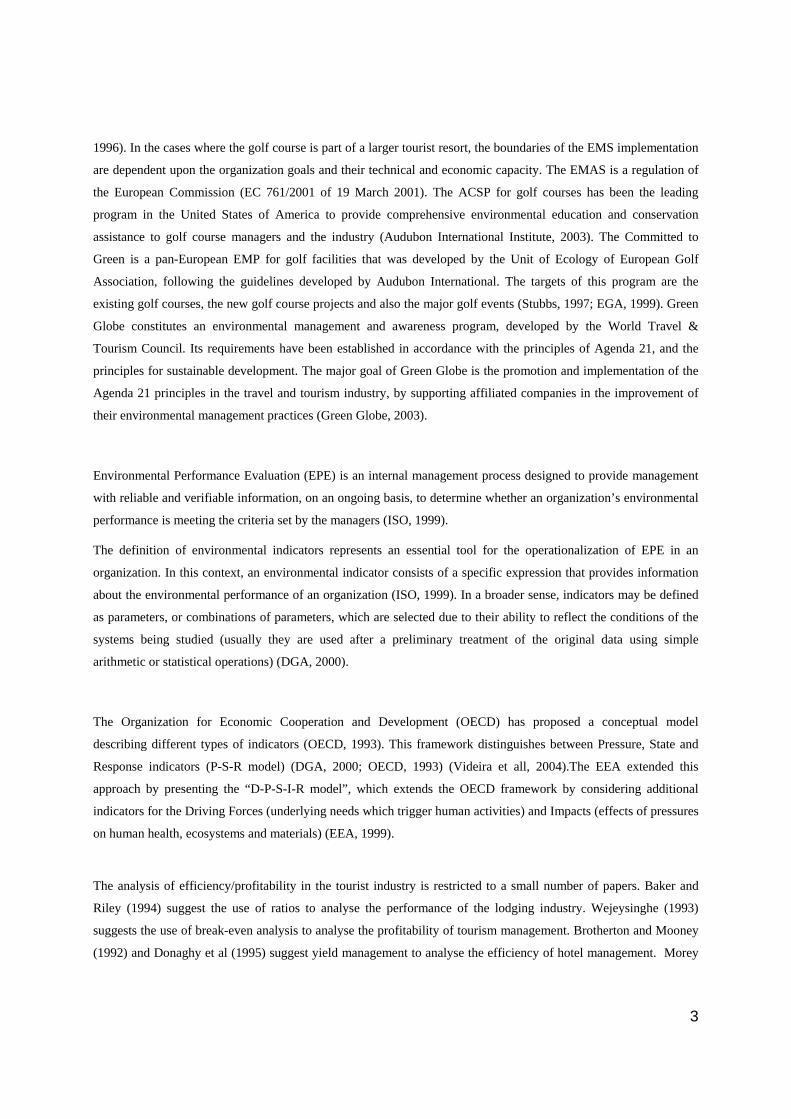
The distribution of golf course supply for the three hypotheses is presented in Graph 1.
12
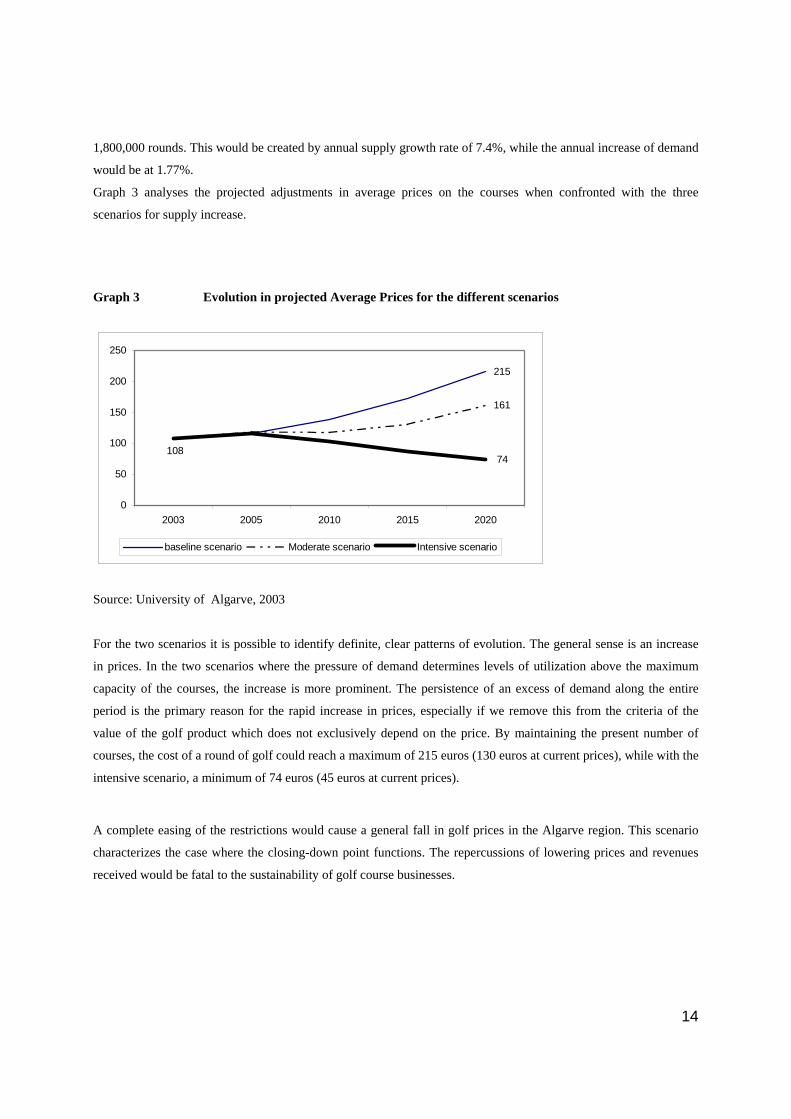
Graph 1 Distribution of Functioning Golf Courses for the three scenarios
Total water consumption for irrigation hm3 12.70 4.88 17.93 6.90 38.54 14.82
Total surface water consumption for irrigation hm3 1.54 0.24 2.18 0.33 4.69 0.72
Total groundwater consumption for irrigation hm3 9.99 3.65 14.10 5.17 30.30 11.10
Total domestic water consumption for irrigation hm3 0.69 0 0.98 0 2.10 0
Total recycled wastewater consumption for
irrigation hm3 0.48 0.99 0.67 1.40 1.45 3.00
Total electricity consumption MWh 6.66 1.61 9.41 2.28 20.20 4.89
Total consumption of phytopharmaceutical
products t 9.00 3.62 12.70 5.11 27.30 11
Total consumption of fertilizers t 711 185 1000 261 2160 560
Total waste production t 2,640 1,310 3,730 1,860 8,010 3,990
Total green waste production t 2,100 633 2,970 894 6,370 1,920
Source: University of Algarve, 2003
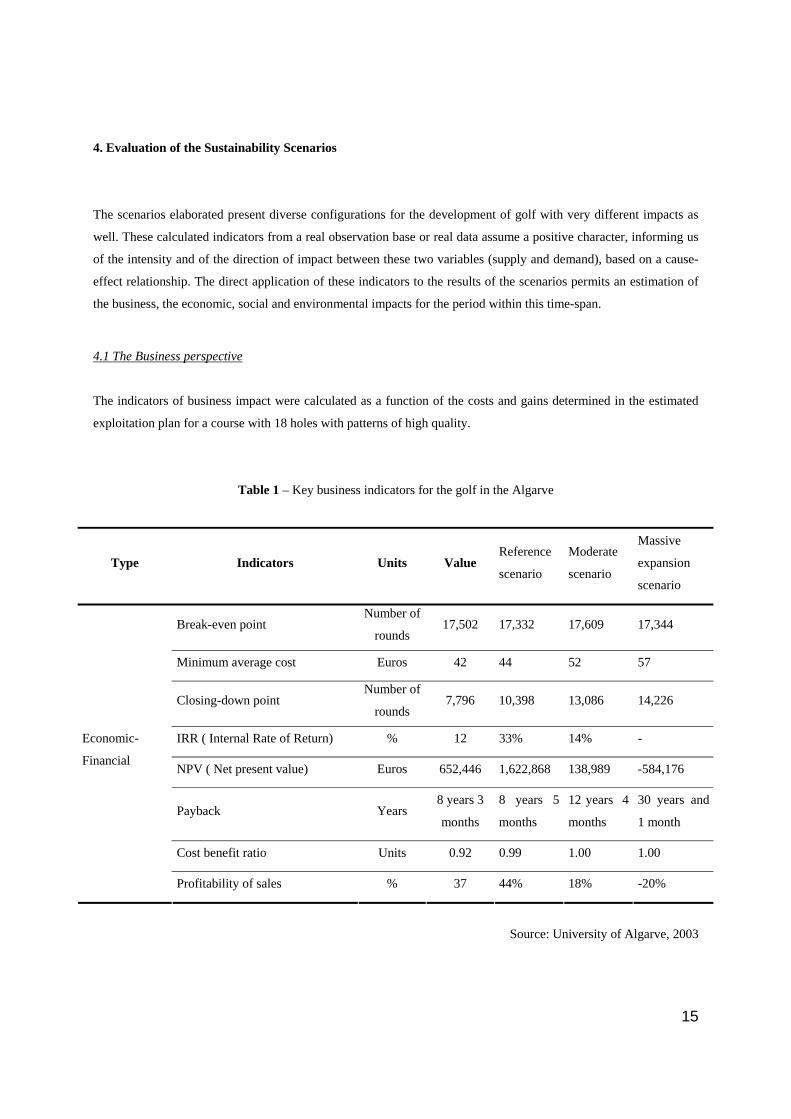
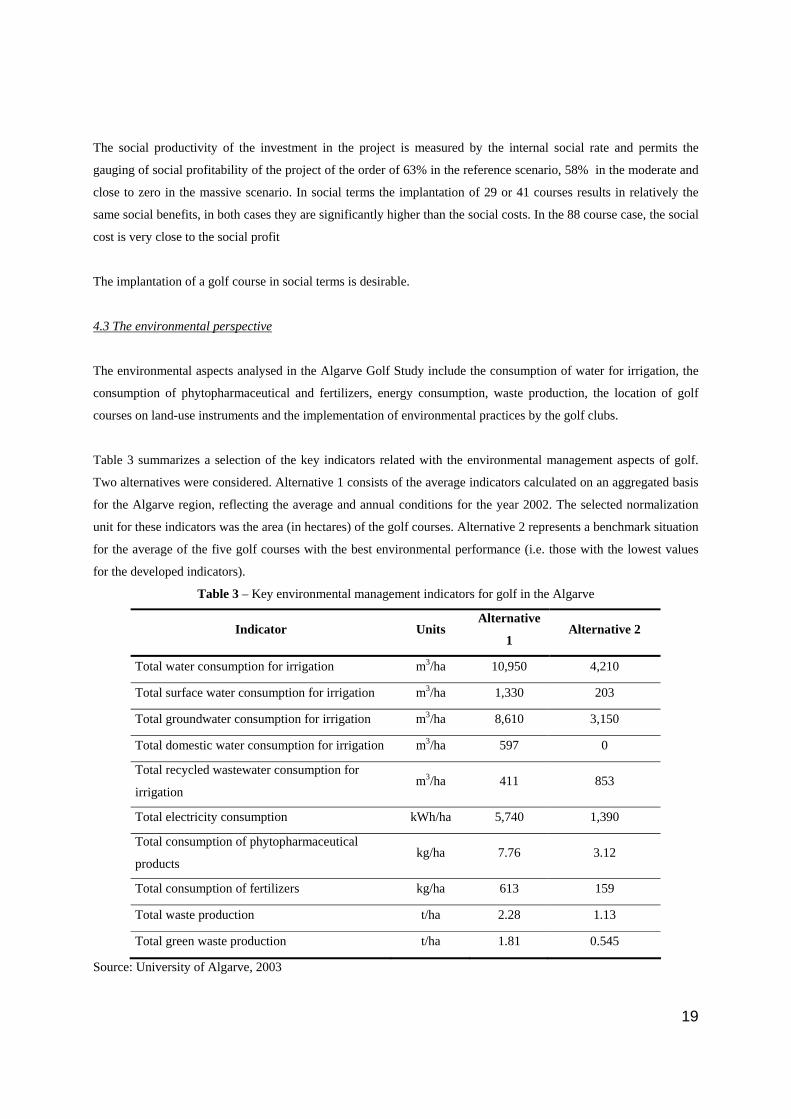
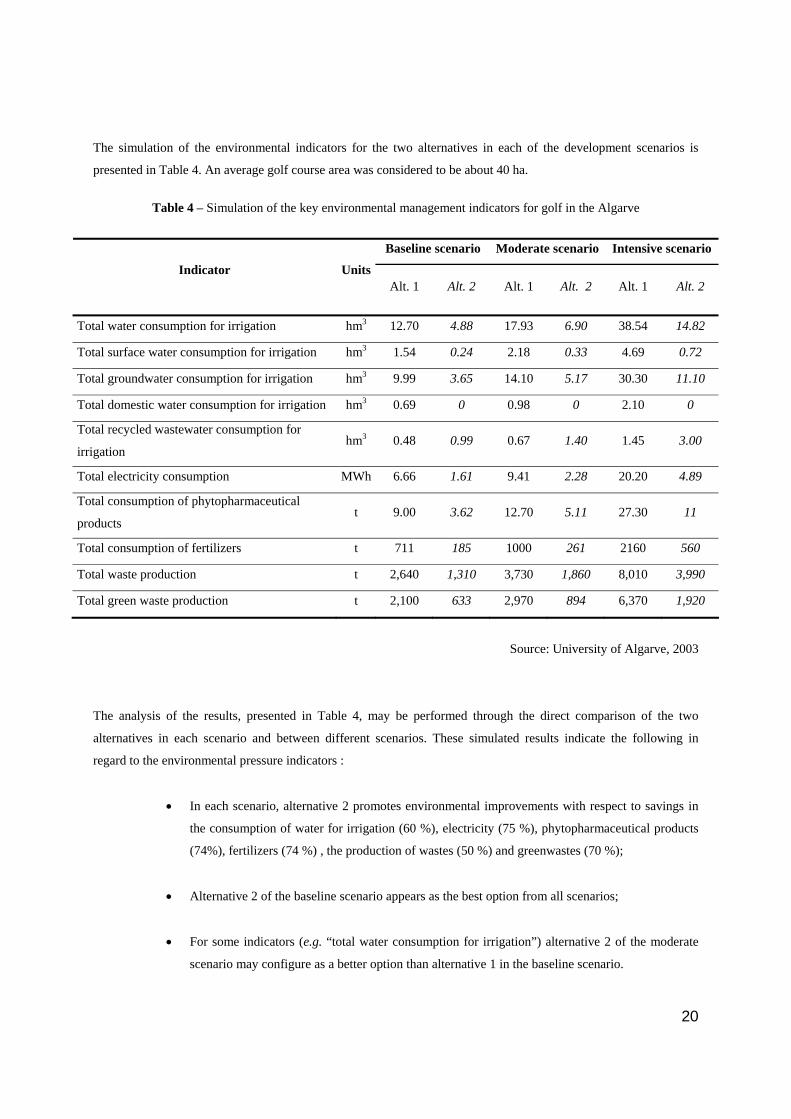
The analysis of the results, presented in Table 4, may be performed through the direct comparison of the two
alternatives in each scenario and between different scenarios. These simulated results indicate the following in
regard to the environmental pressure indicators :
• In each scenario, alternative 2 promotes environmental improvements with respect to savings in
the consumption of water for irrigation (60 %), electricity (75 %), phytopharmaceutical products
(74%), fertilizers (74 %) , the production of wastes (50 %) and greenwastes (70 %);
• Alternative 2 of the baseline scenario appears as the best option from all scenarios;
• For some indicators (e.g. “total water consumption for irrigation”) alternative 2 of the moderate
scenario may configure as a better option than alternative 1 in the baseline scenario.
21
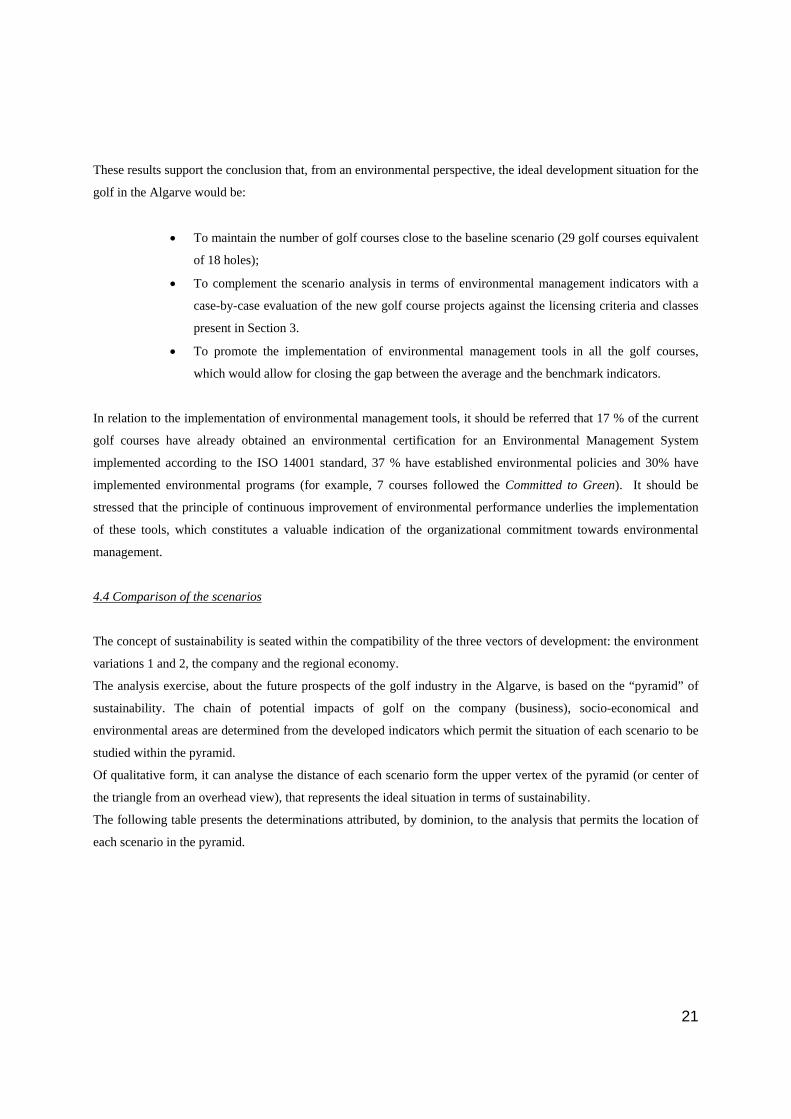
These results support the conclusion that, from an environmental perspective, the ideal development situation for the
golf in the Algarve would be:
• To maintain the number of golf courses close to the baseline scenario (29 golf courses equivalent
of 18 holes);
• To complement the scenario analysis in terms of environmental management indicators with a
case-by-case evaluation of the new golf course projects against the licensing criteria and classes
present in Section 3.
• To promote the implementation of environmental management tools in all the golf courses,
which would allow for closing the gap between the average and the benchmark indicators.
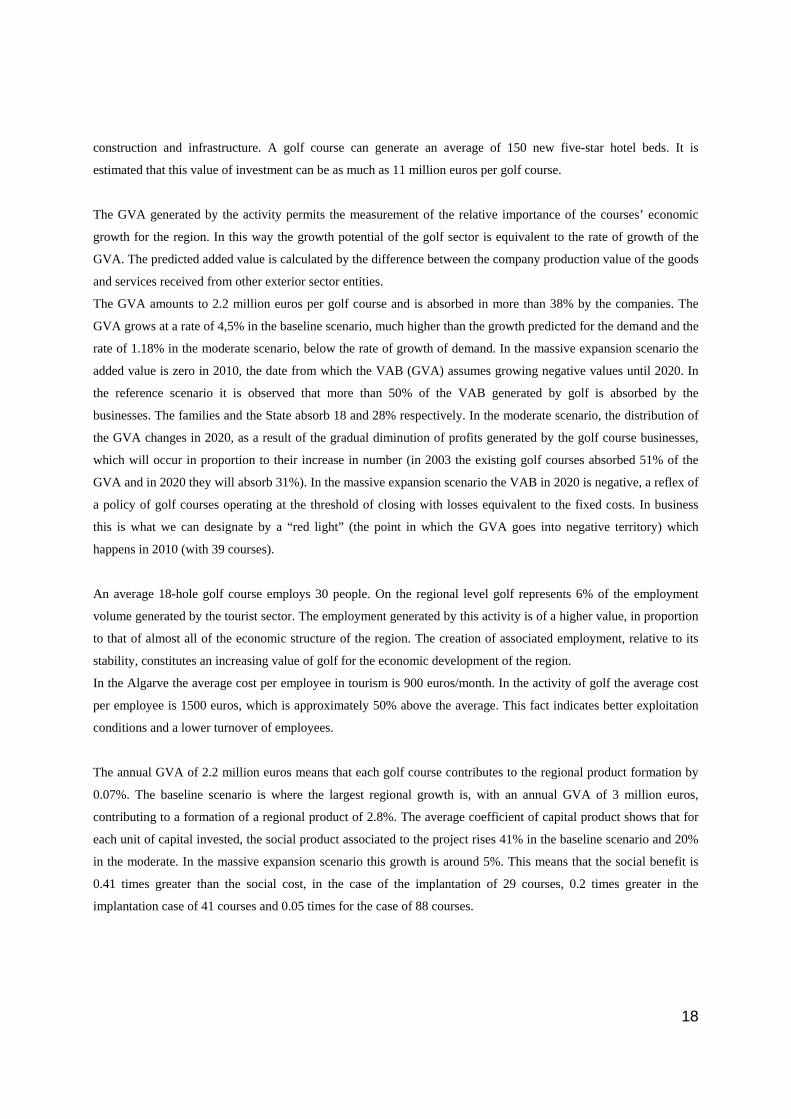
In relation to the implementation of environmental management tools, it should be referred that 17 % of the current
golf courses have already obtained an environmental certification for an Environmental Management System
implemented according to the ISO 14001 standard, 37 % have established environmental policies and 30% have
implemented environmental programs (for example, 7 courses followed the Committed to Green). It should be
stressed that the principle of continuous improvement of environmental performance underlies the implementation
of these tools, which constitutes a valuable indication of the organizational commitment towards environmental
management.
4.4 Comparison of the scenarios
The concept of sustainability is seated within the compatibility of the three vectors of development: the environment
variations 1 and 2, the company and the regional economy.
The analysis exercise, about the future prospects of the golf industry in the Algarve, is based on the “pyramid” of
sustainability. The chain of potential impacts of golf on the company (business), socio-economical and
environmental areas are determined from the developed indicators which permit the situation of each scenario to be
studied within the pyramid.
Of qualitative form, it can analyse the distance of each scenario form the upper vertex of the pyramid (or center of
the triangle from an overhead view), that represents the ideal situation in terms of sustainability.
The following table presents the determinations attributed, by dominion, to the analysis that permits the location of
each scenario in the pyramid.
22
Table 5 Positioning of each scenario in relation to sustainability
Area of analysis Reference Scenario Moderate Scenario Massive Scenario
Environment ⊗⊗⊗ ⊗⊗ ⊗
Company ⊗⊗⊗ ⊗⊗ ⊗
Regional Economy ⊗ ⊗⊗⊗ ⊗⊗
Scale: ⊗ far; ⊗⊗ near; ⊗⊗⊗ very near
Source: Universidade do Algarve, 2003
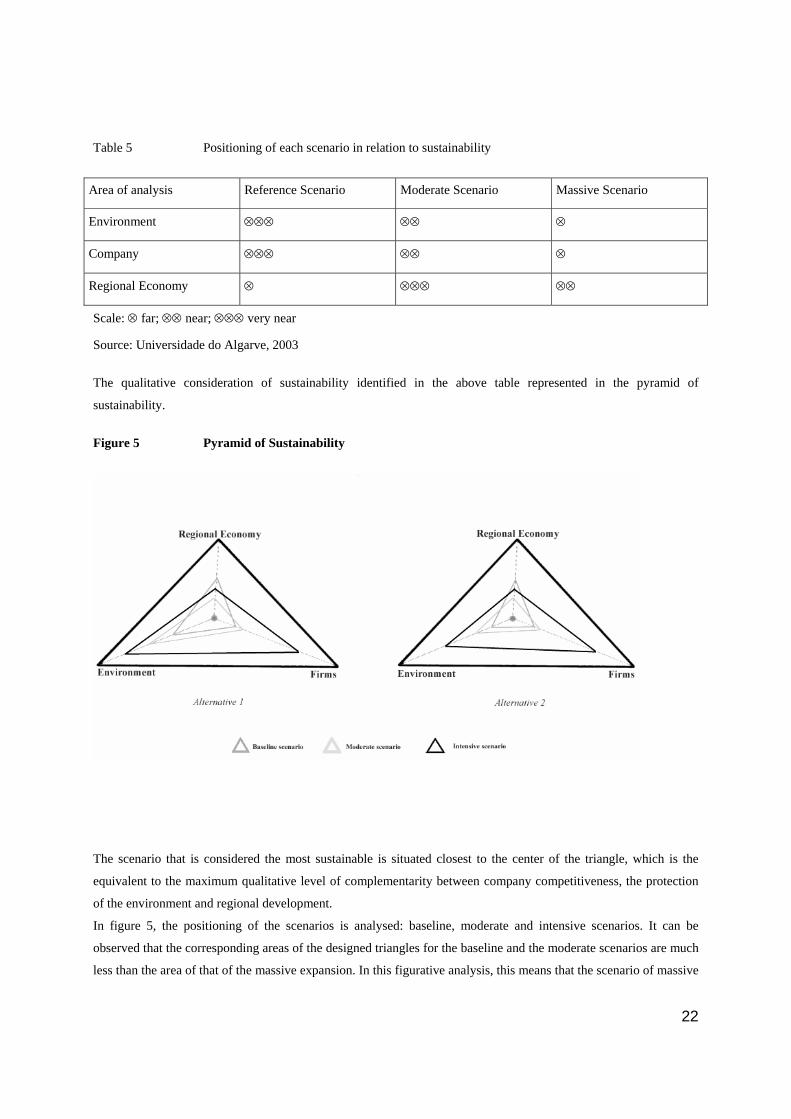
The qualitative consideration of sustainability identified in the above table represented in the pyramid of
sustainability.
Figure 5 Pyramid of Sustainability
The scenario that is considered the most sustainable is situated closest to the center of the triangle, which is the
equivalent to the maximum qualitative level of complementarity between company competitiveness, the protection
of the environment and regional development.
In figure 5, the positioning of the scenarios is analysed: baseline, moderate and intensive scenarios. It can be
observed that the corresponding areas of the designed triangles for the baseline and the moderate scenarios are much
less than the area of that of the massive expansion. In this figurative analysis, this means that the scenario of massive
23
expansion is the most distant from the central point of sustainability. In the direct confrontation between the
reference scenario and the moderate, it can be noted that there is a trade-off between the vertices of impact. The
reference scenario has a lesser negative environmental impact, and while it is the scenario that generates the greatest
gains in business competitiveness, it also is more associated with the overcrowding of the courses. The comparative
analysis with the moderate scenario reveals that the amplitude of the variation between the business gains is not
significant, if compared to the situation of excellence obtained in the level of occupation of the courses. The massive
expansion scenario obtains the worst performance (furthest from centre) in terms of environmental and business
impacts. The gains at a regional economic level derived from this scenario grow at a decreasing rate when they are
placed in an indifferent situation with the moderate scenario.
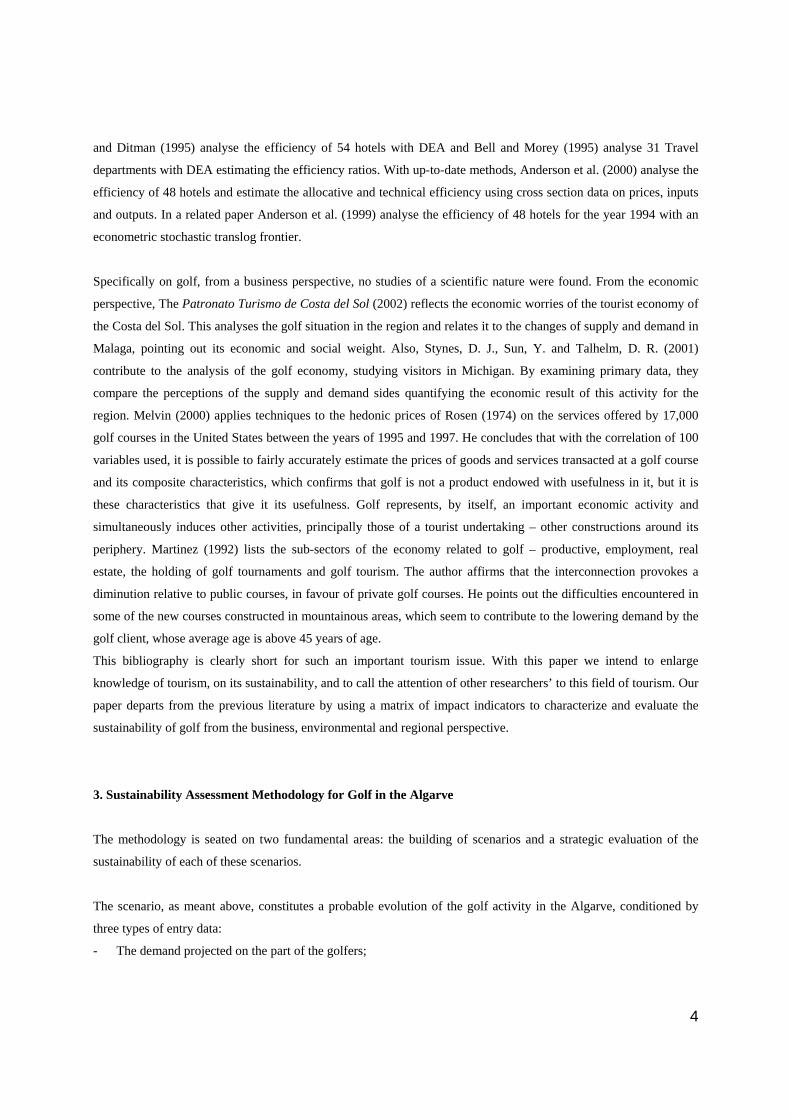
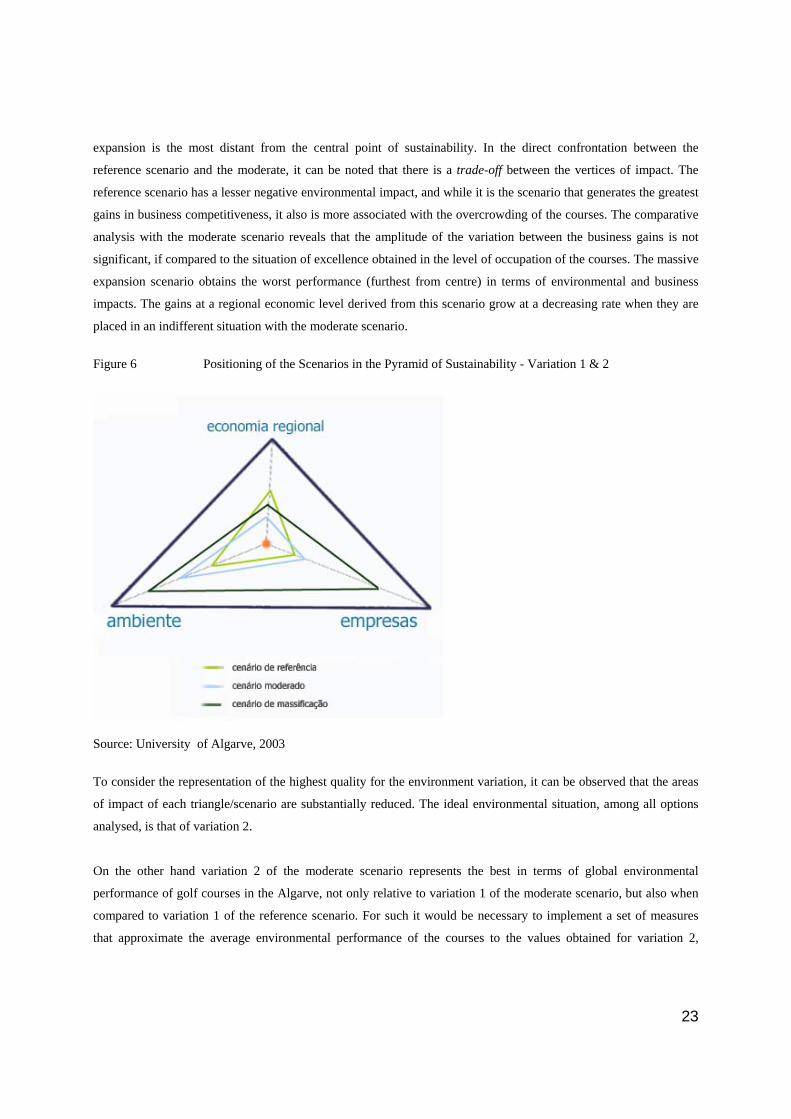
Figure 6 Positioning of the Scenarios in the Pyramid of Sustainability - Variation 1 & 2
Source: University of Algarve, 2003
To consider the representation of the highest quality for the environment variation, it can be observed that the areas
of impact of each triangle/scenario are substantially reduced. The ideal environmental situation, among all options
analysed, is that of variation 2.
On the other hand variation 2 of the moderate scenario represents the best in terms of global environmental
performance of golf courses in the Algarve, not only relative to variation 1 of the moderate scenario, but also when
compared to variation 1 of the reference scenario. For such it would be necessary to implement a set of measures
that approximate the average environmental performance of the courses to the values obtained for variation 2,
24
without forgetting the beforehand need to cautiously locate the new curses and evaluate their predicted
environmental impact in this scenario.
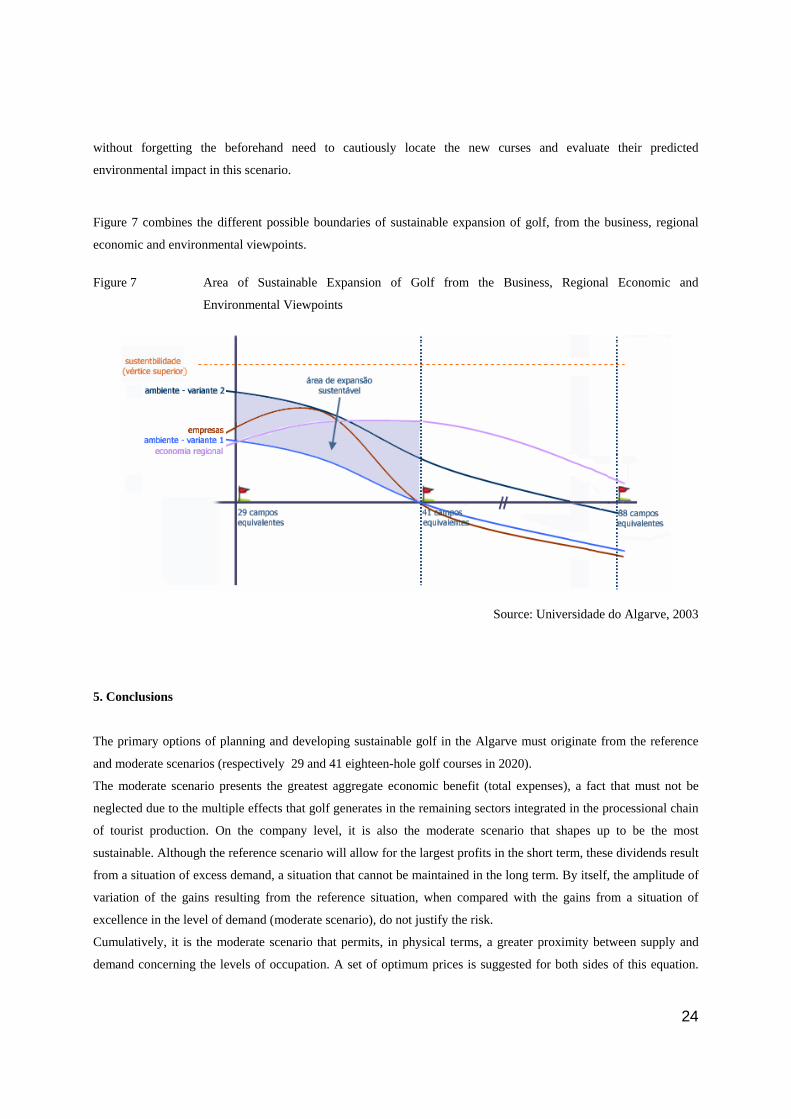
Figure 7 combines the different possible boundaries of sustainable expansion of golf, from the business, regional
economic and environmental viewpoints.
Figure 7 Area of Sustainable Expansion of Golf from the Business, Regional Economic and
Environmental Viewpoints
Source: Universidade do Algarve, 2003
5. Conclusions
The primary options of planning and developing sustainable golf in the Algarve must originate from the reference
and moderate scenarios (respectively 29 and 41 eighteen-hole golf courses in 2020).
The moderate scenario presents the greatest aggregate economic benefit (total expenses), a fact that must not be
neglected due to the multiple effects that golf generates in the remaining sectors integrated in the processional chain
of tourist production. On the company level, it is also the moderate scenario that shapes up to be the most
sustainable. Although the reference scenario will allow for the largest profits in the short term, these dividends result
from a situation of excess demand, a situation that cannot be maintained in the long term. By itself, the amplitude of
variation of the gains resulting from the reference situation, when compared with the gains from a situation of
excellence in the level of demand (moderate scenario), do not justify the risk.
Cumulatively, it is the moderate scenario that permits, in physical terms, a greater proximity between supply and
demand concerning the levels of occupation. A set of optimum prices is suggested for both sides of this equation.
25
This way excessive pressures on the demand side will not occur (demand does not overpass optimum levels of
occupation); while also assuring that there will not be excessive pressure from a situation of oversupply (danger of a
degradation of prices and quality).
Here results the highest economic performance for a convergence on equilibrium at the optimum levels of quality.
The moderate scenario is the one that must be taken as the first economic option in the future development of the
golf product in the Algarve.
Lastly, in relation to the criticisms evidenced in the massive expansion scenario, there will moves to deviate from
the number 41, for the limiting number of golf courses in 2020. It is preferable, for economic results, in the regional
ambit, that deviations from the plan are marked out from the reference scenario. That is, that the planning and
development of golf in the Algarve must assume that the number, 41 courses, must be the limit from above, and not
from below.
In the frame of expansion of golf courses until this limit, as was previously mentioned, it would be necessary to
adopt a set of measures that permit the approximation of an average environmental performance of the courses, to
the values obtained in variation 2. By doing so, the moderate scenario will not increase the environmental pressures
generated by the operation of new golf courses that, for their part, produce impacts on the natural element of the
region.
It can be verified that the impact of more than 41 golf course equivalents does not permit a sustainable expansion of
golf in the Algarve. It is concluded that between 29 and 41 golf courses are sustainable in the Algarve from
economic, business (company) and environmental standpoints.
References Correia, A. Martins, V. (2004) “Competitiveness and Efficiency in Golf Industry: The Case of
Algarve”, Proceedings of the International Atlantic Economic Conference, Lisbon, Portugal.
Portuguese Golf Federation (2002) Campos de golfe públicos da cidade, à vila, à aldeia, Lisbon:
Portuguese Golf Federation
Portuguese Golf Federation (2003) “Campos”, http://www.fpg.pt, accessed 5 February 2003
University of Algarve (2003) Algarve Golf Study, Faro: University of Algarve.
26
Videira, N.; Correia, A.; Alves, I.; Ramires, C.; Subtil, R., Martins, V. (2004) “Environmental
and economic tools to support sustainable golf tourism: the Algarve experience, Portugal”,
Proceedings of the Tourism: State of the Art II Conference, Glasgow, Scotland.
Anderson, R.I. ; Fish, M. ; Xia, Y. and Michello, F. (1999) Measuring Efficiency in the hotel Industry: A stochastic Frontier Approach. Hospitality management, 18:45-57. Anderson, R.I.; Fok, R. and Scott, J. (2000) Hotel Industry Efficiency: An Advanced Linear Programming Examination. American Business Review, 18,1:40-48. Audubon International Institute (2003) “Audubon Cooperative Sanctuary System”, http://www.audubonintl.org/programs/acss/golf.htm, accessed 5 February 2003. Baker, M. and Riley, M. (1994) New Perspectives on Productivity in Hotels: Some Advances
and new directions. International Journal of Hospitality Management, 13 (4):297-311.
Bell, R.A. and Morey, R.C. (1995) Increasing the Efficiency of Corporate Travel Management through Macro Benchmarking. Journal of Travel Research,11-20.
Brotherton, B. and Mooney, S. (1992) Yield Management Progress and Prospects. International
Journal of Hospitality Management, 11 (1):23-32.
DGA – Direcção Geral do Ambiente (2000) Proposta Para Um Sistema de Indicadores de Desenvolvimento Sustentável, Lisbon: DGA. DRAOT – Direcção Regional de Ambiente e Ordenamento do Território do Algarve (2003) Avaliação da Situação dos Campos de Golfe no Algarve – Working Paper, Faro: DRAOT-Algarve. Donaghy, K.; McMahon, U. and McDowell, D. (1995) Yield Management: An overview. International Journal of Hospitality Management, 14 (2):1339-1350. EEA – European Environment Agency (1999) Environmental Indicators: Typology and Overview, Copenhagen: EEA. European Commission (2001) “Regulation (CE) n.° 761/2001 of the European Parliament and of the Council, 19 March 2001, establishing the Eco-Management and Audit Scheme”, Official Journal of the European Union, L 114 de 24/04/2001 p. 0001 – 0029. European Golf Association (EGA) (1999) “The Committed to Green Campaign”, http://www.golfecology.com/comtogrn/com_camp.htm, accessed 5 February 2003.
27
Green Globe (2003) “Sustainable 21st Century Tourism”, http://www.greenglobe21.com, accessed 5 February 2003. INAG-Instituto da Água (2000) Plano de Bacia Hidrográfica das Ribeiras do Algarve, Lisbon: INAG. INAG-Instituto da Água (2001) Programa Nacional Para o Uso Eficiente de Água, Lisbon: INAG. INE (2002) Anuário Estatístico da Região do Algarve, Faro: Instituto Nacional de Estatística. ISO (1996) ISO 14001:1996, Environmental Management System-Specification With Guidance for Use, Switzerland: ISO.
ISO (1999) ISO 14031:1999, Environmental Management-Environmental Performance
Evaluation-Guidelines, Switzerland: ISO.
Martinez, E. O. (1992) La Economía del golf. Su Evolución en el mundo y en España, Estudios
Turísticos, 114, 19-40.
Morey, R.C. and Dittman, D.A. (1995) Evaluating a Hotel GM’s performance: a case Study in
Benchmarking. Cornell Hotel Restaurant & Administration Quarterly, 36 (5):30-35.
OCDE (1993) OECD Core Set of Indicators for Environmental Performance Reviews: A Synthesis Report by the Group on the State of the Environment, Paris: OECD. Partidário, M.R., Lima, S. (2002) Novos Turistas e a Procura da Sustentabilidade - Um Novo Segmento do Mercado Turístico, Lisbon: GEPE. Patronato Turismo da Costa del Sol (2002) Resumen del Estúdio El Turismo de Golfe na Costa
del Sol, Patronato Turismo Costa del Sol.
Portuguese Golf Federation (2002) Campos de golfe públicos da cidade, à vila, à aldeia, Lisbon: Portuguese Golf Federation Portuguese Golf Federation (2003) “Campos”, http://www.fpg.pt, accessed 5 February 2003 Stubbs, D. (1997) Committed to Green Manual for Golf Courses, Lisbon: Portuguese Golf Federation.
28
Stynes, D. J., Y. Sun e D. R. Talhelm (2001) Michigan Golf Tourists – Economic Impacts,
Department of Parks, Recreation and Tourism Resources Michigan State University.
University of Algarve (2003) Algarve Golf Study, Faro: University of Algarve. Wejeysinghe, B.S. (1993) Breakeven Occupancy for hotel operation. Management Accounting,