DEVELOPMENT SERVICING PLAN FOR YASS VALLEY COUNCIL SEWERAGE ADOPTED: 22/ 05/2013 EFFECTIVE: 23/ 05/2013 MARCH 2013 This is a development servicing plan which has been prepared in accordance with Section 64 of the Local Government Act, 1993, and Section 306 of the Water Management Act, 2000.
Transcript
DEVELOPMENT SERVICING PLAN
FOR
YASS VALLEY COUNCIL SEWERAGE
ADOPTED: 22/ 05/2013 EFFECTIVE: 23/ 05/2013
MARCH 2013 This is a development servicing plan which has been prepared in accordance
with Section 64 of the Local Government Act, 1993, and Section 306 of the Water Management Act, 2000.
DISCLAIMER Any information (numerical or otherwise), representation, statement, opinion or advice expressed or implied in this publication is made in good faith but on the basis that Yass Valley Council, its agents and employees are not liable (whether by reason of negligence, lack of care or otherwise) to any person for any damage or loss whatsoever which has occurred or may occur in relation to that person taking or not taking (as the case may be) action in respect of any information, representation, statement, or advice referred to above.
YASS VALLEY COUNCIL DEVELOPMENT SERVICING PLAN (DSP) - SEWERAGE
TABLE OF CONTENTS
Summary i
1. THE INTRODUCTION 1
1.1 Legislation 1
1.2 Purpose of the DSP 1
1.3 Land to which the DSP Applies 1
1.4 Calculation Guidelines 1
1.5 Date From Which This DSP Comes Into Effect 1
1.6 Relationship Between The DSP and other Existing Policies or Plans 2
1.7 Assets Relevant to the DSP 2
1.7.1 Collection Systems 2
1.7.2 Treatment Works 2
1.7.2 Reticulation 2
2. METHODOLOGY 2
2.1 Calculation Method for Developer Charges 2
2.1.1 General Methodology 2
2.1.2 Detailed Methodology 3
2.2 Tenement and Demand Estimates 3
2.3 Works Covered by This DSP 3
2.4 Cost Estimates 4
3. WORKS INCLUDED AND COST ESTIMATES 4
4. LEVELS OF SERVICE AND DESIGN PARAMETERS FOR SEWERAGE 4
4.1 Levels of Service 4
4.2 Design Parameters 5
5. DEVELOPER CHARGES 5
5.1 Reticulation 5
5.2 Collection Systems and Treatment Works 5
5.3 Payment of Developer Charges 5
5.3.1 Timing of Payments 5
5.3.2 Method of Payment 6
5.3.3 Works-in-Kind Contributions 6
5.4 Staged Subdivision/Development 7
5.5 Reviewing and Revising of Developer Charges 8
6. REFERENCES 9
APPENDIX No. 1 - State Environmental Planning Pol ic ies Applying To Yass Val ley Counci l Sewerage 10
APPENDIX No. 2 - Yass Val ley Counci l – Other DSP’s Relevant 11
APPENDIX No. 3 - Plans Of Serv ice Areas 12
APPENDIX No. 4 – Calculat ions 13
Yass Valley Council Page i Development Servicing Plan for Sewerage
DEVELOPMENT SERVICING PLAN - SEWERAGE
Summary
This Development Servicing Plan (DSP) covers sewerage Developer Charges (DC) for the Yass Valley Council.
This DSP has been prepared with consideration to Developer Charges Guidelines for Water Supply, Sewerage and Stormwater (2012) Consultation Draft. These are the latest relevant guidelines, managed by the NSW Office of Water (NOW). The sewerage system for which Yass Valley Council seeks to levy DC includes collector mains, pump stations and a treatment plant. Reticulation and associated pump stations, rising mains are provided by developers as part of the subdivision/development works. This DSP aims to:
1. Allow Council to require an equitable monetary contribution for the provision of
sewerage infrastructure to meet the loading generated by development.
2. Facilitate the future provision of sewerage services to the Yass Valley Council area which meets the required levels of service with regard to pump station capacity, collector main capacity, treatment plant capacity and treated effluent quality.
3. Set out the schedule and programme of proposed works to meet increasing
sewerage loads generated by development.
4. Detail the contribution rates and Yass Valley Council’s payment policies. To enable this, a future demand estimate of sewerage load for the Council has been
undertaken. The demand estimate is the basis used for determining the infrastructure required to meet the need generated by future development.
DC are applicable for existing and proposed works which serve future development. Section 3 details the existing works and proposed works schedule for sewerage
infrastructure to meet the expected loading.
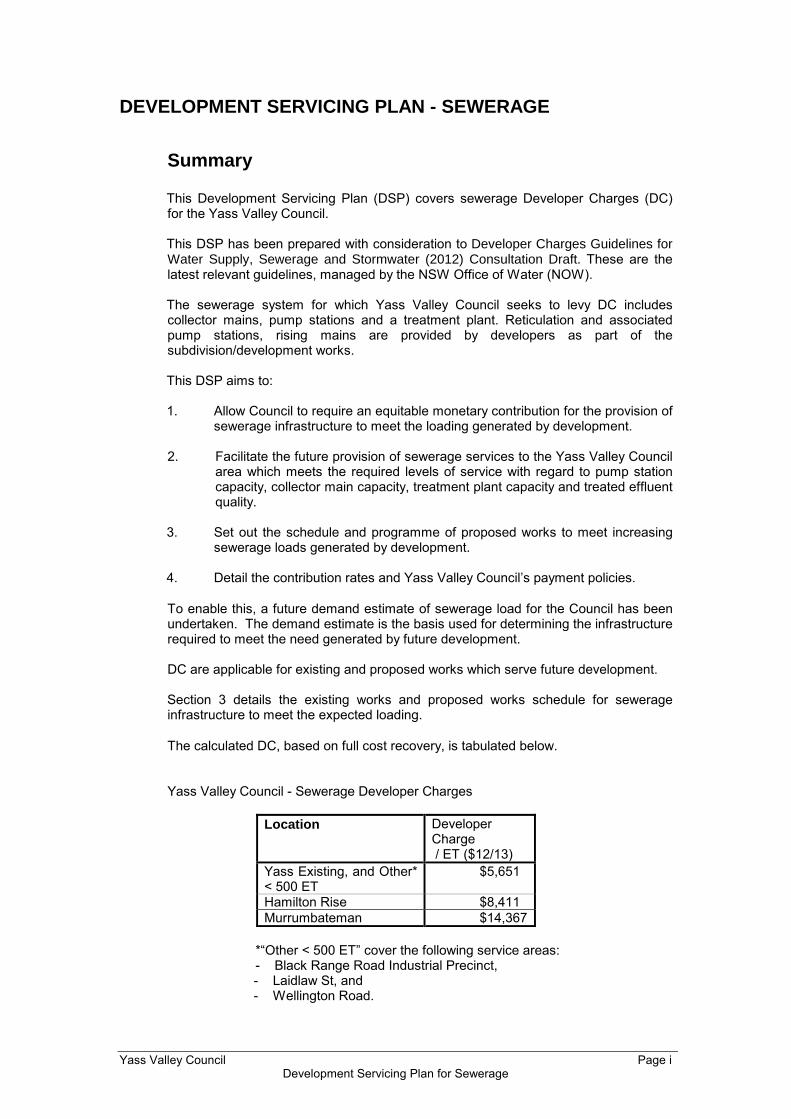
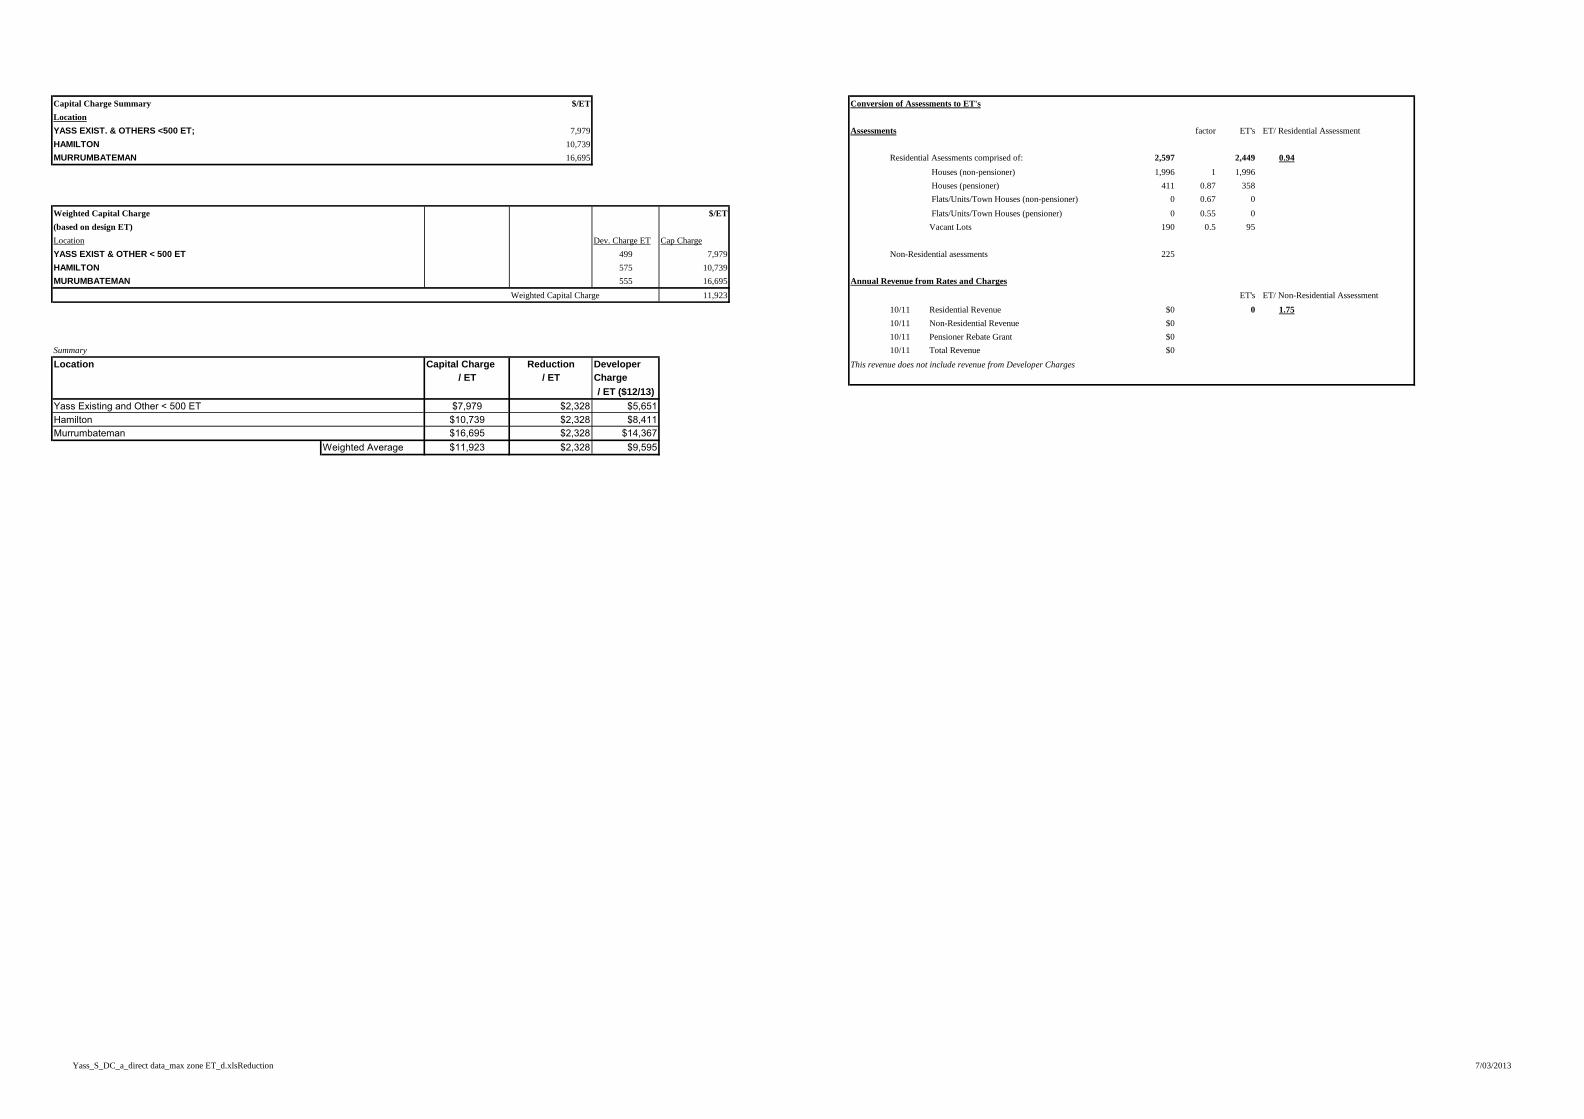
The calculated DC, based on full cost recovery, is tabulated below. Yass Valley Council - Sewerage Developer Charges
Location Developer Charge / ET ($12/13)
Yass Existing, and Other* < 500 ET
$5,651
Hamilton Rise $8,411 Murrumbateman $14,367
*“Other < 500 ET” cover the following service areas: - Black Range Road Industrial Precinct,
- Laidlaw St, and - Wellington Road.
Yass Valley Council Page ii Development Servicing Plan for Sewerage
DC calculations relating to this DSP will be reviewed after a period of five to six years, or when any significant changes occur in proposed works, growth projections or standards. In the period between any reviews, DC will be revised on 1 July each year on the basis of movements in the Consumer Price Index (CPI) for Canberra, in the preceding 12 months to December, excluding the impact of GST. There are a number of payment methods for DC and Works-in-K ind contributions are allowable subject to certain conditions. The developer shall be responsible for the full cost of the design and construction of sewerage reticulation works within subdivisions, including pump stations and rising mains.
Yass Valley Council Page 1 Development Servicing Plan for Sewerage
1. The Introduction
1.1 Legislation Section 64 of the Local Government Act 1993 enables a local government council to levy developer charges for water supply, sewerage and stormwater. This derives from a cross-reference in that Act to Section 306 of the Water Management Act 2000. This DSP has been prepared in accordance with the Developer Charges Guidelines for Water Supply, Sewerage and Stormwater (2012), Consultation Draft, managed by NOW, pursuant to Section 306 (3) of the Water Management Act 2000.
1.2 Purpose of the DSP The purpose of the DSP is to achieve the following objectives: 1. Allow Yass Valley Council to require an equitable monetary contribution for the
provision of sewerage infrastructure to meet the loads generated by new development.
2. Facilitate the provision of sewerage services to the Yass Valley Council area which meets the required levels of service with regard to pump station capacity, collector main capacity, treatment plant capacity and treated effluent quality.
3. Identify the existing relevant works and set out a schedule and programme of proposed works to meet increasing sewerage loads generated by development.
4. Detail the contribution rates and Yass Valley Council’s payment policies. The sewerage system for which Yass Valley Council seeks to levy DC includes collector mains, pump stations and a treatment plant. Reticulation and associated pump stations, rising mains are provided by developers as part of the subdivision/development works.
1.3 Land to which the DSP Applies This DSP applies to all land in the Yass Valley Council area that is within the sewerage benefit area which is to be connected to the sewerage system as a result of development. This includes connection of land with existing residences and/or non-residential buildings if sewerage DC have not been paid previously; and may be in addition to costs for shared, special extension of system outside the general sewerage benefit area. Maps of the sewerage areas can be found in Appendix 3.
1.4 Calculation Guidelines This DSP has been prepared with consideration given to Guidelines - Developer Charges for Water Supply, Sewerage and Stormwater, (2012) Consultation Draft. These were the latest relevant guidelines from the NOW, at the time of DC calculation, and are based on recommendations of the Independent Pricing and Regulatory Tribunal (IPART)
1.5 Date From Which This DSP Comes Into Effect This DSP was adopted by Yass Valley Council on 22/05/2013 and came into effect on 23/05/2013. DC will be levied pursuant to this DSP, as a condition of development consent granted on or after the day this DSP came into effect.
Yass Valley Council Page 2 Development Servicing Plan for Sewerage
1.6 Relationship Between The DSP and other Existing Policies or Plans A number of environmental planning instruments apply to the development of land to which this DSP relates, including State Environmental Planning Policies. A full listing of the State Environmental Planning Policies applying to Yass Valley Council is attached to this DSP as Appendix No. 1. Various other Yass Valley Council Development Servicing Plans are also relevant, as listed in Appendix 2. This DSP supersedes any other requirements related to sewerage DC for the area covered by this DSP. This DSP takes precedence over any of Yass Valley Council’s codes or policies where there are any inconsistencies relating to sewerage developer charges. (The term “Developer Contributions” may formerly have been used to refer to Developer Charges.)
1.7 Assets Relevant to the DSP The purpose of the DSP is that new development should pay for assets from which they benefit. Collection systems and treatment works are provided by Yass Valley Council and paid for through developer charges. Reticulation works are provided by the developer. Asset categories are defined as follows:
1.7.1 Collection Systems For the purposes of this DSP sewage collection systems comprise trunk mains, major pumping stations and rising mains.
1.7.2 Treatment Works The capacity of a treatment works can be expressed in terms of equivalent tenements. This assumes a domestic strength sewage with pollutant concentrations similar to that from residential areas.
For developments with domestic strength sewage, the number of additional equivalent tenements is directly related to the volume of discharge.
For developments with high strength sewage, the number of additional equivalent tenements is related to the pollutant load.
1.7.2 Reticulation Reticulation generally consists of all the internal distribution pipes within the subdivision or which specifically serve that subdivision. In some instances, Yass Valley Council is the developer. The developer shall be responsible for the full cost of the design and construction of sewerage reticulation works within subdivisions including sewer pump stations and rising mains. Plans of sewerage infrastructure are in Appendix 3.
2. Methodology
2.1 Calculation Method for Developer Charges
2.1.1 General Methodology In its most simplistic description, the calculation determines the equivalent cost of one brand new set of assets to serve development as if those assets could be constructed now. Practically, however, sewerage infrastructure consists of an on-going
Yass Valley Council Page 3 Development Servicing Plan for Sewerage
progression of old and new assets with complex interconnection. Sewerage assets may be constructed many years ahead of full capacity to reflect cost effective and practical staging of works. Only collection systems and treatment works have been taken into account in the DC calculation. The construction of any reticulation pipework required will be the responsibility of the developer. The methodology used was developed with consideration given to the latest guidelines, managed by NOW, Developer Charges Guidelines for Water Supply, Sewerage and Stormwater (2012) Consultation Draft. The NPV of Annual Charges Method was used and this is based on the following general equation, as recommended by the Independent Pricing and Regulatory Tribunal (IPART): Developer charge = Capital charge – Reduction amount. The capital charge is the Present Value (MEERA basis) of all expenditure on assets used to service the development. The reduction amount is the amount by which the capital charge is reduced to arrive at the developer charge. This amount reflects the capital contribution that will be paid by the occupier of a development as part of future annual bills. The calculated DC is based on full cost recovery.
2.1.2 Detailed Methodology The methodology and calculation is included in Appendix 4.
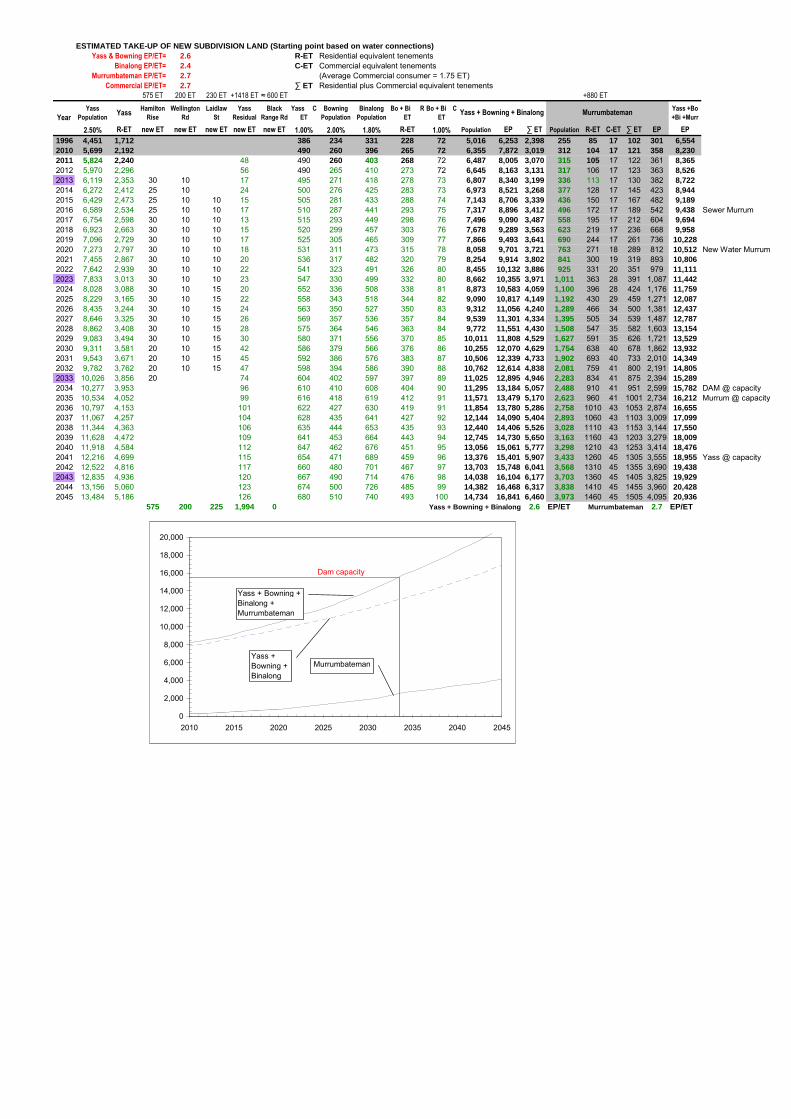
2.2 Tenement and Demand Estimates Most types of development will increase the demand on the sewerage system. Sewerage assets may directly or indirectly benefit a development by allowing increased loading to be serviced. For residential subdivisions, the increased demand is directly related to the number of additional tenements created. For medium density development each dwelling unit is considered to increase demand by two thirds (2/3) of a tenement. Therefore charges may be multiplied by 0.67 in the case of town houses which are less than 3 bedrooms, cluster housing, villa units, medium density, dual occupancy and 1 bedroom flats.
The increased demands generated by other types of development (including non-residential) need to be assessed in terms of additional equivalent tenements. The number of additional equivalent tenements is calculated in accordance with the Public Works Department's Manual of Practice: Sewer Design (1984), administered by NOW and/or historical data for similar developments respectively. Planned development of the sewerage system is based on these long-term growth projections. DC pay for the provision of system capacity to suit new development. New development may be served by a combination of existing and/or new works.
2.3 Works Covered by This DSP The existing and proposed works covered by this DSP are itemised in Section 3. All Yass Valley Council’s collection systems and treatment works, subject to DC Guidelines, are shown in these tables.
Yass Valley Council Page 4 Development Servicing Plan for Sewerage
2.4 Cost Estimates “Current replacement” cost estimates of the existing and proposed works are based on unit rates for construction published in the NSW Reference Rates for Valuation of Existing Water Supply, Sewerage and Stormwater Assets by NSW Department of Land and Water Conservation, managed by NOW. These cost estimates are shown in Section 3.
3. Works Included And Cost Estimates
Both existing and proposed works which are relevant for inclusion in this DSP are itemised in Appendix 4. Cost estimates and year of construction information are included.
4. Levels of Service and Design Parameters for Sewerage
4.1 Levels of Service System design and operation are based on providing the following key Sewerage Levels of Service to Yass Valley Council: EQUIVALENT TENEMENT • An ET is an ADWF of 200L/EP/d multiplied by the utility’s occupancy ratio
(persons per house) FAILURES
• No more than 50 sewer blockages per year • No more than 3 mechanical breakdowns per year • No dry weather overflows to the environment • No more than 20 sewer overflows to the environment per 100 km mains per year
RESPONSE TIME
• Respond on site during working hours to major spills in Yass within 30 min and
Murrumbateman 60 min; 90 min outside working hours and to moderate spills • All sewer chokes removed and service restored within 8 hours • Respond to 95% of customer complaints: oral – 1 work day, written – 5 work days
Licence Limits (BOD, SS, Total N, NH3N, Oil & Grease, Total P and Faecal coliform).
Yass Valley Council Page 5 Development Servicing Plan for Sewerage
ODOUR COMPLAINTS
• No more than 1 sewage odour complaint per 1,000 properties per year These levels of service are targets that Yass Valley Council aims to achieve. They are not intended to form a formal customer contract.
4.2 Design Parameters Investigation and design of sewerage system components is based on the Manual of Practice: Sewer Design (1984) and the Manual of Practice: Sewerage Pumping Station Design (1986). These manuals were prepared by NSW Public Works and are administered by NOW. Technical reports relating to the system components in the DSP are included in Section 6, References.
5. Developer Charges
5.1 Reticulation Yass Valley Council does not charge a monetary charge for the construction of reticulation pipework. Developers are responsible for the provision of these works which would generally be handed over to Yass Valley Council upon completion of the development.
5.2 Collection Systems and Treatment Works The calculated DC, is tabulated below. This is based on full cost recovery. Yass Valley Council - Sewerage Developer Charges
Location Developer Charge / ET ($12/13)
Yass Existing, and Other* < 500 ET
$5,651
Hamilton Rise $8,411 Murrumbateman $14,367
*“Other < 500 ET” cover the following service areas: - Black Range Road Industrial Precinct,
- Laidlaw St, and - Wellington Road.
Details of the derivation of the calculated DC is included in Appendix 4.
5.3 Payment of Developer Charges
5.3.1 Timing of Payments Subject to clauses 5.3.2 and 5.3.3 the timing for payments of DC is as follows:
For complying development Following the issuing of a complying development
certificate and prior to the commencement of work
Yass Valley Council Page 6 Development Servicing Plan for Sewerage
(whether or not the certificate is issued by Council or an accredited certifier).
For other development Prior to the release of the Construction Certificate.
For subdivision Prior to the release of the Linen Plan.
5.3.2 Method of Payment DC must be made in the form of monetary payments to Yass Valley Council. Development consents requiring the payment of a DC will contain a condition specifying the amount payable in monetary terms at the time the consent is issued. A note will be attached to the consent condition which will advise that the DC will be at the rate which applies at the time of payment. That is, the rate may increase, through indexation or replacement of this DSP with a new one, from the time the condition appears on the notice of development consent until the time the DC is actually paid to Council. The deferral of payment of contributions to the point of sale of each lot is permissible subject to application in writing to Council, and approval by the General Manager. Deferred payment of contributions will be subject to the following requirements: • The maximum time frame granted for deferment is twenty-four (24) months;
• The applicant is to provide Council with an original copy of an unconditional
Bank Guarantee in favour of Council to the total value of contributions payable, plus interest calculated for twenty-four months from the date of deferment;
• Interest will be charged in accordance with Councils Fees and Charges at the
rate applicable for outstanding rates at the time the application for deferred payment is approved;
• Should the contributions not be paid by the completion of the approved
period, Council may exercise its right under the agreement to call in the Bank Guarantee without notice; and
• Council will not permit the payment of contributions in instalments.
5.3.3 Works-in-Kind Contributions Upon written request, Council will consider an offer by the applicant to make a contribution by way of Works in Kind provided that:
• The proposed work satisfies the demands for the kind of public amenities and
facilities for which the contribution is sought;
• The proposed work will not prejudice the timing or the manner of the provision of the amenity or facility for which the contribution was required;
• The value of the work is at least equal to the value of the contribution assessed in accordance with this plan and that this value is adequately documented;
Yass Valley Council Page 7 Development Servicing Plan for Sewerage
• Agreement has been reached as to the standard of work to be undertaken; and
• Where the difference of the value of the Works in Kind is less than the contribution assessed in accordance with this plan, the balance shall be made by way of monetary contribution.
As part of the Council’s decision making process, a request will only be considered provided that the applicant was agreeable to all of the following stipulations:
• An agreement between the applicant and Council on the cost of the works (and
value of the work in kind) which is to be determined by reference to satisfactory plans, breakdown of costs, review of audited statements and accounts or similar submitted by the applicant. There will be no indexing of the value of the Works in Kind or credits so granted.
• The number of credits for a particular type of contribution will be determined by
dividing the agreed value of the proposed work by the rate applying to that contribution at the time of the agreement. The credits so agreed will be progressively reduced as the development proceeds. The agreed works schedule may specify those works that may be considered as Works in Kind.
• An agreed 12 month Defects Liability Period for the cost of the agreed work. • An agreed standard of workmanship. • An agreed timetable for the inspection of the works. • An agreed program for the completion of the works. • Submission of an itemised statement of costs (including all receipts) of the
completed works. Where the final cost of the works is less than the initial agreed cost of works, the balance is to be paid to Council as a monetary contribution. The costs of works are to also include a breakdown of all labour costs.
Please note that Council will not acknowledge any costs incurred associated with the agreement of Works in Kind as part of above itemised statement.
The decision to accept settlement of a contribution by way of Works in Kind is at the sole discretion of Council and will require a Council resolution prior to implementation. It is Council’s preference that, for broad-acre release areas, Council accepts Works in Kind and that these are to be fully constructed prior to the release of the Linen Plan or at such time as identified in a “written agreement” between Council and the developer. Should Works in Kind, that have been agreed to by Council, be later withdrawn by the applicant for any reason, then the applicant will be liable for the payment of contributions in accordance with the conditions of development consent or complying development certificate plus any indexations that may have occurred since the approval date.
5.4 Staged Subdivision/Development In the event of a staged subdivision or development, Yass Valley Council will accept the staged payment of developer charges as specified above, that is, prior to the release of the Linen Plan for each stage of subdivision and prior to the release of any building approval for a particular stage of a development.
Yass Valley Council Page 8 Development Servicing Plan for Sewerage
Deferred payment of DC, other than in accordance with Yass Valley Council’s requirements for Staged Subdivision and Development, is not permitted by Yass Valley Council.
5.5 Reviewing and Revising of Developer Charges Developer charges calculations relating to this DSP will be reviewed after a period of five to six years, or when any significant changes occur in proposed works, growth projections or standards. In the period between any reviews, developer charges will be revised on 1 July each year on the basis of movements in the Consumer Price Index (CPI) for Canberra, in the preceding 12 months to December, excluding the impact of GST.
Yass Valley Council Page 9 Development Servicing Plan for Sewerage
6. References
(1) Department of Land and Water Conservation, Guidelines - Developer Charges for Water Supply, Sewerage and Stormwater (2012) Consultation Draft
(2) NSW Public Works Department, Manual of Practice: Sewer Design (1984) (3) NSW Public Works Department , Manual of Practice: Sewerage Pumping Station
Design (1986).
Yass Valley Council Page 10 Development Servicing Plan for Sewerage
APPENDIX No. 1 - State Environmental Planning Policies Applying To Yass Valley Council Sewerage
At the time of preparation of this DSP, there were no State Environmental Planning Policies applicable to the Yass Valley Council sewerage scheme. Should policies become applicable during the life of this DSP, these should be listed in this Appendix.
Yass Valley Council Page 11 Development Servicing Plan for Sewerage
APPENDIX No. 2 - Yass Valley Council – Other DSP’s Relevant
Yass Section 64 Water Supply Plan Yass Section 94 Plan
Yass Valley Council Page 12 Development Servicing Plan for Sewerage
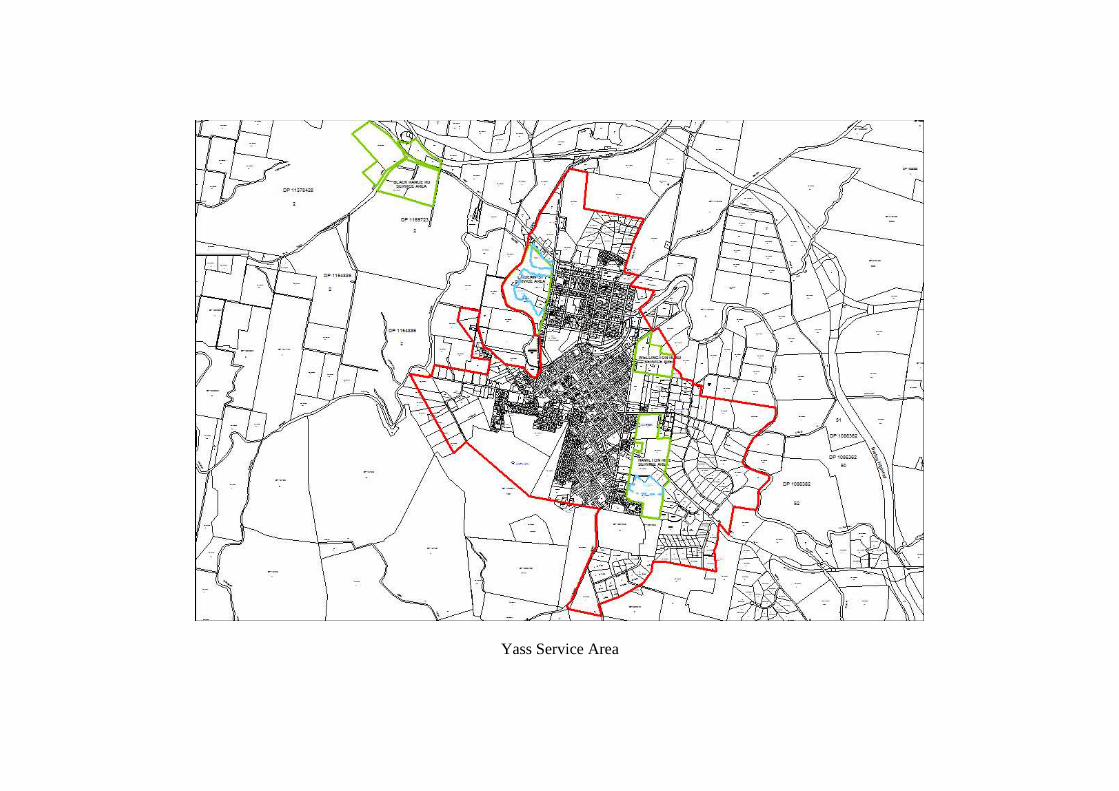
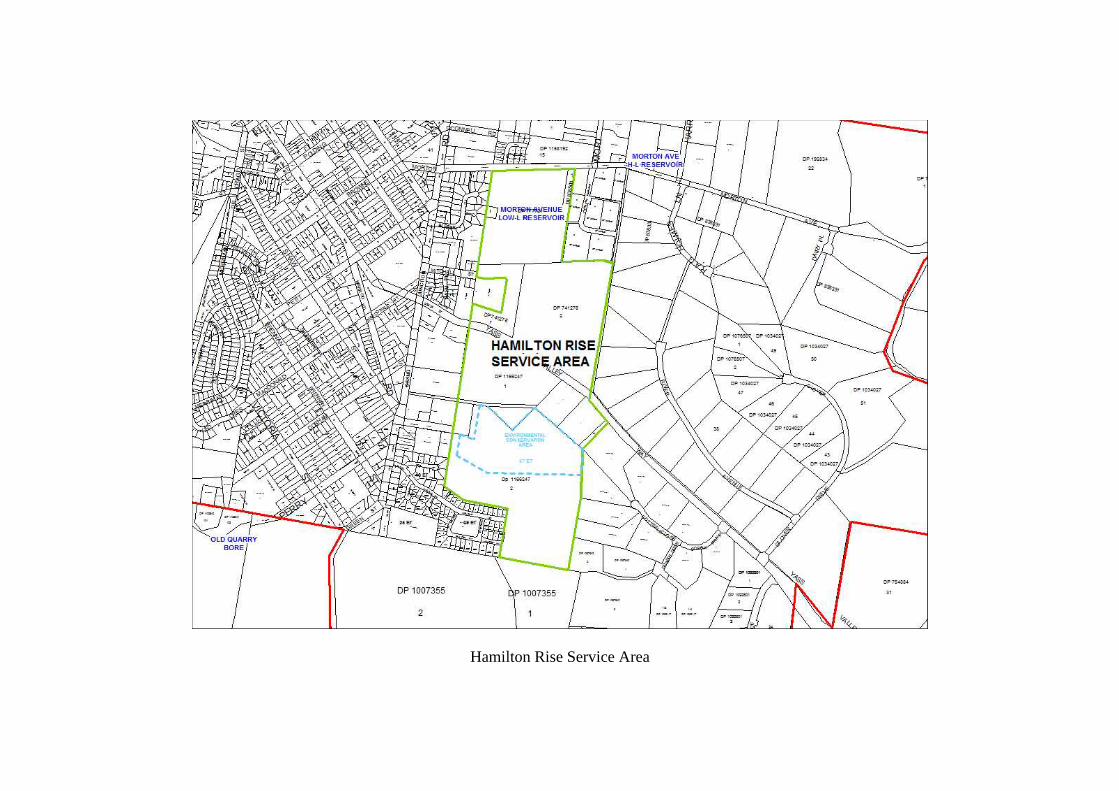
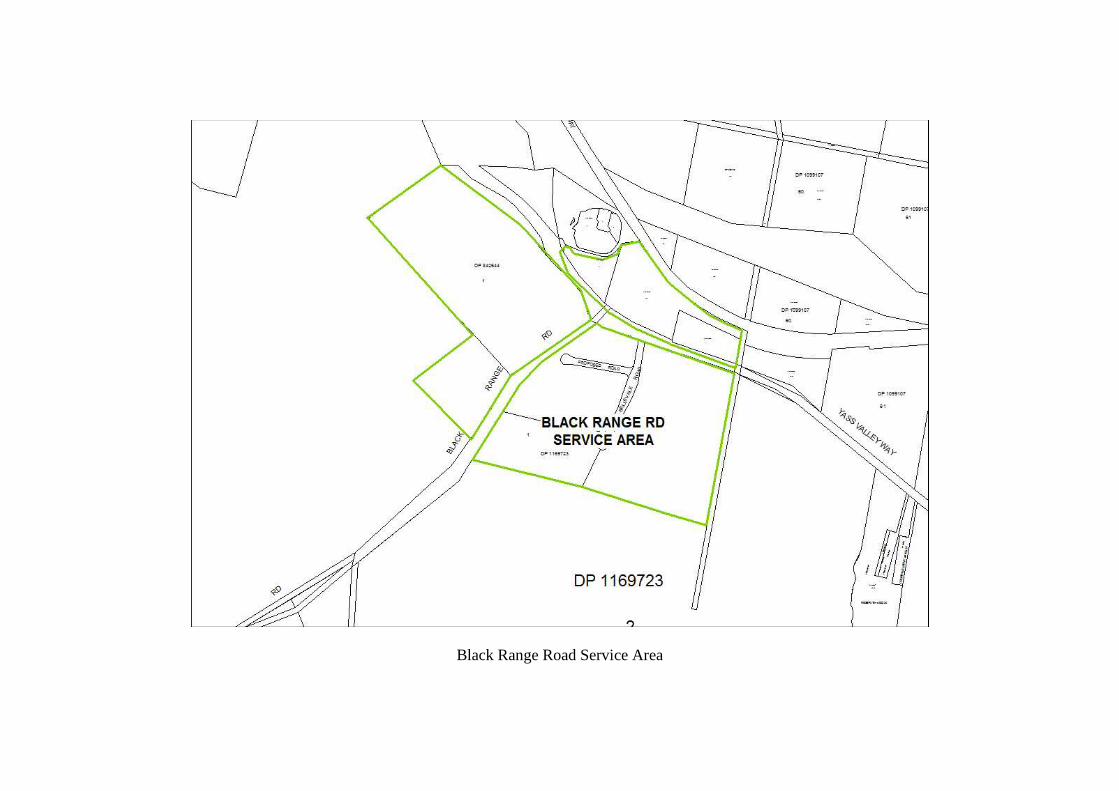
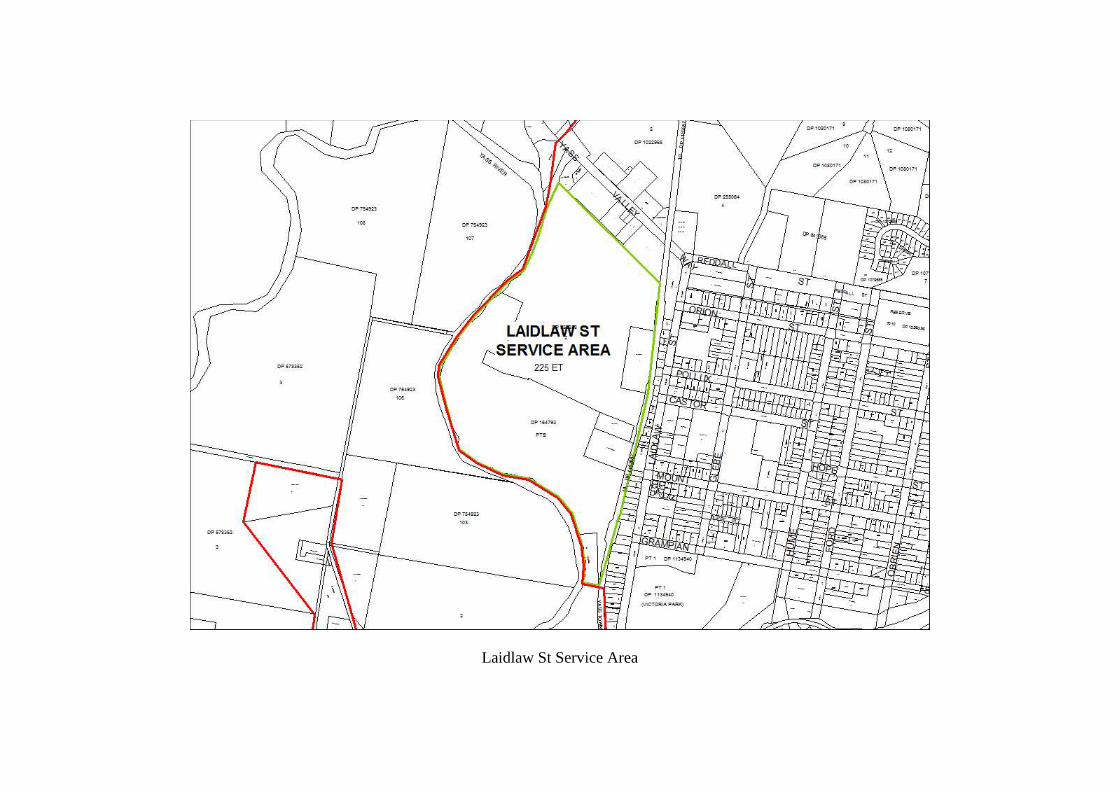
APPENDIX No. 3 - Plans Of Service Areas
Yass Service Area
Murrumbateman Service Area
Hamilton Rise Service Area
Black Range Road Service Area
Laidlaw St Service Area
Wellington Road Service Area
Yass Valley Council Page 13 Development Servicing Plan for Sewerage
APPENDIX No. 4 – Calculations
Developer Charges for Water Supply and Sewerage + Y=Yass General YL=Yass - Laidlaw StYH=Yass - Hamilton Rise Bi=Binalong
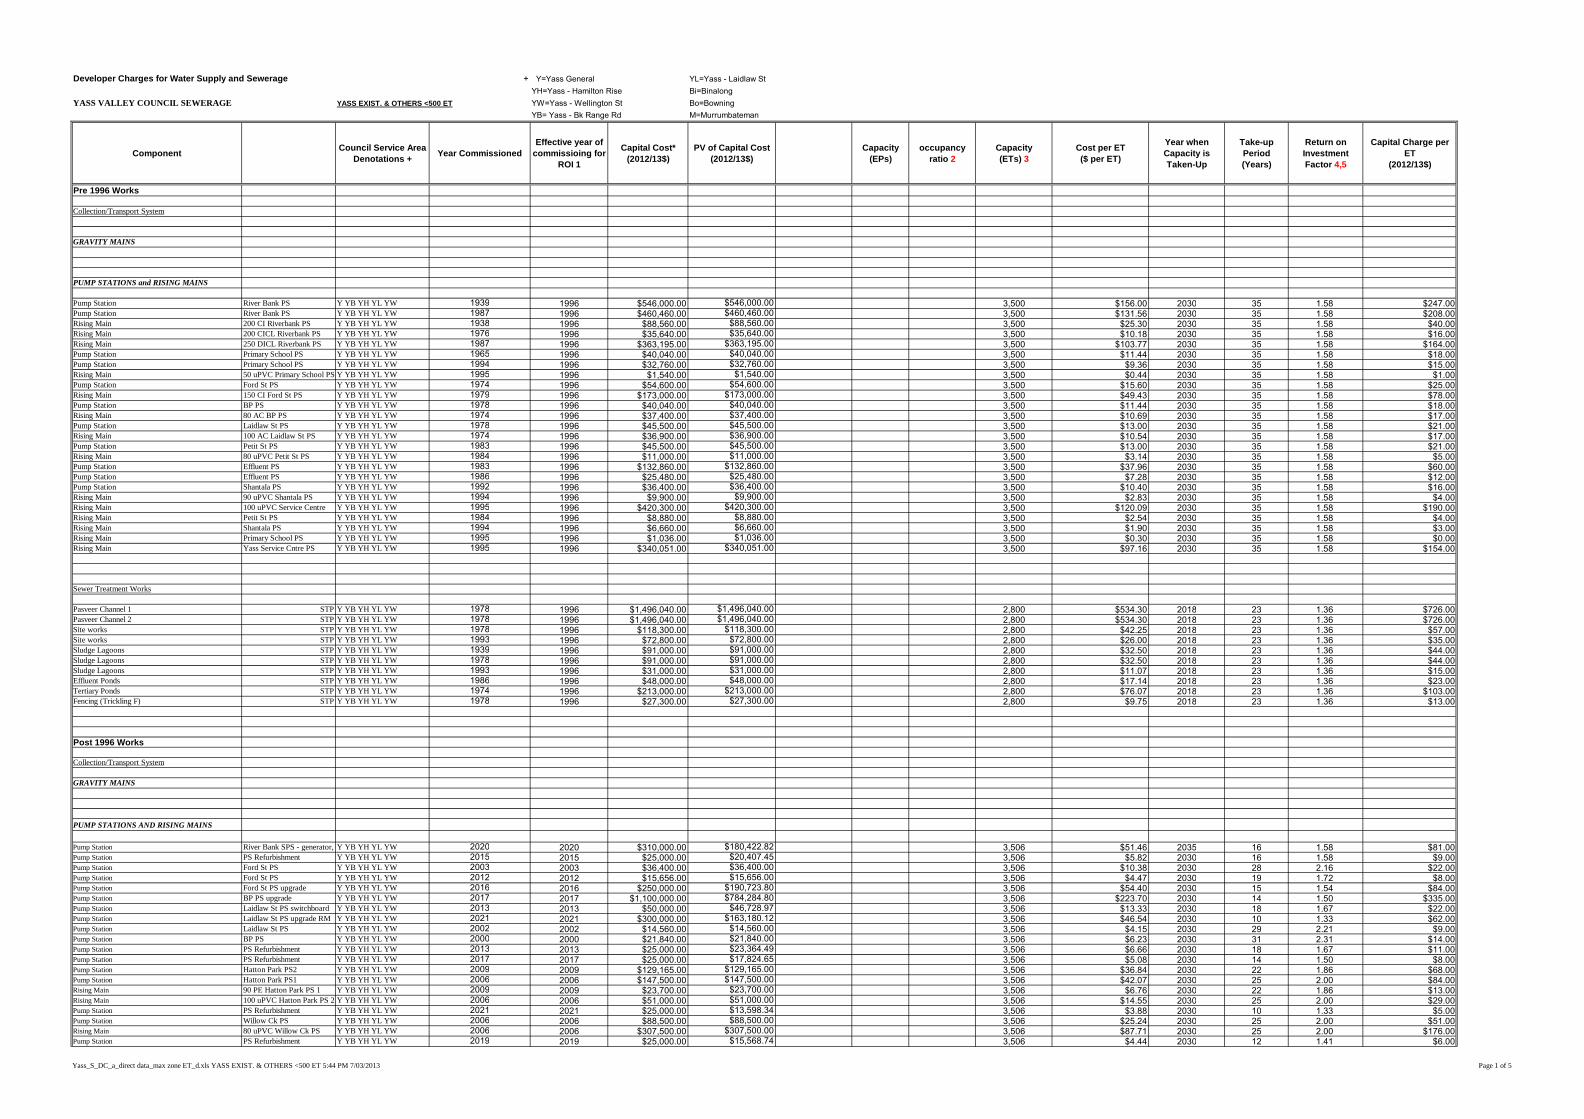
YASS VALLEY COUNCIL SEWERAGE YASS EXIST. & OTHERS <500 ET YW=Yass - Wellington St Bo=BowningYB= Yass - Bk Range Rd M=Murrumbateman
ComponentCouncil Service Area
Denotations +Year Commissioned
Effective year of commissioing for
ROI 1
Capital Cost*(2012/13$)
PV of Capital Cost (2012/13$)
Capacity (EPs)
occupancy ratio 2
Capacity(ETs) 3
Cost per ET($ per ET)
Year when Capacity is Taken-Up
Take-up Period(Years)
Return on Investment Factor 4,5
Capital Charge per ET
(2012/13$)
Pre 1996 Works
Collection/Transport System
GRAVITY MAINS
PUMP STATIONS and RISING MAINS
Pump Station River Bank PS Y YB YH YL YW 1939 1996 $546,000.00 $546,000.00 3,500 $156.00 2030 35 1.58 $247.00Pump Station River Bank PS Y YB YH YL YW 1987 1996 $460,460.00 $460,460.00 3,500 $131.56 2030 35 1.58 $208.00Rising Main 200 CI Riverbank PS Y YB YH YL YW 1938 1996 $88,560.00 $88,560.00 3,500 $25.30 2030 35 1.58 $40.00Rising Main 200 CICL Riverbank PS Y YB YH YL YW 1976 1996 $35,640.00 $35,640.00 3,500 $10.18 2030 35 1.58 $16.00Rising Main 250 DICL Riverbank PS Y YB YH YL YW 1987 1996 $363,195.00 $363,195.00 3,500 $103.77 2030 35 1.58 $164.00Pump Station Primary School PS Y YB YH YL YW 1965 1996 $40,040.00 $40,040.00 3,500 $11.44 2030 35 1.58 $18.00Pump Station Primary School PS Y YB YH YL YW 1994 1996 $32,760.00 $32,760.00 3,500 $9.36 2030 35 1.58 $15.00Rising Main 50 uPVC Primary School PS Y YB YH YL YW 1995 1996 $1,540.00 $1,540.00 3,500 $0.44 2030 35 1.58 $1.00Pump Station Ford St PS Y YB YH YL YW 1974 1996 $54,600.00 $54,600.00 3,500 $15.60 2030 35 1.58 $25.00Rising Main 150 CI Ford St PS Y YB YH YL YW 1979 1996 $173,000.00 $173,000.00 3,500 $49.43 2030 35 1.58 $78.00Pump Station BP PS Y YB YH YL YW 1978 1996 $40,040.00 $40,040.00 3,500 $11.44 2030 35 1.58 $18.00Rising Main 80 AC BP PS Y YB YH YL YW 1974 1996 $37,400.00 $37,400.00 3,500 $10.69 2030 35 1.58 $17.00Pump Station Laidlaw St PS Y YB YH YL YW 1978 1996 $45,500.00 $45,500.00 3,500 $13.00 2030 35 1.58 $21.00Rising Main 100 AC Laidlaw St PS Y YB YH YL YW 1974 1996 $36,900.00 $36,900.00 3,500 $10.54 2030 35 1.58 $17.00Pump Station Petit St PS Y YB YH YL YW 1983 1996 $45,500.00 $45,500.00 3,500 $13.00 2030 35 1.58 $21.00Rising Main 80 uPVC Petit St PS Y YB YH YL YW 1984 1996 $11,000.00 $11,000.00 3,500 $3.14 2030 35 1.58 $5.00Pump Station Effluent PS Y YB YH YL YW 1983 1996 $132,860.00 $132,860.00 3,500 $37.96 2030 35 1.58 $60.00Pump Station Effluent PS Y YB YH YL YW 1986 1996 $25,480.00 $25,480.00 3,500 $7.28 2030 35 1.58 $12.00Pump Station Shantala PS Y YB YH YL YW 1992 1996 $36,400.00 $36,400.00 3,500 $10.40 2030 35 1.58 $16.00Rising Main 90 uPVC Shantala PS Y YB YH YL YW 1994 1996 $9,900.00 $9,900.00 3,500 $2.83 2030 35 1.58 $4.00Rising Main 100 uPVC Service Centre Y YB YH YL YW 1995 1996 $420,300.00 $420,300.00 3,500 $120.09 2030 35 1.58 $190.00Rising Main Petit St PS Y YB YH YL YW 1984 1996 $8,880.00 $8,880.00 3,500 $2.54 2030 35 1.58 $4.00Rising Main Shantala PS Y YB YH YL YW 1994 1996 $6,660.00 $6,660.00 3,500 $1.90 2030 35 1.58 $3.00Rising Main Primary School PS Y YB YH YL YW 1995 1996 $1,036.00 $1,036.00 3,500 $0.30 2030 35 1.58 $0.00Rising Main Yass Service Cntre PS Y YB YH YL YW 1995 1996 $340,051.00 $340,051.00 3,500 $97.16 2030 35 1.58 $154.00
Sewer Treatment Works
Pasveer Channel 1 STP Y YB YH YL YW 1978 1996 $1,496,040.00 $1,496,040.00 2,800 $534.30 2018 23 1.36 $726.00Pasveer Channel 2 STP Y YB YH YL YW 1978 1996 $1,496,040.00 $1,496,040.00 2,800 $534.30 2018 23 1.36 $726.00Site works STP Y YB YH YL YW 1978 1996 $118,300.00 $118,300.00 2,800 $42.25 2018 23 1.36 $57.00Site works STP Y YB YH YL YW 1993 1996 $72,800.00 $72,800.00 2,800 $26.00 2018 23 1.36 $35.00Sludge Lagoons STP Y YB YH YL YW 1939 1996 $91,000.00 $91,000.00 2,800 $32.50 2018 23 1.36 $44.00Sludge Lagoons STP Y YB YH YL YW 1978 1996 $91,000.00 $91,000.00 2,800 $32.50 2018 23 1.36 $44.00Sludge Lagoons STP Y YB YH YL YW 1993 1996 $31,000.00 $31,000.00 2,800 $11.07 2018 23 1.36 $15.00Effluent Ponds STP Y YB YH YL YW 1986 1996 $48,000.00 $48,000.00 2,800 $17.14 2018 23 1.36 $23.00Tertiary Ponds STP Y YB YH YL YW 1974 1996 $213,000.00 $213,000.00 2,800 $76.07 2018 23 1.36 $103.00Fencing (Trickling F) STP Y YB YH YL YW 1978 1996 $27,300.00 $27,300.00 2,800 $9.75 2018 23 1.36 $13.00
Post 1996 Works
Collection/Transport System
GRAVITY MAINS
PUMP STATIONS AND RISING MAINS
Pump Station River Bank SPS - generator, new pumpsY YB YH YL YW 2020 2020 $310,000.00 $180,422.82 3,506 $51.46 2035 16 1.58 $81.00Pump Station PS Refurbishment Y YB YH YL YW 2015 2015 $25,000.00 $20,407.45 3,506 $5.82 2030 16 1.58 $9.00Pump Station Ford St PS Y YB YH YL YW 2003 2003 $36,400.00 $36,400.00 3,506 $10.38 2030 28 2.16 $22.00Pump Station Ford St PS Y YB YH YL YW 2012 2012 $15,656.00 $15,656.00 3,506 $4.47 2030 19 1.72 $8.00Pump Station Ford St PS upgrade Y YB YH YL YW 2016 2016 $250,000.00 $190,723.80 3,506 $54.40 2030 15 1.54 $84.00Pump Station BP PS upgrade Y YB YH YL YW 2017 2017 $1,100,000.00 $784,284.80 3,506 $223.70 2030 14 1.50 $335.00Pump Station Laidlaw St PS switchboard Y YB YH YL YW 2013 2013 $50,000.00 $46,728.97 3,506 $13.33 2030 18 1.67 $22.00Pump Station Laidlaw St PS upgrade RM Y YB YH YL YW 2021 2021 $300,000.00 $163,180.12 3,506 $46.54 2030 10 1.33 $62.00Pump Station Laidlaw St PS Y YB YH YL YW 2002 2002 $14,560.00 $14,560.00 3,506 $4.15 2030 29 2.21 $9.00Pump Station BP PS Y YB YH YL YW 2000 2000 $21,840.00 $21,840.00 3,506 $6.23 2030 31 2.31 $14.00Pump Station PS Refurbishment Y YB YH YL YW 2013 2013 $25,000.00 $23,364.49 3,506 $6.66 2030 18 1.67 $11.00Pump Station PS Refurbishment Y YB YH YL YW 2017 2017 $25,000.00 $17,824.65 3,506 $5.08 2030 14 1.50 $8.00Pump Station Hatton Park PS2 Y YB YH YL YW 2009 2009 $129,165.00 $129,165.00 3,506 $36.84 2030 22 1.86 $68.00Pump Station Hatton Park PS1 Y YB YH YL YW 2006 2006 $147,500.00 $147,500.00 3,506 $42.07 2030 25 2.00 $84.00Rising Main 90 PE Hatton Park PS 1 Y YB YH YL YW 2009 2009 $23,700.00 $23,700.00 3,506 $6.76 2030 22 1.86 $13.00Rising Main 100 uPVC Hatton Park PS 2 Y YB YH YL YW 2006 2006 $51,000.00 $51,000.00 3,506 $14.55 2030 25 2.00 $29.00Pump Station PS Refurbishment Y YB YH YL YW 2021 2021 $25,000.00 $13,598.34 3,506 $3.88 2030 10 1.33 $5.00Pump Station Willow Ck PS Y YB YH YL YW 2006 2006 $88,500.00 $88,500.00 3,506 $25.24 2030 25 2.00 $51.00Rising Main 80 uPVC Willow Ck PS Y YB YH YL YW 2006 2006 $307,500.00 $307,500.00 3,506 $87.71 2030 25 2.00 $176.00Pump Station PS Refurbishment Y YB YH YL YW 2019 2019 $25,000.00 $15,568.74 3,506 $4.44 2030 12 1.41 $6.00
Yass_S_DC_a_direct data_max zone ET_d.xls YASS EXIST. & OTHERS <500 ET 5:44 PM 7/03/2013 Page 1 of 5
ComponentCouncil Service Area
Denotations +Year Commissioned
Effective year of commissioing for
ROI 1
Capital Cost*(2012/13$)
PV of Capital Cost (2012/13$)
Capacity (EPs)
occupancy ratio 2
Capacity(ETs) 3
Cost per ET($ per ET)
Year when Capacity is Taken-Up
Take-up Period(Years)
Return on Investment Factor 4,5
Capital Charge per ET
(2012/13$)
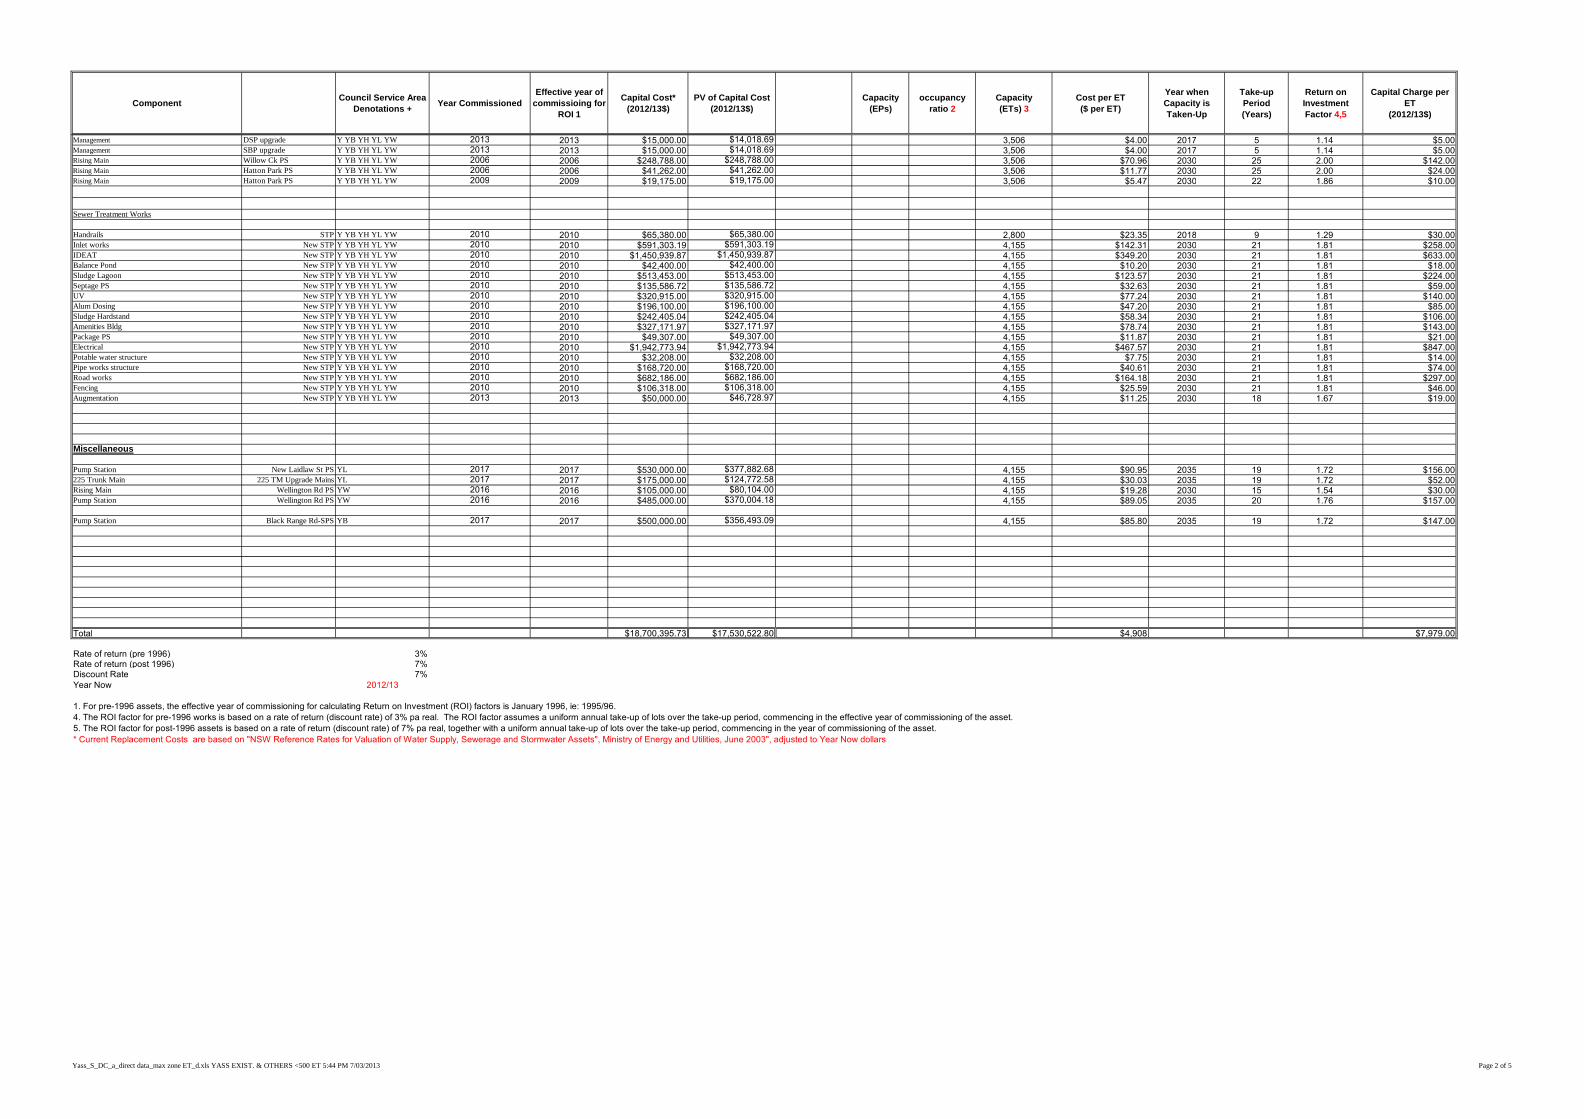
Management DSP upgrade Y YB YH YL YW 2013 2013 $15,000.00 $14,018.69 3,506 $4.00 2017 5 1.14 $5.00Management SBP upgrade Y YB YH YL YW 2013 2013 $15,000.00 $14,018.69 3,506 $4.00 2017 5 1.14 $5.00Rising Main Willow Ck PS Y YB YH YL YW 2006 2006 $248,788.00 $248,788.00 3,506 $70.96 2030 25 2.00 $142.00Rising Main Hatton Park PS Y YB YH YL YW 2006 2006 $41,262.00 $41,262.00 3,506 $11.77 2030 25 2.00 $24.00Rising Main Hatton Park PS Y YB YH YL YW 2009 2009 $19,175.00 $19,175.00 3,506 $5.47 2030 22 1.86 $10.00
Sewer Treatment Works
Handrails STP Y YB YH YL YW 2010 2010 $65,380.00 $65,380.00 2,800 $23.35 2018 9 1.29 $30.00Inlet works New STP Y YB YH YL YW 2010 2010 $591,303.19 $591,303.19 4,155 $142.31 2030 21 1.81 $258.00IDEAT New STP Y YB YH YL YW 2010 2010 $1,450,939.87 $1,450,939.87 4,155 $349.20 2030 21 1.81 $633.00Balance Pond New STP Y YB YH YL YW 2010 2010 $42,400.00 $42,400.00 4,155 $10.20 2030 21 1.81 $18.00Sludge Lagoon New STP Y YB YH YL YW 2010 2010 $513,453.00 $513,453.00 4,155 $123.57 2030 21 1.81 $224.00Septage PS New STP Y YB YH YL YW 2010 2010 $135,586.72 $135,586.72 4,155 $32.63 2030 21 1.81 $59.00UV New STP Y YB YH YL YW 2010 2010 $320,915.00 $320,915.00 4,155 $77.24 2030 21 1.81 $140.00Alum Dosing New STP Y YB YH YL YW 2010 2010 $196,100.00 $196,100.00 4,155 $47.20 2030 21 1.81 $85.00Sludge Hardstand New STP Y YB YH YL YW 2010 2010 $242,405.04 $242,405.04 4,155 $58.34 2030 21 1.81 $106.00Amenities Bldg New STP Y YB YH YL YW 2010 2010 $327,171.97 $327,171.97 4,155 $78.74 2030 21 1.81 $143.00Package PS New STP Y YB YH YL YW 2010 2010 $49,307.00 $49,307.00 4,155 $11.87 2030 21 1.81 $21.00Electrical New STP Y YB YH YL YW 2010 2010 $1,942,773.94 $1,942,773.94 4,155 $467.57 2030 21 1.81 $847.00Potable water structure New STP Y YB YH YL YW 2010 2010 $32,208.00 $32,208.00 4,155 $7.75 2030 21 1.81 $14.00Pipe works structure New STP Y YB YH YL YW 2010 2010 $168,720.00 $168,720.00 4,155 $40.61 2030 21 1.81 $74.00Road works New STP Y YB YH YL YW 2010 2010 $682,186.00 $682,186.00 4,155 $164.18 2030 21 1.81 $297.00Fencing New STP Y YB YH YL YW 2010 2010 $106,318.00 $106,318.00 4,155 $25.59 2030 21 1.81 $46.00Augmentation New STP Y YB YH YL YW 2013 2013 $50,000.00 $46,728.97 4,155 $11.25 2030 18 1.67 $19.00
Miscellaneous
Pump Station New Laidlaw St PS YL 2017 2017 $530,000.00 $377,882.68 4,155 $90.95 2035 19 1.72 $156.00225 Trunk Main 225 TM Upgrade Mains YL 2017 2017 $175,000.00 $124,772.58 4,155 $30.03 2035 19 1.72 $52.00Rising Main Wellington Rd PS YW 2016 2016 $105,000.00 $80,104.00 4,155 $19.28 2030 15 1.54 $30.00Pump Station Wellington Rd PS YW 2016 2016 $485,000.00 $370,004.18 4,155 $89.05 2035 20 1.76 $157.00
Pump Station Black Range Rd-SPS YB 2017 2017 $500,000.00 $356,493.09 4,155 $85.80 2035 19 1.72 $147.00
Total $18,700,395.73 $17,530,522.80 $4,908 $7,979.00
Rate of return (pre 1996) 3%Rate of return (post 1996) 7%Discount Rate 7%Year Now 2012/13
1. For pre-1996 assets, the effective year of commissioning for calculating Return on Investment (ROI) factors is January 1996, ie: 1995/96.4. The ROI factor for pre-1996 works is based on a rate of return (discount rate) of 3% pa real. The ROI factor assumes a uniform annual take-up of lots over the take-up period, commencing in the effective year of commissioning of the asset.5. The ROI factor for post-1996 assets is based on a rate of return (discount rate) of 7% pa real, together with a uniform annual take-up of lots over the take-up period, commencing in the year of commissioning of the asset.* Current Replacement Costs are based on "NSW Reference Rates for Valuation of Water Supply, Sewerage and Stormwater Assets", Ministry of Energy and Utilities, June 2003", adjusted to Year Now dollars
Yass_S_DC_a_direct data_max zone ET_d.xls YASS EXIST. & OTHERS <500 ET 5:44 PM 7/03/2013 Page 2 of 5
Developer Charges for Water Supply and Sewerage + Y=Yass General YL=Yass - Laidlaw StYH=Yass - Hamilton Rise Bi=Binalong
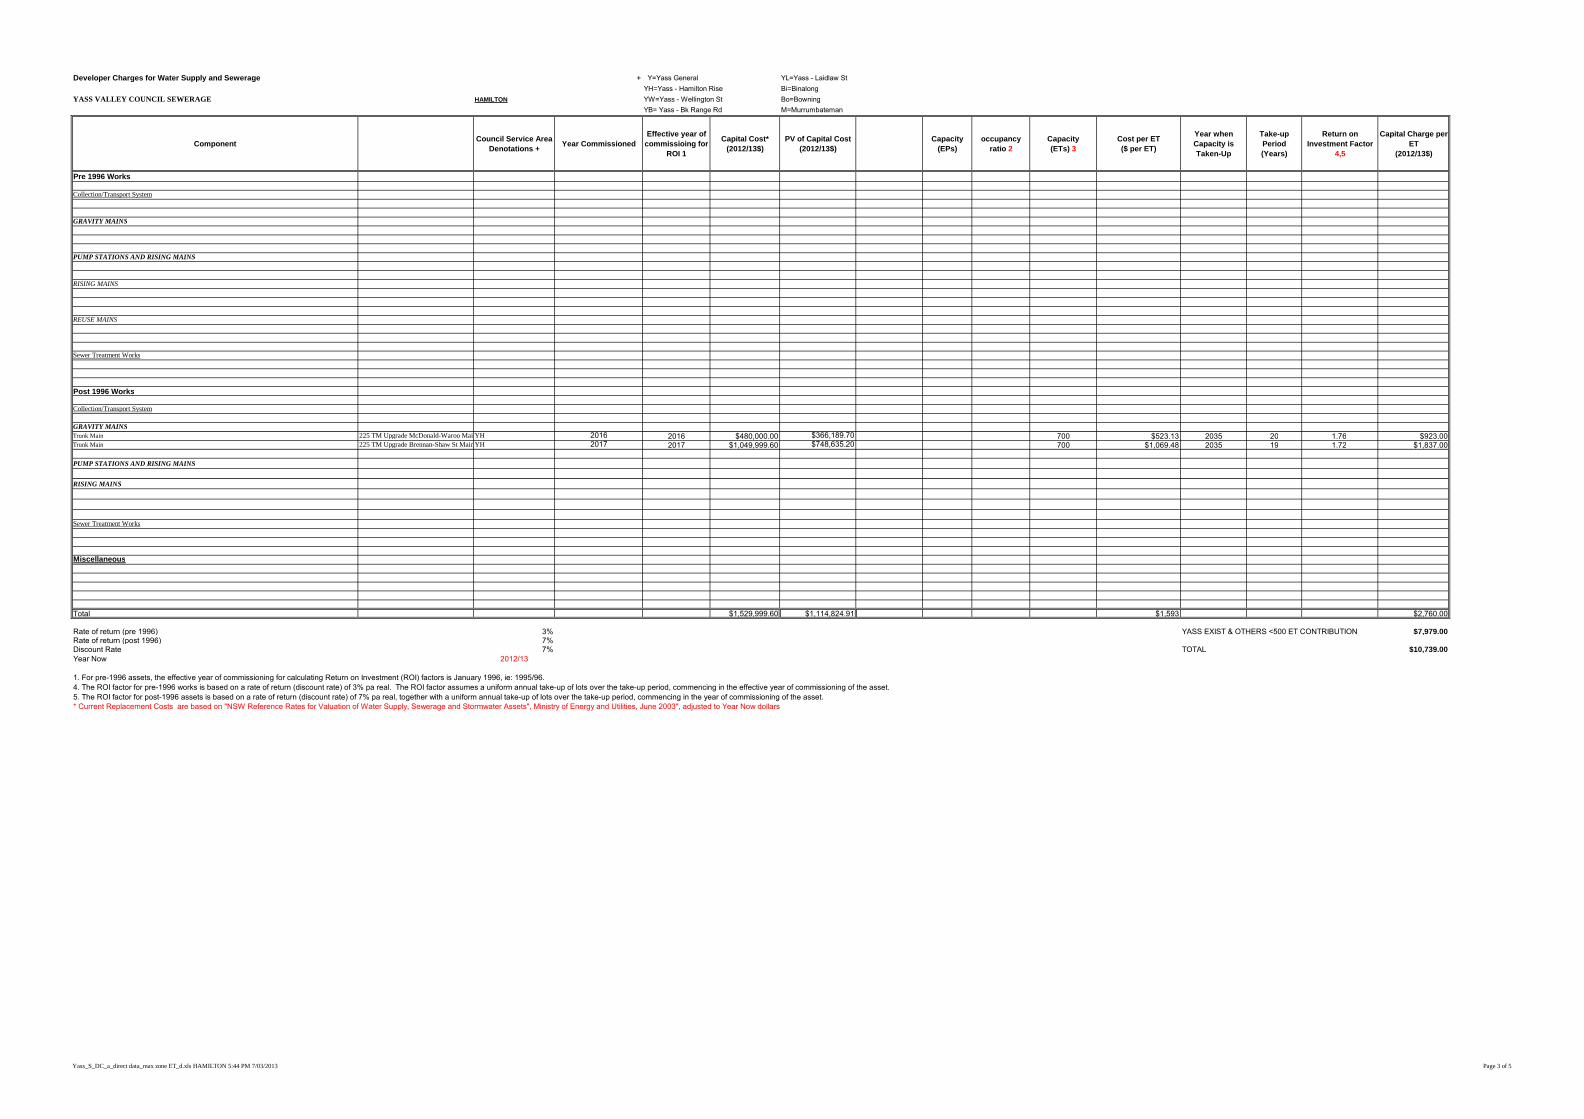
YASS VALLEY COUNCIL SEWERAGE HAMILTON YW=Yass - Wellington St Bo=BowningYB= Yass - Bk Range Rd M=Murrumbateman
Total $1,529,999.60 $1,114,824.91 $1,593 $2,760.00
Rate of return (pre 1996) 3% YASS EXIST & OTHERS <500 ET CONTRIBUTION $7,979.00Rate of return (post 1996) 7%Discount Rate 7% TOTAL $10,739.00Year Now 2012/13
1. For pre-1996 assets, the effective year of commissioning for calculating Return on Investment (ROI) factors is January 1996, ie: 1995/96.4. The ROI factor for pre-1996 works is based on a rate of return (discount rate) of 3% pa real. The ROI factor assumes a uniform annual take-up of lots over the take-up period, commencing in the effective year of commissioning of the asset.5. The ROI factor for post-1996 assets is based on a rate of return (discount rate) of 7% pa real, together with a uniform annual take-up of lots over the take-up period, commencing in the year of commissioning of the asset.* Current Replacement Costs are based on "NSW Reference Rates for Valuation of Water Supply, Sewerage and Stormwater Assets", Ministry of Energy and Utilities, June 2003", adjusted to Year Now dollars
Yass_S_DC_a_direct data_max zone ET_d.xls HAMILTON 5:44 PM 7/03/2013 Page 3 of 5
Developer Charges for Water Supply and Sewerage + Y=Yass General YL=Yass - Laidlaw StYH=Yass - Hamilton Rise Bi=Binalong
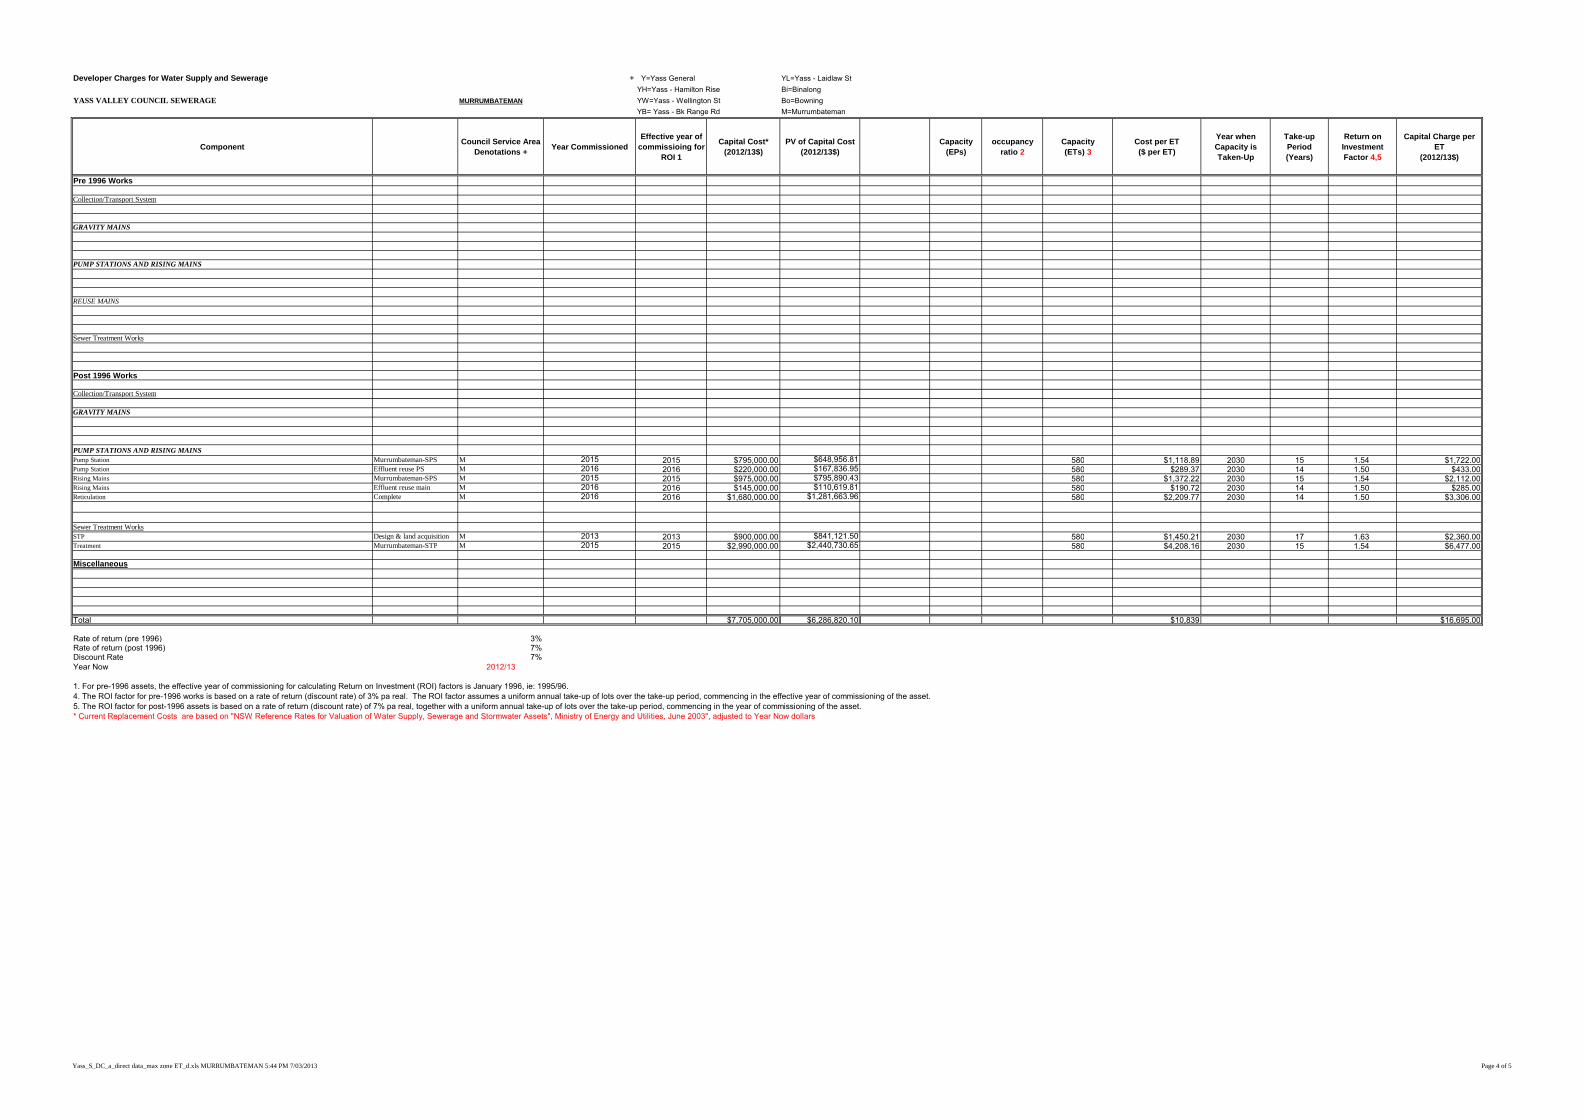
YASS VALLEY COUNCIL SEWERAGE MURRUMBATEMAN YW=Yass - Wellington St Bo=BowningYB= Yass - Bk Range Rd M=Murrumbateman
ComponentCouncil Service Area
Denotations +Year Commissioned
Effective year of commissioing for
ROI 1
Capital Cost*(2012/13$)
PV of Capital Cost (2012/13$)
Capacity (EPs)
occupancy ratio 2
Capacity(ETs) 3
Cost per ET($ per ET)
Year when Capacity is Taken-Up
Take-up Period(Years)
Return on Investment Factor 4,5
Capital Charge per ET
(2012/13$)
Pre 1996 Works
Collection/Transport System
GRAVITY MAINS
PUMP STATIONS AND RISING MAINS
REUSE MAINS
Sewer Treatment Works
Post 1996 Works
Collection/Transport System
GRAVITY MAINS
PUMP STATIONS AND RISING MAINSPump Station Murrumbateman-SPS M 2015 2015 $795,000.00 $648,956.81 580 $1,118.89 2030 15 1.54 $1,722.00Pump Station Effluent reuse PS M 2016 2016 $220,000.00 $167,836.95 580 $289.37 2030 14 1.50 $433.00Rising Mains Murrumbateman-SPS M 2015 2015 $975,000.00 $795,890.43 580 $1,372.22 2030 15 1.54 $2,112.00Rising Mains Effluent reuse main M 2016 2016 $145,000.00 $110,619.81 580 $190.72 2030 14 1.50 $285.00Reticulation Complete M 2016 2016 $1,680,000.00 $1,281,663.96 580 $2,209.77 2030 14 1.50 $3,306.00
Sewer Treatment WorksSTP Design & land acquisition M 2013 2013 $900,000.00 $841,121.50 580 $1,450.21 2030 17 1.63 $2,360.00Treatment Murrumbateman-STP M 2015 2015 $2,990,000.00 $2,440,730.65 580 $4,208.16 2030 15 1.54 $6,477.00
Miscellaneous
Total $7,705,000.00 $6,286,820.10 $10,839 $16,695.00
Rate of return (pre 1996) 3%Rate of return (post 1996) 7%Discount Rate 7%Year Now 2012/13
1. For pre-1996 assets, the effective year of commissioning for calculating Return on Investment (ROI) factors is January 1996, ie: 1995/96.4. The ROI factor for pre-1996 works is based on a rate of return (discount rate) of 3% pa real. The ROI factor assumes a uniform annual take-up of lots over the take-up period, commencing in the effective year of commissioning of the asset.5. The ROI factor for post-1996 assets is based on a rate of return (discount rate) of 7% pa real, together with a uniform annual take-up of lots over the take-up period, commencing in the year of commissioning of the asset.* Current Replacement Costs are based on "NSW Reference Rates for Valuation of Water Supply, Sewerage and Stormwater Assets", Ministry of Energy and Utilities, June 2003", adjusted to Year Now dollars
Yass_S_DC_a_direct data_max zone ET_d.xls MURRUMBATEMAN 5:44 PM 7/03/2013 Page 4 of 5
Capital Charge Summary $/ET Conversion of Assessments to ET's
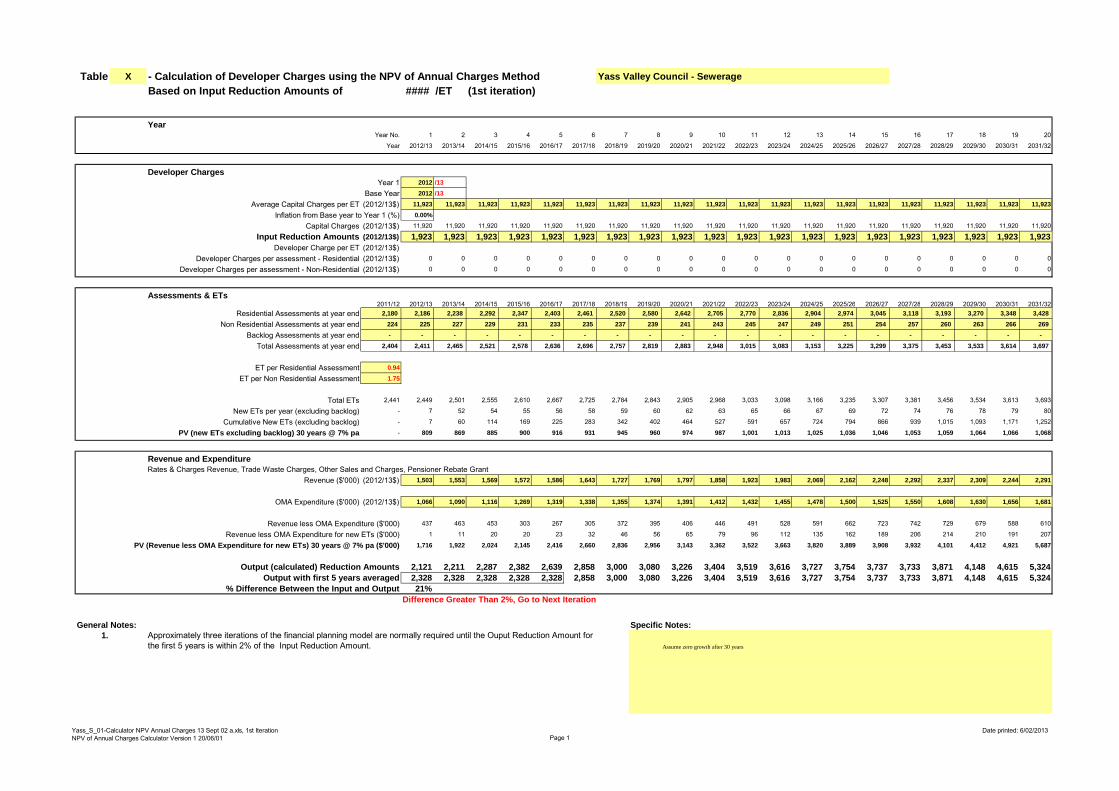
% Difference Between the Input and Output 21%Difference Greater Than 2%, Go to Next Iteration
General Notes: Specific Notes:1.
Assume zero growth after 30 years
Approximately three iterations of the financial planning model are normally required until the Ouput Reduction Amount for the first 5 years is within 2% of the Input Reduction Amount.
Yass_S_01-Calculator NPV Annual Charges 13 Sept 02 a.xls, 1st IterationNPV of Annual Charges Calculator Version 1 20/06/01 Page 1
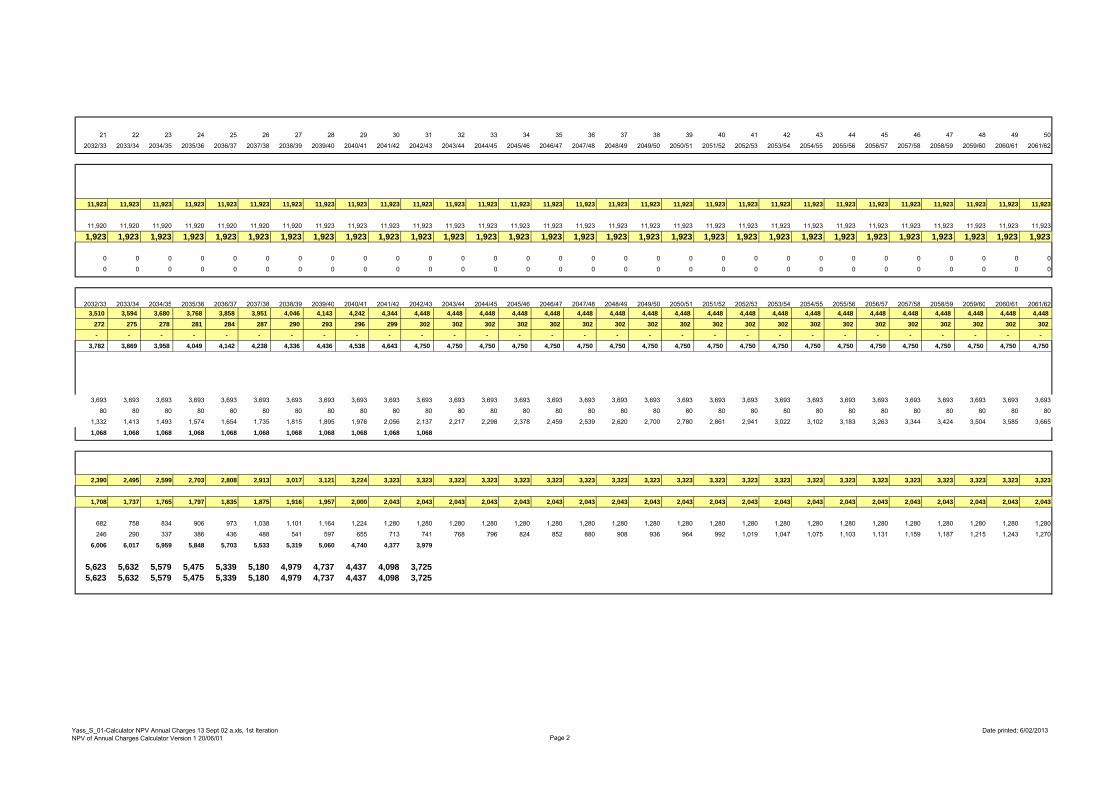
Yass_S_01-Calculator NPV Annual Charges 13 Sept 02 a.xls, 1st IterationNPV of Annual Charges Calculator Version 1 20/06/01 Page 2
Date printed: 6/02/2013
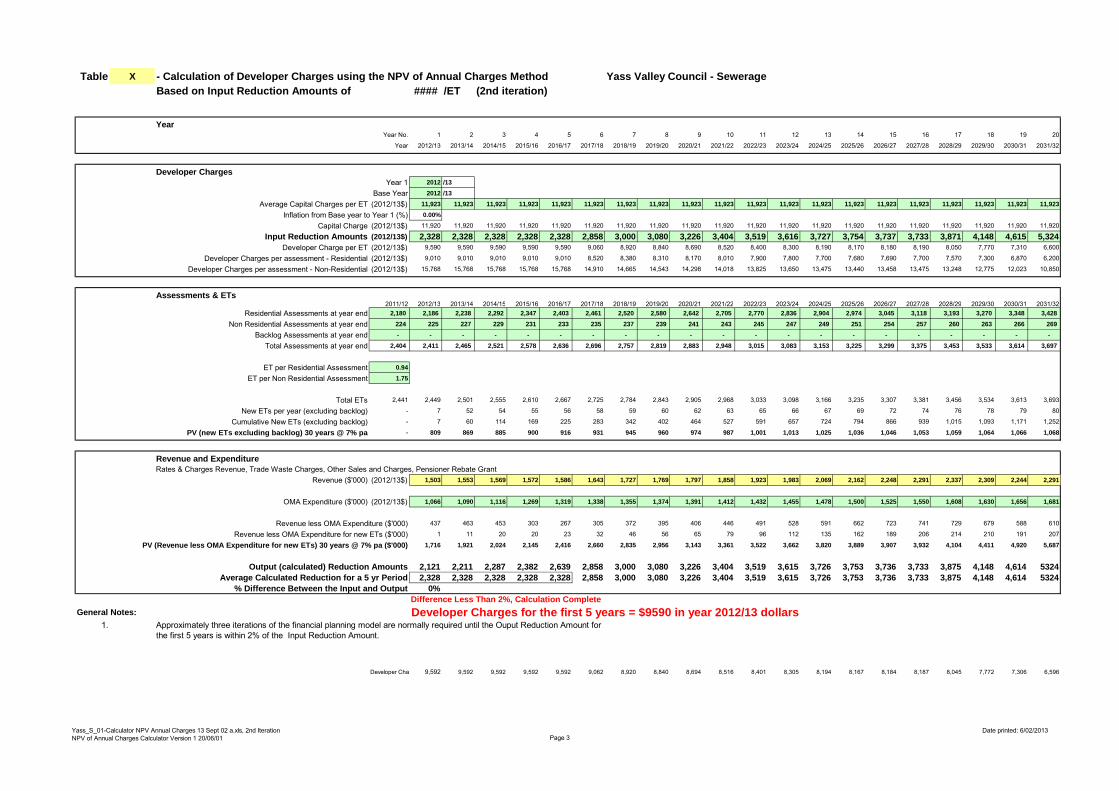
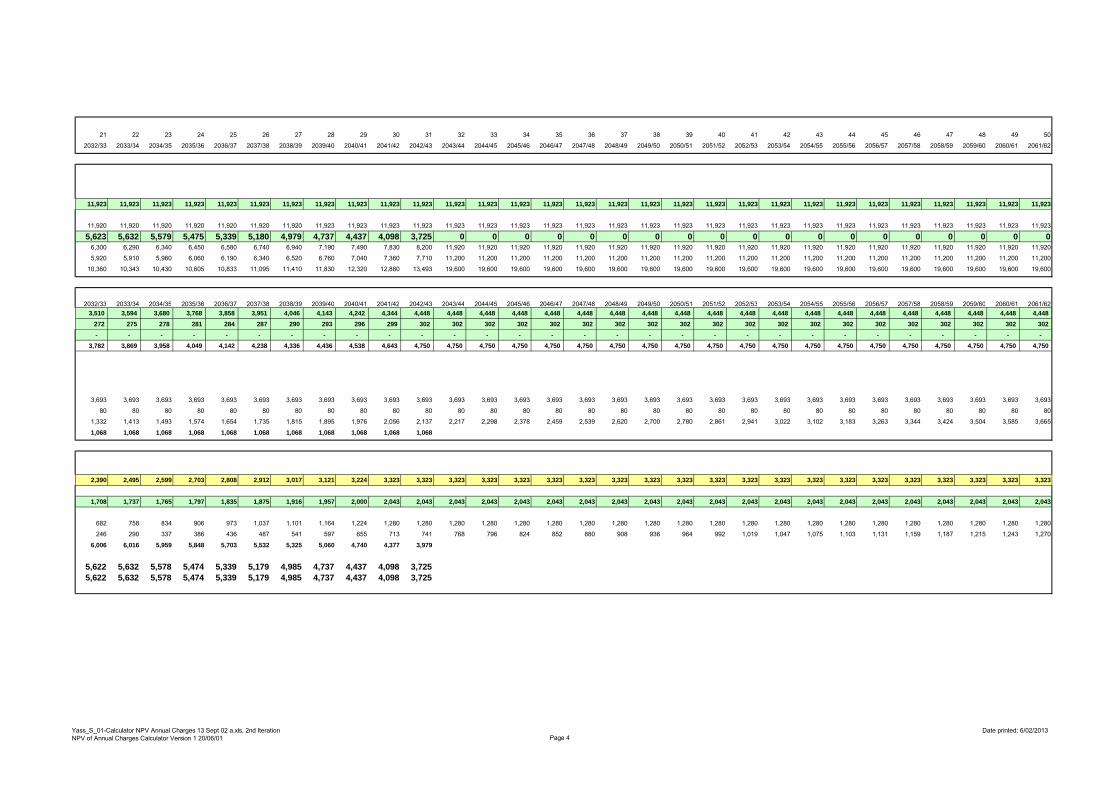
Table X - Calculation of Developer Charges using the NPV of Annual Charges Method Yass Valley Council - SewerageBased on Input Reduction Amounts of #### /ET (2nd iteration)
Approximately three iterations of the financial planning model are normally required until the Ouput Reduction Amount for the first 5 years is within 2% of the Input Reduction Amount.
Yass_S_01-Calculator NPV Annual Charges 13 Sept 02 a.xls, 2nd IterationNPV of Annual Charges Calculator Version 1 20/06/01 Page 3