49
Developmental Education Program Survey (DEPS) 2 A Statewide Survey of Developmental Education Programs and Policies FY 2011 Colby J. Stoever Isaac J. Ortega
| Date post: | 21-Jan-2018 |
| Category: |
Documents |
| Upload: | colby-stoever |
| View: | 48 times |
| Download: | 0 times |

Developmental Education Program Survey (DEPS) 2
A Statewide Survey of Developmental Education Programs and Policies
FY 2011
Colby J. Stoever Isaac J. Ortega

Developmental Education Program Survey
• Texas statute requires submission of DE plans • DE Plans were not standardized
– Narrative DE Plans – Information reported across institutions was not consistent – Information could not be effectively linked to outcome
data – Information could not be used to start effective statewide
planning • DE is an important issue to study, and policymakers are
asking for increasing amounts of information.

DEPS Development
– Hunter Boylan’s Research – National Association of Developmental Education
(NADE) – Pilot Institutions Comments – THECB expertise

DEPS Questions
DEPS is behavioral (street level) survey. Do you have it? Who does it? When do you do it? Who gets it? To some degree --how is it done?

Survey Development
• 5 main sections – General Information – Academic Advising – College Readiness Assessment – Course Information – Faculty Development
Section 6- Interchangeable (Hot Topic Survey) ESL this year
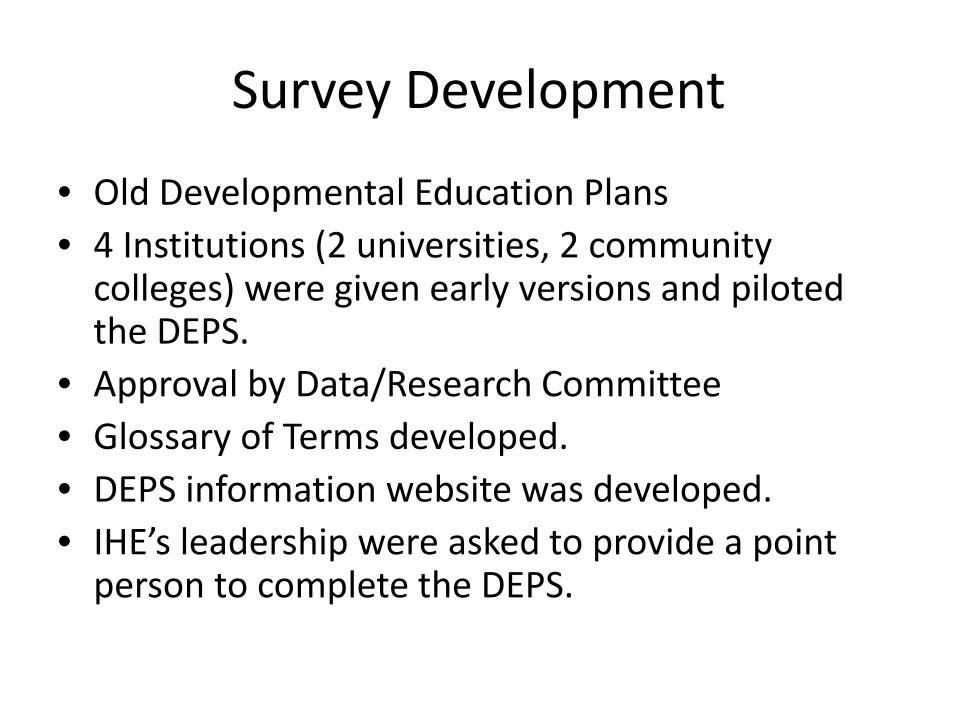
Survey Development
• Old Developmental Education Plans • 4 Institutions (2 universities, 2 community
colleges) were given early versions and piloted the DEPS.
• Approval by Data/Research Committee • Glossary of Terms developed. • DEPS information website was developed. • IHE’s leadership were asked to provide a point
person to complete the DEPS.

DEPS Training
• DEPS training sessions were conducted with all institutions two weeks prior to the start of the survey (Live Meeting).
• Question and Answer sessions were conducted at the time of training. – FAQ’s section was added to DEPS website based on
training session and all question asked to staff • All institutions were provided with a DEPS e-mail
address and staff contacts to answer questions during the survey process.

Survey Methodology
• 97 Public Institutions – 67 CTC’s and/or Districts – 30 Universities (institutions with only DE programs)
• Institutions were given 6 weeks to complete the survey.
• After all institutions completed the survey, each institution was sent an error report and asked to fix all errors and resubmit survey.
• Institutions were then asked to certify their survey responses.

Reporting DEPS
• Statewide, 2-year, and university results are posted online.
• Individual institution reports were posted online.
• http://www.txhighereddata.org/interactive/DEPS.cfm

ORGANIZATION OF D.E. PROGRAMS

39%
45%
61%
55%
34%
40%
66%
60%
0% 20% 40% 60% 80% 100%
2010 (N=67)
2011 (N=67)
2010 (N=29)
2011 (N=30)
University DecentralizedUniv CentralizedC.C. DecentralizedC.C. Centralized
Institutions with Centralized Developmental Education Programs

69%
51%
31%
49%
79%
81%
21%
19%
0% 20% 40% 60% 80% 100%
2010 (N=42)
2011 (N=43)
2010 (N=19)
2011 (N=21)
Univ NoUniv YesC.C. NoC.C. Yes
Percentage of Decentralized Institutions with DE Coordinators

Example Mission Statements • “Our mission is to help students develop the attitude, skills, and
knowledge necessary to advance in their academic pursuits. We will work to help students understand the benefits of cooperative learning and how it can be balanced with independent thinking to foster lifelong learning.”
• “Mission Statement - The College Preparatory Studies recognizes the need of under prepared students needing to bridge the gap between entry-level skills and college skills work in math, reading, and writing. It is the goal of the department to provide an academic base for all students enrolled in developmental courses by providing accurate placement with advising, as well as delivering effective instruction that incorporates use of technology, and utilizing support services to assist students in developing the academic skills necessary for college-level work.”
• “The purpose of the College Preparatory Studies department is to prepare students for college level course work by strengthening reading, writing, and mathematical skills.”

ACADEMIC ADVISING

81%
85%
19%
15%
97%
100%
3%
0%
0% 20% 40% 60% 80% 100%
2010 (N=67)
2011 (N=62)
2010 (N=29)
2011 (N=28)
Univ NoUniv YesCC NoCC Yes
Institutions Requiring Academic Advising for DE Students

49%
56%
51%
44%
64%
75%
36%
25%
0% 20% 40% 60% 80% 100%
2010 (N=55)
2011 (N=62)
2010 (N=28)
2011 (N=28)
Univ Not Specialized
Univ SpecializedAdvisingCC Not Specialized
CC Specialized Advising
Specialized Academic Advising for DE Students

Specialized D.E. Advising Examples • Group Advising- all FTIC students are required to attend a group advising session prior to registering
for their first semester (this encompasses developmental students). Drop Advising- all developmental students wanting to withdraw from a course must with an advisor
prior to withdrawing from any course. In addition, instructor signatures are needed prior to dropping the course.
Returning Group Advising- All students enrolled in SDEV0370 (Foundations for College Learning) and SDEV0170 (College Success) will be presented with a returning group advising session by an advisor in preparation for the upcoming semester (this encompasses developmental students).
• Students who are not college ready based on their initial assessments will be individually advised by well-trained and knowledgeable developmental advisors before they enroll. Students will receive an individualized Academic Success Plan, with their initial scores, developmental course requirements, and retest requirements, and measures of college readiness clearly designated. Students will be assigned a developmental advisor to assist them with future enrollment and questions. Only students who are college ready in all TSI skill areas (reading, writing, math) can enroll themselves in classes without the assistance of an advisor.
• Students are required to complete TSI paperwork (advising contract) and meet with the TSI advisor each semester.

58%
82%
42%
18%
76%
97%
24%
3%
0% 20% 40% 60% 80% 100%
2010 (N=67)
2011 (N=67)
2010 (N=29)
2011 (N=30)
Univ NoUniv YesCC NoCC Yes
Institutions that Develop Individualized Education Plans for DE Students

ACADEMIC PERFORMANCE MONITORING

81%
76%
19%
24%
86%
83%
14%
17%
0% 20% 40% 60% 80% 100%
2010 (N=67)
2011 (N=67)
2010 (N=25)
2011 (N=30)
Univ NoUniv YesCC NoCC Yes
Institutions that Monitor DE Students’ Academic Performance

Monitoring Academic Performance Examples
• Weekly absentee reports prepared by DE Faculty and submitted to Professional Advisor's. Students demonstrating attendance irregularities receive a phone call or visit from either the Advisor or the Instructor. Advisor's use these reports as part of "Early Alert" system. Students with poor academic performance at mid-term are notified via mail and phone and are required to meet with their Advisor.
• Faculty monitor attendance and performance. If a student is missing class then they are sent warning letters. Students who need help are advised to go to the counseling office.
• Office of Institutional Research collects cohort data. The data is used to identify retention, success, and persistence rates.
• DE advisors work with faculty to monitor student performance throughout the semester. Students who perform poorly on class work, quizzes, or exams, or who demonstrate attendance problems are contacted for additional advisement sessions, during which referrals for additional support might be made. TSI Coordinator oversees daily advising procedures, and Director monitors effective coordination between faculty, advisors, and students.

76%
75%
24%
25%
92%
87%
8%
13%
0% 20% 40% 60% 80% 100%
2010 (N=54)
2011 (N=67)
2010 (N=25)
2011 (N=30)
Univ NoUniv YesCC NoCC Yes
Institutions with Early Warning Systems

Early Warning Examples • Faculty monitor performance on an ongoing basis. They initially address
students that are not performing well and subsequently refer students to an intervention coordinator. Intervention coordinators contact and work with students and refer them to appropriate resources such as tutoring, counseling, etc. and perform follow-up and tracking.
• Weekly Absentee Reports (Students demonstrating attendance irregularities receive a phone call or visit from either the Advisor or the Instructor); Mid-term Grade Reports; Referral to Center for Academic Support for tutoring by Advisor and faculty.
• Student development staff, instructors, coaches and scholarship supervisors exchange information regarding student performance and attendance in an effort to monitor progress and retain students. Students are contacted via telephone, e-mail, and letters to encourage regular student attendance.

COLLEGE READINESS ASSESSMENTS

TSI Approved Mathematics Assessments Used by Institutions
CTC’s
CR Assessment Frequency
ACCUPLACER 51 (76.12%)
ASSET 17 (25.3%)
COMPASS 26 (38.8%)
THEA 40 (59.7%)
Universities
CR Assessment Frequency
ACCUPLACER 22 (73.3%)
ASSET 1 (3.3%)
COMPASS 8 (26.6%)
THEA 18 (60%)
*CTC (N=67), Universities (N=30)

TSI Approved Reading Assessments Used by Institutions
CTC’s
CR Assessment Frequency
ACCUPLACER 50 (74.6%)
ASSET 18 (26.8%)
COMPASS 14 (20.9%)
THEA 40 (59.7%)
Universities
CR Assessment Frequency
ACCUPLACER 21 (70%)
ASSET 2 (6.67%)
COMPASS 9 (30%)
THEA 20 (66.6%)
*CTC (N=67), Universities (N=30)

TSI Approved Writing Assessments Used by Institutions
CTC’s
CR Assessment Frequency
ACCUPLACER 51 (76.2%)
ASSET 17 (25.3%)
COMPASS 27 (40.3%)
THEA 38 (56.7%)
Universities
CR Assessment Frequency
ACCUPLACER 20 (66.6%)
ASSET 1 (3.3%)
COMPASS 6 (20%)
THEA 17 (56.6%)
*CTC (N=67), Universities (N=30)

FACULTY DEVELOPMENT

67%
60%
33%
40%
83%
67%
17%
33%
0% 20% 40% 60% 80% 100%
2010 (N=67)
2011 (N=67)
2010 (N=29)
2011 (N=30)
Univ NoUniv YesCC NoCC Yes
Institutions with Faculty Development Units

75%
87%
25%
13%
45%
50%
55%
50%
0% 20% 40% 60% 80% 100%
2010 (N=67)
2011 (N=67)
2010 (N=29)
2011 (N=30)
Univ NoUniv YesCC NoCC Yes
Institutions Having Professional Development Opportunities for DE Faculty

76%
73%
24%
27%
62%
37%
38%
63%
0% 20% 40% 60% 80% 100%
2010 (N=67)
2011 (N=67)
2010 (N=29)
2011 (N=30)
Univ NoUniv YesCC NoCC Yes
Institutions that Hold Regular Meetings of DE Faculty to Discuss Institutional Strategies

Examples of D.E. Faculty Development
• National Association of Developmental Education (NADE) – 12 - NADE focuses on the academic success of students by: – Providing professional development – Supporting student learning – Providing public leadership – Disseminating exemplary models of practice – Coordinating efforts with other organizations – Facilitating communication among developmental
education professionals – Anticipating trends

Examples of D.E. Faculty Development (Continued)
• Learning Communities- 100- We have had in-house
workshops in which we've brought in experts from other colleges and universities; we've had numerous break-out presentations on this topic at Faculty conferences; and we have sent faculty to professional workshops at Columbia University, Evergreen State University, and other places.
• North Texas Community College Consortium 5 Personnel presented to developmental faculty from the Texas Higher Education Coordinating Board as well as representatives from regional developmental programs. This was a one day workshop.

88%
88%
12%
12%
100%
91%
0%
9%
0% 20% 40% 60% 80% 100%
2010 (N=50)
2011 (N=49)
2010 (N=17)
2011 (N=11)
Univ NoUniv YesCC NoCC Yes
Number of Institutions that Include DE Part-Time Lectures/Adjunct Faculty in DE Faculty Meeting

COURSE INFORMATION

Levels of Math D.E.
CTC’s (N=67) Levels Frequency
0 0 (0.0%)
1 0 (0.0%)
2 3 (4.4%)
3 45 (67.1%)
4 14 (20.9%)
5 5 (7.4%)
Universities (N=30) Levels Frequency
0 0 (0.0%)
1 4(13.3%)
2 21 (70%)
3 5 (16.6%)
4 0 (0.0%)
5 0 (0.0%)

Levels of Reading D.E.
CTC’s (N=67) Levels Frequency
0 0 (0.0%)
1 4 (5.9%)
2 22 (32.8%)
3 35 (52.2%)
4 6 (8.9%)
5 0 (0.0%)
Universities (N=30) Levels Frequency
0 0 (0.0%)
1 22 (73.3%)
2 6 (20%)
3 2 (6.6%)
4 0 (0.0%)
5 0 (0.0%)

Levels of Writing D.E.
CTC’s (N=67) Levels Frequency
0 0 (0.0%)
1 7 (10.4%)
2 34 (50.7%)
3 21 (31.3%)
4 5 (7.4%)
5 0 (0.0%)
Universities (N=29) Levels Frequency
0 0 (0.0%)
1 22 (75.8%)
2 6 (20%)
3 1 (3.4%)
4 0 (0.0%)
5 0 (0.0%)
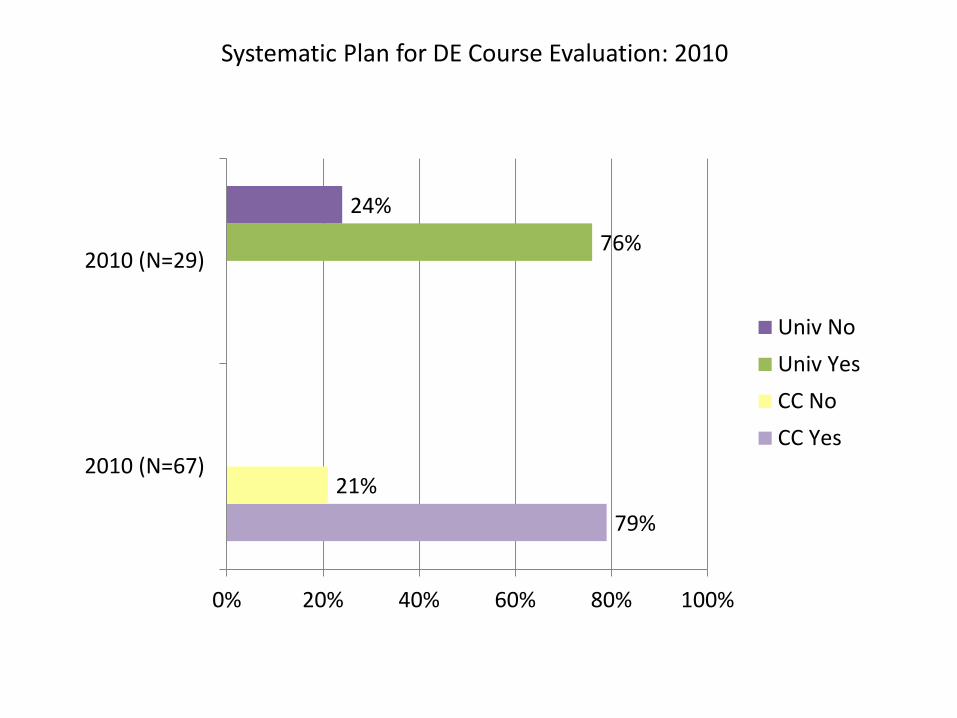
79% 21%
76% 24%
0% 20% 40% 60% 80% 100%
2010 (N=67)
2010 (N=29)
Univ NoUniv YesCC NoCC Yes
Systematic Plan for DE Course Evaluation: 2010

85.1% 77.6%
76.1%
76.7% 73.3%
66.7%
0% 20% 40% 60% 80% 100%
2011 (N=67)
2011 (N=30)Univ WritingUniv ReadingUniv MathematicsCC WritingCC ReadingCC Mathematics
Systematic Plan for DE Course Evaluation: 2011

82%
88%
18%
12%
83%
73%
17%
27%
0% 20% 40% 60% 80% 100%
2010 (N=67)
2011 (N=67)
2010 (N=29)
2011 (N=30)
Univ NoUniv YesCC NoCC Yes
Offer Study Skills/Learning Strategies Courses

70%
64%
30%
36%
83%
73%
17%
27%
0% 20% 40% 60% 80% 100%
2010 (N=67)
2011 (N=67)
2010 (N=29)
2011 (N=30)
Univ NoUniv YesCC NoCC Yes
Offer Study Skills/Learning Strategies Seminars/Workshops

45% 55%
66% 34%
0% 20% 40% 60% 80% 100%
2010 (N=67)
2010 (N=29)
Univ NoUniv YesCC NoCC Yes
Non-Course Based Remediation: 2010

31.3% 22.4% 23.9%
46.7% 33.3%
30.0%
0% 20% 40% 60% 80% 100%
2011 (N=67)
2011 (N=67)Univ WritingUniv ReadingUniv MathematicsCC WritingCC ReadingCC Mathematics
Non-Course Based Remediation: 2011

ENGLISH LANGUAGE LEARNERS (ELL)

70% 30%
73% 27%
0% 20% 40% 60% 80% 100%
2011 (N=67)
2011 (N=30)
Univ NoUniv YesCC NoCC Yes
Institutions Providing ESL Services

8% 57%
35%
14% 73%
14%
0% 20% 40% 60% 80% 100%
2011 (N=47)
2011 (N=22)Univ BothUniv Non Credit BearingUniv Credit BearingCC BothCC Noncredit BearingCC Credit Bearing
Nature of ESL Programs

Future
• DEPS is under review by the DE Advisory Committee for the next 2 years.
• Translation….

Thank You


