18
Developmental Mathematics Redesign …. David Atwood, Sarah Endel April 16, 2014 RAMSP
| Date post: | 02-Jan-2016 |
| Category: |
Documents |
| Upload: | phillip-contreras |
| View: | 17 times |
| Download: | 0 times |

Developmental MathematicsRedesign ….
David Atwood, Sarah EndelApril 16, 2014RAMSP

I always got A’s and B’s in high school—just gonna crank through this.
I just broke up with my boyfriend. I hate math.
I already know this.

Trends
• National – Less than 10% of
those that start in the lowest course will finish the developmental sequence and take a college level math course. (Bailey, Jeong & Choo, 2008)
• RCTC – Less than 35% of
those students who enroll in Pre-algebra will pass Elementary Algebra within one year.
– 75% of incoming freshmen do not place into college level mathematics

Mission
• Improve Student Performance
• Save students money on tuition and textbooks
• Reduce the number of attrition points
• Improve student engagement
• Shift enrollment from developmental courses to college level courses.

Computer Mediated
• Video lectures for each section• E-book• Examples• Homework helps• 24/7 access• Immediate feedback• Established level of mastery

Individualized System of Instruction:
• Multiple entry levels depending on placement score
• Multiple exit levels depending on program of study
• Mastery learning - eliminates knowledge gaps
• Student accountability • Increased personalized student and
instructor interaction

Self-paced:
• Students can pretest out of modules theyhave previously mastered
• Students can accelerate and completemultiple levels in one semester
• Students needing more time on a specific topic can progress at a slower pace

Course Coordination:
• Standard course content and instructor training
• Collaboration with other academicdepartments: Nursing, Chemistry
• Ongoing communication with advisors for proper course placement
• Intrusive Advising
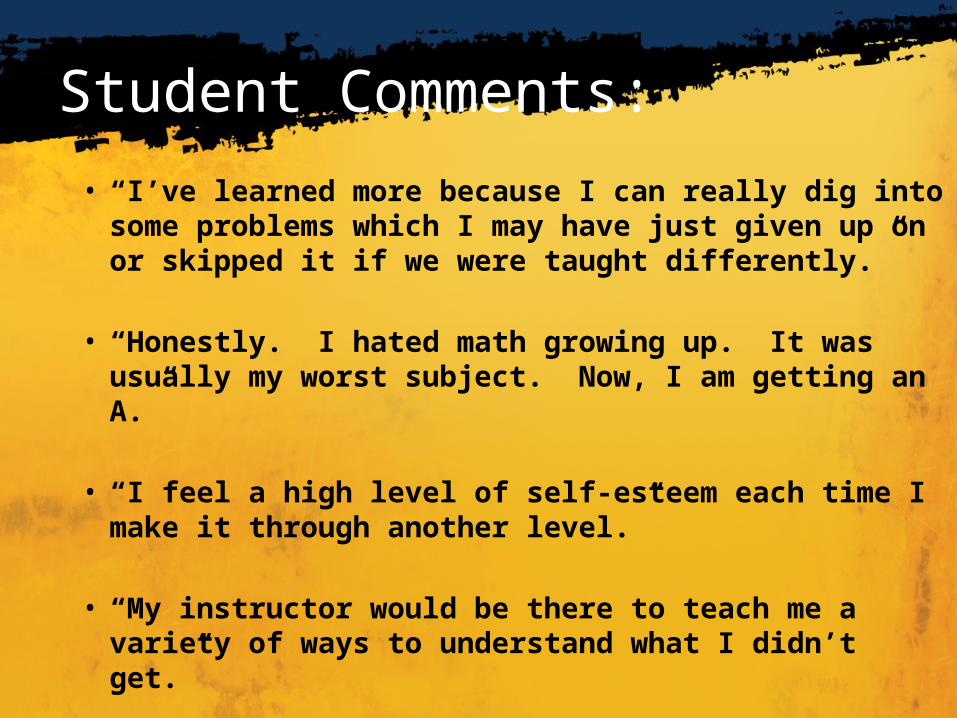
Student Comments:
• “I’ve learned more because I can really dig into some problems which I may have just given up on or skipped it if we were taught differently.”
• “Honestly. I hated math growing up. It was usually my worst subject. Now, I am getting an A.”
• “I feel a high level of self-esteem each time I make it through another level.”
• “My instructor would be there to teach me a variety of ways to understand what I didn’t get.”

Statistics…

• Internal data collection and analysis to determine course effectiveness
• Institutional data to compare success rates with traditional course success rates
• Data from Chemistry department to determine course readiness
• External study – John Asmussen
Data Collected

Results from Fall 2011
152 of 199 students completed the redesigned courses
628 of 821 students completed the traditional courses
The percentage of those who completed the redesigned course was about equal to the percentage who completed the traditional course.
Redesign 2011 Traditional 20110
0.1
0.2
0.3
0.4
0.5
0.6
0.7
0.8
0.9
1

Results from Fall 2011
135 of the 152 students who completed the redesigned courses earned a grade of A, B, or C.
487 of the 628 students who completed the traditional courses earned a grade of A, B, or C.
The percentage of those who successfully completed the redesigned courses was statistically higher than the percentage of those who successfully completed the traditional courses (p = 0.001).
Redesign 2011 Traditional 20110
0.1
0.2
0.3
0.4
0.5
0.6
0.7
0.8
0.9
1

Results from Fall 2012
235 of 310 students completed the redesigned courses
214 of 307 students completed the traditional courses (Pre-Algebra only)
The percentage of those who completed the redesigned course is statistically higher than the percentage who completed the traditional course (p = 0.044) .
Redesign 2012 Traditional 20120
0.1
0.2
0.3
0.4
0.5
0.6
0.7
0.8
0.9
1

Results from Fall 2012
198 of the 235 students who completed the redesigned courses earned a grade of A, B, or C.
154 of the 214 students who completed the traditional courses earned a grade of A, B, or C (Pre-Algebra only).
The percentage of those who successfully completed the redesigned course was statistically higher than the percentage of those who successfully completed the traditional course (p = 0.0008).
Redesign 2012 Traditional 20120
0.1
0.2
0.3
0.4
0.5
0.6
0.7
0.8
0.9
1

Results….
• 77% of Math 0080 and 69% of Traditional students completed Chem 1117
• 71% of Math 0080 and 87% of Traditional students completed Math 1111
• 78% of Math 0080 and 67% of Traditional students completed Math 1115
• Completion rates were similar for both types of developmental math series, suggesting that the students were well prepared for the courses , no matter which developmental series they had taken.

Summary
• Students who placed at the Pre-Algebra level have the most to gain from the Math 0080 series.
• Pre-Algebra placements that later completed College Algebra were able to finish the course in an average of 3.2 terms after starting the series, while the average terms-to-completion for students who started in the traditional series was 4.5 terms. (Note, however, that the percentage of College Algebra completers was less than 3% for each group)


