Developments in the Treatment of Multiple Myeloma Kenneth C. Anderson, M.D. Kraft Family Professor of Medicine Harvard Medical School Director, Jerome Lipper Multiple Myeloma Center Dana-Farber Cancer Institute
Transcript
Developments in the Treatment of Multiple Myeloma
Kenneth C. Anderson, M.D.
Kraft Family Professor of MedicineHarvard Medical School
Director, Jerome Lipper Multiple Myeloma CenterDana-Farber Cancer Institute
Conflict of Interest: Kenneth C. Anderson, M.D.
Consultancy: Celgene, Onyx, Sanofi Aventis, and Gilead
Scientific Founder: Acetylon, Oncopep
Integration of Novel Therapy Into Myeloma Management
Target MM in the BM microenvironment to overcome conventional drug resistance in vitro and in vivo
Effective in relapsed/refractory, relapsed MM and now part of induction, consolidation, and maintenance therapy
Nine FDA approvals in the last decade and median survival prolonged from 2-3 yrs to at least 5-7 yrs, with additional prolongation seen from maintenance
New approaches needed to treat and ultimately prevent relapse
1Attal et al. Haematologica 2011; 96 (s1): S23; oral presentation at IMW 20112Roussel et al. ASH 2010 (Abstract 624), oral presentation
n=572 Pre-consolidation
Post-consolidation p
CR (IF–) 14% 20% <0.0001
≥ VGPR 58% 67% <0.0001
n=31 Post-induction
Post-ASCT
Post-consolidation
sCR 13% 26% 38%
CR 10% 10% 10%
≥ VGPR 62% 68% 84%
≥PR 94% 91% 94%
5
CALGB 100104:LEN Maintenance significantly prolonged PFS & OS vs. placebo
ASCT: autologous stem cell transplant; CALGB: Cancer and Leukemia Group B; HR: hazard ratio; LEN: lenalidomide; N/A: not applicable; OS: overall survival; PBO: placebo.
McCarthy PL. N Engl J Med. 2012;366:1770-1781.
PFS OS
• There was significant prolongation of both PFS (HR 0.49, 95% CI, 0.41–0.58, p<0.001) and OS (HR 0.77, 95% CI, 0.62–0.95, p=0.013) with LM vs. placebo/no maintenance
Oral Abstract #407 - Lenalidomide Maintenance Therapy In Multiple Myeloma: A Meta-Analysis Of Randomized TrialsMonday, December 9, 2013: 11:30 AM 393-394
Lenalidomide Maintenance Therapy Meta-Analysis
Singh M, et al. ASH 2013. Abstract 407.
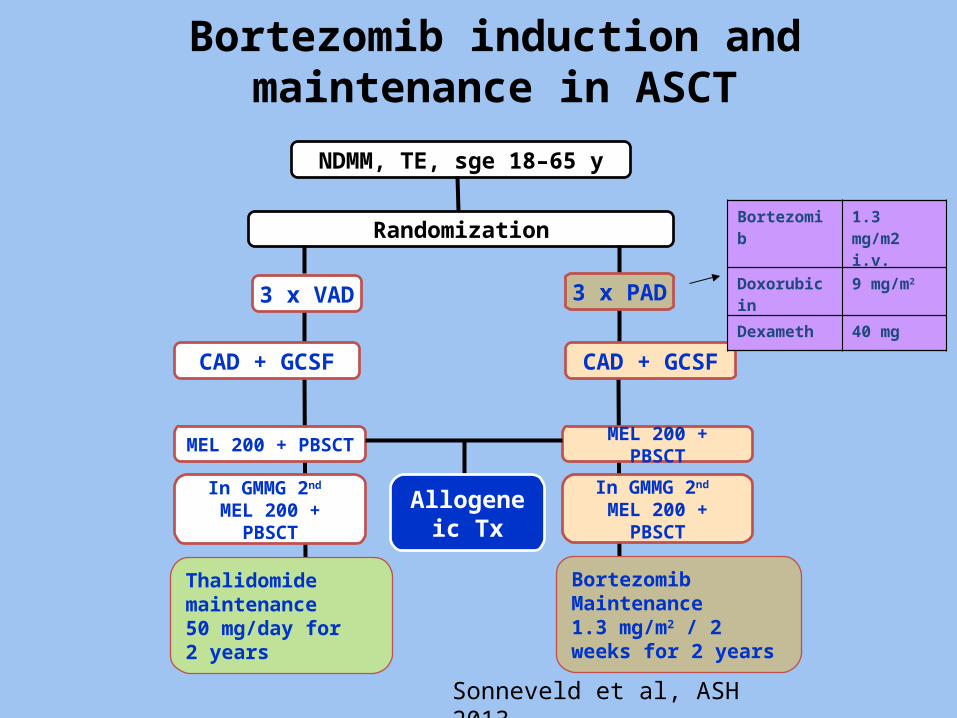
Randomization
NDMM, TE, sge 18–65 y
CAD + GCSF
3 x VAD
CAD + GCSF
3 x PAD
MEL 200 + PBSCT
In GMMG 2nd MEL 200 + PBSCT
MEL 200 + PBSCT
In GMMG 2nd MEL 200 + PBSCT
Thalidomidemaintenance 50 mg/day for 2 years
Allogeneic Tx
Bortezomib Maintenance1.3 mg/m2 / 2 weeks for 2 years
Bortezomib induction and maintenance in ASCT
Bortezomib 1.3 mg/m2i.v.
Doxorubicin 9 mg/m2
Dexameth 40 mg
Sonneveld et al, ASH 2013
Results
• Bortezomib-based treatment consistently improves PFS (median 27 m vs 36 m) and OS (median 84 m vs not reached, p=0.05) in patients with newly diagnosed MM who are transplant eligible
• Bortezomib significantly improves the long-term outcome of patients presenting with renal failure (p<0.001)
Sonneveld et al, ASH 2013
Carfilzomib With Thalidomide and Dexamethasone in ASCT
Induction (4 28-day cycles)
Carfilzomib, 20/27 mg/m2
Days 1,2,8,9,15,16
Dexamethasone, 40 mgDays 1,8,15,21
Thalidomide, 200 mgDays 1-28
Intensification* (1 cycle)
Phase IIopen-labeldose-escalationtrial (N=70)
*High-dose melphalan 200 mg/m2 plus ASCT
Sonneveld P, et al. ASH 2013. Abstract 688.
Carfilzomib, 27 mg/m2
Days 1,2,8,9,15,16
Dexamethasone, 40 mgDays 1,8,15,21
Thalidomide, 50 mgDays 1-28
Consolidation(4 28-day cycles)
Carfilzomib 27 mg/m2 dose escalation: Cohort 1 treatment as above; Cohort 2 to 36 mg/m2; Cohort 3 to 45 mg/m2; Cohort 4 to 56 mg/m2.
Carfilzomib/Thalidomide/ Dexamethasone: Response and AEs
Impact of Novel Agents in the Treatment of Elderly Pts with Newly Diagnosed MM
Substantial improvements in PFS and OS
*Median OS not reachedN/A: not available
7San Miguel et al. N Engl J Med 2008; 359(9): 906–917; Supplementary Appendix8Mateos et al. J Clin Oncol 2010; 28(13): 2259-22669Palumbo et al. ASH 2010 (Abstract 622)10Mateos et al. Lancet Oncol 2010; 11(10): 934-94111Palumbo et al. ASH 2010 (Abstract 620)
1Palumbo et al. Blood 2008; 112:3107–31142Facon et al. Lancet 2007; 370:1209–12183Hulin et al. J Clin Oncol 2009; 27:3664-704Waage et al. Blood 2010; 116:1405-125Wijermans et al. J Clin Oncol 2010; 28:3160-66Beksac et al. Eur J Haematol 2011;86:16-22
CCd Induction C MaintenanceCycles 1-9 Until progression
CCd Induction C MaintenanceCycles 1-9 Until progression
Bringhen et al ASH 2013
Conclusions 1
CCd MPT VMP Rd
Response rates
≥ VGPR 77% 36% 41% 40%
nCR/CR/sCR 47% 27% 30%* 14%
Long-term outcomes
2-yr PFS 76% 47% ~47% ~47%
2-yr OS 87% 76% 79% 87%
CCd MPT VMP Rd
Response rates
≥ VGPR 77% 36% 41% 40%
nCR/CR/sCR 47% 27% 30%* 14%
Long-term outcomes
2-yr PFS 76% 47% ~47% ~47%
2-yr OS 87% 76% 79% 87%
* CR only, nCR not reported
Palumbo at al, Lancet, 2006 ;367:825-31.Fayers et al, Blood 2011; 118:1239-47; San Miguel et al, N Eng J Med 2008;359:906-17; Rajkumar et al, Lancet Oncol 2010; 11:29-37
Bringhen et al ASH 2013
Oral MLN 9708 Len Dex in Newly Diagnosed MM
• Phase 1: oral MLN9708 dose-escalation (dose of 3.0 and 3.7 mgs)– Standard 3+3 schema, 33% dose increments, based on cycle 1 DLTs
• Phase 2: oral MLN9708 at the RP2D from phase 1
• Stem cell collection allowed after cycle 4, with ASCT deferred until after 8 cycles
• MLN9708 maintenance continued at tolerated dose until progression or unacceptable toxicity
1 8 15 21
MLN9708
maintenance
Days 1, 4, 8, 11
21-day cycles
Induction: up to 16 x 21-day treatment cycles Maintenance
MLN9708 MLN9708 MLN9708
Dex* Dex* Dex*
Lenalidomide 25 mg, days 1–14
MLN9708
Dex*
4 11
*Dex 20/10 mg cycles 1–8 / 9–16Thromboembolism prophylaxis with aspirin 81–325 mg QD or LMWH while receiving len-dex mandatory
2 5 9 12
Richardson et al ASH 2013
Ixazomib lenalidomide dexamethasone in newly diagnosed multiple myeloma
• 56 pts treated at the RP2D were evaluable for response (7 phase 1, 49 phase 2)
• 61% of pts had 100% decreases in M-protein or serum free light chain from baseline
• Disease population (primary refractory vs. relapsed/refractory vs. intolerance/failure)
Thromboprophylaxis was required for those receiving POM or at high risk for DVT
PDa or
Unacceptable AE
a Progression of disease was independently adjudicated in real time.
Dimopoulos MA, et al. ASH 2013 [abstract 408].
0.25 0.5
PFS Based on Cytogenetic Profile• POM + LoDEX significantly improved PFS vs. HiDEX regardless of the
presence of del17p or t(4;14)
Note: Data shown only for pts with available cytogenetics; totals will not sum.a Number of events/number of patients.Dimopoulos MA, et al. ASH 2013 [abstract 408].
ITT Population
del(17p)/t(4;14)
Standard-RiskCytogenetics
SubgroupPOM + LoDEXa HiDEXa HR (95% CI)
0.49 (0.40-0.61)
0.44 (0.28-0.68)
0.55 (0.40-0.75)
138/153
32/35
63/72
253/302
71/77
126/148
1
Favors POM + LoDEX
2
Favors HiDEX
Forest Plot of OS Based on Prior Treatment
a Number of events/number of pts.
San Miguel JF, et al. ASH 2013 [abstract 686].
Subgroup HiDEXa HR (95% CI)
0.72 (0.56-0.92)
0.56 (0.33-0.96)
0.76 (0.58-1.00)
0.75 (0.55-1.03)
0.66 (0.45-0.99)
0.70 (0.55-0.90)
0.77 (0.58-1.01)
0.77 (0.58-1.02)
0.56 (0.36-0.88)
0.92 (0.63-1.36)
101/153
22/33
79/120
64/93
37/60
94/141
79/121
74/113
32/49
39/66
176/302
41/70
135/232
102/173
74/129
168/286
142/238
135/225
47/85
76/134
ITT Population
≤ 3 Prior Tx
> 3 Prior Tx
Prior THAL
No Prior THAL
LEN Ref
BORT Ref
LEN and BORT Ref
LEN as Last Prior
BORT as Last Prior
POM + LoDEXa
0.25 0.5 1 2
Favoring POM-LoDex Favoring HiDEX
MM-003: PFS and OS by M-Protein ReductionPatients Assigned to POM + LoDEX
San Miguel JF, et al. ASH 2013 [abstract 686].
• Median PFS was 4.0 mos and median OS was 13.1 mos overall for POM + LoDEX
M-Protein Reduction
Median PFS
≥ 25 % (n = 163) 7.4 mos
≥ 50 % (n = 113) 8.4 mos
< 25% (n = 96) 2.3 mos
M-Protein Reduction
Median OS
≥ 25 % (n = 163) 17.2 mos
≥ 50 % (n = 113) 19.9 mos
< 25% (n = 96) 7.5 mos
PFS (mos)
0.0
0.2
0.4
0.6
0.8
1.0
4 8 12 16 20 240
Pro
po
rtio
n o
f P
atie
nts
OS (mos)
0.0
0.2
0.4
0.6
0.8
1.0
4 8 12 16 20 280 24
Pom low dose dex and bortezomib in relapsed MM
Table 4. Summary of Best Response (IMWG) in Intravenous BORT Cohorts
Median cycles received (range) 5 (4-16) 6 (4-18) 16 (5-20) 10 (4-13) 11 (6-15)
a 8 of 9 patients were evaluable for response; one patient discontinued study treatment in cycle 2 due to treatment-unrelated metastatic pancreatic cancer. CR, complete response; Exp, expansion; IMWG, International Myeloma Working Group; PR, partial response; SC, subcutaneous; sCR, stringent complete response; SD, stable disease; VGPR, very good partial response.
Richardson et al, ASH 2013
Carfilzomib: A Novel Proteasome (Chymotryptic) Inhibitor
• Novel chemical class with highly selective
and irreversible proteasome binding
• Improved antitumor activity with
consecutive day dosing
• No neurotoxicity in animals
• 23% Responses lasting 7.8 months with survival 15.4 months in relapsed and relapsed/ refractory MM w/o
Demo et al Cancer Res 2007; 67:6383 Kirk et al, Blood 2008, 112: 2765 ; Siegel et al Blood 2012:120:2817.
HN
NH
O HN
O
O
NHO
NO O
O
Epoxyketone
Tetrapeptide
CRd in Relapsed and Upfront MM
• Response to CRd therapy in RRMM was high, with an ORR of 78%
41% VGPR or better
• CRd well-tolerated with durable responses
• ASPIRE phase 3 open-label, international, multicenter trial comparing CRd to Rd in R/R MM fully enrolled.
• Remarkable extent and frequency of response to CRd upfront in ND MM (94% ORR, with 80% CR,nCR after 12 cycles in a subset of pts)
Wang et al ASCO 2011; Jakubowiak et al, Blood 2012
Carfilzomib Pomalidomide Low dose Dex
• Median of 5 prior lines of therapy; 49% of patients had high/intermediate risk cytogenetics at baseline
• Response rates, PFS, and OS were preserved independent of FISH/cytogenetic risk status
• Well tolerated with no unexpected toxicities
≥ VGPR 27% ORR 70% CBR 83% DOR (median) 17.7
months PFS (median) 9.7 months OS (median) > 18
months
Shah et al ASH 2013
Antibody-dependentCellular cytotoxicity
(ADCC)
ADCC
Effector cells:
MM
FcR
Complement-dependentCytotoxicity (CDC)
CDC
MM
C1q
C1q
Apoptosis/growth arrest
via targetingsignaling pathways
MM
Lucatumumab or Dacetuzumab (CD40)Elotuzumab (CS1)Daratumumab (CD38)XmAb5592 (HM1.24)
• CS1 is highly and uniformly expressed on MM cells • Elotuzumab (Elo) is a humanized monoclonal IgG1
antibody targeting CS1 • Clinical trial of Elo in MM achieved SD • Anti-MM activity of Elo enhanced by lenalidomide (len)
in preclinical models• Phase I/II trials: 80-90% response to len dex elo in
relapsed MM with prolonged (> month 33 PFS)• Phase III trial of len dex elo versus len dex in relapsed
MM for new drug approval
Hsi ED et al. Clin Cancer Res. 2008;14:2775-2784; Tai YT et al. Blood. 2008;112:1329-1337; Van Rhee F et al. Mol Cancer Ther. 2009;8:2616-2624; Lonial S et al. Blood. 2009;114:432; Richardson et al Blood 2010:864 Lonial et al, ASH 2012
Elotuzumab Anti-CS MoAb in MM
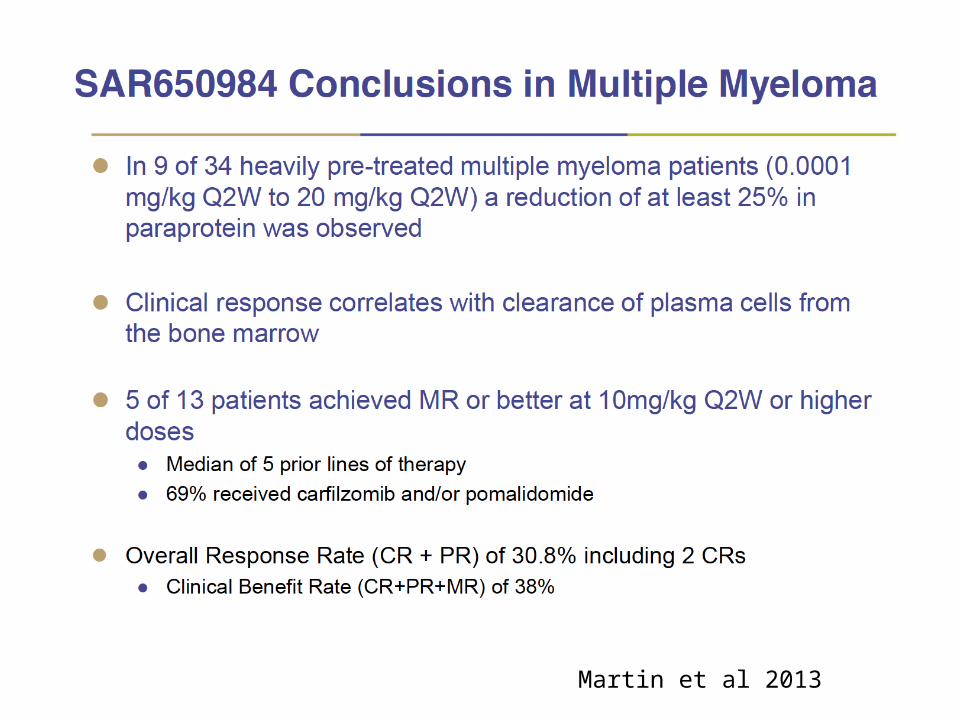
Martin et al ASH 2013
Martin et al 2013
PHASE I/II STUDY OF DARATUMUMAB CD38 MONOCLONAL ANTIBODY IN
RELAPSED/REFRACTORY MM • Favorable safety profile as monotherapy
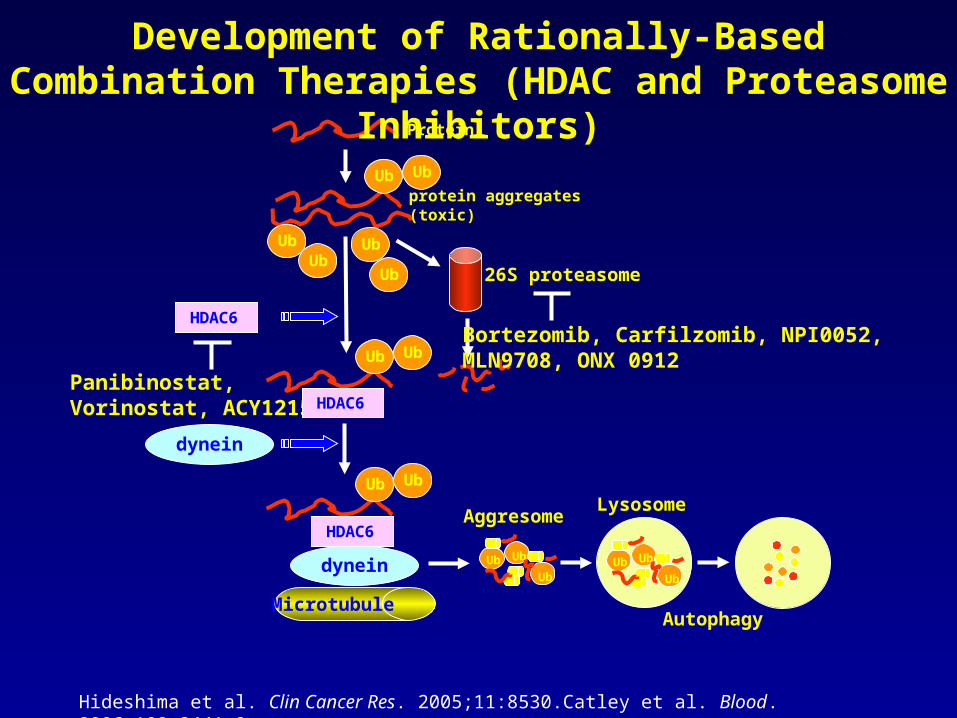
Development of Rationally-Based Combination Therapies (HDAC and Proteasome Inhibitors)
Hideshima et al. Clin Cancer Res. 2005;11:8530.Catley et al. Blood. 2006;108:3441-9.
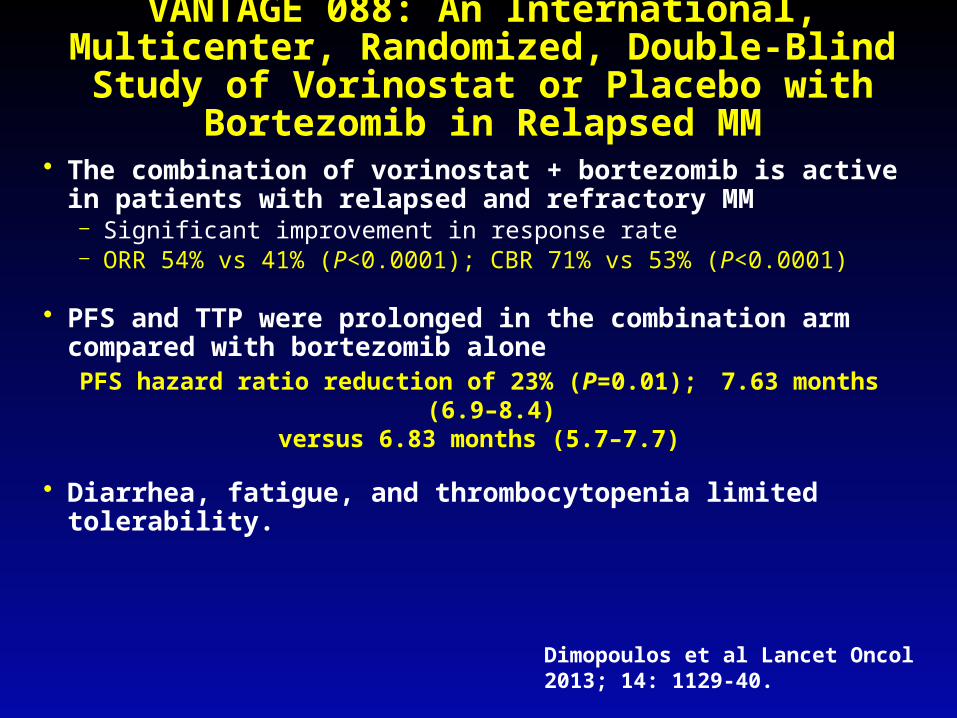
VANTAGE 088: An International, Multicenter, Randomized, Double-Blind Study of Vorinostat
or Placebo with Bortezomib in Relapsed MM
• The combination of vorinostat + bortezomib is active in patients with relapsed and refractory MM– Significant improvement in response rate– ORR 54% vs 41% (P<0.0001); CBR 71% vs 53% (P<0.0001)
• PFS and TTP were prolonged in the combination arm compared with bortezomib alone
PFS hazard ratio reduction of 23% (P=0.01); 7.63 months (6.9–8.4)versus 6.83 months (5.7–7.7)
• Diarrhea, fatigue, and thrombocytopenia limited tolerability.
Dimopoulos et al Lancet Oncol 2013; 14: 1129-40.
Ricolinostat (HDAC 6 inhibitor) alone and in combination with bortezomib in relapsed
refractory MM• Monotherapy
• 6/15 patients had stable disease (SD) as their best response.
• Combination with bortezomib and dexamethasone
• 20/22 were evaluable for response assessment in six combination cohorts
• Overall response rate (≥PR): 25% in heavily pretreated patients
• 5 patients withdrew after one cycle and 3 had progressive disease after 2 cycles
• Clinical benefit rate (≥SD): 60%
• 6/10 patients refractory to bortezomib had ≥SD (1 VGPR, 1 MR, 4 SD)
• Responding patients have been on study 2 to 16 cycles
• All 3 patients treated 240 mg QD cohort had MR or better
VGPR
2
PR 3
MR1 2
SD 5
Monotherapy response data from Final CSR. Combination response data pulled from live database Nov 8, 2013
51
1 One patient had a 26% decrease in M Protein after Cycle 2 and withdrew after two subsequent cycles with SD
Ricolinostat (HDAC 6 inhibitor) lenalidomide dexamethasone in relapsed refractory MM
• 11/16 pts (69%) had PR or better
• 16/16 pts (100%) had clinical benefit (including MR and SD)
MTD / RP2D:Afuresertib 150 mg PO dailyBortezomib 1.3 mg/m2 IV/SC on days: 1,4,8,11Dexamethasone 40 mg PO on days: 1,4,8,11
All DLTs were reversible
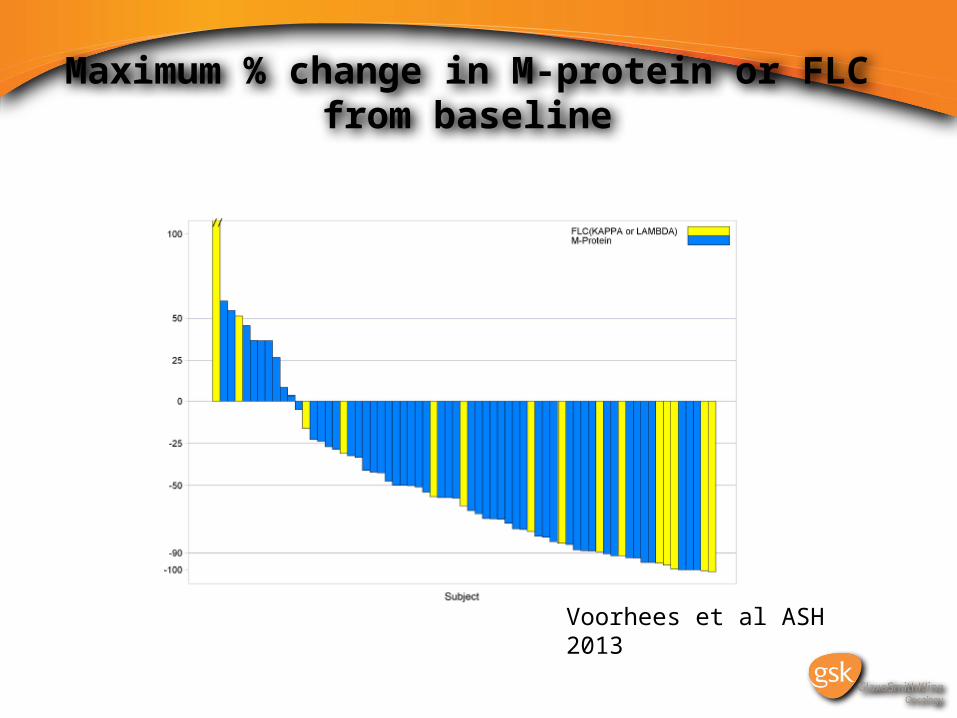
Voorhees et al ASH 2013
Maximum % change in M-protein or FLC from baseline
Voorhees et al ASH 2013
Treatment of Multiple Myeloma: Conclusions
• In newly diagnosed transplant candidates, three drug regimens incorporating immunomodulatory drugs and proteasome inhibitors before and after transplant can prolong PFS and OS.
• Lenalidomide dex until progression is standard of care for non transplant patients with newly diagnosed myeloma.
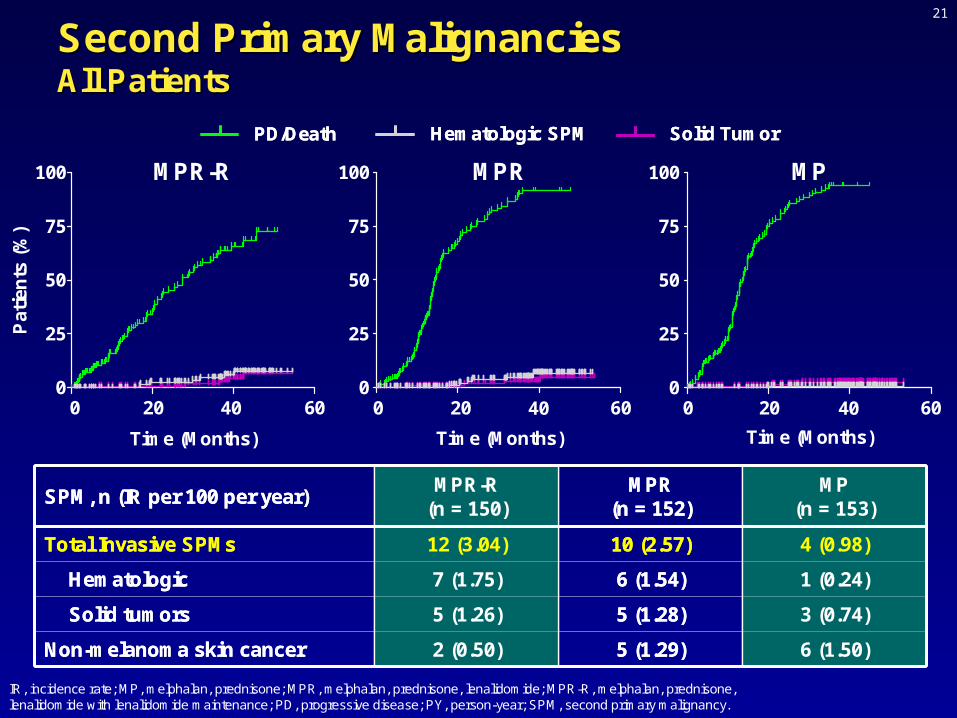
• Lenalidomide maintenance until progression prolongs PFS and OS, with an increased risk of secondary cancers in patients who have received MP or high dose therapy and ASCT.
Terrence Fagan
Dr Anderson and Dr Lonial: please provide overall conclusions for the slide set.
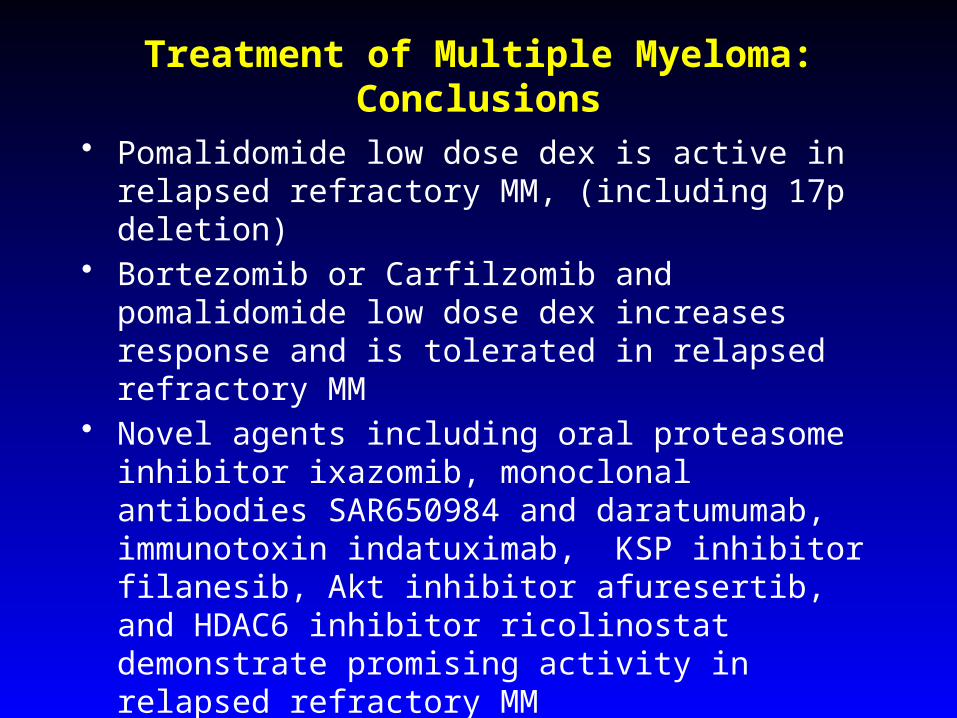
Treatment of Multiple Myeloma: Conclusions
• Pomalidomide low dose dex is active in relapsed refractory MM, (including 17p deletion)
• Bortezomib or Carfilzomib and pomalidomide low dose dex increases response and is tolerated in relapsed refractory MM
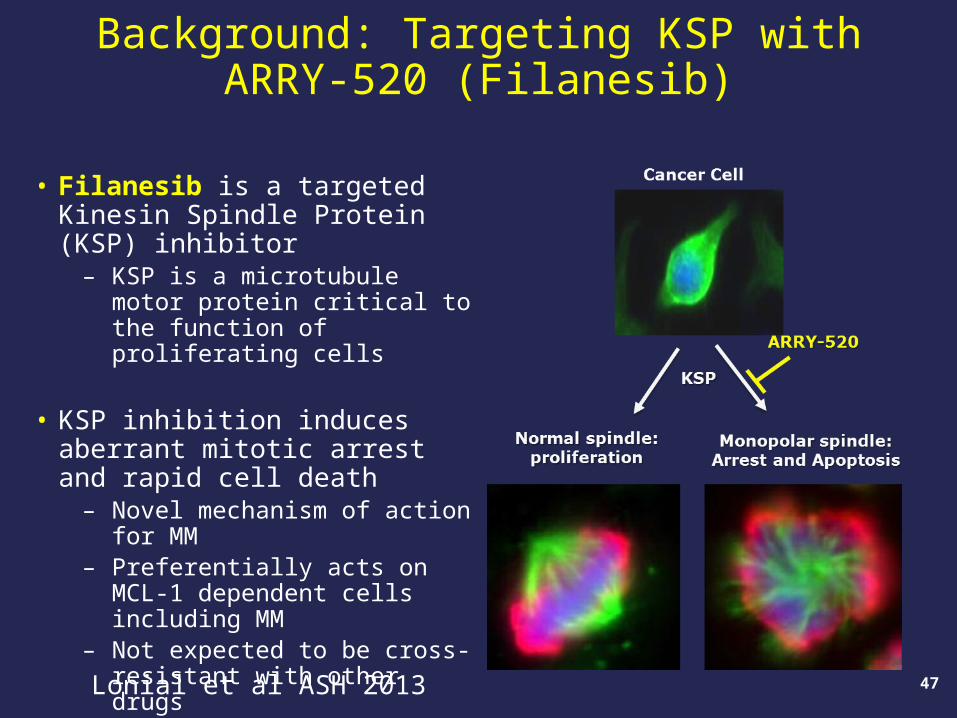
• Novel agents including oral proteasome inhibitor ixazomib, monoclonal antibodies SAR650984 and daratumumab, immunotoxin indatuximab, KSP inhibitor filanesib, Akt inhibitor afuresertib, and HDAC6 inhibitor ricolinostat demonstrate promising activity in relapsed refractory MM
• Incorporation of novel therapies at all stages of disease is further improving patient outcome in MM
Terrence Fagan
Dr Anderson and Dr Lonial: please provide overall conclusions for the slide set.