26
DEVELOPMENTS OF DEVELOPMENTS OF SECTORS SECTORS A.Introductıon
| Date post: | 11-Dec-2015 |
| Category: |
Documents |
| Upload: | desmond-hosmer |
| View: | 212 times |
| Download: | 0 times |

DEVELOPMENTS OF DEVELOPMENTS OF SECTORSSECTORS
A.Introductıon

Types of Their Value AddedTypes of Their Value Added

B. Agriculture1. People and The Land

Figure 1. Agricultural Employment ( Sep. 2011- 2012 )
*Population within 15-24 age group
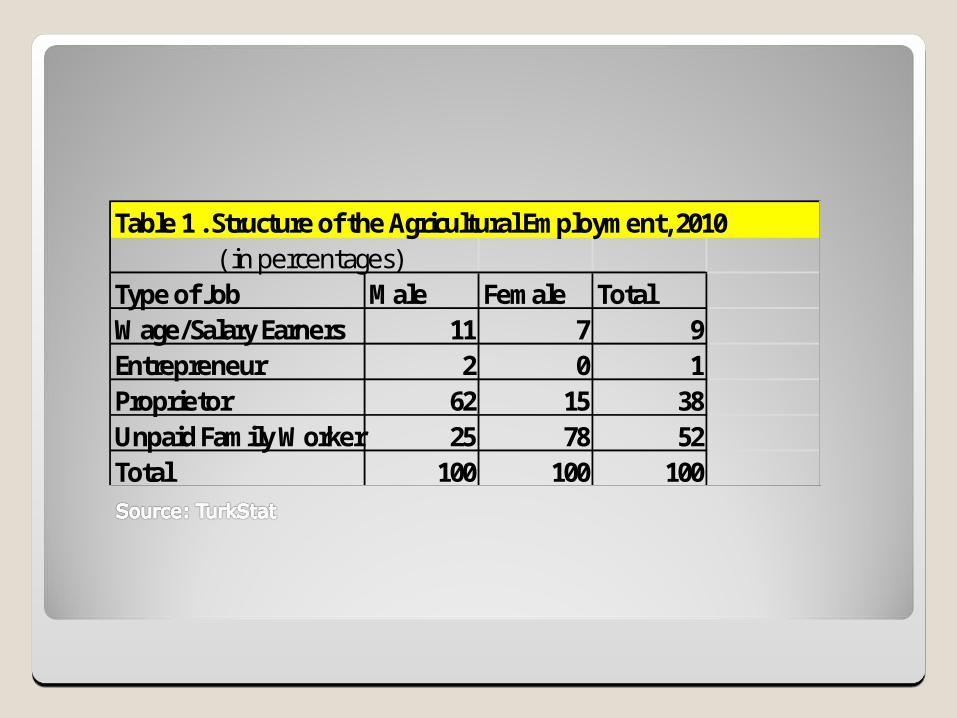
Table 1 . Structure of the Agricultural Employment, 2010 ( in percentages)Type of Job Male Female TotalWage/Salary Earners 11 7 9Entrepreneur 2 0 1Proprietor 62 15 38Unpaid Family Worker 25 78 52Total 100 100 100

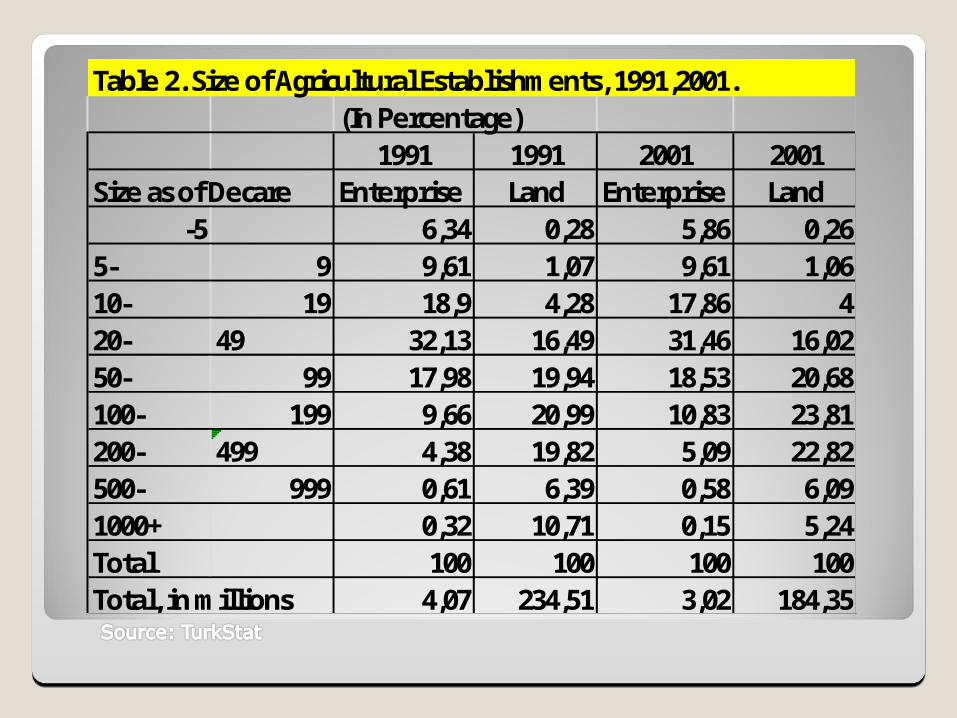
Table 2. Size of Agricultural Establishments, 1991,2001.(In Percentage)
1991 1991 2001 2001Size as of Decare Enterprise Land Enterprise Land
-5 6,34 0,28 5,86 0,265- 9 9,61 1,07 9,61 1,0610- 19 18,9 4,28 17,86 420- 49 32,13 16,49 31,46 16,0250- 99 17,98 19,94 18,53 20,68100- 199 9,66 20,99 10,83 23,81200- 499 4,38 19,82 5,09 22,82500- 999 0,61 6,39 0,58 6,091000+ 0,32 10,71 0,15 5,24Total 100 100 100 100Total, in millions 4,07 234,51 3,02 184,35

Tablo: 1. Türkiye ve AB’deki Çeşitli Tarımsal Göstergelerin Karşılaştırılması (2001)
GÖSTERGELER TÜRKİYE AVRUPA BİRLİĞİToplam Tarım Alanı (1000 Ha.) 27 134,261Toplam İşletme Sayısı (1000 Adet) 4,106 7,37Ortalama İşletme Büyüklüğü (Ha.) 5,9 17,4Toplam Nüfus (Milyon) 68 377Tarım Nüfusu (Milyon) 20 15,6Tarımda İstihdam (Milyon) 9,4 7,4Toplam İstihdamda Tarımın Payı (%) 39 5GSMH Tarımın Payı (%) 14 1,9İhracatta Tarımın Payı (%) 7,83 7,5İthalatta Tarımın Payı (%) 4,18 10,5
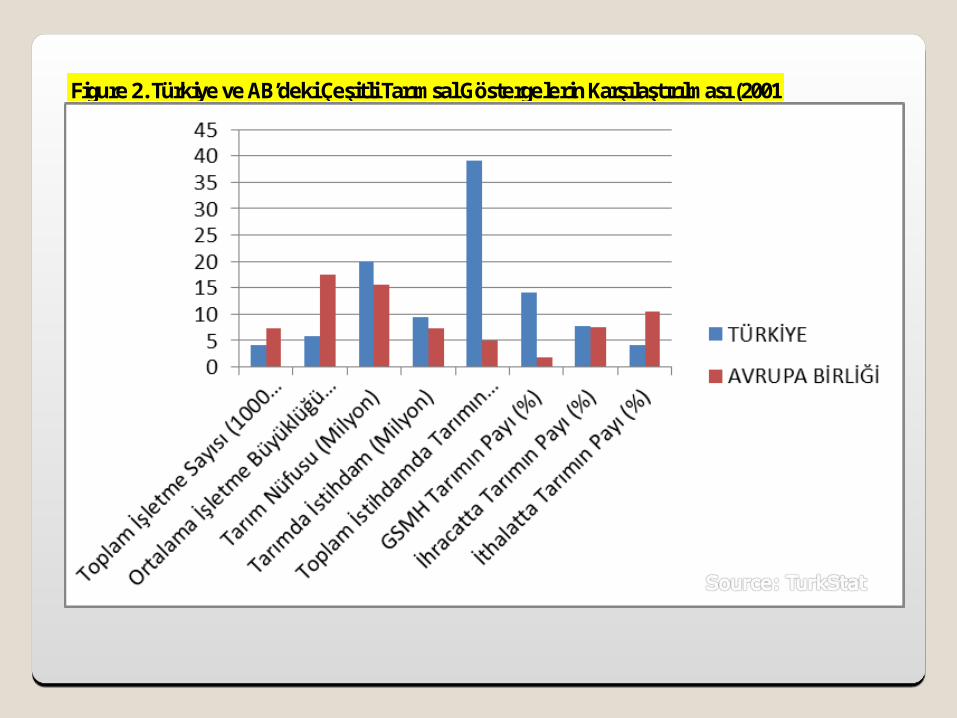
Figure 2. Türkiye ve AB’deki Çeşitli Tarımsal Göstergelerin Karşılaştırılması (2001)

2. Inputs-Other than 2. Inputs-Other than LandLand
Graphs & Figures

Figure 3. Total Number of Tractors

Figure 4. Total Number of Harvester

3. Agricultural Incentives- 3. Agricultural Incentives- DisincentivesDisincentives
Graphs & Figures
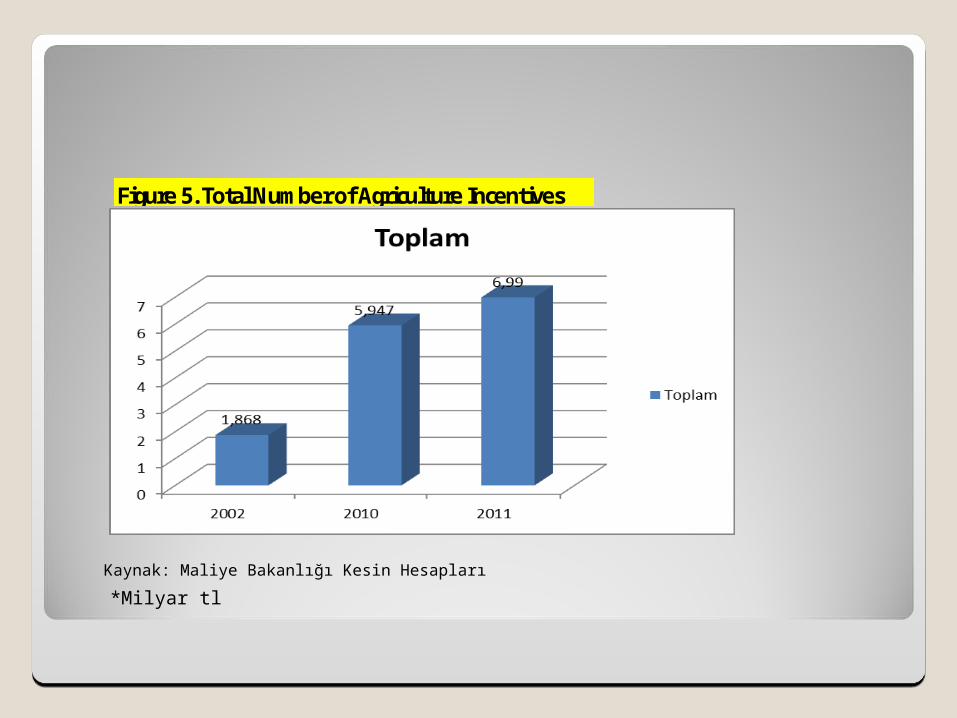
Kaynak: Maliye Bakanlığı Kesin Hesapları
Figure 5. Total Number of Agriculture Incentives
*Milyar tl
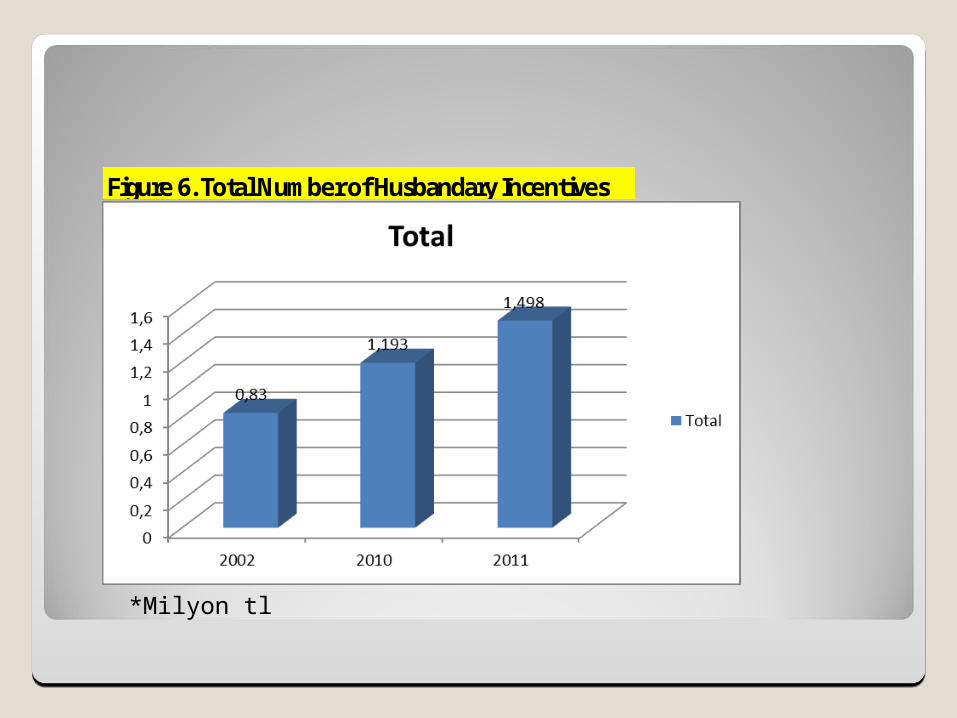
Figure 6. Total Number of Husbandary Incentives
*Milyon tl

C.INDUSTRY: A C.INDUSTRY: A CHANGED TRACKCHANGED TRACK
1.Introduction
Industry is used in its proper economic meaning whichincludes all manufacturing plus mining ,energy , gas & water.
2. Industrialisation Policiesa. Before 1980

a. Before 1980
Tablo 5. 1950-1980 Yılları Arasında Ana Sektörlere Göre İhracatYıllar Madencilik Topl. İç. Payı Sanayi Topl. İç. Payı
1950 15 5,6 4 1,41960 20 6,1 58 17,91970 39 6,6 109 18,41980 191 6,6 1047 36

b. After 1980b. After 1980Tablo 6. 1980 - 2000 Yılları Arası Ana Sektörlere Göre İhracat
Yıllar Madencilik Topl. İç. Payı Sanayi Topl. İç. Payı1980 191 6,6 1047 361985 244 3,1 5995 75,31990 326 2,5 10349 79,91995 391 1,8 19089 88,22000 400 1,4 25518 91,9
*Milyon $

c. Structure of c. Structure of ManufacturingManufacturing
Tables & Graphs

Tablo 7 . Sanayi Üretim Endeksi- İmalat Sanayi
Dönemi İmalat Sanayi İm. San. (Değişim)(%)Eki.12 130,3 -5,9Eyl.12 133,6 6,3
Ağu.12 111 -3Tem.12 127,9 2,9Haz.12 130,2 1,8
May.12 134,3 5,8Nis.12 124,6 1,6
Mar.12 128,9 1,8Şub.12 115,1 3,1Oca.12 115,5 0,4Ara.11 139,7 2,8Kas.11 124,7 7,8Eki.11 138,5 7,2
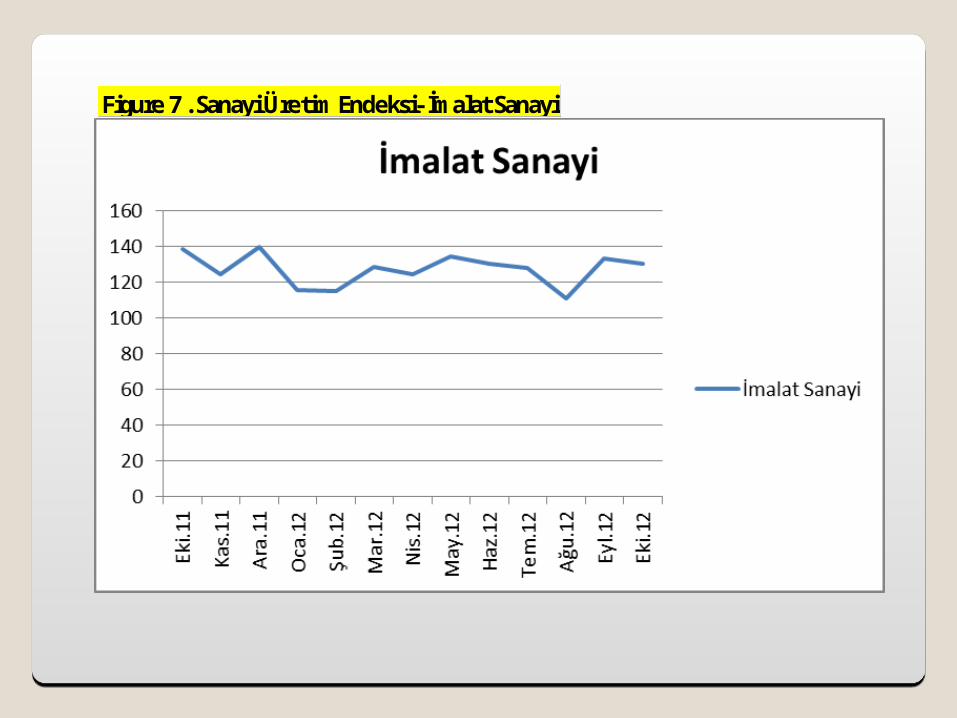
Figure 7 . Sanayi Üretim Endeksi- İmalat Sanayi
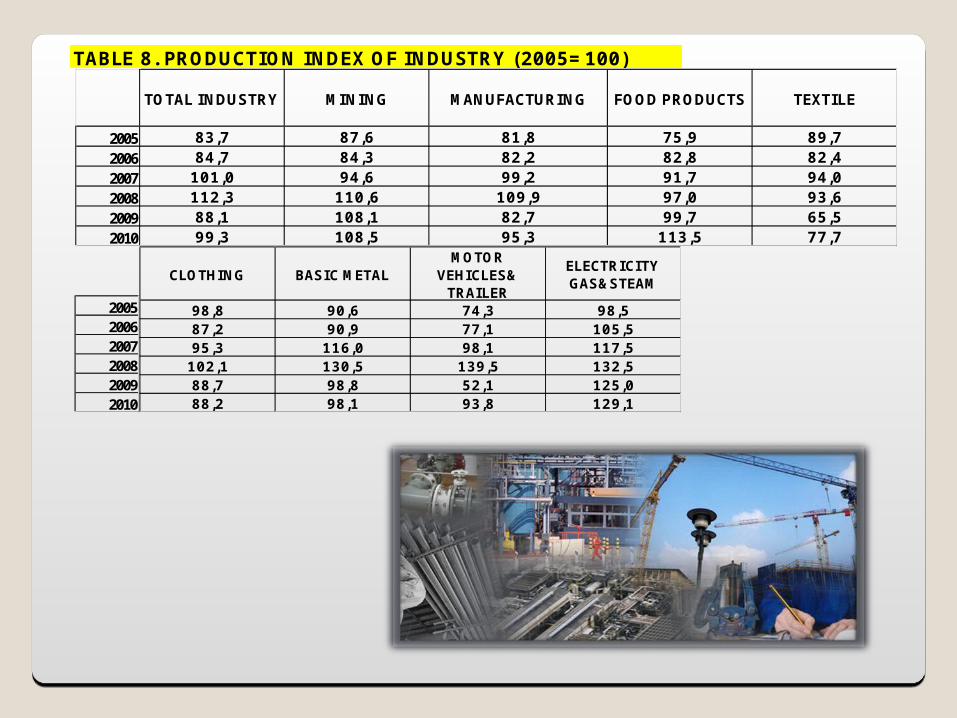
TOTAL INDUSTRY MINING MANUFACTURING FOOD PRODUCTS TEXTILE
2005 83,7 87,6 81,8 75,9 89,72006 84,7 84,3 82,2 82,8 82,42007 101,0 94,6 99,2 91,7 94,02008 112,3 110,6 109,9 97,0 93,62009 88,1 108,1 82,7 99,7 65,52010 99,3 108,5 95,3 113,5 77,7
200520062007200820092010
CLOTHING BASIC METALMOTOR
VEHICLES&TRAILER
ELECTRICITY GAS&STEAM
98,8 90,6 74,3 98,587,2 90,9 77,1 105,595,3 116,0 98,1 117,5102,1 130,5 139,5 132,588,7 98,8 52,1 125,088,2 98,1 93,8 129,1
TABLE 8. PRODUCTION INDEX OF INDUSTRY (2005=100)

D.SERVICES: AN D.SERVICES: AN UNBALANCED GROWTHUNBALANCED GROWTH
Basic Human Quality Services
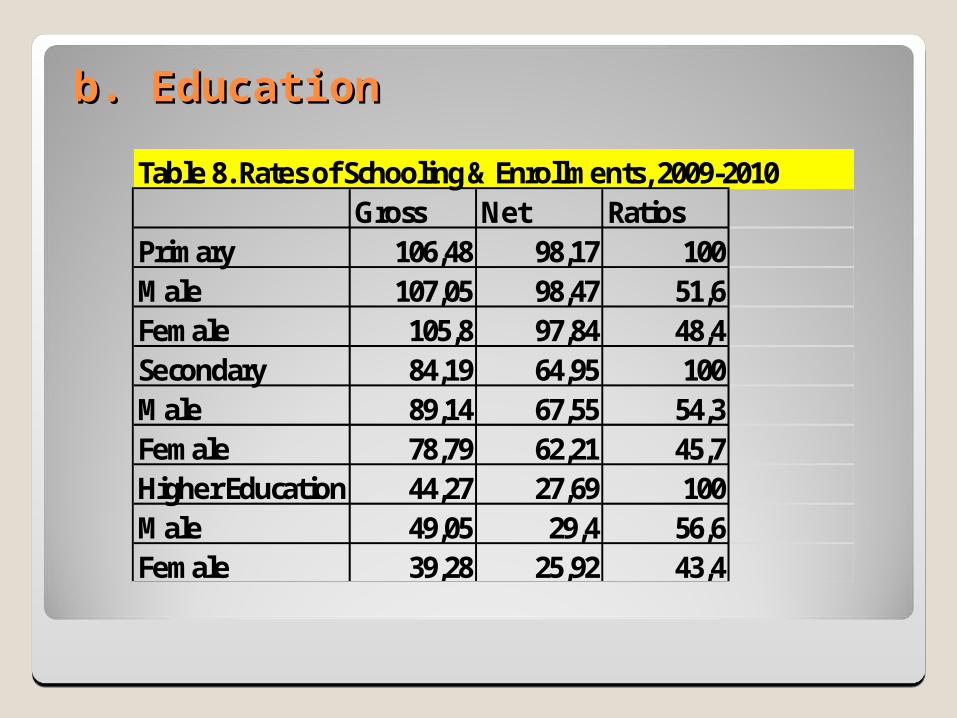
b. Educationb. Education
Table 8. Rates of Schooling & Enrollments, 2009-2010Gross Net Ratios
Primary 106,48 98,17 100Male 107,05 98,47 51,6Female 105,8 97,84 48,4Secondary 84,19 64,95 100Male 89,14 67,55 54,3Female 78,79 62,21 45,7Higher Education 44,27 27,69 100Male 49,05 29,4 56,6Female 39,28 25,92 43,4

Figure 8. Rates of Schooling & Enrollments, 2009-2010


