Dewatering of High Salinity Brines by Osmotically Assisted Reverse Osmosis Timothy V. Bartholomew, Meagan S. Mauter Carnegie Mellon University Jason T. Arena, Nicholas S. Siefert U.S. D.O.E. National Energy Technology Laboratory
Transcript
Dewatering of High Salinity Brines by Osmotically
Assisted Reverse Osmosis
Timothy V. Bartholomew, Meagan S. MauterCarnegie Mellon University
Jason T. Arena, Nicholas S. SiefertU.S. D.O.E. National Energy Technology Laboratory
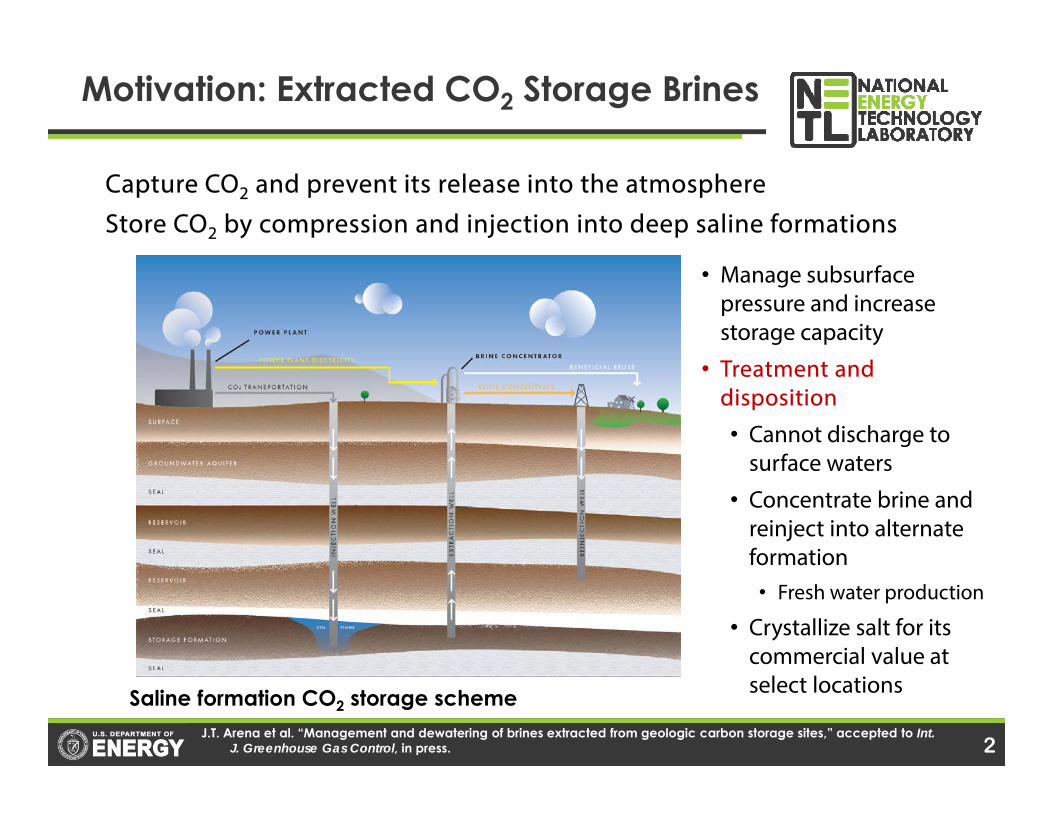
Motivation: Extracted CO2 Storage Brines
Capture CO2 and prevent its release into the atmosphereStore CO2 by compression and injection into deep saline formations
J.T. Arena et al. “Management and dewatering of brines extracted from geologic carbon storage sites,” accepted to Int. J. Greenhouse Gas Control, in press.
• Manage subsurface pressure and increase storage capacity
• Treatment and disposition
• Cannot discharge to surface waters
• Concentrate brine and reinject into alternate formation• Fresh water production
• Crystallize salt for its commercial value at select locationsSaline formation CO2 storage scheme
2
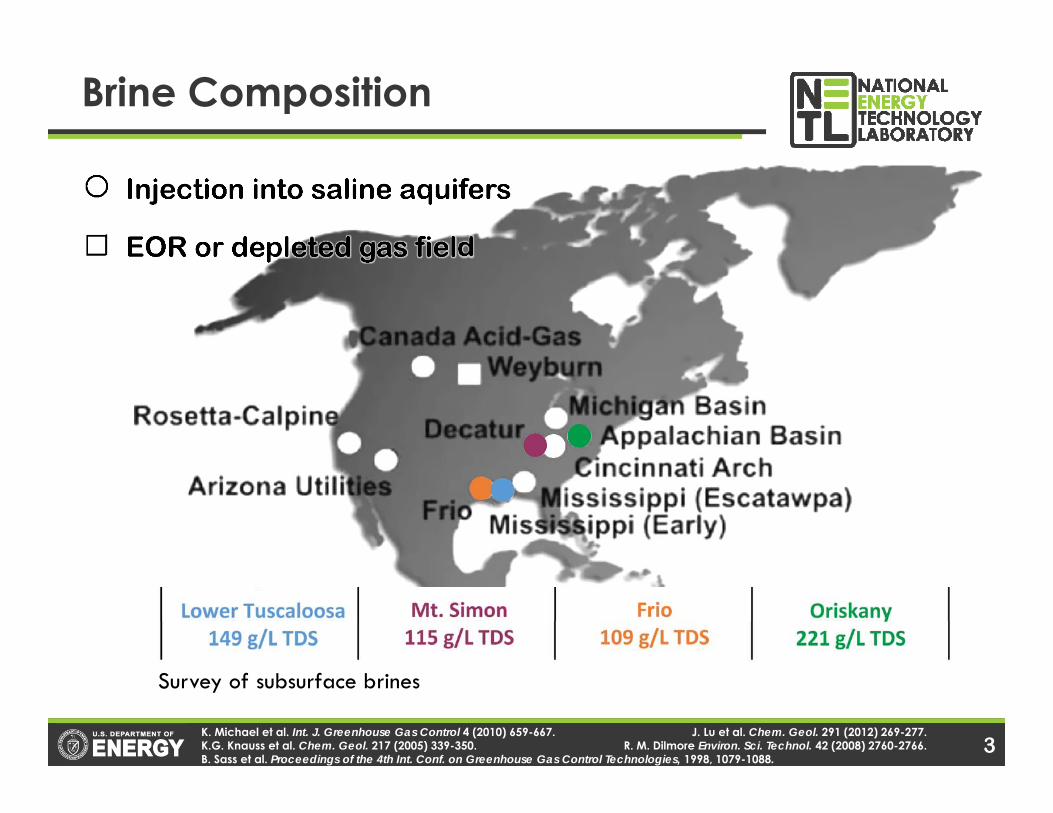
Brine Composition
K. Michael et al. Int. J. Greenhouse Gas Control 4 (2010) 659-667. J. Lu et al. Chem. Geol. 291 (2012) 269-277. K.G. Knauss et al. Chem. Geol. 217 (2005) 339-350. R. M. Dilmore Environ. Sci. Technol. 42 (2008) 2760-2766.B. Sass et al. Proceedings of the 4th Int. Conf. on Greenhouse Gas Control Technologies, 1998, 1079-1088.
Survey of subsurface brines
Range of Global Seawater Concentrations
3
Eastern U.S. CO2 Storage Brines
4K. Michael et al. Int. J. Greenhouse Gas Control 4 (2010) 659-667. J. Lu et al. Chem. Geol. 291 (2012) 269-277. K.G. Knauss et al. Chem. Geol. 217 (2005) 339-350. R. M. Dilmore Environ. Sci. Technol. 42 (2008) 2760-2766.B. Sass et al. Proceedings of the 4th Int. Conf. on Greenhouse Gas Control Technologies, 1998, 1079-1088.
Range of Seawater
Range of Seawater
Typical SWRO Pressure
RO High Pressure
Composition (eq/ L) of four brines extracted from GCS-relevant formations in the eastern U.S. assuming complete dissociation. Osmotic pressure calculated from water activity determine using Geochemist’s Workbench v9 with the thermo_phrqpitz database.
149 g/L TDS
115 g/L TDS109 g/L TDS
221 g/L TDS
Lower Tuscaloosa
Mt. Simon Frio Oriskany
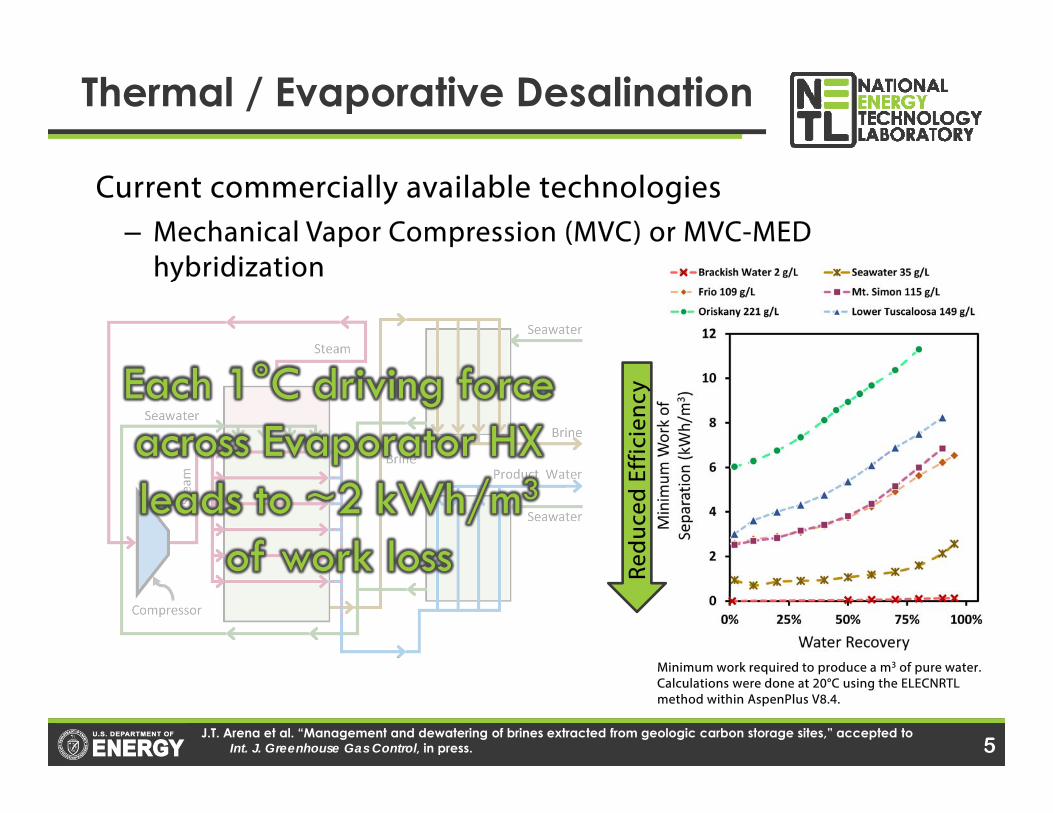
Thermal / Evaporative Desalination
Current commercially available technologies– Mechanical Vapor Compression (MVC) or MVC-MED
hybridization
J.T. Arena et al. “Management and dewatering of brines extracted from geologic carbon storage sites,” accepted to Int. J. Greenhouse Gas Control, in press.
Each 1°C driving force across Evaporator HX leads to ~2 kWh/m3
of work loss
Minimum work required to produce a m3 of pure water. Calculations were done at 20°C using the ELECNRTL method within AspenPlus V8.4.
5
Redu
ced
Effic
ienc
y
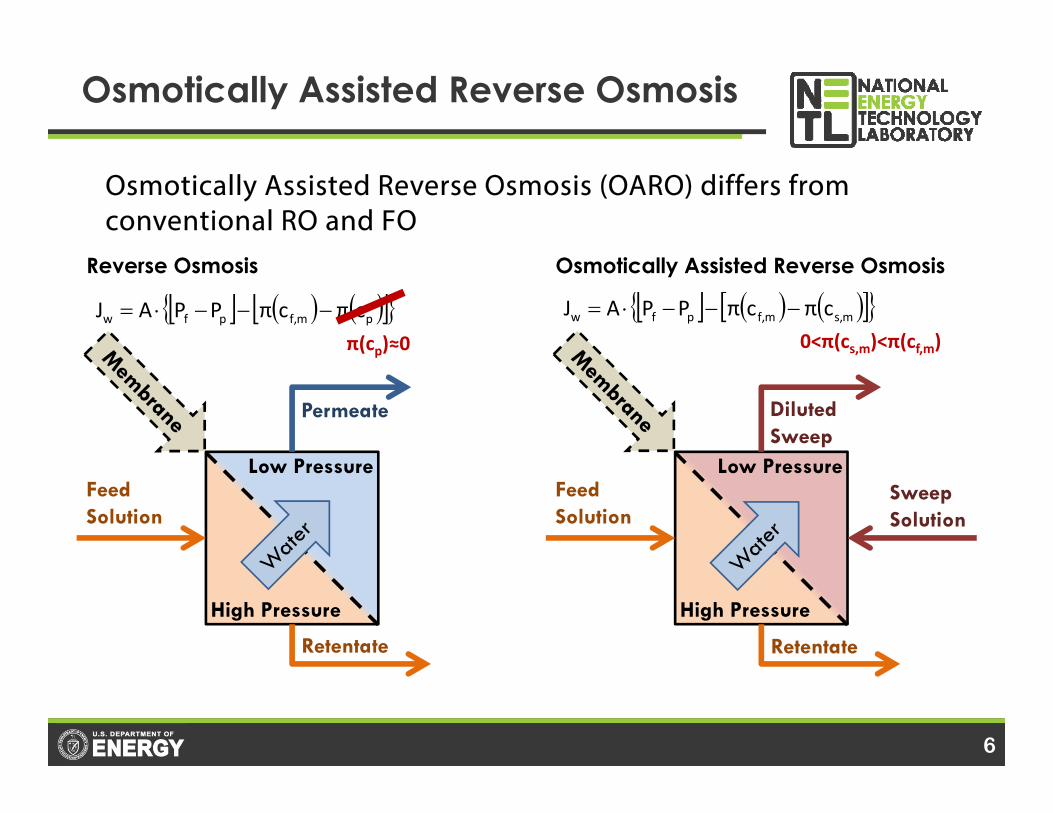
Osmotically Assisted Reverse Osmosis
Osmotically Assisted Reverse Osmosis (OARO) differs from conventional RO and FO
7J.T. Arena et al. “Dewatering of High Salinity Brines by Osmotically Assisted Reverse Osmosis “ in Proceedings of the
AWWA-AMTA 2017 Membrane Technology Conference and Exposition, February 13-17, 2017.
High PressureLow Pressure
Low Pressure
Low Pressure
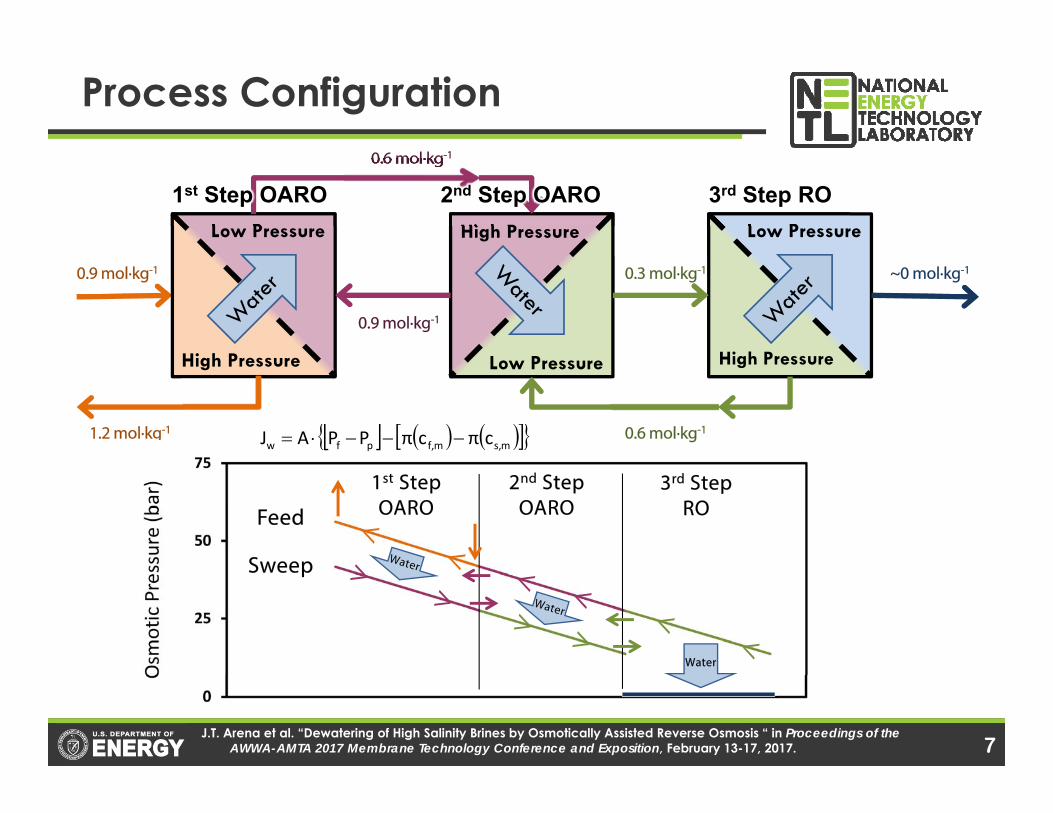
0.6 mol·kg-1
1.2 mol·kg-1
0.9 mol·kg-1
0.9 mol·kg-1
~0 mol·kg-10.3 mol·kg-1
1st Step OARO 2nd Step OARO 3rd Step RO
High Pressure High Pressure
ms,mf,pfw cπcπPPAJ 0.6 mol·kg-1
Feed
Sweep
1st Step OARO
2nd Step OARO
3rd Step RO
Water
cs,p
Pp
Mass Transport in Membrane Support Layers
J.R. McCutcheon, M. Elimelech, J. Membr. Sci. 284 (2006) 237-247.A. Tiraferri et al. J. Membr. Sci. 444 (2013) 523-538.
Js
Jw∙cf
dxcd
D f
Jw∙cp
dxcd
D seff
0x stx fδx
Selective Layer
Support Layer
Water Flux, Jw
Boundary Layer
Membrane
cs(x)
Jw∙cf
dxcd
D f
Jw∙cs
dxcd
D seff
0x stx fδx
Selective Layer
Support Layer
Water Flux, Jw
Boundary Layer
Pf Pd
cs(x)
Js
Membrane
FO ROOAROcs,f<cs,dPf≈Pd
cs,f cs,d
Pf Ps
cs,f cs,s
cs,f>cs,p≈0Pf>Pp≈0cs,f>cs,sPf>>Ps
Jw∙cs
Assumes same salt on both sides of membrane
8
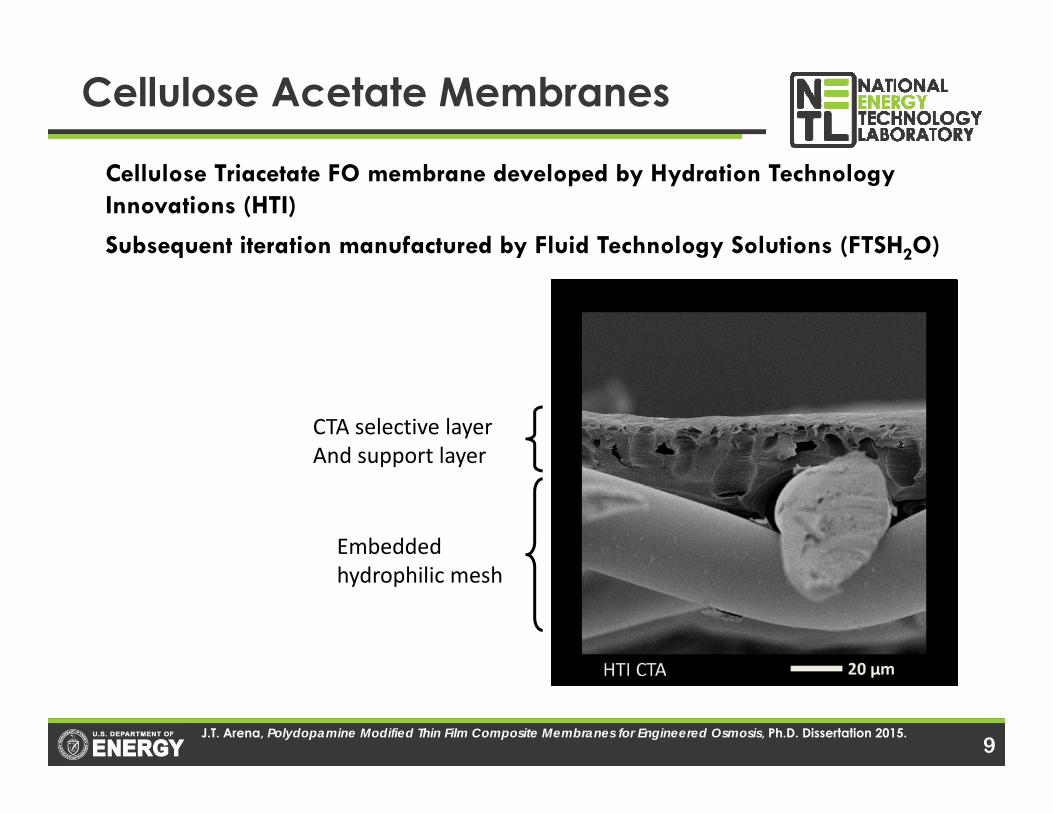
Cellulose Acetate Membranes
J.T. Arena, Polydopamine Modified Thin Film Composite Membranes for Engineered Osmosis, Ph.D. Dissertation 2015.
Cellulose Triacetate FO membrane developed by Hydration Technology Innovations (HTI)
Subsequent iteration manufactured by Fluid Technology Solutions (FTSH2O)
CTA selective layerAnd support layer
Embedded hydrophilic mesh
9
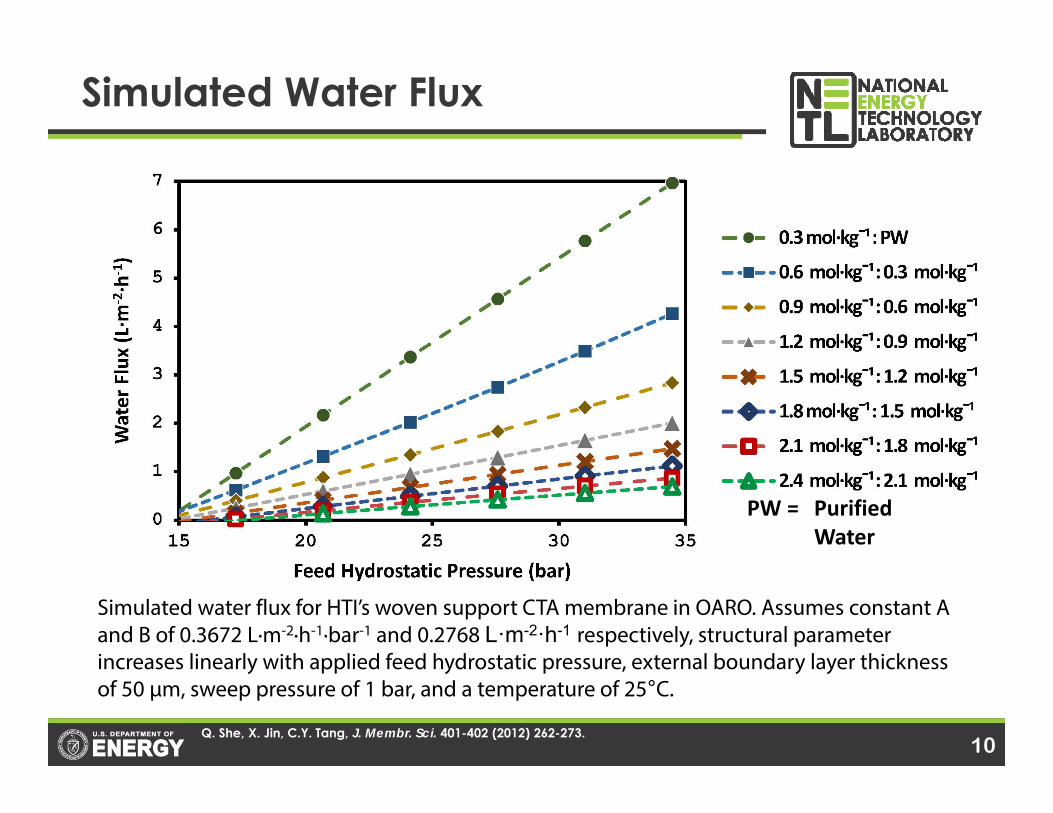
Simulated water flux for HTI’s woven support CTA membrane in OARO. Assumes constant A and B of 0.3672 L·m-2·h-1·bar-1 and 0.2768 L·m-2·h-1 respectively, structural parameter increases linearly with applied feed hydrostatic pressure, external boundary layer thickness of 50 μm, sweep pressure of 1 bar, and a temperature of 25°C.
Simulated transmembrane osmotic pressure for HTI’s woven support CTA membrane in OARO. Assumes constant A and B of 0.3672 L·m-2·h-1·bar-1 and 0.2768 L·m-2·h-1respectively, structural parameter increases linearly with applied hydrostatic pressure, external boundary layer thickness of 50 μm, and a temperature of 25°C.
J.T. Arena et al. “Dewatering of High Salinity Brines by Osmotically Assisted Reverse Osmosis,” in Proceedings of the 2017 AWWA-AMTA Membrane Technology Conference and Exposition, February 13-17, 2017. 12
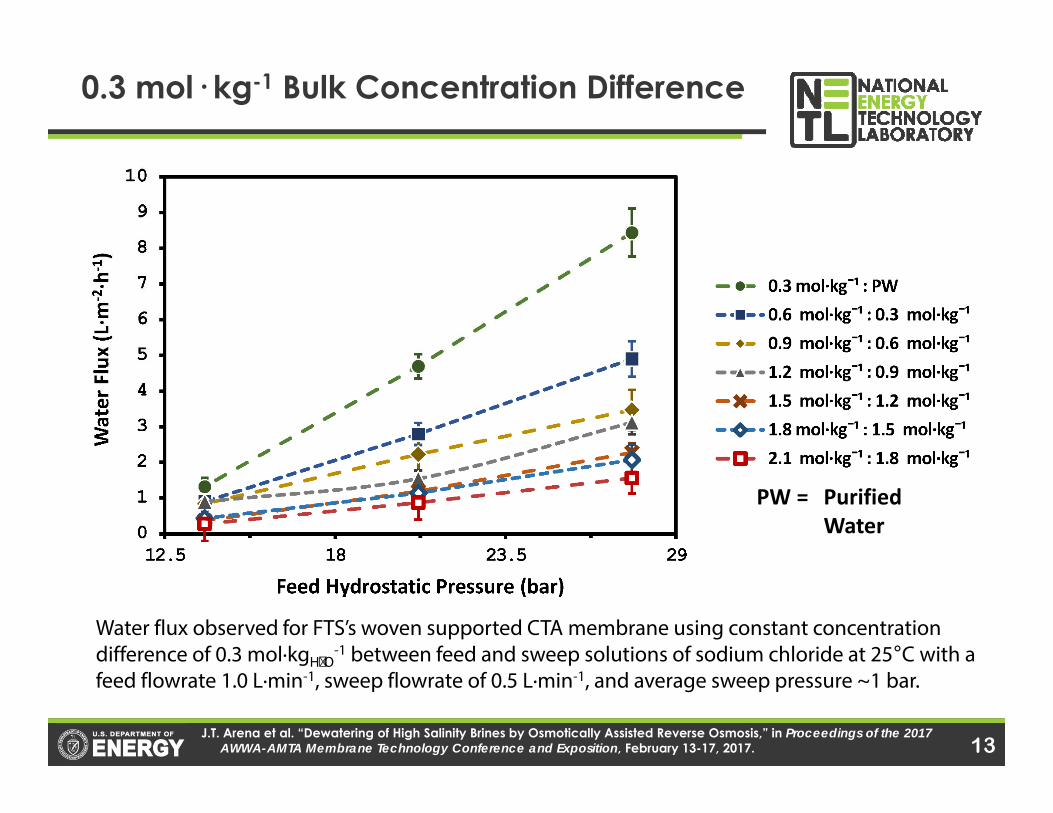
0.3 mol· kg-1 Bulk Concentration Difference
J.T. Arena et al. “Dewatering of High Salinity Brines by Osmotically Assisted Reverse Osmosis,” in Proceedings of the 2017 AWWA-AMTA Membrane Technology Conference and Exposition, February 13-17, 2017.
Water flux observed for FTS’s woven supported CTA membrane using constant concentration difference of 0.3 mol·kgH₂O
-1 between feed and sweep solutions of sodium chloride at 25°C with a feed flowrate 1.0 L·min-1, sweep flowrate of 0.5 L·min-1, and average sweep pressure ~1 bar.
PW = Purified Water
13
0.6 mol· kg-1 Bulk Concentration Difference
J.T. Arena et al. “Dewatering of High Salinity Brines by Osmotically Assisted Reverse Osmosis,” in Proceedings of the 2017 AWWA-AMTA Membrane Technology Conference and Exposition, February 13-17, 2017.
Water flux observed for FTS’s woven supported CTA membrane using constant concentration difference of 0.6 mol·kgH₂O
-1 between feed and sweep solutions of sodium chloride at 25°C with a feed flowrate 1.0 L·min-1, feed pressure of 31.0 bar, sweep flowrate of 0.5 L·min-1, and average sweep pressure ~1 bar.
14
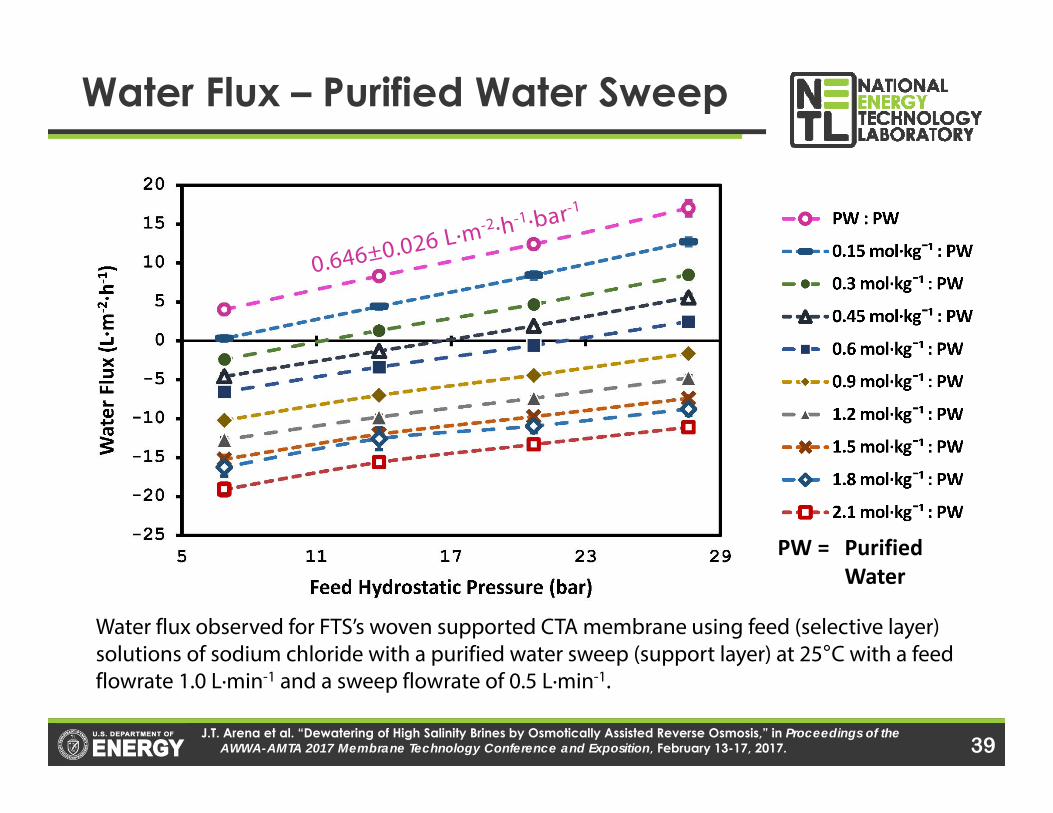
Water Flux – Purified Water Sweep
J.T. Arena et al. “Dewatering of High Salinity Brines by Osmotically Assisted Reverse Osmosis,” in Proceedings of the AWWA-AMTA 2017 Membrane Technology Conference and Exposition, February 13-17, 2017.
Water flux observed for FTS’s woven supported CTA membrane using feed (selective layer) solutions of sodium chloride with a purified water sweep (support layer) at 25°C with a feed flowrate 1.0 L·min-1, sweep flowrate of 0.5 L·min-1, and average sweep pressure ~1 bar.
PW = Purified Water
15
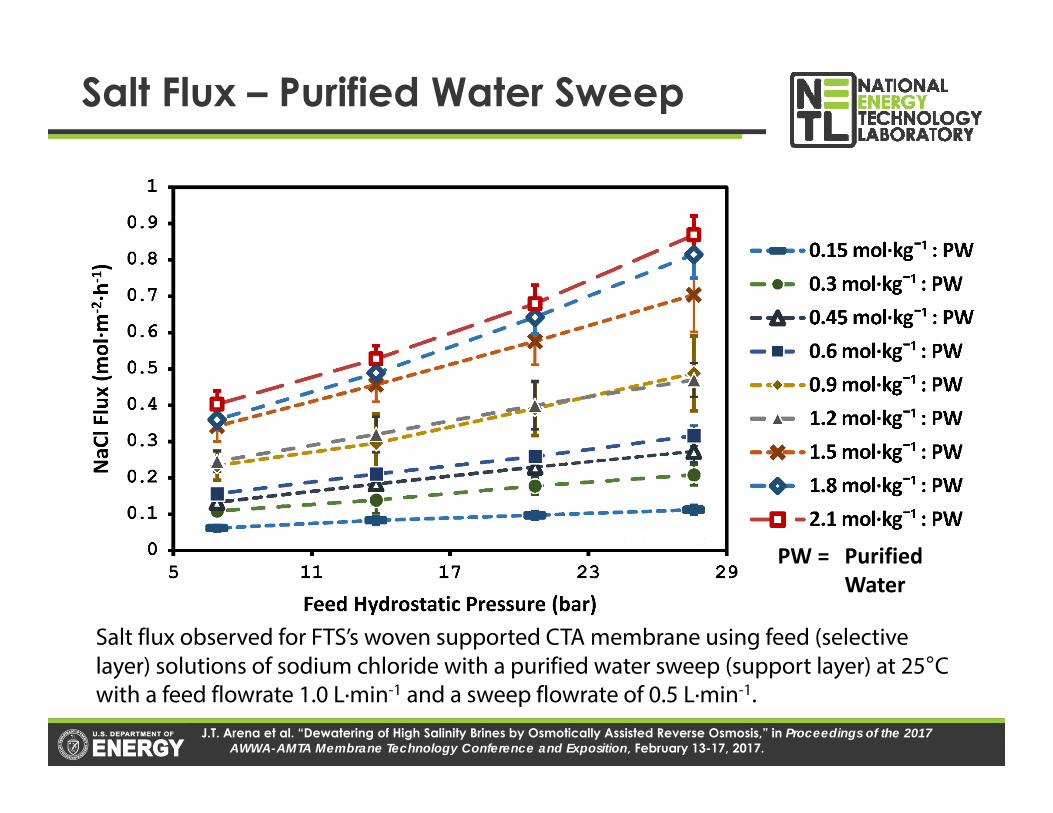
Salt Flux – Purified Water Sweep
J.T. Arena et al. “Dewatering of High Salinity Brines by Osmotically Assisted Reverse Osmosis,” in Proceedings of the 2017 AWWA-AMTA Membrane Technology Conference and Exposition, February 13-17, 2017.
Salt flux observed for FTS’s woven supported CTA membrane using feed (selective layer) solutions of sodium chloride with a purified water sweep (support layer) at 25°C with a feed flowrate 1.0 L·min-1, sweep flowrate of 0.5 L·min-1, and average sweep pressure ~1 bar.
PW = Purified Water
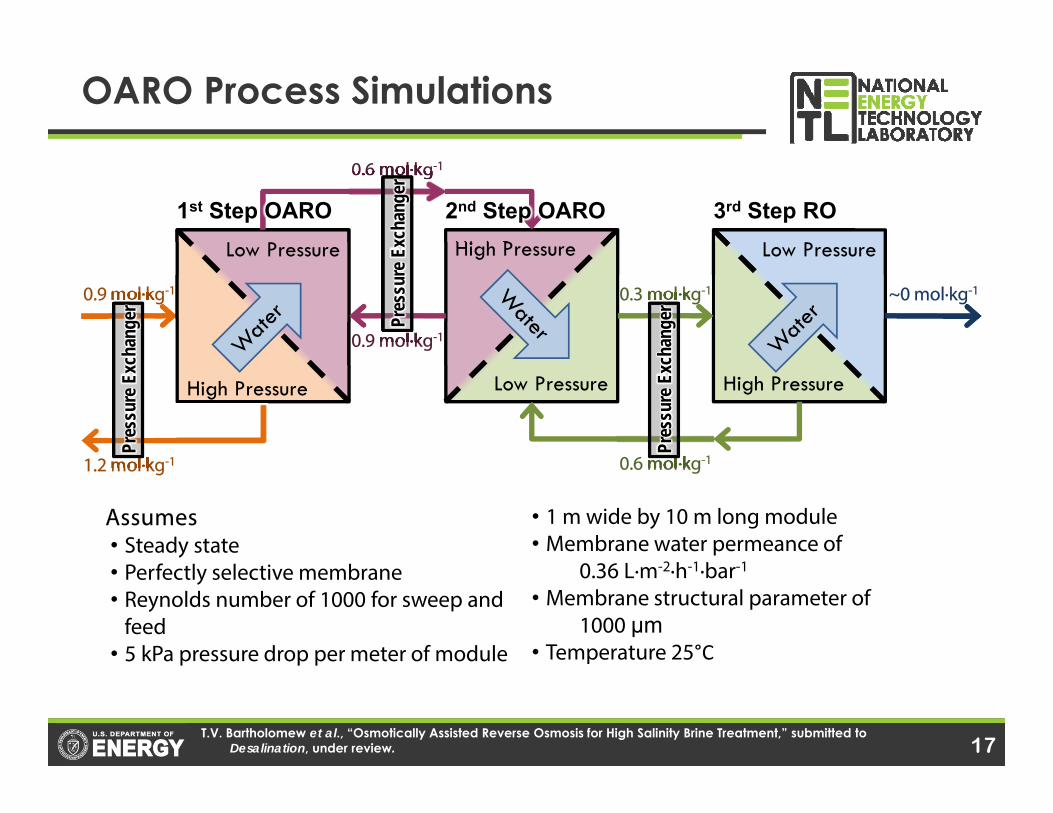
OARO Process Simulations
T.V. Bartholomew et al., “Osmotically Assisted Reverse Osmosis for High Salinity Brine Treatment,” submitted to Desalination, under review.
High Pressure
High Pressure
High Pressure
Low Pressure
Low Pressure
Low Pressure
0.6 mol·kg-1
0.6 mol·kg-11.2 mol·kg-1
0.9 mol·kg-1
0.9 mol·kg-1
~0 mol·kg-10.3 mol·kg-1
1st Step OARO 2nd Step OARO 3rd Step RO
Pres
sure
Exc
hang
er Pres
sure
Exc
hang
er
Pres
sure
Exc
hang
er
Assumes• Steady state• Perfectly selective membrane• Reynolds number of 1000 for sweep and
feed• 5 kPa pressure drop per meter of module
• 1 m wide by 10 m long module• Membrane water permeance of
0.36 L·m-2·h-1·bar-1
• Membrane structural parameter of1000 μm
• Temperature 25°C
17
Maximum water recovery for a constant feed pressure of 65 bar with variable feed concentration and sweep concentration.
Maximum water recovery for a constant feed concentration of 125 g/L with variable feed pressure and sweep concentration.
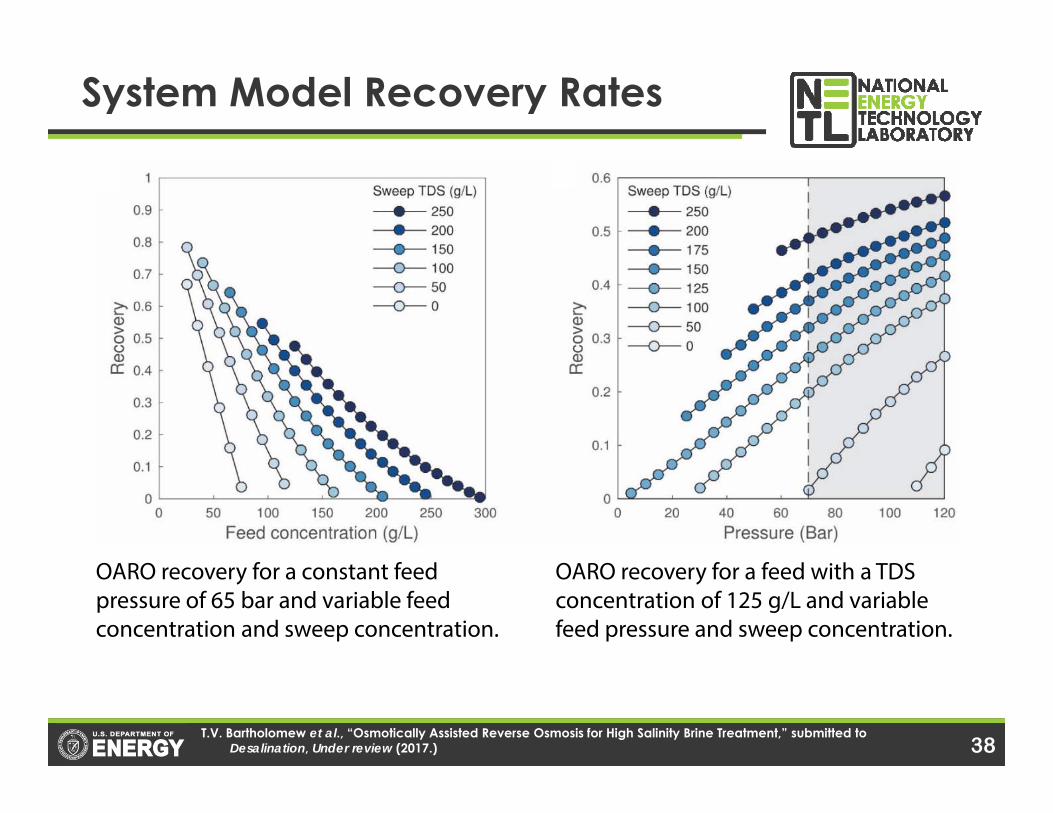
System Model Recovery Rates
T.V. Bartholomew et al., “Osmotically Assisted Reverse Osmosis for High Salinity Brine Treatment,” submitted to Desalination, Under review (2017.) 18
Sweep TDS (g/L)
Feed Pressure 65 bar
Feed TDS125 g/L
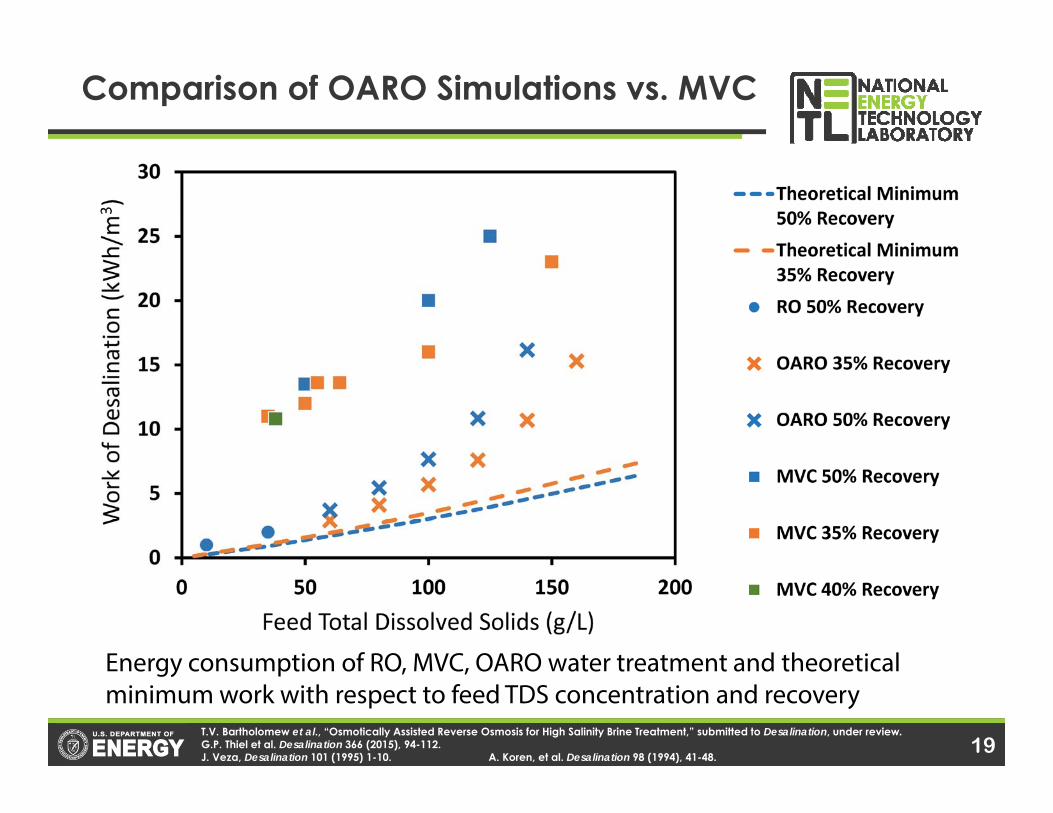
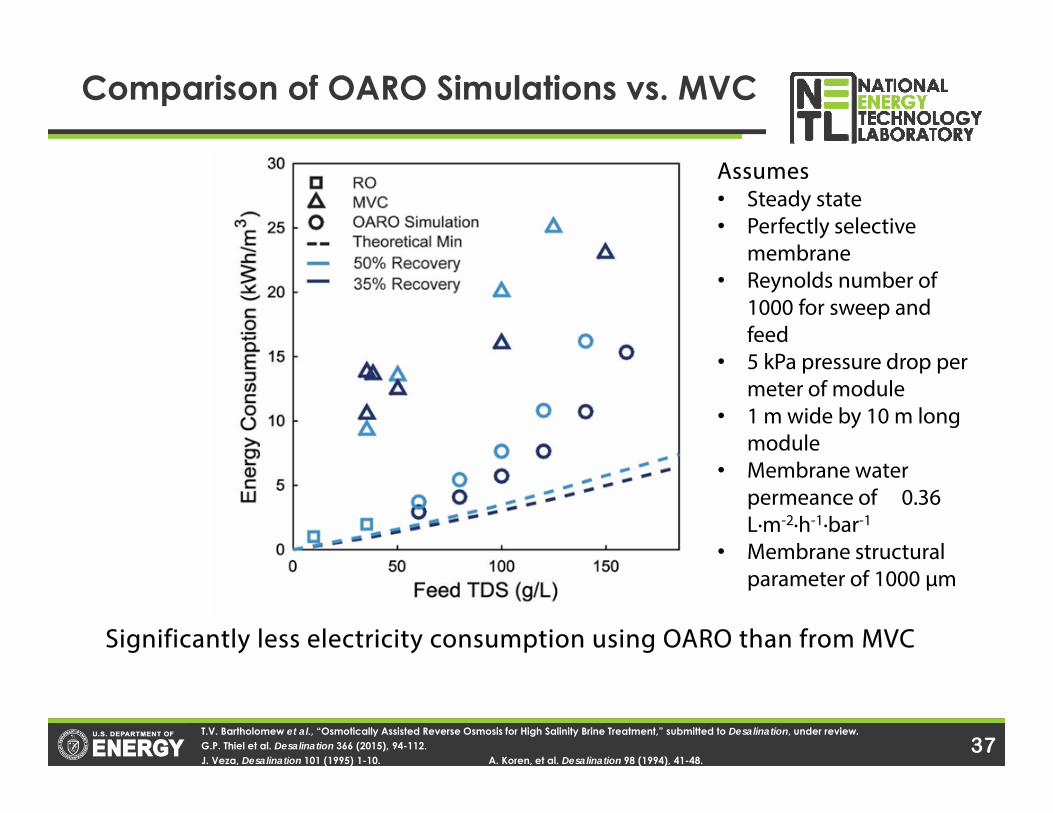
Comparison of OARO Simulations vs. MVC
T.V. Bartholomew et al., “Osmotically Assisted Reverse Osmosis for High Salinity Brine Treatment,” submitted to Desalination, under review.G.P. Thiel et al. Desalination 366 (2015), 94-112.J. Veza, Desalination 101 (1995) 1-10. A. Koren, et al. Desalination 98 (1994), 41-48.
Energy consumption of RO, MVC, OARO water treatment and theoretical minimum work with respect to feed TDS concentration and recovery
19
20
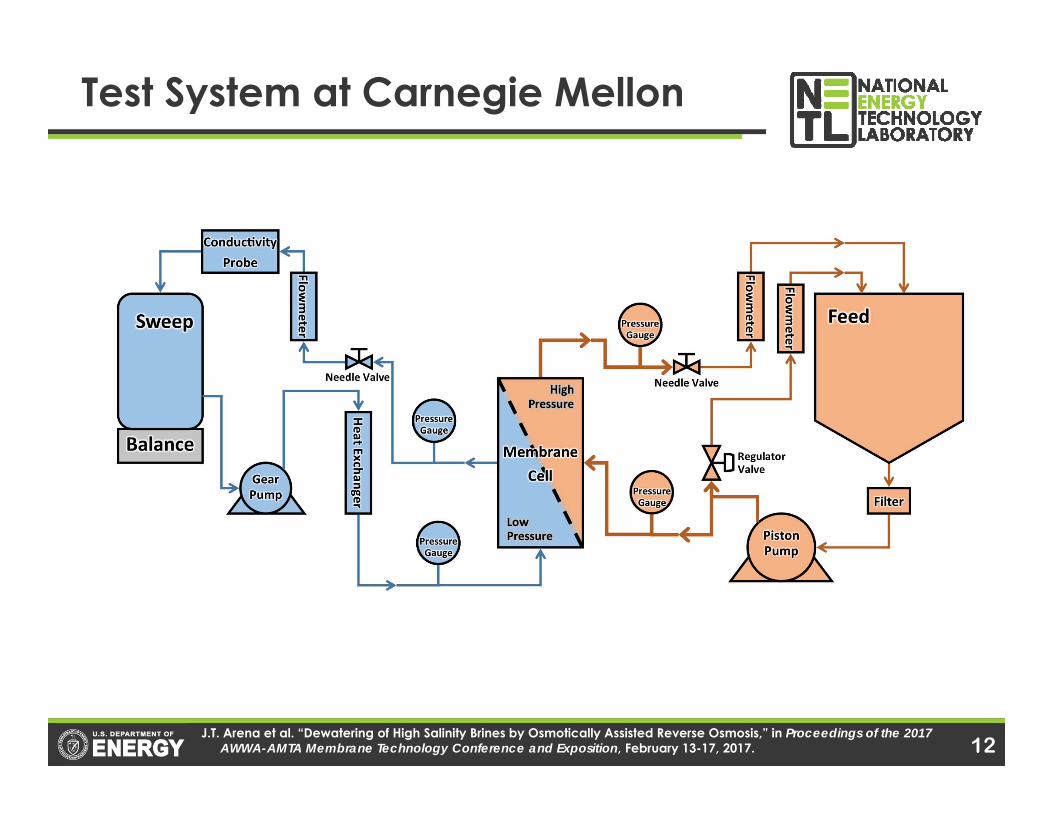
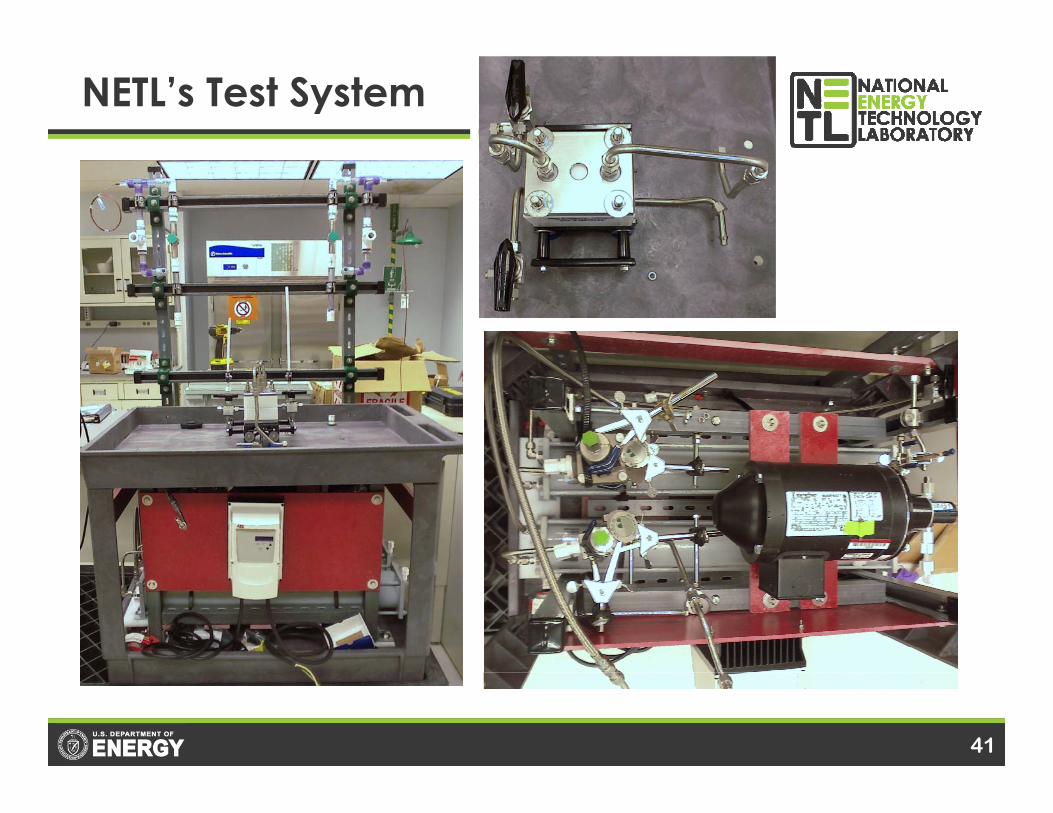
NETL’s Test System
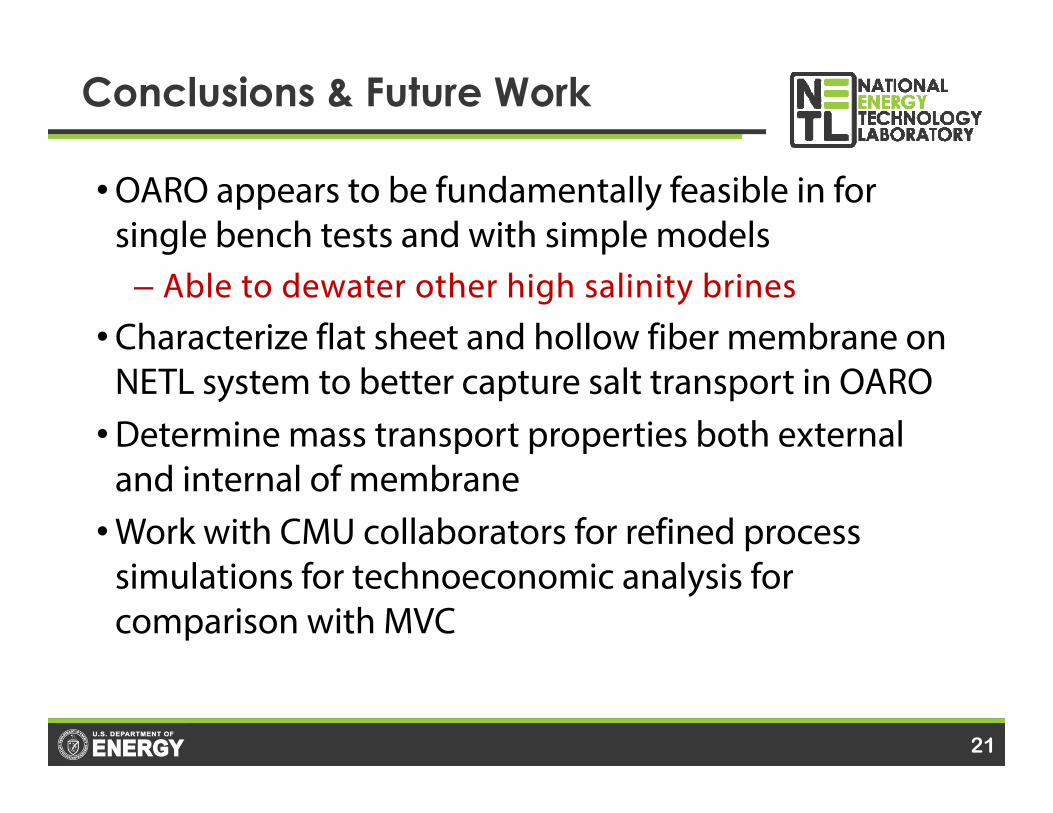
•OARO appears to be fundamentally feasible in for single bench tests and with simple models– Able to dewater other high salinity brines
•Characterize flat sheet and hollow fiber membrane on NETL system to better capture salt transport in OARO•Determine mass transport properties both external
and internal of membrane•Work with CMU collaborators for refined process
simulations for technoeconomic analysis for comparison with MVC
Conclusions & Future Work
21
• NETL Technical Support Staff– Rich Valdisera– John Midla– Bill Stile– Rocky Stoneking– John O’Connor– Mike Ciocco– Jeff Hash– Tim Murin– Jinesh Jain
• IE&WP Team Lead– Randy Gemmen
• CMU Staff– Larry Hayhurst– Cornelia Moore
• 3d Printing– Don Ferguson– Ed Robey
• NETL Project Management– Jessica Mullen– Barbara Carney– Karol Schrems– Bob Romanosky
22
Acknowledgements
Thank you for your attention.
Questions?
DisclaimerThis presentation was prepared as an account of work sponsored by an
agency of the United States Government. Neither the United States Government nor any agency thereof, nor any of their employees, makes
any warranty, express or implied, or assumes any legal liability or responsibility for the accuracy, completeness, or usefulness of any
information, apparatus, product, or process disclosed, or represents that its use would not infringe privately owned rights. Reference therein to any
specific commercial product, process, or service by trade name, trademark, manufacturer, or otherwise does not necessarily constitute or imply its endorsement, recommendation, or favoring by the United States
Government or any agency thereof. The views and opinions of authors expressed therein do not necessarily state or reflect those of the United
States Government or any agency thereof.
Governing Equations for OARO
ms,mf,s ccBJ
ms,mf,sfw cπcπPPAJ
DδJ
exp1
DSJexp
DδJexp
JB1
DSJexpc
DδJexpc
JB
DδJ
expcc fw
wfw
w
wbs,
fwbf,
w
fwbf,mf,
DSJ
exp1
DSJexp
DδJexp
JB1
DSJexpc
DδJexpc
JB
DSJ
expcc w
wfw
w
wbs,
fwbf,
w
wbs,ms,
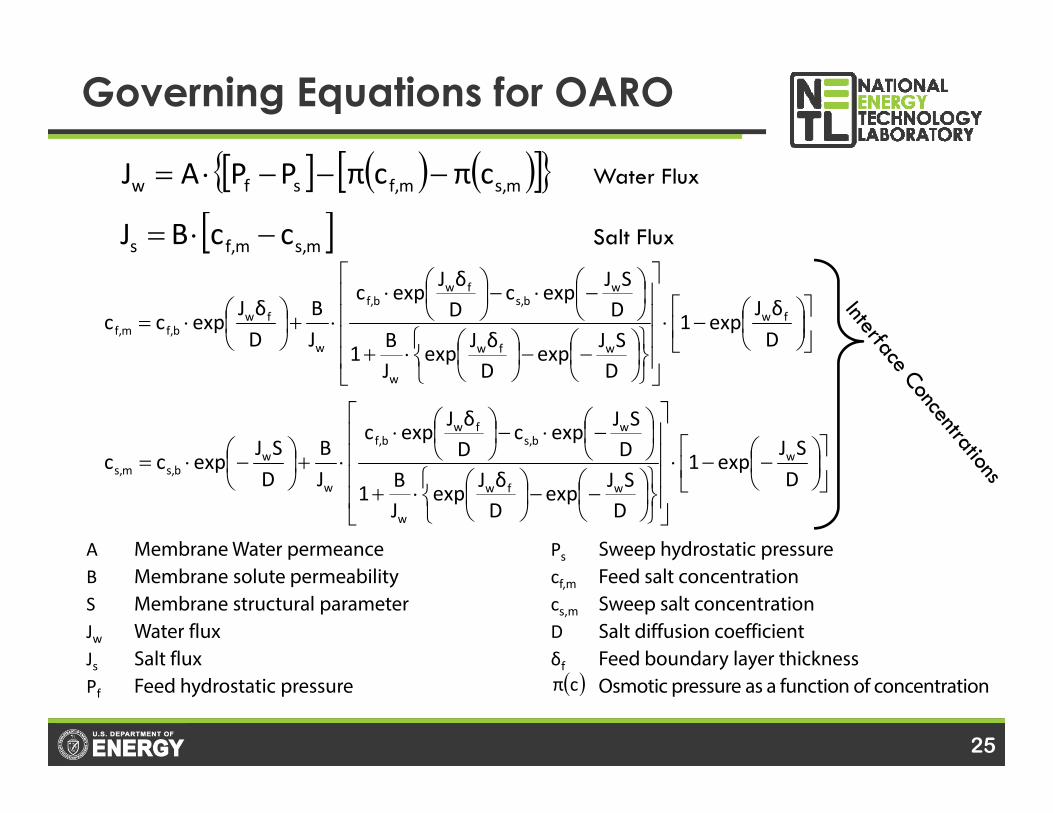
A Membrane Water permeance B Membrane solute permeabilityS Membrane structural parameterJw Water fluxJs Salt fluxPf Feed hydrostatic pressure
Ps Sweep hydrostatic pressurecf,m Feed salt concentrationcs,m Sweep salt concentrationD Salt diffusion coefficientδf Feed boundary layer thickness
Osmotic pressure as a function of concentration cπ
Water Flux
Salt Flux
25
Osmotic Pressure of Brines
K. Michael et al. Int. J. Greenhouse Gas Control 4 (2010) 659-667. R. M. Dilmore et al. Environ. Sci. Technol. 42 (2008) 2760-2766.K.G. Knauss et al. Chem. Geol. 217 (2005) 339-350. W.J. Hamer and Y.C. Wu, J. Phys. Chem. Ref. Data 1 (1972) 1047-1100. B. Sass et al. Proc. 4th Int. Conf. on Greenhouse Gas Control Technologies, 1998, 1079-1088. J. Lu et al. Chem. Geol. 291 (2012) 269-277.
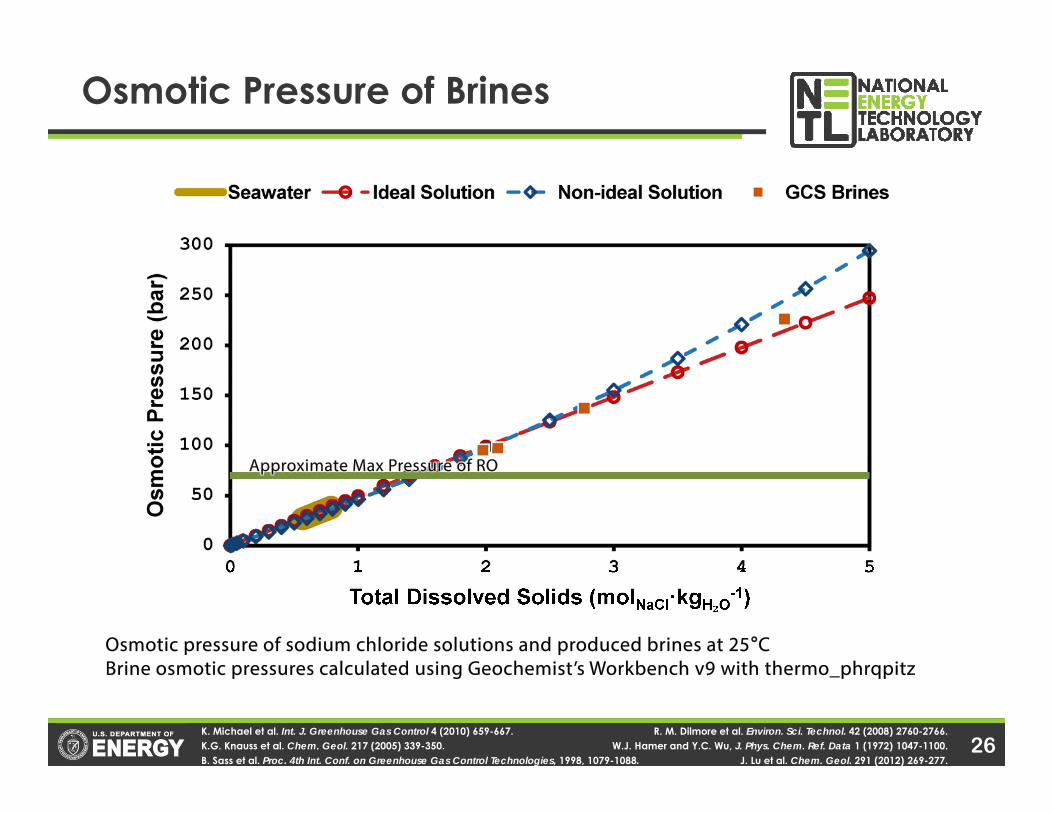
Osmotic pressure of sodium chloride solutions and produced brines at 25°CBrine osmotic pressures calculated using Geochemist’s Workbench v9 with thermo_phrqpitz
Approximate Max Pressure of RO
26
Dual-mode Extraction/Injection Wells
T.A. Buscheck et al. “Reservoir Pressure Management,” Presented at 2014 Clean Energy Workshop, Taiyuan, PRC, August 2014.
Phase 2-CO2 Storage• Pre-injection brine extraction well is converted to a CO2 injection well• New brine extraction well is put into operation with processing facility and
new brine injection well• A monitoring well may be completed in an overlying formation to assess
possible seal leakage
27
Approximate Osmotic Pressure of Saturated NaCl @ 20ºC
Osmotic pressure of an NH3-CO2 draw solution at 20ºC
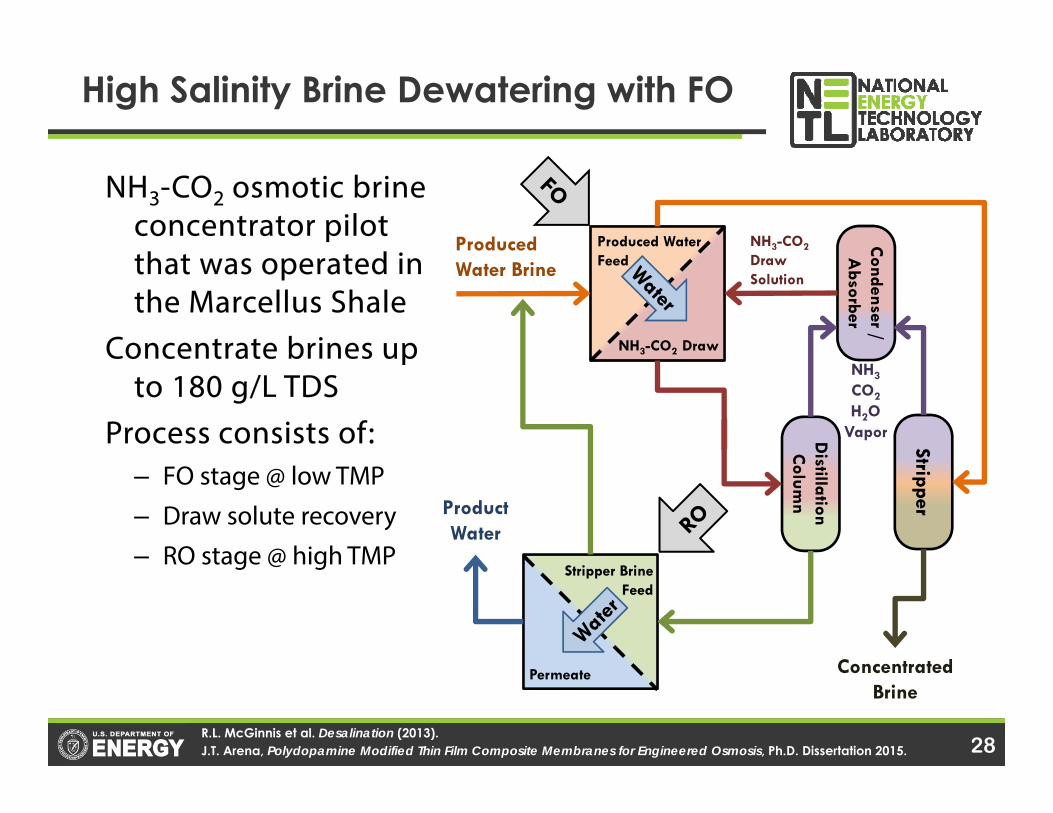
High Salinity Brine Dewatering with FO
NH3-CO2 osmotic brine concentrator pilot that was operated in the Marcellus Shale
Concentrate brines up to 180 g/L TDS
Process consists of: – FO stage @ low TMP– Draw solute recovery– RO stage @ high TMP
R.L. McGinnis et al. Desalination (2013).J.T. Arena, Polydopamine Modified Thin Film Composite Membranes for Engineered Osmosis, Ph.D. Dissertation 2015.
Distillation C
olumn
Stripper
Condenser / A
bsorber
Produced Water Feed
NH3-CO2 Draw
Stripper Brine Feed
Product Water
Permeate Concentrated Brine
Produced Water Brine
NH3-CO2Draw Solution
NH3
CO2H2O
Vapor
28
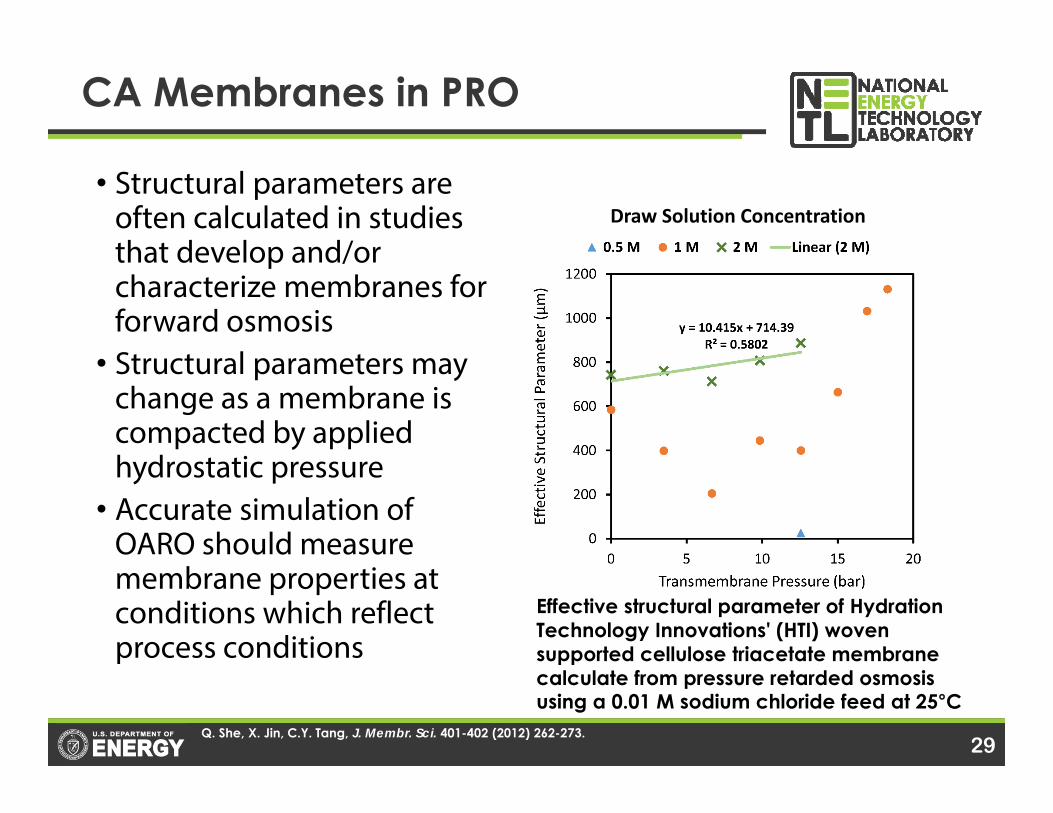
• Structural parameters are often calculated in studies that develop and/or characterize membranes for forward osmosis
• Structural parameters may change as a membrane is compacted by applied hydrostatic pressure
• Accurate simulation of OARO should measure membrane properties at conditions which reflect process conditions
Effective structural parameter of Hydration Technology Innovations' (HTI) woven supported cellulose triacetate membrane calculate from pressure retarded osmosis using a 0.01 M sodium chloride feed at 25°C
Draw Solution Concentration
29
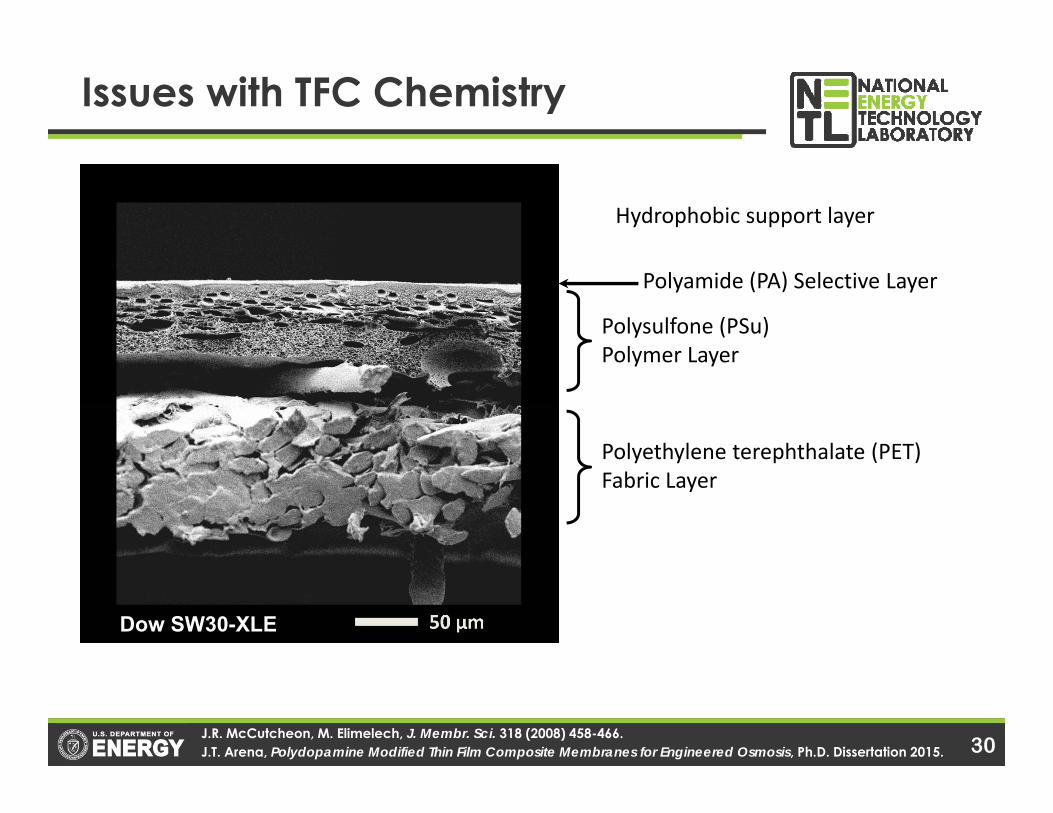
Issues with TFC Chemistry
J.R. McCutcheon, M. Elimelech, J. Membr. Sci. 318 (2008) 458-466.J.T. Arena, Polydopamine Modified Thin Film Composite Membranes for Engineered Osmosis, Ph.D. Dissertation 2015.
1.5 M NaCl Draw, DI Feed, PRO Mode1.5 M NaCl Draw, 1mM SDS in DI Feed, PRO Mode
Polyethylene terephthalate (PET) Fabric Layer
Polysulfone (PSu)Polymer Layer
Polyamide (PA) Selective Layer
Hydrophobic support layer
Dow SW30-XLE
30
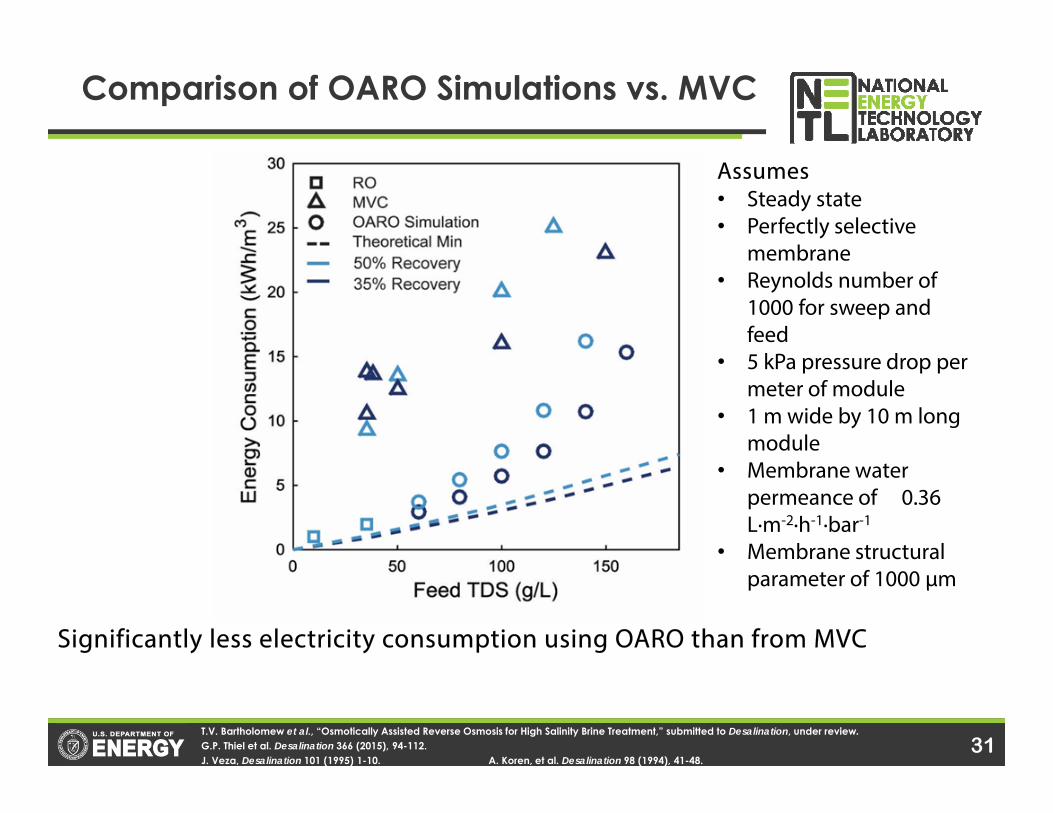
Comparison of OARO Simulations vs. MVC
T.V. Bartholomew et al., “Osmotically Assisted Reverse Osmosis for High Salinity Brine Treatment,” submitted to Desalination, under review.G.P. Thiel et al. Desalination 366 (2015), 94-112.J. Veza, Desalination 101 (1995) 1-10. A. Koren, et al. Desalination 98 (1994), 41-48.
Significantly less electricity consumption using OARO than from MVC
High Pressure
High Pressure
High Pressure
Low Pressure
Low Pressure
Low Pressure
0.6 mol·kg-1
0.6 mol·kg-11.2 mol·kg-1
0.9 mol·kg-1
0.9 mol·kg-1
~0 mol·kg-10.3 mol·kg-1
1st Stage OARO 2nd Stage OARO 3rd Stage RO
Pres
sure
Exc
hang
er Pres
sure
Exc
hang
er
Pres
sure
Exc
hang
er
Assumes• Steady state• Perfectly selective
membrane• Reynolds number of
1000 for sweep and feed
• 5 kPa pressure drop per meter of module
• 1 m wide by 10 m long module
• Membrane water permeance of 0.36 L·m-2·h-1·bar-1
• Membrane structural parameter of 1000 μm
31
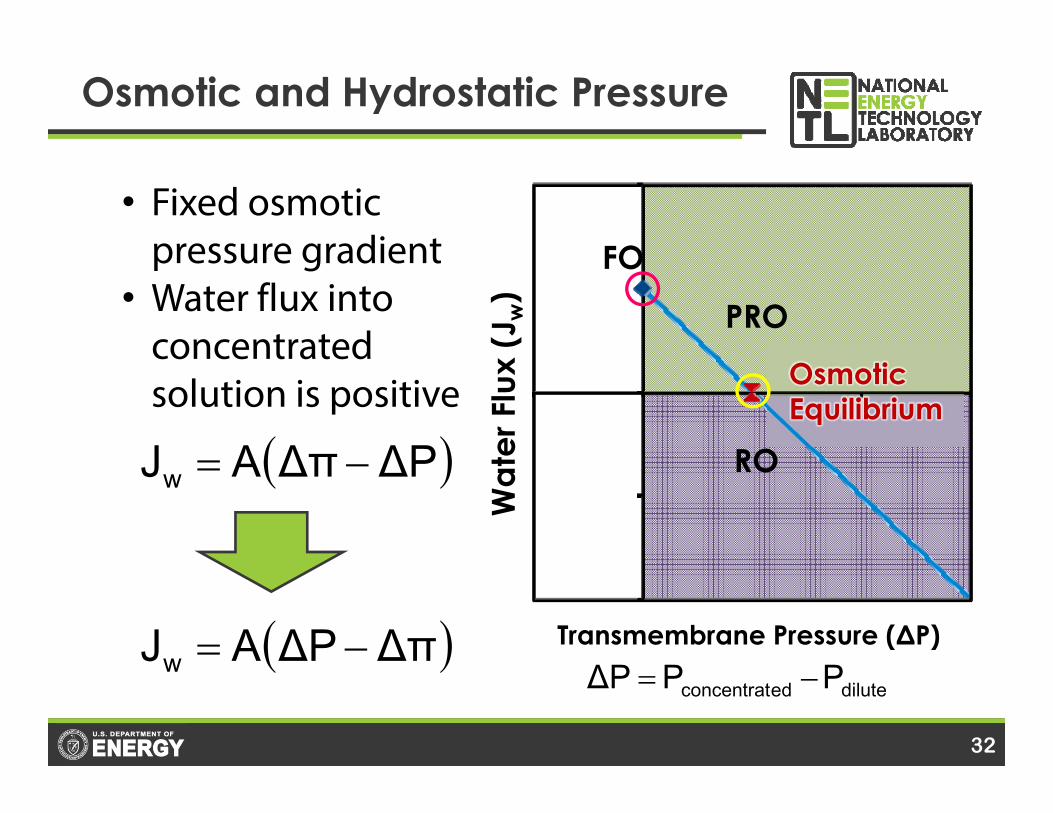
Osmotic and Hydrostatic Pressure
Wat
er F
lux
(Jw)
Transmembrane Pressure (ΔP)
• Fixed osmotic pressure gradient
• Water flux into concentrated solution is positive
diluteedconcentrat PPΔP
ΔPΔπAJw
PRO
RO
FO
Osmotic Equilibrium
ΔπΔPAJw
32
• Brine Concentration > Sea water (TDS ~ 35 g/L)• Limited by mechanical stability of membrane • Water recovery of brines > 85 g/L TDS is negligible for a 1200 psi
membrane
Prior Study of RO on GCS Brines
R.D. Aines et al. Energy Procedia 4 (2011) 2269-2276. W.L. Bourcier et al. Int. J. Greenhouse Gas Control 5 (2011) 1319-1328.
Comparison of maximum water recovery using RO comparing seawater (a) and a 86 g/L brine (b) from a CO2 sequestration site in Wyoming
33
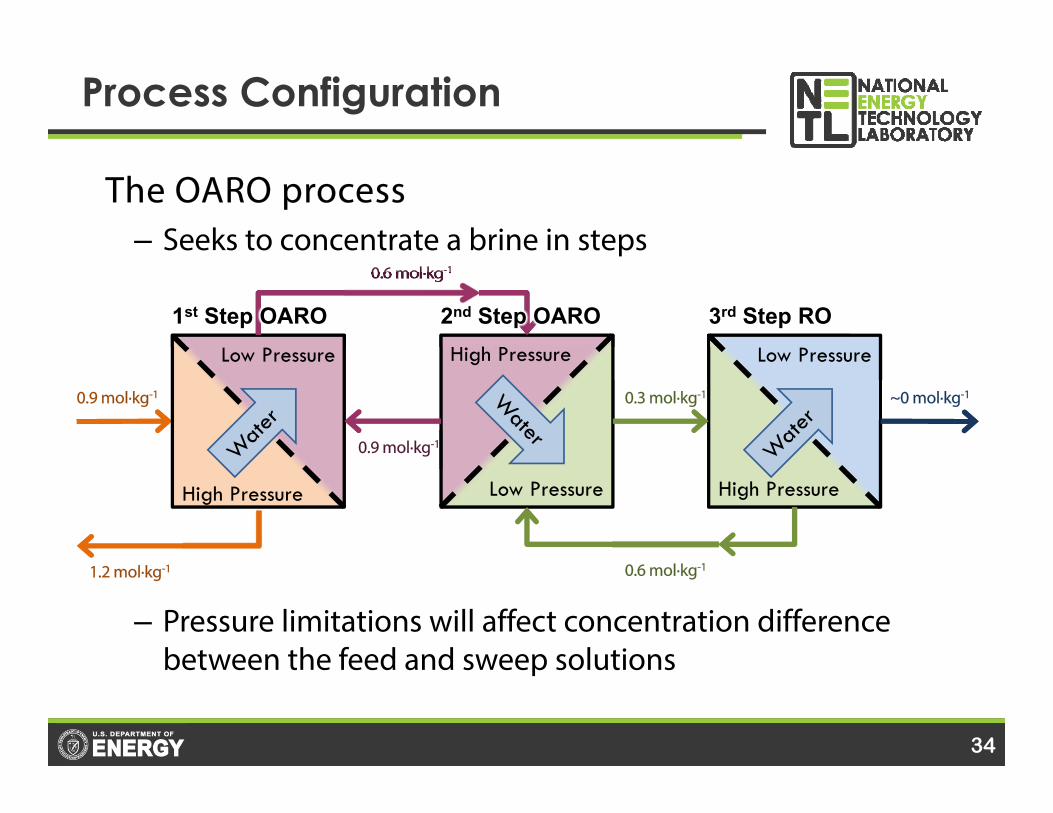
Process Configuration
The OARO process– Seeks to concentrate a brine in steps
– Pressure limitations will affect concentration difference between the feed and sweep solutions
High Pressure
High Pressure
High Pressure
Low Pressure
Low Pressure
Low Pressure
0.6 mol·kg-1
0.6 mol·kg-11.2 mol·kg-1
0.9 mol·kg-1
0.9 mol·kg-1
~0 mol·kg-10.3 mol·kg-1
1st Step OARO 2nd Step OARO 3rd Step RO
34
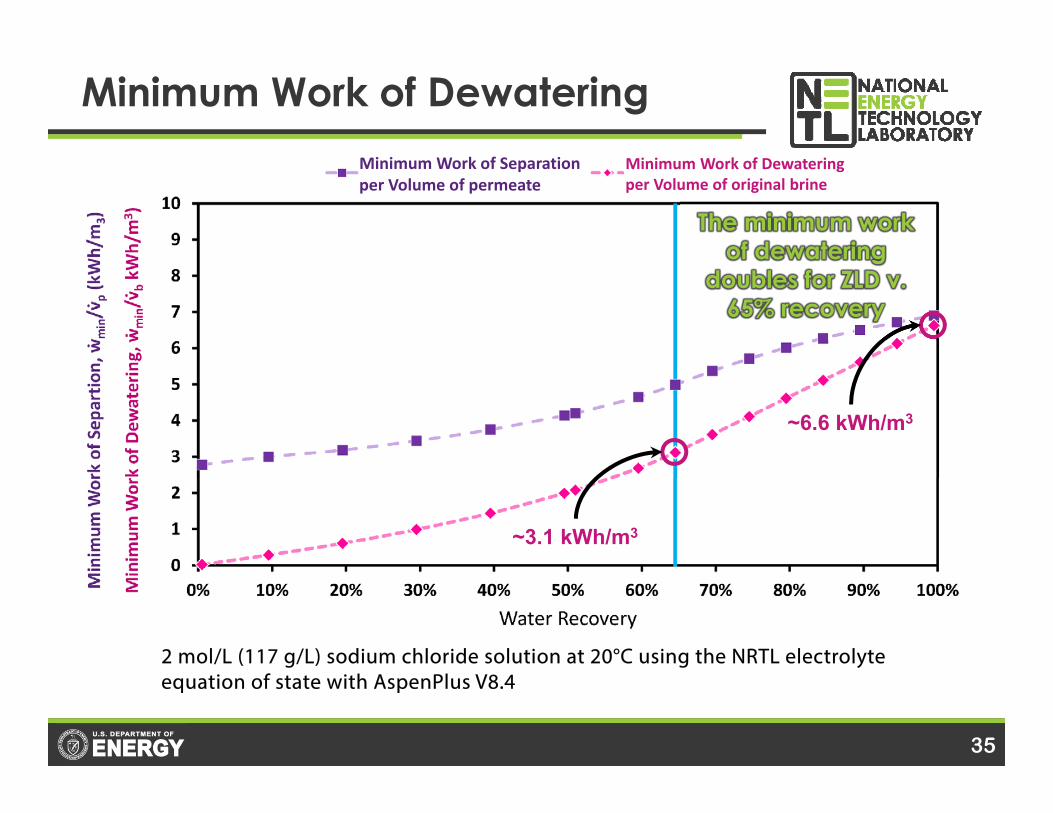
Minimum Work of Dewatering
2 mol/L (117 g/L) sodium chloride solution at 20°C using the NRTL electrolyte equation of state with AspenPlus V8.4
Minimum Work of Separationper Volume of permeate
Minimum Work of Dewateringper Volume of original brine
~3.1 kWh/m3
~6.6 kWh/m3
The minimum work of dewatering
doubles for ZLD v. 65% recovery
35
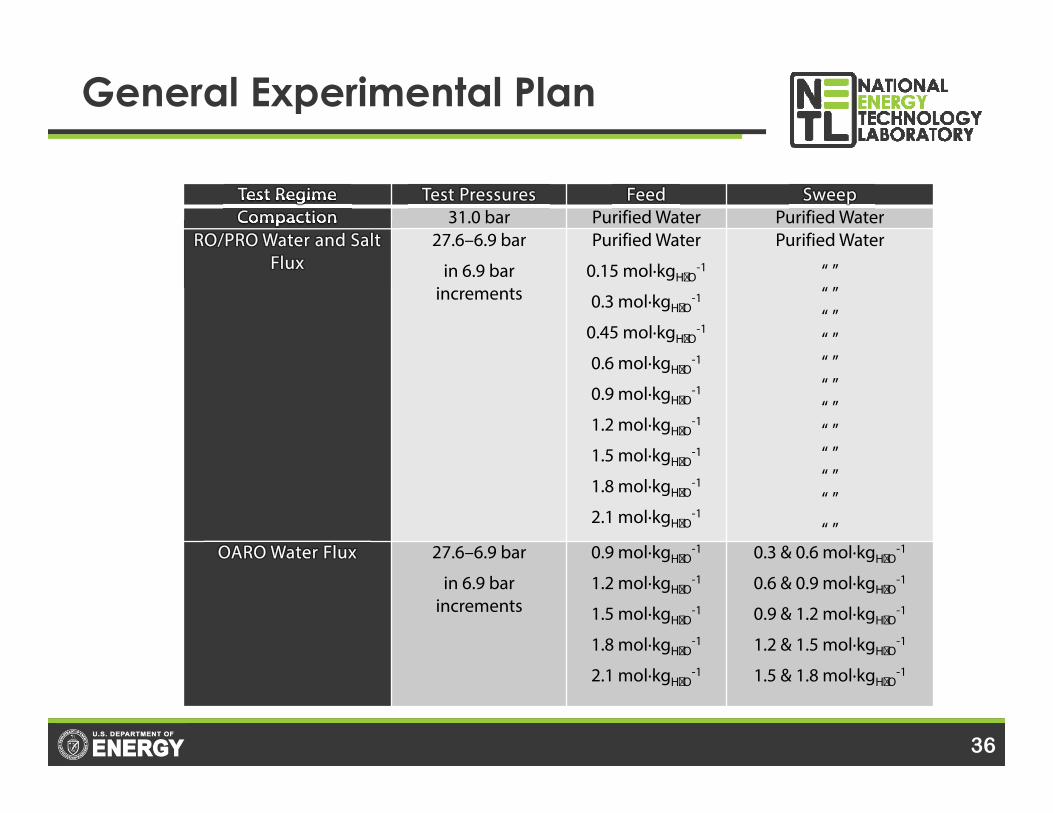
General Experimental Plan
2 primary partsMembrane benchmark study– Measure RO/PRO water flux
OARO performance study– Pressure v. flux at approximately constant ₂π
Test Regime Test Pressures Feed Sweep Compaction 31.0 bar Purified Water Purified Water
RO/PRO Water and Salt Flux
27.6–6.9 bar
in 6.9 bar increments
Purified Water
0.15 mol·kgH₂O-1
0.3 mol·kgH₂O-1
0.45 mol·kgH₂O-1
0.6 mol·kgH₂O-1
0.9 mol·kgH₂O-1
1.2 mol·kgH₂O-1
1.5 mol·kgH₂O-1
1.8 mol·kgH₂O-1
2.1 mol·kgH₂O-1
Purified Water
“ ”“ ”“ ”“ ”“ ”“ ”“ ”“ ”“ ”“ ”“ ”
“ ”OARO Water Flux 27.6–6.9 bar
in 6.9 bar increments
0.9 mol·kgH₂O-1
1.2 mol·kgH₂O-1
1.5 mol·kgH₂O-1
1.8 mol·kgH₂O-1
2.1 mol·kgH₂O-1
0.3 & 0.6 mol·kgH₂O-1
0.6 & 0.9 mol·kgH₂O-1
0.9 & 1.2 mol·kgH₂O-1
1.2 & 1.5 mol·kgH₂O-1
1.5 & 1.8 mol·kgH₂O-1
36
Comparison of OARO Simulations vs. MVC
T.V. Bartholomew et al., “Osmotically Assisted Reverse Osmosis for High Salinity Brine Treatment,” submitted to Desalination, under review.G.P. Thiel et al. Desalination 366 (2015), 94-112.J. Veza, Desalination 101 (1995) 1-10. A. Koren, et al. Desalination 98 (1994), 41-48.
Significantly less electricity consumption using OARO than from MVC
Assumes• Steady state• Perfectly selective
membrane• Reynolds number of
1000 for sweep and feed
• 5 kPa pressure drop per meter of module
• 1 m wide by 10 m long module
• Membrane water permeance of 0.36 L·m-2·h-1·bar-1
• Membrane structural parameter of 1000 μm
37
OARO recovery for a constant feed pressure of 65 bar and variable feed concentration and sweep concentration.
OARO recovery for a feed with a TDS concentration of 125 g/L and variable feed pressure and sweep concentration.
System Model Recovery Rates
T.V. Bartholomew et al., “Osmotically Assisted Reverse Osmosis for High Salinity Brine Treatment,” submitted to Desalination, Under review (2017.) 38
Water Flux – Purified Water Sweep
J.T. Arena et al. “Dewatering of High Salinity Brines by Osmotically Assisted Reverse Osmosis,” in Proceedings of the AWWA-AMTA 2017 Membrane Technology Conference and Exposition, February 13-17, 2017.
Water flux observed for FTS’s woven supported CTA membrane using feed (selective layer) solutions of sodium chloride with a purified water sweep (support layer) at 25°C with a feed flowrate 1.0 L·min-1 and a sweep flowrate of 0.5 L·min-1.
PW = Purified Water
39
Salt Flux – Purified Water Sweep
J.T. Arena et al. “Dewatering of High Salinity Brines by Osmotically Assisted Reverse Osmosis,” in Proceedings of the 2017 AWWA-AMTA Membrane Technology Conference and Exposition, February 13-17, 2017.
Salt flux observed for FTS’s woven supported CTA membrane using feed (selective layer) solutions of sodium chloride with a purified water sweep (support layer) at 25°C with a feed flowrate 1.0 L·min-1 and a sweep flowrate of 0.5 L·min-1.