DG ENERGY FRAMEWORK SERVICE CONTRACT SRD MOVE/ENER/SRD.1/2012-409-LOT 3-COWI COWI CONSORTIUM COWI BELGIUM AV. DE TERVUEREN 13-B B-1040 BRUSSELS BELGIUM TEL +32 2 511 2383 FAX +32 2 511 3881 WWW.COWI.COM EUROPEAN COMMISSION DG ENERGY IMPACT ASSESSMENT STUDY ON DOWNSTREAM FLEXIBILITY, PRICE FLEXIBILITY, DEMAND RESPONSE & SMART METERING FINAL REPORT REQUEST NUMBER: ENER/B3/2015-641 JULY 2016
Transcript
DG ENERGY
FRAMEWORK SERVICE CONTRACT SRD MOVE/ENER/SRD.1/2012-409-LOT 3-COWI
COWI CONSORTIUM COWI BELGIUM AV. DE TERVUEREN 13-B B-1040 BRUSSELS
1 EURELECTRIC, Everything you always wanted to know about demand response, 2015.
2 FINAL REPORT
Problems and objectives
The EU's electricity sector needs more flexibility to enable it to accommodate the
significant growth in variable/inflexible RES that will account for an increasing
share of the electricity generation. Failure to create flexibility will lead to
significant curtailment of RES and/or increased generation and network costs.
Demand response is the most immediately available way of increasing the
flexibility and may actually be the cheapest flexibility option compared with other
options including flexible generation, storage and better interconnection. It is
therefore a key element in EU's energy policy to increase flexibility.
Though there have been steps to promote demand response, for example through
third energy package of 2009, there are still barriers for utilising more of the
demand response potential. The objective of the study is to assess these barriers
and the impacts of alternative options to overcome the barriers.
Market failures that may impede demand response include weak competition as a
key element. Though the liberalisation is in progress, there are still links between
the generator and the suppliers. In many countries, there are one or very few
dominant suppliers who may have limited interest in facilitating demand response.
The assessment of the current situation has identified many barriers for demand
response to overcome. They can be grouped into the following categories:
Consumer's ability to react (meters, tariff structure and knowledge)
Market design and regulation (access rules and incentives)
To overcome these barriers, the following policy options have been defined:
Option 1: Demand response is promoted by legislation that gives all EU
consumers a right to demand access to smart meters and dynamic pricing
contracts.
Option 2: Demand response is promoted by legislation as under Option 1
and standardised EU market rules are established for demand response
service providers.
Option 3: As Option 2 but where the demand response service provider has
the right to offer its services without compensation to the retailer/BRP.
The study has assessed the impacts of these alternative policy options and of the
business as usual situation.
Assessment of impacts
The assessment of the impacts of the alternative policy options is very complex
given that many factors are in play. Key factors include future technological
developments in home automation and storage, developments on the energy
markets, as well as the situation in each Member State regarding the details of
electricity market design and regulation.
STUDY ON DOWNSTREAM FLEXIBILITY, PRICE FLEXIBILITY, DEMAND RESPONSE & SMART METERING
3
The approach to the assessment of the policy options has included the following
elements:
Assessment of a theoretical potential for demand response
Assessment of the current level of demand response
Assessment of how each option is likely to increase the share of the
theoretical potential being realised
Estimation of the costs and benefits of the options
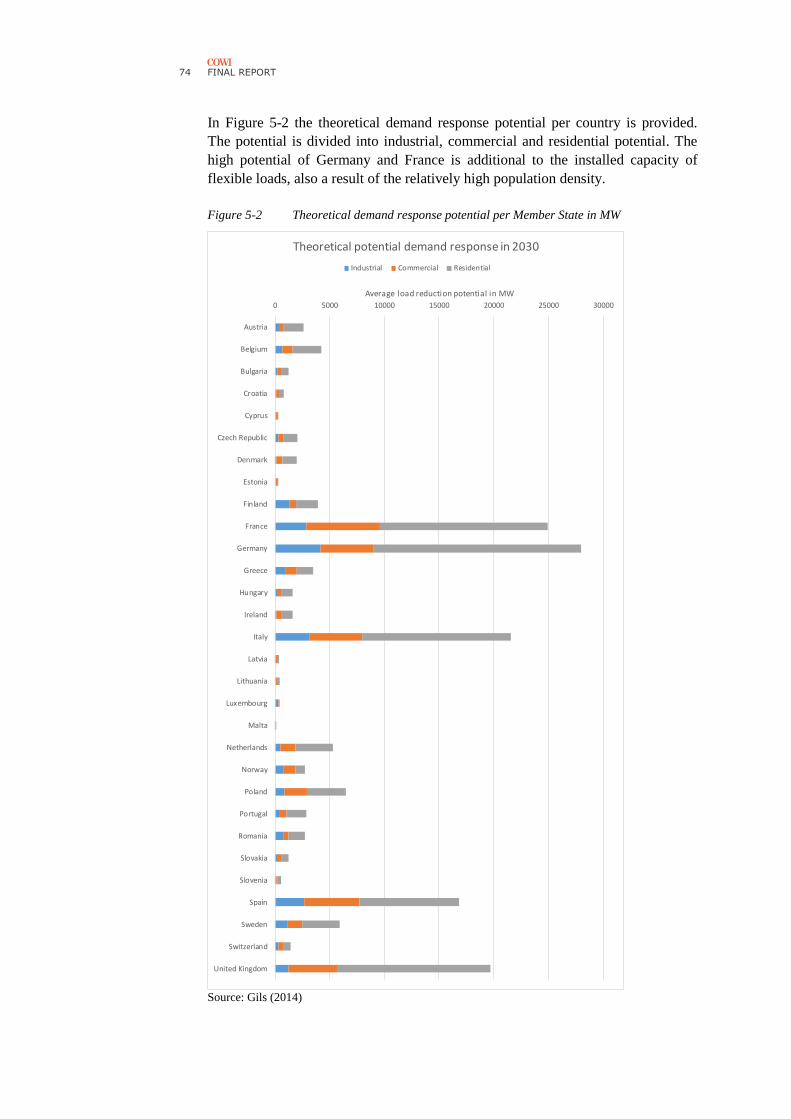
The theoretical potential is based on an assessment of the nature of the electricity
use by industrial, commercial and residential consumers and represents the
maximum potential for shifting demand. The theoretical potential reflects the
potential shift in demand (load shifting, peak shaving and valley filing). However,
it is assumed that total demand will be unchanged.
Through a review of studies and data on the current volume of demand response,
an estimate of the current level of EU wide demand response has been made, which
is used as the basis for the BAU path up to 2030. Table 1 presents the key
assumptions on the theoretical demand response potential and how much is
activated under the BAU measures in terms of capacity and in percentage of peak
load.
Table 1 Theoretical potentials, peak load and BAU estimates (GW)
Capacities 2016 2020 2030
Peak load (current and estimated) 486 500 568
Total maximum theoretical DR potential 110 120 160
In % of peak load 22% 24% 28%
BAU 21 23 34
In % of peak load 4.3% 4.6% 6.0%
Source: Own calculations based on Gils (2014) and Entso-E
Based on the experience in the Member States with demand response, the impacts
of the options on the volume of demand response they will activate is estimated.
Key elements include:
Price based demand response (Option 1)2: This assumes a limited
additional uptake of meters and dynamic price contracts. The proportion of
consumers with smart meters rises from BAU values of 71% in 2020 and
74% in 2030 to 81% in 2030 under Option 1. A parallel increase in the
take-up of dynamic price contracts leads to an overall increase in the
demand response for all consumers.
2 Option 2 and 3 include the same price based demand response as Option 1
4 FINAL REPORT
Incentive based demand response (Option 2 and 3): Options 2 and 3 are
about allowing incentive based demand response by defining standardised
rules for how demand response can enter the different energy,
capacity/balancing markets and grid management services.
o Wholesale markets:
ensure that demand participates at a level playing field with
generation through BRP
reduce the market resolution (i.e. from hourly to 15 minutes or
less)
move market closure closer to the operation hour
extend the number of bidding possibilities to take account of
the wider range of heterogeneity on the demand-side
o Balancing markets:
Reduce minimum bid volumes to allow for smaller loads to
participate or allow aggregation of smaller, dispersed volumes
Adjust bid duration, recovery time, response time, etc. to fit
the demand side
Set up standard processes and settlement between aggregators
and suppliers
Introduce shorter-term procurement reducing the risks for grid
users
Allow for procurement on all voltage levels
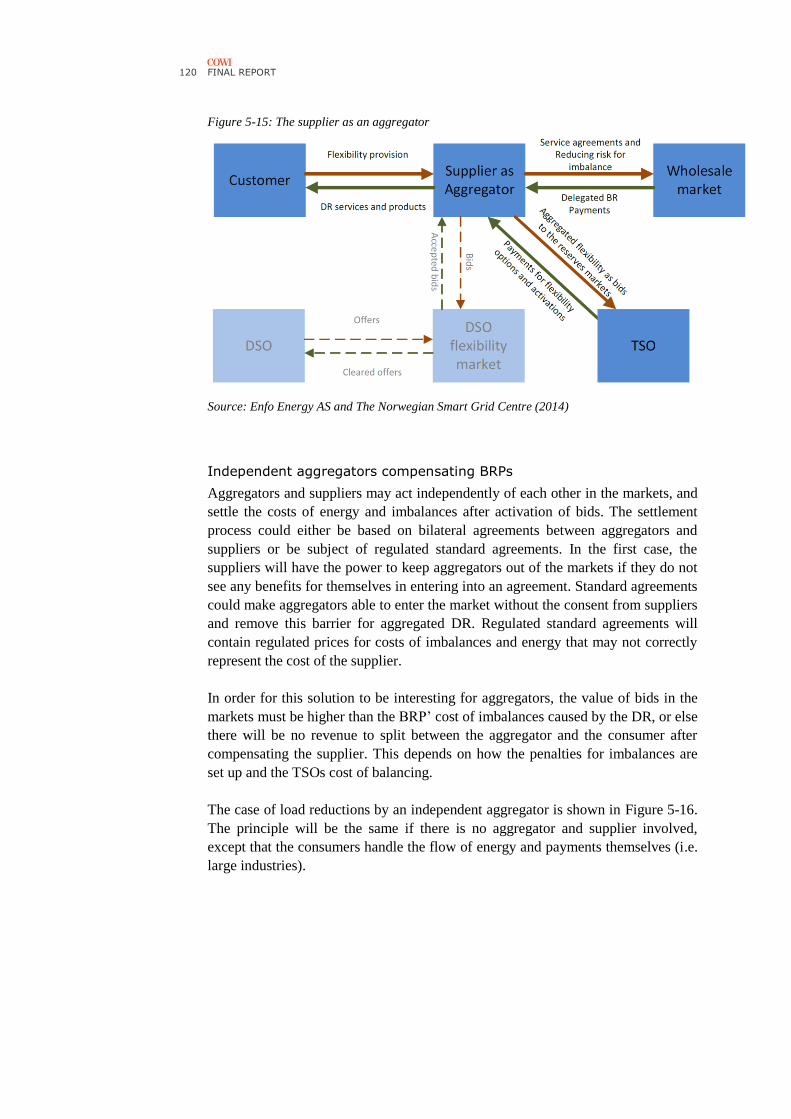
The interference between the retailer (BRP) and the aggregator is handled
in one of these manners:
o The suppliers (with BRP) integrate aggregated DR as part of their
service offering and the suppler and aggregator operate in a single
portifolio
o Aggregator and BRP are not operating in the same portfolio. Their
activities are thus clearly split, either through standard contract
procedures and agreements or by the aggregator taking on a second
balance responsibility for activated loads
o The aggregator operates independently from balancing responsibility
without any compensation to the BRP
The assessment considers each of the models for compensation and while in the
long term integration of BRP and aggregator would provide coherent incentives
within the EU target model, it requires that there is no vertical market integration
between generators and suppliers to provide a level playing field between the
demand and generation side. Hence, the second model is likely to be more feasible,
and this is also recommended by ACER. The third option does not ensure a level
playing field nor fair competition rules between the supplier and the aggregator
since the responsibilities and awards are not equally divided between the parties.
The results of the assessments are presented in Table 2.
STUDY ON DOWNSTREAM FLEXIBILITY, PRICE FLEXIBILITY, DEMAND RESPONSE & SMART METERING
5
Table 2 Estimated demand response of the alternative policy options (GW)
Capacities 2016 2020 2030
Price based 5.8 6.4 15.4
Incentive based 15.6 16.3 19.0
BAU 21.4 22.7 34.4
Price based 5.8 6.9 17.9
Incentive based 15.6 16.3 19.0
Option 1 21.4 23.3 36.8
Price based 5.8 6.9 17.9
Incentive based 15.6 20.3 34.6
Option 2 21.4 27.2 52.4
Price based 5.8 6.9 17.9
Incentive based 15.6 21.4 39.3
Option 3 21.4 28.4 57.1
These estimated levels are subject to large uncertainty given all the factors that
influence the activation of demand response. The overall level of 50 GW of
demand response is in line with reviewed studies and expert estimates.
Factors that could influence the above estimates are:
Smart appliances/home automation: a more accelerated development might
increase demand response
Electricity price development: The above estimates are not based on
specific modelling of the markets. They are based on the level of
experiences seen in the most advanced markets. The price differences
between peak and off peak loads are the main incentive for demand
response. Greater RES capacity combined with existing power plants
becoming obsolete etc. could increase the price differentials and thereby
increase the market value and eventual activation of demand response.
Price development for balancing and capacity services: This has not been
modelled, but is likely to rise with an increasing share of intermittent RES.
However, a more efficient market design and a standardisation of rules
between MS may limit price developments for these services.
The price development of electricity and balancing/ capacity services may also be a
stronger driver than the policy options themselves, meaning the volume of demand
response of option 3 may be reached by the policies in option 2 in the case of high
prices. Option 3 gives the best business opportunity for aggregators, everything
else equal. But aggregation can just as well be profitable in policy option 2 if the
value of flexibility increases over time.
The cost and benefits of the options have been estimated. The costs are defined as
the activation costs for the different consumption elements (e.g. industrial cooling,
residential heating etc.). The costs increases with level of demand response being
6 FINAL REPORT
activated. The benefits are determined as the reduced need for back-up capacity.
BA yearly load curve for EU28 is computed and the effects of demand response in
smoothing the curve is estimated. Then, the effects on the need for peak load
capacity has been estimated. Additionally, the effects on the transmission and
distribution network – lower capacity - are added to the benefits of reduced peak
generation.
The results of the assessment of the costs and benefits are summarised below.
Table 3 Costs and benefits of policy options for 2030
MEUR/y Costs Benefits Net benefit
Network Generation Total
BAU 82 980 3,517 4,497 4,415
Option 1 303 1,068 3,772 4,840 4,537
Option 2 322 1,383 4,588 5,971 5,649
Option 3 328 1,444 4,736 6,180 5,852
Using the approach described above the additional net benefits of the alternative
policy options compared to BAU amounts to about 120 MEUR/y for Option 1, 230
MEUR/y for Option 2 and around 1,440 MEUR/y for Option 3. The net benefit
refers to the estimated savings in generation and network capacity minus the costs
of meters and activation.
The follow-on or indirect effects depend on how the savings are distributed among
the different actors. Some will go to the lower electricity bills for the consumers
and some will go to the aggregators. Lower electricity costs will increase welfare
for the residential consumers and increase competitiveness for industrial and
commercial consumers.
The distributional impacts cannot be estimated in quantitative terms. It will depend
on the specific market situations and the market prices that will be established.
Qualitatively, the following "winners" and "losers" can be identified.
Table 4 Distributional effects of policy options by actor
Actor Option 1 Option 2 Option 3
Generators Will lose profit on intra
marginal generation at
peak load
Will lose profit on intra
marginal generation at
peak load
Will lose profit on intra
marginal generation at
peak load
Network
operators
Reduced need for
investment – no change in
profits
Reduced need for
investment – no change in
profits
Reduced need for
investment – no change in
profits
Suppliers Potentially, reduced risks as
consumers reduce peak
load demand where
wholesale prices are high
and exceeding the retail
prices.
As Option 1 plus effect
from more even wholesale
prices. Both gains and
losses.
As Option 2 though
possible larger effects on
wholesale prices.
STUDY ON DOWNSTREAM FLEXIBILITY, PRICE FLEXIBILITY, DEMAND RESPONSE & SMART METERING
7
Actor Option 1 Option 2 Option 3
BRP No change No change Will lose on extra balancing
costs (increased financial
risk)
Aggregators No change Increased business
opportunities
Increased business
opportunities (more than in
option 2)
Consumers Reduced electricity bill Reduced electricity bill
(more than in option 1)
Reduced electricity bill
For aggregators, the scope of opportunities depends on the details of the
compensation rules. There will be a better business case without compensation, but
the additional profit will come at a loss to BRPs and potentially higher system costs
to be covered by the consumers.
Overall, the main "loser" will be the generators that earn high intra marginal profits
on the generation at peak times where the prices are high. The winners will be the
consumers that see lower electricity costs. The aggregators and the consumers will
share the part of the gain that derives from the incentive based demand response.
The effect on suppliers are difficult to estimate. There could be gains from reduced
wholesale prices at peak demand. On the other hand, if wholesale prices off peak
increase, then this could result in a loss. Overall, the effect would depend on the
specific contracts between suppliers and consumers and the precise changes in
wholesale prices.
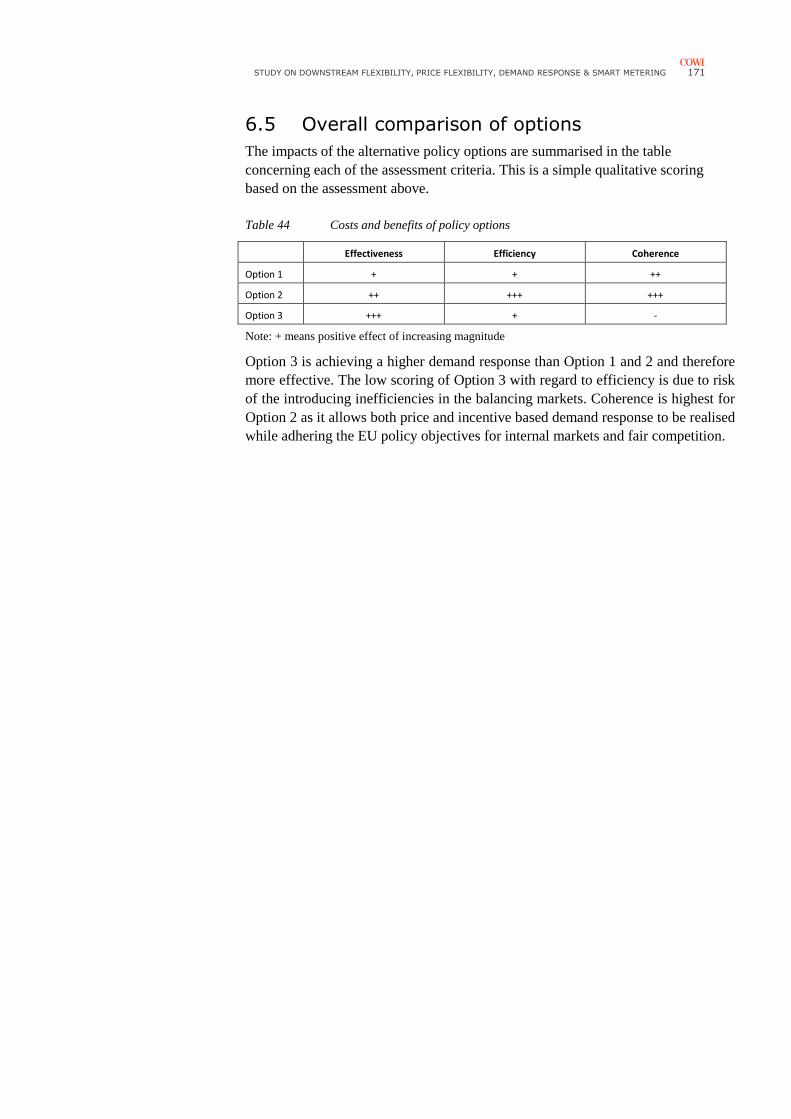
Overall comparison of options
The impacts of the alternative policy options are summarised in the table
concerning each of the following assessment criteria.
Effectiveness (how much additional demand response is achieved)
Efficiency (cost-benefit of each option)
Coherence (how the options fit with EU policies in particular the EU
objectives)
Distributional effects (assessment of how the different stakeholders will be
affected)
This is a simple qualitative scoring based on the assessment above.
Table 5 Costs and benefits of policy options
Effectiveness Efficiency Coherence
Option 1 + + ++
Option 2 ++ +++ +++
Option 3 +++ + -
Note: + means positive effect of increasing magnitude
Option 3 is achieving a higher demand response than Option 1 and 2 and therefore
more effective. The low scoring of Option 3 with regard to efficiency is due to risk
of the introducing inefficiencies in the balancing markets. Coherence is highest for
8 FINAL REPORT
Option 2 as it allows both price and incentive based demand response to be realised
while adhering the EU policy objectives for internal markets and fair competition.
STUDY ON DOWNSTREAM FLEXIBILITY, PRICE FLEXIBILITY, DEMAND RESPONSE & SMART METERING
9
1 Introduction
This report has been prepared by COWI A/S in cooperation with AF Mercados
EMI, ECOFYS, THEMA and VITO under the existing COWI Service Framework
Contract with DG ENER covering Technical Assistance Activities (Ref. SRD
MOVE/ENER/SRD.1/2012-409-LOT 3-COWI) and in response to the Terms of
Reference included under Work Order ENER/A4/516/2014.
1.1 Purpose
The objective of the study is to identify and assess the impact of potential policies
aimed at fully exploiting the demand response potential in the EU. It covers
industrial, commercial and residential sectors in order to improve the economic
efficiency of electricity consumption in the context of increased intermittent
generation and new energy technologies. The final outputs of this study may
provide supporting evidence and analysis for legislative and non-legislative
proposals to be adopted by the European Commission in late 2016.
1.2 Structure
The first section below, Section 2, provides a detailed background on demand
response, including a description of what it involves, as well as discussion of its
increased importance, its potential to address current challenges as well pre-
requisites for how such potential can be turned into reality. The next section,
Section 3, presents the legal and policy context and how attempts to promote
demand response have fared both within the EU and internationally, in particular in
the US. This section also includes a detailed analysis of the main barriers faced and
how EU intervention could potentially address such barriers. Section 4, outlines a
range of possible policy objectives as well as detailed policy options.
Section 5 presents the quantification of the policy options. It includes a review of
data on the existing level of demand response for price and incentive based demand
response. Then, the mechanism for the policy options to increase demand response
is discussed. It is following by an estimate of the level of demand response for each
option and for 2020 and 2030. Finally, the costs and benefits of the policy options
are estimated.
10 FINAL REPORT
Section 6 includes a comparison of the policy options. The assessment includes
effectiveness, efficiency, coherence and an assessment of the distributional
impacts.
STUDY ON DOWNSTREAM FLEXIBILITY, PRICE FLEXIBILITY, DEMAND RESPONSE & SMART METERING
11
2 Demand response
2.1 Importance and implications of demand
response
Traditionally the development of EU's electricity market has centred on the role of
the supply side – that is the role of electricity generation – in meeting Europe's
needs in a sustainable way at an affordable price. Recent developments, such as the
technological advances brought about by the advent of smart metering as well as
the need for demand flexibility to counter greater supply side inflexibility caused
by increased variable RES on the system, have shifted the attention to the role
which the demand side – namely customers and their agents – can play in making
electricity wholesale and retail markets function better.
In this regard, in 2013, the European Commission noted that the 'potential of the
demand side response at the Union scale is enormous: peak demand could be
reduced by 60 GW, approximately 10 % of EU's peak demand'3. In short, such
potential, if tapped, can lead to a number of direct benefits including lower
electricity costs and greater system reliability and greater indirect benefits such as
lower CO₂ emissions through changes to consumption patterns and greater
penetration of RES. However, despite this considerable potential, the EU's
electricity markets remain primarily driven by the supply-side of the sector. The
reasons for this are explored in detail in the remainder of this section.
2.1.1 Definition of demand response?
Demand side response, or demand response, refers to a number of actions which
customers, or agents acting on their behalf, can do to change their use of demand
side resources at strategic or peak times. The US Federal Energy Regulatory
Commission, FERC, defines demand response as "Changes in electric usage by
demand-side resources from their normal consumption patterns in response to
3 European Commission, Communication, Delivering the internal electricity market and making the
most of public intervention. November 2013.
12 FINAL REPORT
changes in the price of electricity over time, or to incentive payments designed to
induce lower electricity use at times of high wholesale market prices or when
system reliability is jeopardised4".
While these actions typically involve either shifting electricity use from peak times
to off peak times, or simply using less at peak times, demand response can also
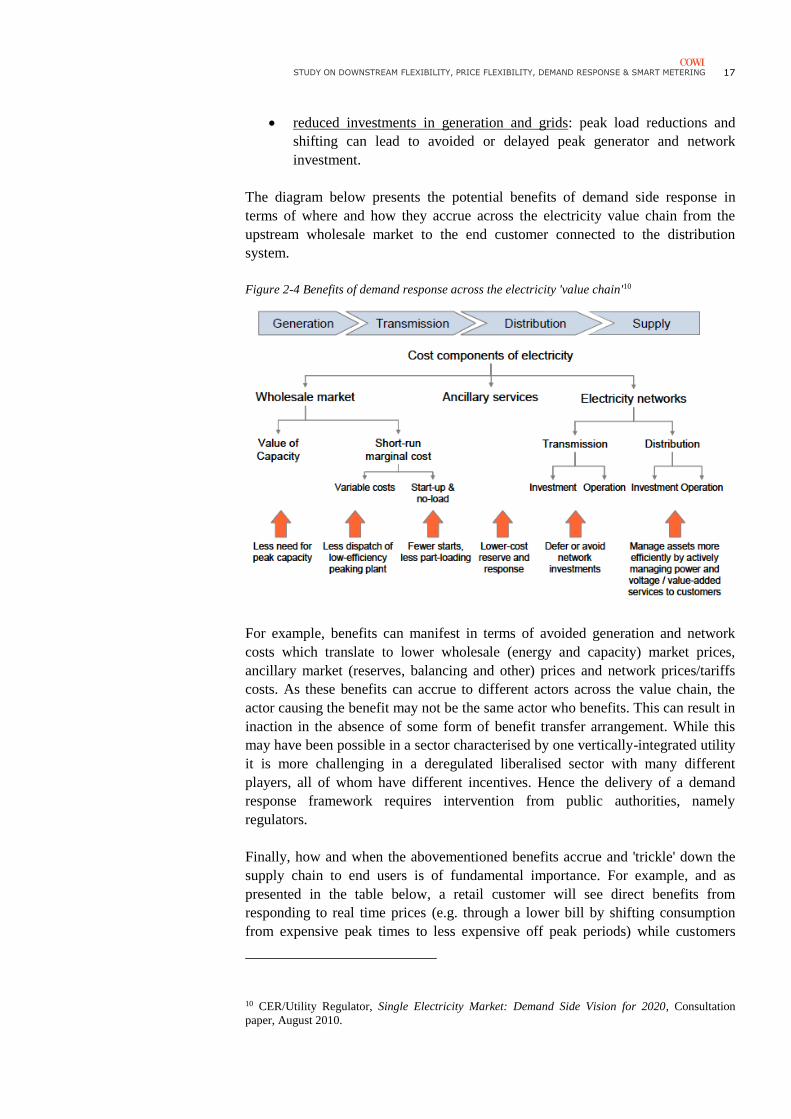
mean increasing electricity use. The diagram below present the different effects
which demand response incentives can have.
Figure 2-1 Different effects demand response (RAP, 2013)
As can be seen, while demand response in the vast majority of cases decreases
overall peak demand5 and tends in most cases to decrease overall consumption, it
can nonetheless actually encourage greater use at off peak times (for example
valley filling and load building). Therefore, demand response is as much about
optimising the use of electricity system (e.g. matching demand with generation and
vice versa) as it is not only about reducing energy usage.
There are a number of ways in which demand can respond. These include installing
an alternative energy service as a back-up for electricity, shifting demand in time
due to temperature inertia, storage possibilities (battery or heat) or simply shifting
to another time due to higher elastic demand preferences.
In terms of the service it provides to the system, beyond simple changes to peak
demand and changes to consumption, demand response can also substitute for
services which are now provided by generation plant and compete with existing
(e.g. pumped storage) and nascent storage technologies. Therefore, demand
response is more complex than simply reducing peak demand response.
4 RAP/Synapse, Demand Response as a Power System Resource. 2013. 5 If poorly designed a demand response programme can simply shift the peak to another time, thereby
resulting in the same level of investment as before. However, this appears to be quite rare.
STUDY ON DOWNSTREAM FLEXIBILITY, PRICE FLEXIBILITY, DEMAND RESPONSE & SMART METERING
13
Figure 2-2 Types of demand response services (RAP, 2013)
For example, and in concrete terms, demand response can provide services aimed
at increasing market efficiency as well as short and long term system reliability. It
can do so as a potential substitute (i.e. it can remove the need for peak generation)
and/or complement to generation and storage technologies (it can foster the
development of storage technologies). These services or benefits are further
explored in the next sub section.
In simple terms, there are two main types of demand side response6:
› Price-based (or implicit) demand response refers to a situation when
consumers can and choose to be exposed to time-varying electricity prices or
time varying network grid tariffs that reflect the value and cost of electricity
and/or transportation in different time periods and react to such signals.
While electricity markets have only been in place in most countries since the early
2000s, demand response has been around a lot longer. Indeed a large number of,
albeit, centrally-regulated demand-side 'management' schemes have been in place
since the oil crisis of the 1970s, and many of these have been operated
successfully. The question therefore is why the subject is getting increased
attention at the moment.
Centralised utility driven demand side management programmes emerged in the
USA in the late 1970s as means to reduce growing energy costs. This system,
which was quite successful, changed somewhat with the emergence of flexible gas
generation plant in the 1990s, which in turn reduced the need for peak demand
response, as well as by market liberalisation, which reduced the incentives for
previously integrated utilities to invest in demand response. The Californian energy
crisis of 2000/01, however, saw the re-emergence of attempts to increase the by
then neglected role of demand side resources in electricity market. By this time,
however, the focus had shifted somewhat from energy conservation goals towards
using demand as a means to reduce market power at times of supply shortages.
Liberalisation of the market also provided for new services while market opening
has allowed customers to be more active, at least in theory.
Both developments meant that the market for demand response shifted from
centralised utility led programmes to decentralised provision overseen by impartial,
independent regulators. In parallel, the development of new information
technologies and related devices (e.g. smart metering and displays) from the early
2000s have increased the accuracy and availability of data on demand behaviour;
they also have increased customers' responsiveness/ elasticity through increasing
their ability to respond to system need and prices.
Impact of growth in variable RES and phase out of fossil fuels
In addition, and perhaps most importantly, EU and international energy and climate
goals have required a very large growth in investment in RES, most of which is
variable and inflexible. The figure below shows how electricity generation
technology has changed over the last 60 years, with peaks in investment in gas
plant coinciding with market liberalisation between 1990 and 2010, which has been
followed by huge growth in MW terms by variable renewable capacity.
20 FINAL REPORT
Figure 2-6 EU generation capacity plant additions since 196013
The growth in variable RES has resulted in a fundamental change in how
electricity supply needs to be managed.
On the generation side, the increased penetration of variable and inflexible RES
has increased the challenges faced in keeping demand and supply in sync. This has
meant that TSOs, DSOs and suppliers/ BRPs need significant more short-term
emergency/flexibility (e.g. reserve capacity and balancing energy) resources across
the system. In addition, given the negative impact which RES capacity additions
has had on the economics of more conventional flexible capacity, policy-makers in
certain Member States and internationally (i.e. in the North-west USA) have
introduced separate capacity or long term reliability markets. Finally, energy
markets based on short run marginal costs, or SRMC, have been affected by the
increased penetration of variable RES; in some places the once predictable peak is
now random with prices peaking depending on whether or not there is wind or
solar power14 on the system. This is in contrast with 'old' RES technologies such as
hydro which varied by year or season and not by day. This unpredictability will
most likely narrow the difference between peak and off-peak prices; in reality
prices will from onwards change more randomly from hour to hour.
These developments have not only increased the need for demand resources, they
have also changed the type of response required; with greater supply inflexibility
there will be an increased premium, in relative terms, on the ability to respond in
real-time (e.g. through real-time pricing and balancing/reserve markets). The box
below presents an example of how a successful, centrally administered peak
reduction scheme in Ireland needed to change due to, amongst other reasons,
significant increases in variable wind penetration.
13 IEA, Repowering Electricity Markets: Market Design and Regulation during the Energy
Transition, Presentation, July 2015. 14 While solar power is more flexible than wind, it still represents a relatively inflexible form of
power supply.
STUDY ON DOWNSTREAM FLEXIBILITY, PRICE FLEXIBILITY, DEMAND RESPONSE & SMART METERING
21
Text box 2-1 Example of impact of increased RES penetration on existing demand reduction
programmes
Ireland's Winter Peak Demand Reduction Scheme (WPDRS) & the impact of addition variable wind power on its effectiveness15
Background to the WPDRS In Ireland, demand for electricity over the winter period is very “peaky”. Ensuring security of supply is expensive and encouraging customers to manage electricity usage can reduce costs. The Winter Peak Demand Reduction Scheme (WPDRS) was introduced in Winter 2003/04 as an incentive to larger business customers to reduce electricity consumption during the power system’s peak hours (5 pm to 7 pm) in winter months. This scheme was open to customers who could choose their supplier (pre market opening in 2007) and who had quarter-hour interval metering in place. Customers applied in advance through their supplier to join the WPDRS. In 2003/04, each customer committed to reducing consumption between 5 and 7 pm every business day from November to February. This reduction was achieved through either reducing energy use or utilising on-site generation. The scheme was based on rewarding actual and reliable demand reduction against a historical benchmark or baseline. In 2003/04, the total available payment was quite large and amounted to €210/MWh. Of this total, €160 per megawatt was a reliability payment and €50/MWh was an energy payment. Results In terms of results, in 2003/04, a total of 639 customers was eligible to take part in WPDRS and 186 (29%) signed up. A total of 106MW of committed load reduction was offered by these customers, whose total baseline demand was 410MW. The demand reduction achieved through the WPDRS led to the 2003/2004 winter peak being 1.8% lower than the 2002/03 peak, even though demand for the entire year increased by roughly 3%. The load reduction achieved was quite reliable on a daily basis; 95% of the time, the achieved load reduction lay between 72MW and 88MW. Changes resulting from the new market and increased penetration of wind power One of the reasons why the above scheme was needed was that there was an absence of a market based alternative. In other words, there were limits on the ability of large customers to participate in a wholesale market. The introduction of new wholesale market arrangements from 2007 onwards has led to the termination and replacement of the scheme in 2012 by a market based alternative. Another important change concerns the evolution of 'demand peak periods' as wind RES penetration has increased. With greater wind generation in Ireland, there was less certainty over when dispatchable back-up generation and demand response would be required thereby making the peak period harder to determine. Hence, the time when the demand response was needed often fell outside the traditional 5 to 7pm hours, as illustrated in the figure below.16
15 IEA DSM, Case Study – Winter Peak Demand Reduction Scheme. Found at:
http://www.ieadsm.org/article/winter-peak-demand-reduction-scheme/ 16 CER/Utility Regulator, Single Electricity Market: Demand Side Vision for 2020, Consultation
To conclude, while regulated peak reduction demand schemes – predominately focused on system security have been effective, their use has become less useful given that flexibility is now required more and more often outside of traditional peak periods. Therefore, a more flexible, market based is required.
While it is not fully clear how generation and related (e.g. storage) technologies
will develop in the coming years, given the long term aim of the EU to decarbonise
the energy sector, it can safely be assumed – even if RES subsidies are phased out
– that a significant proportion of new investment in electricity generation over the
coming years will be in variable RES sources
Beyond generation, the advent of variable RES has led to an increased strain on the
transmission and distribution networks, which has led to significant growth
network reinforcement (e.g. investments in new or upgraded network) costs in both
urban and rural areas. However, the development of so-called smart grids, of which
demand response is a key component, should slow the need for, and cost of, this
grid reinforcement. For example, price-based demand response tools that links end
user tariffs with underlying time-varying network (and generation) costs should
reduce the need for reinforcement of peak-demand driven higher voltage networks
while greater local control of the network by DSOs can reduce LV costs. Cost-
reflective connection charging can also lower network tariffs as it avoids a situation
where a large proportion of the usage tariffs paid by existing users is comprise of
fixed, new-connection costs.
Changing consumption patterns & new forms of flexibility
In terms of future demand, the policy goal to eliminate fossil fuels will see a move
towards greater electricity usage for space heating (i.e. for heat pumps) and
transport (e.g. electric cars). Some put this as resulting in a 50 percent increase in
overall electricity consumption and a 100 percent increase in peak demand. For
example, the UK anticipates a growth in peak demand of 32GW (up from circa
55GW) between now and 2050 due to these technologies. As these demand drivers
will be driven by end consumers, they should drive growth in both generation as
well as on all parts of the network.
STUDY ON DOWNSTREAM FLEXIBILITY, PRICE FLEXIBILITY, DEMAND RESPONSE & SMART METERING
23
In terms of mitigating the challenges posed by inflexible variable RES and high
growth in electricity demand, it is clear that any provider of 'flexibility', and not
just demand response, will be in a strong position to meet these challenges.
Therefore in terms of alternative solutions to demand response, possibilities
include storage (e.g. behind-the-meter or system connected), flexible generation
and greater interconnection (i.e. to diversify and better make use of existing
resources). The EU and Member States is currently pushing all four of these forms
of flexibility through different instruments and hence is not 'picking a winner'.
While this approach could possibly be seen as duplicative, it nonetheless allows the
EU to hedge its bets should one approach not live up to expectations. For example,
if technologies with large sunk costs and significant R&D lead-times such as
electrical storage do not improve as fast as expected, the EU can possibly fall back
on other less capital-intensive increased demand response and other forms of
flexibility if need be. This view may make sense as demand response is relatively
less dependent on technological development than possible options such as storage.
In terms of how the different 'alternatives' would interact, one view is that if
storage took the value of demand response would diminish somewhat as more and
more flexible generation or storage comes on line to a point where demand
response may no longer be seen as necessary. Another contrary view is that
demand response can actually act as a catalyst for innovations like storage. For
example, tools such as real time pricing, may actually accelerate the roll-out of
storage, in particular if combined with RES. Overall, from a flexibility alternative
or substitute point of view, demand response would appear to be a positive least
expensive development and may represent a 'no regrets' option so long as demand
response is implemented in a way which is:
› responsive to actual needs e.g. not just to long term somewhat static needs
for generation and network reinforcement but also to more dynamic energy
market signals and short term needs
› reliable: the demand response will deliver what is expected
› proven to work: action is taken to allow and incentivise customers to
response;
› subject to robust CBAs where benefits exceed costs (including customer
inconvenience) and
› remains voluntary.
Different national 'starting points' for demand response
Regarding national starting points, and as can be seen from the figure below, there
are a range of variables which cause each Member State to differ from another,
even if the system always has to be in balance.
24 FINAL REPORT
Figure 2-7: Differing generation and consumption variables
Source: THEMA (2014), DR in the Nordic electricity market. Input to strategy on demand flexibility
Even in the Nordic region where gas is not used for heating, there are still a range
of national generation and consumption differences. Therefore, there is no one-
size-fits-all solution to the 'inflexibility' challenge.
Figure 2-8: Differing generation and consumption characteristics in the Nordic area
Source: THEMA (2014), DR in the Nordic electricity market. Input to strategy on demand flexibility
Some differences – like air conditioning – will endure, while others may be
temporal and may diminish over the next decades. In this vein, EU policy is driving
the different markets to converge in a number of ways. For example, increased
interconnection across the EU will probably mean that variations in supply, and in
prices, will occur in many regions. This would mean that the benefits for flexibility
of greater interconnection may (i) cause problems for certain countries and (ii) may
diminish as the EU becomes more and more interconnected. In addition, a possible
fall in the output of power intensive sectors across Europe may mean that there
would be less large scale demand response available and that smaller customers
may need to fill the gap.
2.4 Potential and reality of demand response
While a lot has been written about the potential demand response, there is not a
huge of evidence as to whether this potential is fully attainable and at what cost. In
terms of the main benefits present above – better wholesale market price formation,
STUDY ON DOWNSTREAM FLEXIBILITY, PRICE FLEXIBILITY, DEMAND RESPONSE & SMART METERING
25
improved supply of system services and lower investment in capacity – there is a
limited and perhaps somewhat biased amount of information available.
For example, with regards to peak demand reduction potential, which if sustained
leads to lower investment in peak capacity peak, a review of the literature suggests
that while demand response could conceivably in the long term shave between 15
to 20 percent from peak demand and 10 percent from energy consumption, the real
response may be closer to 1 to 10 percent peak demand reduction and a 0 to 5
percent overall energy consumption reduction17.
With regards what type of demand response has what potential, it is not clear from
the literature how much of this expected peak demand response is attributable to
price-based and incentive-based demand response, and within these two categories
what tool would deliver what response. Nevertheless, in 2011, the US FERC noted
that the vast majority (92%) of peak reduction potential of the demand side
resources will come from incentive based demand response, at least in the short
run, while only 8% would come from priced based programmes (time based in the
figure below).
Figure 2-9: Estimated price and incentive based demand side potential in the USA
Others suggest that while incentive-based demand response may be more important
at present, the roll-out of smart meters, new real-time or critical peak prices and
automated control technologies increase the importance of price based demand
response in the coming years18.
17 Jacapo Torriti, Peak energy demand and demand side response, 2015. 18 Brattle, The Five Forces Shaping the Future of Demand Response (DR), presentation, February
2015.
26 FINAL REPORT
In addition, and aside from the effectiveness and range of the different types of
products, another important feature of the US analysis presented in the figure
above relates to how the different types of response product suit different types of
commercial and industrial, residential and wholesale customers. For example, it is
expected that demand response will be most effective in contributing to reserve
capacity/balancing energy needs (also known as emergency demand response in
the US) and that most of this will come from demand side market participants
(including aggregators) acting directly in the wholesale market. On the other hand,
the contribution to impacting the energy market (MWh; also known as demand-
bidding and so called 'buy back') seems to be less interesting. This however may
change now that the US federal courts have in January 2016 given the go-ahead to
the FERC and regional system operators to compensate demand side participants
for energy demand bids. Overall, and in contrast to generation plant whose core
business is the energy spot market, it would appear on this evidence that demand
customers' main preference is to provide reliability (reserves/capacity) rather than
energy services. The US market for demand response is further explored in the next
section.
Another interesting aspect of the above is that residential and other small customers
are seen as being important for incentive based schemes, albeit through demand
aggregators via direct load control.
As this assessment exceeds current expectations in Europe, one of the main
questions to be asked is whether the US potential is relevant for the EU. In terms of
whether such potential is possible in Europe, this is not clear. For residential
customers, US high residential consumption per capita (double the EU's) and
summer time air conditioning driven peaks would suggest that there is significantly
less potential in Europe. On the other hand, the expected growth of electricity
demand in Europe due to heat pumps and electric cars as well as the variation in
supply due to RES may suggest that both jurisdictions could converge19. Another
factor is the very high level of distributed or back-up generation available in the
USA. On the industrial side, EU industrial electricity consumption is higher.
2.5 Prerequisites and enablers of price and incentive based demand side response
The above benefits do not come automatically. Achieving greater demand response
is seen as requiring the following:
› Increased consumer awareness, buy-in as well as protection and simplicity:
Customers need to be aware of the potential benefits of demand response. This
is particularly the case for smaller customers and price-based demand
response. However, and despite the fact that demand response has been
promoted by certain policy makers, regulators and utilities for a number of
19 ACER, Demand side flexibility: the potential benefits and state of play in the European Union,
2014.
STUDY ON DOWNSTREAM FLEXIBILITY, PRICE FLEXIBILITY, DEMAND RESPONSE & SMART METERING
27
years, customers have not, to date, been fully empowered and properly
rewarded. In short, one prerequisite is that customers are engaged and
incentivised to respond. Another is that customers need to be able to know
how to act and that they feel confident in doing so. Flat tariffs – regulated or
not – protect customers not just from time-varying tariffs but also from time
varying bills. Against this background, many customers may be averse to
more risky tariffs, even if they would most likely benefit overall.
› Methods to measure changes in consumer behaviour20: One of the main
barriers to demand participation has been the lack of a means to measure
customer usage at any given time and communicate price and other signals to
customers, as well as communicate consumer actions to other market actors in
real time. While there are disagreements over the extent to which price and
incentive based requires new technologies21, the advent of smart metering and
related customer displays in the 2000s – in particular for small business and
domestic customers – has strongly facilitated the receipt by customers and
other market actors of better information on actual usage, which has in turn
facilitated the offering of static and dynamic time of use tariffs/ pricing
contracts. This has, in turn, increased customers' price elasticity from -0.1 can
increase significantly in the longer term (to over -0.2) where response and
energy shifting technologies are available. This is predominantly an issue
which thwarts price-related demand response given that most larger customers
who will provide most of the demand for incentive based demand response
already have interval metering in place and should have the option face cost
reflective tariffs.
› Incentives to encourage changes in consumer behaviour: The availability of
smart metering and information on usage does not automatically mean that
customers are offered the right incentives22. For example, suppliers may not
have an incentive to offer such tariffs or such devices/information, especially
when they are part of larger company which also has a generation wing.
Indeed, for integrated generation-supplier companies, high peak prices can
result in significant profits, which would be eroded by increased demand side
response. Despite the benefits which flexibility can provide to suppliers (better
portfolio optimisation, lower balancing and constraints management costs),
this means that certain integrated companies may not be fully incentivised to
promote demand response, which in turn may have led to the entry into the
market of independent demand aggregators and ESCOs.
20 It should be noted that the benefits of smart metering go beyond demand response benefits. For
example, benefits also accrue to suppliers and network operators in terms of better revenue control. 21 In theory, demand response can be based on historical profiles which do not per se require
individualised interval data, which smart metering helps provide. However, there are challenges in
accurately defining such profiles for each and every customer in the absence of data. 22 The term 'right incentives' can mean several things. In this regard we consider this to relate to tariff
structures which reflect underlying costs. Though there are a number of non-efficiency related criteria
to consider when designing tariff structures, tariffs which do not reflect underlying temporal
wholesale market conditions and network cost drivers cannot be consider to be fully incentive-based.
Factors which are outside the utility's control – such as taxes and levies – can also play a role in
dampening price signals.
28 FINAL REPORT
On the networks side, while network assets are built to meet peak demand, the
tariffs charged are often partially capacity (kW) based, or are based on an
average kWh. Such tariffs dull price signals and reduce incentives to respond.
Finally, flat rate taxes and levies will also dull price signals. Therefore, prices
which reflect underlying and time-varying costs are required – the more
dynamic the tariff structure, the greater the response one would expect.
Customers need of course to be incentivised. This depends on a range of
items, including but not limited to time-varying prices. For example, the
proportion of an electricity bill in a person's income is important, which means
that energy intensive industrial customers and low income residential
customers may be more interested. The proportion of the bill which is variable
is also important – if the bill is predominantly flat or capacity based, there will
be substantially less response. Where time based tariffs are offered, their take
up may still be thwarted by regulated prices; likewise they may be set at a
level which do not sufficiently reward customers for the system-wide or
'collateral' benefits which such tariffs should reflect.
› Capacity to respond: Finally and most importantly, as a discussed above,
customers need to be able to and willing to respond. This is a function of a
number of factors, including the cost of distributed generation, the degree to
which demand can be moved or shifted which may be the case in particular
with electric heating and cooling, and the level of automation which can be
applied. As it can safely be assumed that many customers will not change their
habits entirely, the lack of automation means that a large proportion of
demand, and in indeed customers, cannot respond at all.
All-in-all, even when all the above challenges are tackled, there will always be a
certain level of customer inertia to price related demand response. Part of this
inertia relates to the fact that responding to varying prices requires action on the
part of smaller customers. In contrast, through intermediaries pushing incentive
based demand response such as independent or supplier demand aggregators,
customers can still benefit without directly participating themselves in the market
which involves significant transaction costs and overcoming other barriers. Here,
there remain a number of substantial barriers. In short, incentive-based demand
response also requires the:
› Removal of market barriers to demand side participation on the wholesale
markets23: In terms of market barriers, electricity wholesale market rules are
complex and require a certain level of risk and expertise. For this reason,
market operators/TSOs often require participants to be of a certain size or
provide financial security. This excludes many demand customers, whose core
23 The term wholesale markets here refers to energy markets (short run marginal cost bidding, MWh),
short term reliability markets (e.g. known as reserve capacity (MW)/balancing energy markets
(MWh) in the EU or emergency markets in the US) and long term reliability markets (e.g. known as
capacity markets in the EU and US even though design parameters variable considerable from one
Member State (EU) or RTO (US) to another, MW).
STUDY ON DOWNSTREAM FLEXIBILITY, PRICE FLEXIBILITY, DEMAND RESPONSE & SMART METERING
29
business is not electricity, from participating directly in the market. Recent
years have seen the entry of 'demand aggregators' into the market who act on
the wholesale market on behalf of such excluded customers. The growth of
such services, however, still requires equitable access to wholesale markets for
demand side resources, which in turn is affected by market and grid rules
which have been designed with generation plant in mind. Therefore, these
legacy rules may need to be amended and tailored to allow for greater demand
aggregation and demand side participation. This does not just mean the
removal of market barriers; it also means equitable access to reliability-related
wholesale market incentives such as capacity payments. On the other hand,
and to avoid favouring demand or supply, market rules may include rules to
ensure that other market actors are not unduly put out of pocket.
› Ensuring that demand response is properly compensated: As highlighted
above, unlike price based demands respond, demand side participation in the
wholesale market through incentives impacts wholesale market price
formation ex ante. In this way, demand response actors can lower the
electricity price for everyone, including for those who did not respond. The
question is whether and how these demand side actors can be compensated for
the system or collateral benefits they may create.
› Creation and/or amendment of regulatory structures to facilitate demand
response: Key to the development of equitable market rules are the regulatory
or governance arrangements, and other flanking measures, which lead to the
development of such rules. These may include rules to ensure that all parties
have visibility of demand side actions through improved independent data
exchange systems, the clarification of roles and responsibilities, including that
of the DSO, and systems and processes to ensure efficient transfer of as well
as rule-making procedures allow for the inclusion of customers and data
aggregators.
For example, the diagrams below outline the changes in roles and
responsibilities that demand response has brought about or will bring about in
what is already a complex market structure. These changes will have knock-on
impacts on data exchange and contracting.
30 FINAL REPORT
Figure 2-10 Example of a 'traditional' market design framework24
Figure 2-11 Example of a new market structure to accommodate demand response
As can be seen, the move from a 'traditional' to a 'new' market structure entails
more actors (e.g. addition of demand aggregators and distributed energy resources
(DER) consumers, change of consumers to 'prosumers'), more relationships (i.e.
represented by red arrows) and changed relationships (between suppliers/ traders/
24 SWECO, Study on the effective integration of Distributed Energy Resources for providing
flexibility to the electricity system, April 2015.
STUDY ON DOWNSTREAM FLEXIBILITY, PRICE FLEXIBILITY, DEMAND RESPONSE & SMART METERING
31
aggregators, the DSO and the TSO). In regulatory terms, these new actors may
force a rethink on the part of regulators on how the industry should be governed.
For example, for competition/conflict-of-interest reasons customers may be able to
contract separately with aggregators and suppliers thereby ending industry practice
of the supplier acting as the one point of contact. This will, in turn, most probably
increase the neutral, hub role of DSOs and TSOs25 both in terms of rule-making
and IT/communications. These developments may also require realignment of
priorities and practices amongst regulators.
In the longer term, the encouragement of both price- and incentive based demand
response will in the longer term foster additional demand response resulting from
home and office automation, the promotion of new forms of electricity demand
(such as renewable heat pumps and electric vehicles) and the development of
storage technologies which are currently undergoing further research and
commercialisation. All-in-all these changes may result in an entirely different
market structure by 2030, including possible measures to separate distribution
companies from demand side agents such as suppliers, demand aggregators and
ESCOs; a lot depends on how new high impact technological and economic
changes, such as those related to automated control, behind-the-meter storage and
distributed generation, progress in the interim.
25 More information on this issue can be found at: http://www.evolvdso.eu/
consumption information (Articles 9-11) , the Directive also includes a series of
policy measures – in Article 15 – which require Member States to promote demand
response. These includes provisions to ensure that:
National regulatory authorities encourage demand response to participate
alongside supply in wholesale and retail markets
Access and participation of demand response in balancing, reserve and
other system services markets is promoted
High-efficiency cogeneration operators can offer balancing service and
other operational services
TSOs and DSOs treat demand response providers, including aggregators,
in a non-discriminatory manner
With regards to the latter bullet, the Directive includes a provision (Article 15.8)
that specifically allows for smaller customers to participate in the market through
intermediaries such as demand aggregators. Specifically, the Directive requires that
demand response service providers, representing customers, have access to
organised markets on equal terms to suppliers.
Unfortunately, to date, the implementation of Article 15, and in particular Article
15.8, has been mixed at best. Reflecting the results of a 2015 industry-led Smart
Energy Demand Coalition (SEDC)28, an unpublished 2016 study by the European
Commission's Joint Research Centre (JRC) notes that most Member States have
not acted sufficiently to remove barriers to price- and incentive-based demand
response. Despite this, given the growth of demand aggregators over recent years, a
certain level of progress has been made. Indeed as the deadline for transposition of
the Directive was mid-2014, it is still early days in terms of implementation of
incentive based demand response measures. The current situation is further
explored in the section below.
3.2 Progress made since the IED in 2009
Despite the abovementioned potential and legislative framework, there has only
been a limited level of progress made in this area over the last several years
Therefore, in the words of the European Commission29 it appears right to say that
"the potential of the demand side in markets is currently underutilised".
28 SEDC, Mapping demand response in Europe today, September 2015. 29 European Commission, Communication, Delivering the internal electricity market and making the
most of public intervention. November 2013.
STUDY ON DOWNSTREAM FLEXIBILITY, PRICE FLEXIBILITY, DEMAND RESPONSE & SMART METERING
35
3.2.1 Smart metering
With regards to the availability of smart metering that is needed for dynamic
pricing for smaller customers30, according to the Commission's 2014
Communication on "Benchmarking smart metering deployment in the EU-27 with
a focus on electricity", 17 Member States will proceed with large scale roll-outs of
electricity smart meters by 2020 or have already done so. The remaining eleven
either reported an inconclusive or negative CBA (seven MS) or had not yet
reported back to the Commission (four MS). Of the main markets, Italy has
completed its national roll-out with the UK, France and Spain on track for
completion by 2020. Germany presents a more mixed picture with the roll-out
confined to larger usage customers. All-in-all, and as mentioned above, it is
estimated that 72 percent of all customer demand is expected to be covered by
some form of smart metering by 2020, in little more than three years.
However, the results, and hence application of the national CBAs, need to be
interpreted with caution for a number of reasons.
First, each Member State used a different CBA methodology, varying key
parameters such as the time period of analysis, the treatment of meter replacement,
the treatment of avoided cost of standard meters, the communications technology
adopted and the need for complementary investment (meter boards etc.). This has
resulted in very large differences in both estimates of costs and benefits. For
example, some countries identified the costs as being in the range of 100 euros all
in (e.g. meter, IT, communications and data infrastructure, installation and
maintenance) while some estimates were in the range of €500 to €600, namely in
Germany, Belgium and Ireland. This has complicated any cross comparison of
Member State roll-out plans. The assessment of benefits has also differed
considerably with some lower than €100 (e.g. Czech Republic) and some much
higher at over €500 (e.g. Ireland). Overall however, the costs cluster in the area of
€100 to €300 including in-house displays while the benefits are generally higher, in
the region of €150 to €40031.
Second, much of this may possibly be explained by the fact that the underlying
smart metering functionalities differed considerably. With regards to costs
however, there seems to be no clear relationship between cost and functionality32;
in other words, many countries' estimated costs have been estimated on the high
side. While this could be due to poor data, another explanation is that over-
customisation and poor economies of scale may be the cause of high prices in
certain countries. Despite this reasons, a more harmonised approach consistent with
the Commission’s methodology may reverse some of the more marginal
inconclusive or negative CBA results. This of course depends on whether the
30 Industrial customers should already have interval two-way metering in place. This will be verified
in the next stage of the project. 31 It should be kept in mind that all of these differences are reduced when standard CBA
methodologies are used. 32 AF Mercados EMI and NTUA, Study on cost benefit analysis of Smart Metering Systems in EU
Member States, Final Report, 2015.
36 FINAL REPORT
benefits – which are harder to gauge – stack up. For example, benefits may be
biased upwards by overoptimistic estimates on energy conservation.
All-in-all it is interesting that the majority of benefits related to advantages that
have little to do with demand response; they relate rather to customer service or
administrative improvements in the areas of meter reading, dis/reconnection,
identification of system problems as well as fraud detection and so on. Many of
these benefits, however, are only possible if smart meters are rolled out across a
certain geographical area. For example, a geographic roll-out would reduce meter
reading costs considerably compared with a customer-by-customer roll-out. In
terms of consistency across Member States, there are also considerable different
estimates of the non-energy conservation benefits; for example estimates of savings
from reduced theft vary significantly from country to country.
Beyond these benefits, the customer impact through demand response varies
considerably, with several MS assuming that reduction in consumption and/or
shifts in consumption will occur, though with little consideration of dynamic
pricing in the CBAs. MS also vary whether avoided energy generation and network
estimates are included in the CBA. A final difference is that many considered
electricity and gas together, which reduced overall costs.
All-in-all, as the pan-EU picture on smart metering is extremely diverse, it is
difficult to identify precisely what the costs of smart metering are. However certain
issues are clear:
› a more standardised CBA methodology and common functionality would
lead to different results, and potentially to more positive CBAs;
› increased functionality is not necessarily the main driver of costs. In fact as
functionality is software driven, the incremental cost of functionality is
relatively low. Rather issues related to economies of scale and customisation
may be more important in driving overall costs;
› much of the benefits relate to new or increased customer services that have
little or nothing to do with demand response;
› finally, many of the benefits are based on estimates and are subject to
considerable uncertainty, in particular those concerning energy conservation
and demand response.
With regards to how the above picture impacts demand response and the important
role which smart metering plays in its development, there are a number of risks:
› while functionality is not necessarily related one-to-one to cost for new roll-
outs, many smart metering programmes have been based on a CBA which
does not include in-house displays (or other means of visualising
consumption (for example, mobile phone application) and two way
communication33, which may severely impede real time pricing and other
33 It should be noted that two-way communication is only needed if Internet access is not available or
safe enough or for direct load dispatching.
STUDY ON DOWNSTREAM FLEXIBILITY, PRICE FLEXIBILITY, DEMAND RESPONSE & SMART METERING
37
demand side services. This may be the case in Italy where the decision to
roll-out was based on avoiding electricity theft. As the lifetime of these
meters is 15 years34, the choice is between replacing stranded assets or
waiting until 2030 to change the existing 'sub-functional' smart meters35;
› as many of the benefits related to customer and system benefits depend on a
geographic roll-out and related economies of scale, a customer-by-customer
decision to opt for smart metering may be considerably more expensive on a
per customer basis. That said, given that some of the geographical roll-out
CBAs estimate a very high per unit cost, there may be an argument for
opening up the market to competition, or at least allowing suppliers and/or
demand aggregators choose their own solution.
› many of the conservation-related CBA benefits are based on the assumption
that customers would be offered time-of-use and real time prices which are
effective at avoiding investment and hence save costs; however, this has not
happened outside of Sweden and Finland, as presented below. Without this
progress on real rather than ideal energy conservation changes, many of the
CBAs undertaken may have been negative.
3.2.2 Price based demand response
Being able to response to price signals which reflect underlying and varying costs
is a fundamental aspect of demand response.
On paper, the majority of Member States already offer tariffs that vary somewhat
on the basis of time. Indeed, 92 percent36 of customers can in theory avail of such
tariffs. In reality, however, this relates to dual peak day/off-peak night supplier
tariffs which have been in place since the 1970s and 1980s, retail/supplier tariffs
which do not require smart metering and related in house displays37. Therefore,
there is little potential in this area. In addition, how these dual supplier tariffs are
structured varies considerably with the differences in peak and off-peak prices
sometimes being minimal (e.g. in Italy) and not reflecting underlying variations in
wholesale and network costs.
As the majority of EU Member States have yet to fully roll-out smart metering, this
picture is not surprising. However, suppliers in countries like Italy which have a
certain level of smart metering in place do not offer significant differences in peak
off peak tariffs. Even here, results from time-of-use supplier tariff trails have led to
unexpected results with peak morning demand falling but peak evening demand
staying the same. In terms of usage, time of use tariffs in Italy have actually led in
certain trials to increased usage, albeit at a lower overall 'bill' cost. Part of this is
explained by the low difference between peak and off peak tariffs. Another more
34 While the cost of the smart meters installed in Italy are of the order of 2 euros per customer and
hence are not high, the costs of removing and installing new meters could be significant. 35 This needs to be confirmed as smart meter lifetimes may turn out to be longer than 15 years. 36 ACER, Demand side flexibility: the potential benefits and state of play in the European Union,
2014. 37 All that is required is a different form of electro-mechanical meter.
38 FINAL REPORT
fundamental problem is that such tariffs do not reflect underlying system
conditions which means that they will not provide flexibility when it is needed.
In terms of countries which have introduced more robust real time prices38, heavy
electricity per capita users in Norway, Sweden and Finland lead the way with up to
30 percent of customers, and an even higher share of usage, opting for real time
prices (yellow in the diagram below). This of course means that the remainder, or
most customers, have opted to stay on fixed tariffs.
Figure 3-1 Proliferation of fixed, variable and spot based tariffs by Member State39
While other EU Member States (AT, BE, EE, DE, NL) are reported to offer real
time pricing, their take-up is limited to a small proportion of customers. Only
France has offered CPP to all customer types.
Several utilities in the USA have changed their default tariffing to real-time pricing
of which customers have to opt-out. Some commentators40 suggest that such a
system would lead to significantly higher price based demand response. However,
any prolonged surge in wholesale prices, such as that which occurred in Europe in
the summer drought of 2003, would avert customers from exposure to real-time
prices. Indeed, this is believed to have been an issue in hydro-electric dominated
Norway where approximately 10 percent of residential customers are on real-time
38 The term real time pricing refers to a number of models. For the most part they are linked to day
ahead prices which means they are not fully 'real-time'. This will be explored in the next stage of the
project. 39 ACER, Energy Consumers and Retail markets: Results from the 2014 Market Monitoring Report,
presentation at the 7th Citizens' Energy Forum, March 2015. 40 Brattle, The Five Forces Shaping the Future of Demand Response (DR), Presentation made at
Demand Response Virtual Summit February 2015.
STUDY ON DOWNSTREAM FLEXIBILITY, PRICE FLEXIBILITY, DEMAND RESPONSE & SMART METERING
39
prices. Such an issue, however, could in theory be resolved through caps in real
time prices.
A more limited version of real time pricing is critical peak pricing (CPP) which
has been pioneered in California in the US and in France in the EU. Under CPP, for
the vast majority of time customers are exposed to typical three or two period time
of use tariffs. The difference is that for 10 to 15 limited time periods per year prices
rise to reflect supply constraints on the system which can result in critical peak
prices which are up to 10 times their normal level. In contrast with time of use
customers, the peak can be reduced by between 10 and 20 percent, which is even
greater than the reduction seen for real-time pricing. While the specific reason for
this is unclear, it may relate to the sporadic nature of CPP peak events.
Finally, in contrast to time of use pricing, both real-time and critical peak pricing
need some form of IT communications with their supplier. For example, while it is
perfectly conceivable that real-time prices could be communicated to customers via
the internet and not through a dedicated in-house/building display, it is assumed
that this would not be consistent with two way communication41 which may require
a dedicated device.
There are a number of general issues which need to be considered here. The first is
how consumer benefits from conservation and shifting usage from peak to off-peak
periods are measured. Many studies look at the impact of usage change on
investment needs and bill reductions. This, however, assumes that there is no
inconvenience or welfare loss for customers resulting from having to either pay
more at peak or change their behaviour, the real welfare benefit is less. For
example, while the move flat to time-varying tariffs may result in, say a 5 percent
bill reduction, the welfare is roughly half of this as the bill reduction does not take
into account welfare loss42.
The second issue, and as raised above, relates to tariff structures and the proportion
of the end bill which is variable. In some jurisdictions (e.g. Germany), the part
which is variable, and hence which can be charged as such under cost-reflective
tariffs, constitutes less than half of a customer's bill. Related to this is that costs for
services which are quite unrelated to ongoing electricity supply (e.g. such as grid
reinforcement connection-related costs for new customers) are often charged to all
customers, and hence old established customers cross-subsidise new connections.
Flat rate taxation and renewable subsidies payments also dulls price signals.
With regards to how the above picture impacts demand response, there are a
number of issues:
41 The next version of the report, the second intermediate report will contain a full glossary of terms
and definitions. 42 The logic here is that a customer gains a greater level of utility from one kWh consumed at peak
than one at off-peak. Therefore, if a customer shifted one kWh from peak to off peak, his bill would
drop by the difference in the rates but he would also lose a certain level of utility or 'welfare'.
40 FINAL REPORT
› though time of use pricing may be acceptable to many risk-averse customers,
it may have a lower than expected impact on peak usage and has little or no
impact on balancing and other flexibility providing demand side services.
› nevertheless, where real-time and critical peak prices are adopted, by say
20% of customers, significant changes in peak demand are possible.
› finally, to be effective, the incentives need to be right. This means tariffs that
provide customers with large potential welfare gains and not just 'bill'
reductions; it also means structuring tariffs to better reflect underlying fixed
and variable elements of electricity supply.
Despite the potential of price based demand response43, in the absence of a
considerable push by policy makers, it will remain marginal. In any case, as price
based demand response is unseen until after the response by system and market
operators, it may be less important – at least today – than explicit or incentive
based demand response further.
3.2.3 Incentive based demand response
Beyond retail markets, the EU acquis is also quite clear on the need for, and rights
of, demand response participants in European wholesale electricity markets.
Building on the Third Energy Package and the Energy Efficiency Directive of
2012, in its Framework Guidelines on Electricity Balancing, the Agency for the
Cooperation of Energy Regulators (ACER) noted that the detailed rules to be put in
place should facilitate the participation of demand response in balancing markets
and inserted a specific provision in its recommendation for a Balancing Code
which would enable the independent provision of demand-side response44. The
above-referenced Demand Connection Code also caters for demand aggregation.
Despite this, progress in the EU has been sketchy. Given the lack of empirical
evidence available in Europe, it is necessary to look at international experience,
namely the example of its success in the USA.
As already mentioned in the previous section, there are a number of good reasons
why the EU has trailed the US in promoting demand flexibility in the wholesale
market. One is that the EU has significant levels of pumped hydro and hence has
less of a need for demand response; another is that the difference between peak and
off peak electricity use is less pronounced given the lower penetration of air
conditioning and the prevalence of natural gas for heating purposes.
These differences helped to avoid the type of wholesale market price spike seen in
California in 2001, which in turn acted as a driver of policy change. Moreover, the
Federal Energy Regulatory Council, working with the Department of Energy, has
been extremely active in pushing incentive based demand response. Part of this
43 The split between price and incentive based demand response is artificial as the two can be
combined. For example Price based demand response tools such as CPP can be made more effective
by explicit tools such as load control. However, these tools are not in wide use. 44 ACER, Recommendation on the network code on electricity balancing, July 2015.
STUDY ON DOWNSTREAM FLEXIBILITY, PRICE FLEXIBILITY, DEMAND RESPONSE & SMART METERING
41
focus may also relate to the fact that decisions on 'retail' issues such as time of use
tariffing and smart meters are outside of the FERC's jurisdiction which leaves more
room for focussing on how demand response can be promoted on an inter-state
wholesale market basis. This situation has of course changed with the substantial
growth in wind and solar power in Europe which has meant that the EU needs to
catch up.
Types of product/service
In terms of what services can be offered under incentive-based demand response,
and as described in the previous section, like other supply side participants the
demand side can offer its services in the energy (spot) market, long term capacity
market (where one exists) and the short flexibility markets (reserve capacity and
balancing energy). As electricity is not the core business of most, if not all, demand
side participants, they have in the past tended to have become more involved in
markets where participation offers a regular payment. This means the short-term
flexibility markets (US/EU) and long-term capacity markets (US), and not energy
markets. Indeed, for a number of reasons certain commentators note that capacity
markets are particularly suited to demand side participants.
The table below presents an overview of the markets in which the main demand
response 'products' or services would be offered.
Text box 3-1 Wholesale market 'products', demand side response and resulting benefits
Product Energy Flexibility Capacity
Benefit Efficient dispatch Short term system adequacy Long term system adequacy
What it does Delivers energy in the most cost-effective way by letting the market define the system's merit order
Enables the system to respond to short term variations in the supply-demand balance
Providers policy makers with certainty that there will be sufficient capacity in place for the medium term (e.g. 4 years)
Market instruments
Forward, day ahead, intra-day markets
Day ahead, intra-day markets, balancing markets, ancillary services
Capacity markets45
Role of demand response
Bids to reduce demand, which in simple terms can reduce wholesale spot prices
Short term offering of reserve capacity and balancing energy from fast response demand units
Longer term offering of capacity
Potential based on experience
Low to medium High Medium to high
Current cross-EU border situation
Ongoing integration (well-developed)
Ongoing cross border integration (less developed than energy)
Largely national
Experience in the US and possible application to the EU
With regards to what is possible for demand side participants, the figure below
presents the growth in demand response participation in reserves/balancing
(emergency interruptible load), capacity (emergency DR) and energy (economic
program) markets in the Pennsylvania, New Jersey, Maryland (PJM) RTO over the
45 In reality there are range of different capacity market designs, an issue which will be factored into
the analysis in the next stage of the project.
42 FINAL REPORT
period 2007 to 2011. In terms of scale, the figure for 2011 represents just under
10% of the peak load of 160,000 MW46 managed by the PJM.
In terms of provider, a reported 82 percent of all PJM demand response is provided
by data aggregators47. While the PJM is a leading proponent of demand response,
the situation is similar in the neighbouring regional wholesale markets of New
York (NYISO) and New England (NEISO). The picture is somewhat different in
the western states with markets such as California (CAISO) attracting a lower level
of demand response.
Figure 3-2 Performance of incentive based demand response in the PJM wholesale
markets (RAP, 2013)
The figure above also sheds light on the type of incentive-based demand response
which could be expected in the EU over the coming years of demand response is
promoted. With regards to the PJM, the demand side appears to be interested more
in providing capacity and balancing/reserves and less in providing energy to be bid
into the spot market. As mentioned above, one of the main understood reasons for
this is the perceived need of demand side for the regular monthly capacity or
reserve payments which long and short term flexibility markets provide and the
relatively low likelihood of being called upon to deliver. Indeed, one of the main
understood reasons for the relatively low level of demand response in California is
the absence of a capacity market.
It must be kept in mind that such demand response has not occurred naturally
through the actions of market participants; it has required state intervention through
targeted Department of Energy policies and federal regulatory rules of 'orders'
requiring that demand response is properly rewarded.
46 Regulatory Assistance Project, Demand response as a power system resource: program designs,
performance and lessons learnt in the United States, May 2013. 47 Smart Energy Demand Coalition (SEDC), Mapping demand response in Europe today, September
2015.
STUDY ON DOWNSTREAM FLEXIBILITY, PRICE FLEXIBILITY, DEMAND RESPONSE & SMART METERING
43
While capacity and flexibility payments to demand response participants are
relatively uncontroversial, there has been a considerable amount of discussion on
how to compensate demand bids in the spot market. In simple terms, some (namely
FERC) advocated compensation based on the spot clearing price while others
representing electricity generation companies said that such a regime would
overcompensate such bids and would be economically inefficient. This issue was
the subject of a federal court case and in 2014, the future of demand side energy
bidding in wholesale markets was put into question. This was not addressed until
early 2016 when the federal court ruled in favour of the FERC position. It should
be noted that, despite the level of discussion energy market demand biddings has
generated, the capacity and flexibility markets remain the main source of demand
participation; demand participation in the spot markets remains relatively low.
In the EU, certain countries with longer term capacity markets in place such as
Ireland and France have been successful in attracting a certain level of incentive-
based demand response. Indeed, it is less likely that such demand response would
be available in both countries without these capacity payments. Concerning energy
market bids, though it is early days, low levels of participation in Belgium and
France would appear to reaffirm the experience in the USA that capacity and
reserves/balancing are more interesting for the demand side.
That said, there is not a direct relationship between capacity markets and demand
response as the UK has also introduced capacity markets but has not, to date,
attracted significant levels of demand capacity, at least not with regards to capacity
products spanning four years or more. Plans to auction one year products may in
future result in a greater level of demand response participation.
In the EU context, capacity markets remain national in nature and there are no
plans for EU regional capacity markets, even if the Commission is examining the
possibility of introducing a framework for cross-border participation in capacity
mechanisms as part of the energy union legislation to be adopted in late 2016.
While it is premature to speculate what form such a framework may take, it is
expected that open participation rules – including to the demand side – may be
included as a possible principle.
In terms of the status quo, in 2014, the ACER conducted a questionnaire-based
survey to assess the development of incentive-based demand response across the
EU. The table on the next page presents the main results.
44 FINAL REPORT
Text box 3-2 Member States' response to ACER demand response questionnaire – participation rules by product
Demand participation Existing Planned None
Wholesale
(energy)
markets
Participation BE, CZ, DK, FI, FR, HU, IE, IT, NL,
PL, PT, RO, SI, SE
AT, DE, LT, UK
BG, HR, CY, EE, EL, LV, LU, MT, SK, ES
On equal basis to generation BE, CZ, FI, FR, DE, IE, NL, PT, SE LT, UK
STUDY ON DOWNSTREAM FLEXIBILITY, PRICE FLEXIBILITY, DEMAND RESPONSE & SMART METERING
45
Text box 3-3 Member States' response to ACER demand response questionnaire –
participation rules by type of customer/response
Demand participation Existing Planned
Wholesale (energy)
markets
Energy efficiency measures NL
Embedded generation BE, FR, DE, NL
Time shift of demand BE, FR, LT, NL DE
Demand reduction BE, FR, DE, HU, LT, NL
Demand interruption BE, FR, HU, IT, LT DE
Balancing
Energy efficiency measures - -
Embedded generation BE, DK, FR, DE, IE, NL -
Time shift of demand BE, DK, FR, HU, IE, NL DE, UK
Demand reduction BE, DK, FR, HU, IE, NL, UK AT, DE, RO, ES
Demand interruption BE, DK, FR, HU, IE, ES, UK AT, DE, RO
Capacity
remuneration
mechanisms
Energy efficiency measures - FR, UK
Embedded generation BE FR, UK
Time shift of demand BE FR, UK
Demand reduction BE FR, UK
Demand interruption BE, ES FR, UK
The first thing that can be seen from the first table above on demand participation
is that there are a significant and growing number of Member States who self-
declare that wholesale and/or balancing markets are open to demand side response.
That said the majority of markets remain closed while only a few of those that are
open allow for demand aggregation. In terms of participation in capacity markets,
as there less than 10 Member States with such markets, the majority of these permit
demand participation. That said, even in these markets, there is still a reluctance to
permit aggregation. Also of interest is that those Member States which are open to
one form of demand response are open to most others (e.g. BE). Finally, the
questionnaire also treats the issue of how demand participates with most of the
open markets allowing for participation of embedded generation, time shift of
demand, demand reduction and demand interruption.
The inclusion of embedded generation is perhaps not surprising considering that
much of what is seen as demand response in the PJM and in certain Member States
of the EU (e.g. UK) is actually response by back-up generation. For example, in
2013 of the British National Grid's Short Term Operating Reserve (STOR), most is
provided by customers with distributed generation behind the meter; only a small
proportion is actually due to reduced demand48. One reason for this is that while
distributed generation can respond fast enough to qualify, demand reduction
sources of reserve capacity is often excluded as it takes time to come on-line (e.g.
more than 10 minutes). In the absence of automated control, extending such time
horizons and developing more flexible rules in general may be necessary to allow
for the increased participation of customers who can respond based for example on
48 Jacapo Torriti, Peak energy demand and demand side response, 2015.
46 FINAL REPORT
reduced heating and cooling. It is understood that a substantial amount of DR
resources in the USA is also sourced from embedded or distributed generation.
Ongoing challenges and proposed best practices
Overall, and in spite of considerable advances in recent years, advocates for greater
incentive-based demand response highlight a number of ongoing problems. These
problems are numerous and have been thoroughly examined at EU level by a large
number of stakeholders such as EURELECTRIC49, the Smart Energy Demand
Coalition, the Smart Grid Task Force50, the Agency for the Cooperation of Energy
Regulators, and the Council of European Energy Regulators (CEER)51, the
Regulatory Assistance Project (RAP) and other commentators.
As highlighted in the previous section, as there is broad political agreement on the
need for incentive based demand response and as it has been proven to be
successful in the US, the main challenge to its growth in the EU appears to be two
fold. Firstly, wholesale markets are currently designed to cater for large generation
plant and secondly that the regulatory or market governance arrangements which
shape such rules are shaped in a way which promotes the preservation of the status
quo and/or does not promote demand side participation.
While the abovementioned new and/or draft network and market codes, and related
EU reference models, being developed should improve the process, it is not yet
clear how the situation will evolve. This uncertainty is increased by the very slow
response of Member States to implement Article 15.8 of the EED.
Of the above stakeholders, the SEDC has published the most detailed analysis of
the challenges faced by incentive based demand response providers and how these
problems may be addressed. It has developed a set of regulatory requirements to
enable Demand Response, which are structured around four main criteria:
1. Enabling consumer participation
2. Creating viable product requirements
3. Developing measurement and verification requirements
4. Ensuring fair payment and penalties
Firstly, as regards enabling customer participation, the SDEC notes that this would
involve:
› Participation of demand-side resources in electricity markets should be
authorised;
› Aggregated load should be allowed and encouraged to participate;
49 Eurelectric, Designing fair and equitable market rules for demand response aggregation, March
2015. 50 Smart Grid Task Force/EG3 Report, Regulatory Recommendations for the Deployment of
Flexibility, January 2015. 51 CEER, Advice on Ensuring Market and Regulatory Arrangements help deliver Demand-Side
Flexibility, June 2014.
STUDY ON DOWNSTREAM FLEXIBILITY, PRICE FLEXIBILITY, DEMAND RESPONSE & SMART METERING
47
› Demand side competes on a level playing field.
With regards to the first two aspects, these are seen as necessary. The last aspect –
a level playing field – in SDEC's view requires the introduction of a standardised
framework which covers four main elements which allow the market to function
reliably while allowing consumers to choose their aggregation:
› Volumes: Standardised processes for assessment of the traded energy
between the BRP and the aggregator.
› Compensation: A price formula to calculate the price for the transferred
energy. In the case of demand reduction, the aggregator pays the BRP; in the
case of demand enhancement, the BRP pays the aggregator. This price
formula should reflect as closely as possible the average sourcing costs of
the energy transferred.
› Data exchange: A clear definition of what data needs to be exchanged
between BRP and aggregator to ensure both can fulfil their obligations
whilst not having to share commercially sensitive information.
› Governance structure: An appeals process and an appeals body, in case any
issues need to be resolved.
It is interesting to note that while the SEDC propose both direct communication
and compensation between the demand aggregator and the BRP, the practice in
France is to avoid – in part for competition reasons – direct communications
between both types of market participants; the practice in France is to work
anonymously through a neutral demand response operator. Another important
difference is that while the SEDC proposes that payments be paid on the basis of
purchased energy, the practice in France is for payments to be based on regulated
rates.
The second set of criteria relates to how specific market product requirements can
impact demand response participation. The SDEC suggests that while genuine
system constraints and security concerns must be respected, many different
product/ programme participation requirements were historically designed around
the specifics of generators. In line with the top half of the figure below (developed
by demand aggregator company EnerNoc), it claims that rules on resource
availability, event triggering, advanced notice, event duration and event limits
favour generation companies.
48 FINAL REPORT
Figure 3-3 Market design issues impacting incentive based demand response52
Thirdly, proper measurement and verification is essential for three aspects of
demand response:
› To qualify potential resources against product specifications as an entry gate
to participation
› To verify resource conformance to the product specifications during and
after participation.
› To calculate the amount of product delivered by the resource as part of
financial settlements.
This requires (i) baseline methodology metering configuration, (ii) product
delivery, (iii) communication requirements, (iv) frequency of interval readings, (v)
accuracy standards (vi) timeliness of measurement data and communication
protocols. Essentially this involves three inputs. First, customer-specific dynamic
baselines are required53. Secondly, the availability of smart or interval metering
capable of regular two-way communication is also needed. Finally, the
communications between the participant or his/her aggregator and the market is
also required.
In line with best practice in the US, none of these issues should in theory pose a
problem. Dynamic baselines have been developed for customers in a range of US
regions, smart metering has been rolled out to almost a third of customers while
52 Smart Energy Demand Coalition (SEDC), Mapping demand response in Europe today, September
2015. 53 See the following for more information on baselines: http://www.enernoc.com/our-resources/white-
papers/the-demand-response-baseline
STUDY ON DOWNSTREAM FLEXIBILITY, PRICE FLEXIBILITY, DEMAND RESPONSE & SMART METERING
49
communications between small as well as large wholesale market participants have
been facilitated at least cost. That said, the level of controversy generated in the
USA on incentive based energy demand response would suggest that care is needed
in designing participation rules.
Finally, the regime for payments and penalties should be fair and transparent. This
comprise three aspects:
› The market should be transparent so that generation and demand are
rewarded in an equitable manner. This relates primarily to the level of
information on Payment criteria, volumes and values provided by the market
operator
› The market structures should reward and maximise flexibility and capacity
in a manner that provides investment stability. While the demand side
industry (SEDC) does not come down in favour or against long term
capacity markets, it does state that flexibility and capacity should be
rewarded. It also notes that services provided should be at market clearing
(rather than at pay as bid)
› Penalties for non-compliance should be fair and should not favour one
resource over the other. The question is whether the penalty should be scaled
to the size of the nondelivered energy/capacity bid, which the demand
industry advocates.
The SEDC assessed 14 established EU and two non-EU electricity markets and
ranked them in accordance with the above criteria. The judgement criteria are
described in the box below.
Text box 3-4 SEDC typology and metrics with regards to barriers to incentive based demand
response
Sco
re
Consumer Access and Aggregation
Programme Description and Requirements
Measurement and Verification
Finance and Penalties
5 Aggregated load is accepted in a range of markets, standardised arrangements between involved parties are in place – enabled through an independent third party
Programme requirements adjusted to enable a range of resources (supply and demand) to participate in multiple markets
Requirements are well defined, standardised, proportionate to customer capabilities, and dealt with at the aggregated level
Payment is fair and penalties are reasonable
3 Aggregated load is accepted only in limited number of markets, lack of standardised arrangements between involved parties
Minor barriers to demand-side participation in market remain, however participation is still possible
Requirements are under development, but do not act as a significant barrier
Payment is adequate, but unequal per MW between supply and demand; Penalty structures create risk issues for service providers, but participation is still possible
1 Aggregated load is accepted only in one or two programmes, lack of standardised arrangements between involved parties
Significant barriers remain, creating major competition issues for demand-side resource participation
Requirements act as a significant barrier to consumer participation
Payment structures seem inadequate, unequal pay per MW between supply and demand, penalty structures create high risk issues
50 FINAL REPORT
Sco
re
Consumer Access and Aggregation
Programme Description and Requirements
Measurement and Verification
Finance and Penalties
0 Load is not accepted as a resource in any market
There are no measurement and verification rules for Demand Response participation
Payment structure inadequate and non-transparent; penalty structures act as a critical barrier
In short, the SEDC's list of best practices would be based on:
› Aggregated load being accepted in a range of markets and standardised
arrangements between involved parties put in place (enabled through an
independent third party)
› Programme requirements are adjusted to enable a range of resources (supply
and demand) to participate in multiple markets
› Requirements that are well defined, standardised, proportionate to customer
capabilities, and dealt with at the aggregated level
› Payment is 'fair' and penalties are reasonable
Interestingly, beyond stating that demand response should be allowed to participate
in for energy and capacity markets, the SEDC paper does not comment on what
fair payment means. Indeed there is no consensus amongst its members as to
whether the US based system of compensating collateral benefits should be
replicated in the EU.
Their overall results by Member States are presented in the figure below.
Figure 3-4 SEDC assessment of performance of Member States with regards to incentive
based demand response
STUDY ON DOWNSTREAM FLEXIBILITY, PRICE FLEXIBILITY, DEMAND RESPONSE & SMART METERING
51
As can be seen above, according to the SEDC, even those countries with the most
favourable market rules in place do not score highly on all issues. Therefore this
analysis would infer that market rules can be improved in all of the countries
surveyed. Also, the paper notes that progress towards greater demand response
cannot be assumed and that certain countries, in their opinion, such as Great Britain
are at risk of taking a step back.
While there are some inconsistencies between the results of the previously
described ACER questionnaire and the SEDC analysis, for the most the same
Member States appear as forerunners in both. This includes Belgium, Ireland,
France, UK and Finland, all of which have a need for new capacity, have
significant flexibility challenges due to phasing out of nuclear and/or high RES
penetration and so on. The main difference between the ACER study and the
SEDC report is that the latter does not discuss how the demand response is
provided e.g. through embedded generation, demand response etc.
As both of the above studies/reports focus on market rules, neither address
regulatory barriers in any great detail. These are rather covered in other more
policy oriented published by the CEER and the Smart Grids Task Force which
recommend inter alia that:
› The roles and responsibilities of all involved actors (market participants,
DSOs, TSOs etc.) should be clarified to be consistent with a level playing
field.
› All relevant actors (ACER, NRAs, MS, EC, ENTSOs) should continue to
ensure that the relevant network codes maintain a focus on promoting
demand-side equally to supply and other flexibility measures (e.g. Demand
Connection Code, Load Frequency Control and Reserves, and Electricity
Balancing).
3.3 Problem definition and status quo analysis
The above sections outline the status quo of price and incentive based demand
response across the EU, the main barriers to its growth as well as a number of good
or best practices identified by the main stakeholders. The aim of this final part of
Section 3 is to build on this background information to fully define the potential
role of the European Union in tackling these barriers.
3.3.1 Problem definition
The problem definition, as well as identification of underlying drivers, is essential
to any impact assessment as it presents the reasons why EU policy makers should
or should not intervene, why action is required and why it should be the EU that
takes it. The problem definition is used to inform the specific objectives and policy
options put forward in the next section.
52 FINAL REPORT
Presentation of the main problems
In line with the Better Regulation Guidelines, the definition of the problem is
presented in five steps: (i) defining of problem and negative consequences, (ii)
assessing the magnitude and EU dimension of the problem, (iii) outlining the
underlying causes and drivers, (iv) identifying the stakeholders affected and (v)
describing how the problem is likely to evolve with no new EU intervention. The
table presents the draft outcome of these steps with regards to demand response.
Table 3-1 Identification and description of the problem
Issue Demand response context
Defining the problem and its negative consequences
The EU's electricity sector needs more flexibility to enable it to accommodate the significant growth in variable/inflexible RES seen over the last 15 years and as well as in anticipation of the impact which electric vehicles (transport; 32% of EU energy demand) and heat pumps (heating and cooling; 50% of EU energy demand) will have on electricity consumption and peak demand growth in the next 30 years. The Commission notes that less than 10% of the EU demand response potential is utilised (SWD 2013, 442 Final). A number of barriers currently exist which make expanding beyond this 10% more difficult. Failure to do will result in greater curtailment of variable RES, missed targets, greater system management problems, and higher costs overall. In terms of alternatives, while demand response is the most immediately available and may actually be the cheapest flexibility option, other options include storage and better interconnection. That said, and although these can be substitutes for as well as complements for demand response, demand response appears to be the least cost option at least in the short and medium term during the period when these alternatives are not yet commercial. Either way, a failure to create flexibility will lead to significant curtailment of RES and/or increased generation and network costs.
Assessing the magnitude and EU dimension of the problem
Therefore, given the growth in variable RES on the system in the EU, in terms of system security and investment, it is likely that the need for flexibility services will grow and not diminish. As market power and price formation are linked to inflexibility, competition is also an issue. The question therefore is whether the growth in demand (and supply) flexibility which has been seen over recent years would be enough to cover such needs, and therefore negate the need for additional policy measures. Costs of duplication with other alternatives is also a consideration. Finally, the case for EU versus national action is weighed in favour of the former given the potential positive impact which incentive based demand response can have on the EU cross-border wholesale markets. The EU case for price based demand response is still there (e.g. allowing for customer choice), though it less convincing that action needs to be taken at EU rather than national level. The business as usual situation is described in the next section on Options.
Identifying the causes ('drivers') and assessing their relative importance
Within the context of highly regulated electricity markets, there are a number of technical, market and governance barriers to both price and incentive based demand response which can be addressed through public intervention. These are addressed in the next subsection on problem drivers.
Identifying the relevant stakeholders
The parties affected are those who bear the costs and benefits of the business-as- usual situation as well as any efforts to change it. This list includes Customers (industrial, commercial and domestic), network/system market operators (e.g. TSO and DSOs), national regulatory authorities (NRAs), existing electricity market participants (generators and supply companies), independent demand response providers such as demand aggregators as well as providers of smart metering and home automation services etc. Given the existing internal market rules, the types of stakeholder are expected to be broadly the same across the EU-28. The distributional impact may depend on the product involved with demand response in capacity programmes potentially resulting in higher market operation costs and demand response in energy programmes impacting vertically integrated companies. Overall, the distribution impacts will be assessed in the analysis of costs and benefits of the options which will be presented in the second intermediate report.
STUDY ON DOWNSTREAM FLEXIBILITY, PRICE FLEXIBILITY, DEMAND RESPONSE & SMART METERING
53
Issue Demand response context
Describe how the problem is likely to evolve with no new EU intervention
In line with the terms of reference, smart metering, dynamic pricing and the removal of wholesale market and regulatory barriers may be needed to address these problems. With regards to smart metering, although the majority of customers will have these meters (72%) by 2020, it will not cover all (the other 28%) and some of those covered will lack the right level of functionality (circa 50% or less)54. This will reduce the demand reduction potential, at least for the next 15 years (the economic lifetime of such meters). Concerning dynamic pricing, a minority of customers – in particular domestic and SMEs – do not have access to dynamic tariffs which reflect underlying costs and hence do not response as they could. Therefore there is a lack of incentives to allow customers avail of the opportunities offered by smart meters. This situation may continue given low levels of competition at national level. Finally, in terms of wholesale market barriers, while the markets should continue to open up to demand side actors such as aggregators, it may do so at a suboptimal level and in a way which 'leaves' demand side participants outside of market structures or not able to access products which are tailored to generation plant, thereby leading to potentially discriminatory rules and additional costs for other market actors.
Identification of the underlying problem drivers
Even when a problem exists, it does not mean that public bodies should act. It
depends in part on whether the problem is due to, or driven by, market and
regulatory failures, in which case public intervention may be required. Specifically,
a policy intervention may be justified when 1) a market fails; 2) regulation fails; 3)
equity considerations imply the efficient outcome may not be the most desirable; 4)
behaviours are biased and individuals do not decide based on their own best
interests. The table below presents a selection of how these failures or
considerations are relevant in the context of demand response, and what type of
mitigation measure or response could be considered.
54 European Commission, Internal Note on Options for Retail Markets, December 2015.
54 FINAL REPORT
Table 3-2 Relevance of problem drivers, impact on form of demand response and potential mitigating action
Issue Demand response context Type of impact on demand response Type of possible mitigation action
Market failures Public goods Public goods such as system security/ reliability are typically undervalued by the market and hence are often under supplied in the absence of intervention/regulation. One reason for this is that customers may not be compensated for the full system value of their individual demand response actions. TSOs and regulators intervene by setting system generation adequacy levels and procuring short term reserve capacity/ balancing and sometimes long term capacity. However, greater incentives on the demand side to provide such services can help address this somewhat by increasing the efficiency of the spot market (through energy bids) and through decreasing the cost of procuring reserves and balancing energy (through more competition for generation).
This problem primarily relates to the wholesale market and hence to incentive based demand response. If the demand side is not properly compensated it will not participate in the market.
Ensure that demand side response can both participate in the market (all parts subject to technical feasibility) and is properly remunerated. Examine options to provide demand side respondees not just benefit from bill reductions but also the collateral benefit they provide to other market participants. Provide that the demand response action is factored into the price setting mechanisms.
Weak competition
The electricity sector is highly concentrated. Demand response can help strengthen competition by bringing more players into the market which decreases prices in particular during times when demand and supply are tight and significant price rises and spikes occur. It can also increase the responsiveness (or elasticity) of customers, which can help reduce market power.
This problem primarily relates to the wholesale market and hence to incentive based demand response. If demand response is discouraged, competition will have to be in the form of new electricity generation entrants or through regulation. The role of the demand side in checking market power is particularly important at times of system tightness/high peaks.
In addition to the above, actively ensure that demand response can be undertaken separately from other competing entities such as suppliers. Change regulatory incentives for network operators so that they promote and do not compete with DR. Provide that the demand side can participate in all wholesale markets.
Imperfect / asymmetric information
Customers, who would otherwise respond, do not do so due to the fact that they lack the information on time-varying prices and capacity needs. Demand response measures, supported by smart metering and two way communication between wholesale market entities (suppliers, aggregators) as well as prices reflecting actual wholesale and network costs, can significantly help bridge this information divide and reduce transaction costs. This of course requires that such measures are cost effective!
As larger customers typically have a high level of awareness of their electricity usage – added by customised contracts and interval metering – this issue mostly concerns price based demand response by smaller customers.
Ensure that all customers who want it can receive, in a timely and economic manner, information on usage and prices; and that they can avail of least cost smart metering and other services to do so. Explore the possibility of also allowing suppliers and demand aggregators to provide smart meters or complementary devices (in addition to or instead of DSOs). (Care should of course be taken that such action does not lead to knock-on costs elsewhere)
Split incentives
Electricity suppliers provide customers with advice on how to save energy. However, it is also in their interest to sell more energy against peak prices. This is particularly the case for integrated generation-supplier companies. The entry of independent
Both problems affect both price and incentive demand response as suppliers active in both wholesale and retail markets and TSOs and
As above with 'weak competition', ensure that demand response can be undertaken separately from competing entities. As regards network/market operators ensure that they are not just mandated but also incentivised to (at least not discouraged from)
STUDY ON DOWNSTREAM FLEXIBILITY, PRICE FLEXIBILITY, DEMAND RESPONSE & SMART METERING
55
Issue Demand response context Type of impact on demand response Type of possible mitigation action
demand service providers can provide an alternative to this relationship. In terms of network operators, while demand response may help avoid network investment, they are often incentivised through CAPEX arrangements to invest. This includes incentives to invest in smart metering.
DSOs impact the functioning of the wholesale and retail markets.
to promote and facilitate demand response
Regulatory failures
Regulatory arrangements
It could be argued that certain actors such as integrated incumbents and other participants may not face the right regulatory incentives to promote demand response. This in part overlaps with both the 'weak competition' and 'split incentives' market problems. As such they may argue for a preservation of the current regulations or rules/ status quo. Regulatory governance arrangements as well as tariff rules may be used to this end.
Both price and incentive based demand response.
Allow for equitable access for demand aggregators wo wholesale markets without need to contract directly with suppliers. This would involve offering new types of products to attract demand response. It would also require allowing the demand side to active influence governance arrangements. Regarding network operators, these can be incentivised to promote demand response through increased business or legal separation as well as through revenue controls Provide that customers can avail of real time prices based on underlying varying costs, even if not offered by suppliers.
Poor implementation of rules
It could be argued that the various actors responsible for market design and operation already possess the means to enable demand response. The issue therefore lies in its implementation by national authorities, regulators and system/market operators.
Both price and incentive based demand response but given the importance of wholesale market rules primarily the latter. While EU rules are already in place to promote DR, their lack of implementation at Member State level means that DR is not being properly facilitated and promoted.
Increase supervision and reporting on all aspects of demand response (such as that undertaken by FERC in US as regards monitoring, adherence with demand response 'orders' and publication of annual reports on demand response and smart meters).
Out-of-date rules
Many of the enablers of demand response are relatively new. Therefore there is a question over whether or not electricity market rules reflect these developments or are geared to circumstances which were existing 10-15 years ago. These may have the effect of unnecessarily maintaining barriers to entry.
Both price and incentive based demand response but given the importance of wholesale market rules primarily the latter. Market rules needs to cater for demand side needs/specificities.
Linked to the 'regulatory arrangements' problem noted above, a regulatory review by each Member State could address this upfront and ongoing participation by demand side players in market governance arrangements should help ensure that rules remain up-to-date.
Equity considerations
There is a large size imbalance between electricity companies on the one hand who are quite large and energy service companies and consumers who are quite small. This means that the supply side companies, whose core activity is electricity, have the resources/means to participate in the market while demand side actors – who are less focussed on the electricity sector – face a number of barriers. One challenge is that different entities are not treated equally. In addition, even where they may be treated equally, the rules have been designed with large generation plant in mind and hence may not be equitable. There is also a divide between
Both price and incentive based demand response, but particular important for the latter. Rules made for existing large generation companies will discourage demand side players.
Again as noted above, simple equal treatment or a 'level playing field' may not be enough to encourage the participation of genuine demand response and not just distributed/embedded generation. There would be a need rather for the relevant tailoring of products to suit demand side so that participation is equitable (without of course discriminating against supply side actors).
56 FINAL REPORT
Issue Demand response context Type of impact on demand response Type of possible mitigation action
commercial actors and regulated monopoly entities, whereby the later have considerable leeway in setting rules. In some cases the energy incumbent also own regulated monopoly entities, but is separated by business separation rules (e.g. DSOs and incumbent suppliers controlled by same board).
Rules that are not aligned with market costs (e.g. imbalance costs) could distort the market. Finally, small customers need to be provided with timely and accurate information
There may also a need, where justified, for compensation mechanisms between actors for transfer of costs beyond their control (e.g. transfer of imbalance energy costs from aggregators to suppliers). Such a move may also possibly deter aggregators from increasing imbalances unnecessarily (moral hazard issue). Finally, as discussed above under asymmetric information, given that smaller end customers are neither used to nor have the time to undertake detailed research on wholesale prices, there is a need to ensure that customers can access price and demand information in a timely and easy manner.
Consumer behaviour
Customers are used to being passive recipients of electricity and hence are not used to responding to price signals. However, the advent of smart metering and associated dynamic pricing means that customers now have more control. That said they may not want to do so where they see themselves as being exposed to prolonged wholesale market price spikes. At the other end of the spectrum, customers may be inactive despite it being in their best interest to change tariff/ alter demand patterns. The need here is to facilitate this control, allay risk aversion and counter inertia.
Mostly price-based demand response but partially incentive based DR (e.g. any automation).
While defaulting customers to real-time pricing and roll-out smart meters to all may be the most effective way to promote price-based demand response, it may be unpopular; a middle way may be required to help manage risk aversion/free-riding on the one hand and information asymmetries/ inertia on the other. It may be more feasible politically to ensure that customers with distributed generation could face real time prices In addition, as one can only expect so much load shifting to take place through deliberate action, measures to promote automated load control could be examined. Who aside from the customer would trigger such automation would have to be clarified.
STUDY ON DOWNSTREAM FLEXIBILITY, PRICE FLEXIBILITY, DEMAND RESPONSE & SMART METERING
57
In terms of the overall importance of the problem drivers listed above, it needs to
be noted that all of the above problem drivers interact and cannot be seen in
isolation. That said, given the success of price and incentive based demand
response in the USA, it would appear that consumer behaviour and equity
considerations are very important but not pivotal. Therefore, market and regulatory
barriers appear to be of greatest relevance. In this regard, while market barriers are
crucial, many of these could be addressed through regulatory measures. Therefore
regulatory barriers may be the first priority area.
58 FINAL REPORT
4 Definition of objectives and policy
options
4.1 Introduction
In line with the ToR, the objective of this section is to build on the assessment of
barriers, and possible best practices presented above to specify 'three progressive
packages' of detailed policy options aimed at driving the deployment of both price-
and incentive-based demand response.
As each of the proposed options will comprise of several different expected
outcomes or measures, care will need to be taken to focus on those measures that
are feasible and most relevant. In line with the Better Regulation Guidelines, the
measures/options presented should be in line with specific objectives. Once a
preferred option (e.g. option 2) or sub-option (e.g. option 2b) is proposed and
discussed with the Commission, then the operational objectives can be outlined and
assessed.
As outlined in the study's terms of reference, the outputs of the task will include
detailed descriptions on the composition of the four options:
› Option 0: The business as usual – baseline scenario – that describes how the
problem will develop with no change in current policy.
› Option 1: Demand response is promoted by legislation that gives all EU
consumers access to dynamic pricing contracts.
› Option 2: Demand response is promoted by legislation that gives all EU
consumers access to dynamic pricing contracts and standardised EU market
rules for demand response service providers.
› Option 3: As Option 2 but where the demand response service provider has
the right to offer its services without compensation to the retailer/BRP.
This involves three steps:
› A description of how the specific objectives link with the problems defined
in the previous section;
› A draft definition of the policy options – e.g. what 'outcome' will be
considered under each broad option, what could the measure look like
STUDY ON DOWNSTREAM FLEXIBILITY, PRICE FLEXIBILITY, DEMAND RESPONSE & SMART METERING
59
including assumptions to be made/considered? This will include an initial
description of the BAU as well as of assumptions made and uncertainties
posed;
› A more developed or screened list of options/ measures to be possibly
brought forward for quantification in Task 3.
4.2 The general and specific objectives of demand response in the EU context
In line with Better Regulation Guidelines, once the problems and drivers have been
identified, the next step is to outline the objectives which are to be focussed upon.
As noted in the ToR, the general objectives in this area are ‘to improve the
economic efficiency of electricity consumption in the context of increased
intermittent generation and new energy technologies'. The terms also note that the
aim is to ensure that all customers, including households, and their agents should
be able to exploit the full potential of demand response and offer their flexibility to
the market, on a voluntary basis and for a reward.
Beyond these general goals, the more specific objectives to be developed could
potentially be to facilitate price-based and incentive-based demand response
through:
1. the promotion of cost effective access by smart metering and related
technologies
2. the substantial increase of availability and take-up of time varying,
cost-reflective tariffs
3. the removal of regulatory and market wholesale market barriers to
greater demand response in a sustainable and equitable manner.
4.2.1 Smart metering
The objective is to ensure that smart metering systems with the right functionalities
and interoperability are available to consumers. Such systems are the key
prerequisite for properly accounting for, and then rewarding, consumer's
involvement in demand response or the use of distributed energy resources.
Specifically this means giving each consumer the right to request the installation
(or upgrade) of smart meters with all 10 common minimum functionalities
contained in the Commission's 2012 Recommendation at a cost to the consumer
which is reasonable and cost-reflective (as verified by NRAs). Here the NRAs
should also ensure a short waiting time for the installation.
While mandating the roll out in all 28 Member States by a certain date (e.g. 2025)
with 10 recommended functionalities either for all consumers or for consumers
above a certain consumption threshold is a possibility, we are of the view that such
a mandatory approach could contradicts previous legislation, namely the IED of
2009 and the EED of 2012, and hence be dismissed.
60 FINAL REPORT
This would mean that this option would consider a customer by customer 'roll-out'.
It would need to be assumed or checked that the cost per customer would be higher
given the lack of scale economies, perhaps increasing the per unit cost by up to 50
percent over the current €100 to €300 per metering point. As this may, however,
have the effect of deterring customers from requesting smart meters, one additional
objective could be to explore the need and feasibility of allowing competition (e.g.
to demand aggregation companies, suppliers, ESCOs, others etc.) in metering for
such customers (or allowing add-on devices). A key consideration here is to
include the political feasibility of such a move (given the DSOs current role in this
area in most Member States).
4.2.2 Time varying cost-reflective tariffs
Facilitated by the availability of smart metering, the main aim here is to help
customers shift or reduce their peak demand in a way which helps postpone/avoid
investment in the grids and in peak generation plant in the long term. Prices which
reflect underlying varying (and fixed) costs will ensure that grid users are
incentivised to behave efficiently and that accurate investment signals are
transmitted throughout the network.
With regards to network tariffs this may involve a targeted EU intervention on
distribution and transmission tariff structures to use time-dependent tariffs in order
to promote and facilitate demand response, as well as complementary activities
such as distributed energy resources and self-consumption.
Concerning end user supply tariffs, the aim is to ensure that consumers can obtain
the right to a supply contract with dynamic prices, covering only access to real time
prices as a minimum or to critical peak pricing and time of use tariffs as well.
Key considerations here concern (i) the proportionality of requiring suppliers –
who are competing in an open market – to offer certain types of tariffs, (ii) whether
it is possible to require that certain or all customers default to real time pricing, (iii)
possible flanking measures to help reduce customer aversion to real time prices
(e.g. caps, levelised bills) and (iv) the possible long term impacts on behind the
meter storage/distributed RES.
4.2.3 Incentive based demand response in the wholesale
markets
In addition to the abovementioned peak reduction investment benefits, incentive
based demand reduction helps provide reliability services and improve price
formation. In practical terms, this means helping avoid price spikes to enable the
energy system to better cope with variable RES and new loads as well as to reduce
the need for reliability related capacity investments. On the ground this would
involve ensuring that market operators put in place suitable wholesale energy,
reserves/balancing and where relevant capacity markets which provide equitable
and tailored access to demand side resources.
STUDY ON DOWNSTREAM FLEXIBILITY, PRICE FLEXIBILITY, DEMAND RESPONSE & SMART METERING
61
In effect, this may mean establishing a market and regulatory framework that
ensures that the demand side is facilitated by regulators and market operators as
follows:
› a consumer has the right to choose an independent aggregator without the
supplier's permission e.g. consumer can have two points-of-contact
› the market operator caters for the needs of the demand side e.g. through
tailored participation rules including lower thresholds, fair access to
equitably designed and tailored energy, reserves/balancing and where
relevant, capacity markets
› entry, exit and trading rules are made in a neutral manner through
representative and transparent governance arrangements e.g. the demand
side can participate in wholesale market decision making; entry and exit is
fast and low cost in terms of deposits etc.
› the roles, responsibilities and the liability of the different actors are fair and
clear
› that the information flow among market actors and network operators is least
cost and timely e.g. demand aggregators should not have to pay large sums
to communicate with TSOs/DSOs; arrangements put in place should be
proportionate/scalable to size of entity
› that, where needed, standardised contractual and compensation arrangements
– including dispute resolution procedures - run by or under the supervision
of the regulator are in place
› finally, that such information flow and contractual arrangements are in line
with competition considerations
It may also require that demand side participants are incentivised via:
› prices which reflect the full value of their actions, including the social or
collateral value if appropriate e.g. demand side bidding is rewarded for its
impact on the market as a whole and not just by its own avoided costs
› the benefits are passed onto customers through clear application of customer
protection rules to demand aggregators as well as to suppliers
Source: Kreuder (2013), Feuerriegel (2013), Klobasa (2010), Pihala (2005) and own calculations
The assessment of the shift duration and activation costs is used to estimate the
benefits of demand response in Section 5.10. The data also feed into the demand
curves described in Section 6.
5.2.4 Cost of smart meter installation
The roll out of smart meters are also a precondition for realising the demand
response. In most Member States, the roll out has been planned or is being
implanted already. Based on the cost-benefit analyses (CBAs), Member States have
decided on the roll out. The CBAs have shown that there are many benefits of
smart meters and therefore not all the costs should be included this assessment. For
the Member States that have decided on full-scale smart meter roll out, no costs are
included in the BAU. For the assessment of the options where additional meters
might be installed, the following assumptions are applied. The costs per meter
point is based on the average costs for the Member States where additional meters
might be installed. The costs is 279 EUR per meter point66. It is then assumed that
half of this cost is attributed to other benefits (for example lower costs of meter
readings). The meter cost is then annualised assuming a lifetime of 15 years.
66 Calculated based on data from the CBAs, see AF Mercados EMI and NTUA, Study
on cost benefit analysis of Smart Metering Systems in EU Member States, Final
Report, 2015.
78 FINAL REPORT
5.3 Price based demand response
The previous section has considered the theoretical demand response potential
available across EU Member States. This section estimates price-based DR
building upon this theoretical potential and other data for the following periods:
Current price-based DR (2016)
Future periods – namely 2020 and 2030 based on a business-as-usual
scenario
The same future periods of 2020 and 2030 under Policy Option 1.
Previous sections of this report have defined price based demand response as the
capacity of customers to response to price signals which reflect underlying and
varying costs. The forms of price based DR of most interest for this analysis are the
use of 2-, 3- or more part time-of-use (ToU) tariffs that fundamentally reflect the
cost of supply, real time pricing (RTP) and critical peak pricing (CPP). While there
are several examples of traditional ToU tariffs (day/night tariffs etc.,) that are
associated with load shifting, these are of less interest for policy purposes as it is
unclear that they have strong economic rationale.
This section estimates price-based DR across the EU-28 for the various periods by
considering a number of critical variables:
The potential load that is conducive to shifts when customers receive
appropriate price signals.
The spread of smart metering systems and in particular the spread of smart
meters with appropriate functionality for price based DR including 2-way
communication with the service provider.
Customer take up of new forms of ToU pricing, RTP and dynamic tariffs.
Changes in customer demand patterns where they are subject to new forms
of pricing.
5.3.1 Existing price based DR
Section 3.2.2 has outlined that the vast majority of EU customers have access to
tariffs that vary to some extent by time. These tariffs are distinguished by only
requiring basic metering technology, and by not necessarily reflect underlying
network or retail supply costs. Time based tariffs were typically introduced in the
1970’s or 80’s for customers with significant off-peak uses of electricity, including
space heating and hot water storage, with an important distinction between day and
night uses.
Despite the long history of two-part tariffs there is only fragmentary evidence of
the amount of demand that has actually been shifted from peak to off-peak periods
STUDY ON DOWNSTREAM FLEXIBILITY, PRICE FLEXIBILITY, DEMAND RESPONSE & SMART METERING
79
in MS. This is not unsurprising as it is difficult to effectively estimate the impact of
two-part pricing due to:
The lack of a clear counterfactual,
The possibility of self-selection bias – that is customers with greater
demand in off-peak periods are those who choose the 2-part tariff,
The tying in of ToU tariffs with other forms of load control (e.g., pre-
setting heating appliances by utilities),
Limited studies undertaken by utilities, and general difficulties in
performing empirical studies of simple ToU tariffs. Torriti (2015) notes
that a problem with econometric analysis considering price variables is that
the only statistically significant predictor of consumption is past
consumption67, and
The relatively raw nature of the metering data.
In practice, the extent to which load been shifted depends upon:
The amount of customers who take up two- or multi-part tariffs,
The price differentials between peak and off-peak, and how these relate to
fixed price tariffs on offer; the greater the difference between the single
part tariff and the peak rate of a 2-part tariff, the greater the risk of paying
more on the 2-part tariff; while at the same time the greater reduction on
offer in the off-peak period will provide stronger benefits to shifting load
to off-peak periods, and
The availability of appliances conducive to load shifting based under
simple (traditional) metering technology.
Traditional two-part tariffs are not necessarily efficient. These tariffs are generally
fixed well in advance, without any reflection of the actual situation in the market,
meaning that it may be a fortunate coincidence when the tariff reflects the
underlying wholesale or network costs. Reflecting this weakness, more market-
based TOU tariffs are being offered in some MS consistent with the spread of more
advanced metering technology. A summary of the status of price based approaches
by MS – including both traditional and market-based ToU tariffs - is set out in the
table below.
67 Torriti, Peak Energy Demand and Demand Side Response, 2015, p.84.
80 FINAL REPORT
Table 3 Status of Price based DR in MS
Member
Spot prices (Real time)
CPP TOU Comments
Austria X X EVU offers TOU, specifically Day-and Night tariffs68.
Belgium X X Peak, off-peak and real time tariffs are offered, though smart metering uptake is limited.
Bulgaria No reported price-based DR. According to the Bulgarian NEEAP, dynamic tariffs will be introduced in the future.
Croatia X No price-based DR reported.
Cyprus X TOU tariffs are theoretical available for domestic, commercial and industrial customers. Not for public light or water pumping customers.69 Market conditions for DR not considered applicable.
Czech Republic
X TOU tariffs are combined with load control, with space heating and water heating restricted to off-peak periods with lower tariffs. The DR can be seen as more administratively determined than price based. However, the Ministry will be introducing new tariffs, which relax the control arrangements, allowing customers to optimise behaviour70.
Denmark X ToU is available for customers with hourly metering, and mandatory for those customers connected to grid with a voltage level of 10 kV or higher71 . Focus is on future enabling price-based DR through smart meter rollout and dynamic tariffs.
Estonia X X Off-peak tariffs and real time tariffs are available. However, limited motivation to participate in DSR schemes reported.72
Finland X X TOU are commonly used and are combined with smart meters. They are offered to all customers and they are mandatory for large customers.73
France X X System of ToU tariffs in place for more than 40 years. Selection of available tariff schemes (peak and off-peak, Tempo tariff (CPP tariff)).
Germany X X Mostly Peak (day hours) and Off-peak tariff (night hours) – system considered in need of redesign, given increase of RE in the energy mix. Consumers > 10 GWh receive tariff discount for maintaining a flat load profile.
Greece X ToU tariff available. Impact unclear
Hungary X ToU available: In addition, "ripple control" provided for some loads.74 Load shifting more control- than price- based.
Ireland X ToU tariffs offered, with different load profile for those on the tariff reported. However, unclear the extent to which price has influenced the shift.
Italy X Full smart meter roll out and on-peak and other TOU tariffs are available. However, the differences in peak and off-peak prices is minimal and not reflecting underlying variations in wholesale and network costs.
Latvia X Off-peak tariffs are available, but few incentives exist in distribution or TSO tariffs
Lithuania X Tariffs are differentiated between day and night.
68 Kollmann, A. et al., 2013, Lastverschiebung in Haushalt, Industrie, Gewerbe und
kommunaler Infrastruktur – Potenzialanalyse für Smart Meter – Loadshifting 69 AF Mercados, 2015, Study on tariff design for distribution systems. 70CEER, 2013, Regulatory and Market Aspects of Demand-side Flexibility,
C%20CONSULTATIONS/ELECTRICITY/Demand-side_flexibility/RR) 71 Thema Consulting Group, 2014, Demand Response in the Nordic electricity market.
Input to strategy on demand flexibility 72 Pöyry, 2015, Demand Side Response as a source for flexibility. Available under:
http://elering.ee/public/Infokeskus/Demand_Side_Response_as_source_for_flexibility.pdf 73 Thema Consulting Group, 2014, Demand Response in the Nordic electricity market.
Input to strategy on demand flexibility 74 Mavir, 2016, Available under: : https://www.mavir.hu/web/mavir-en/code-of-commerce
STUDY ON DOWNSTREAM FLEXIBILITY, PRICE FLEXIBILITY, DEMAND RESPONSE & SMART METERING
81
Member
Spot prices (Real time)
CPP TOU Comments
Luxembourg X TOU tariffs are available.
Malta For non-residential larger consumers there is a day- and night tariff.
Netherlands X X X TOU, CPP, Real Time Pricing and Peak Time Rebate (PTR) are already an option. SEDC reports effective price based reponse by green-house owners.
Poland X ToU Tariff available
Portugal X Consumers have access to dynamic prices (since 1997), but most consumers chose flat tariffs.
Romania X Seasonal and on-peak tariffs are available.
Slovakia X Smaller consumers do not participate in DR (legally allowed, but probably due to the lack of technology). Larger consumers participate mostly through incentive-based contracts.
Slovenia X X TOU and CCP are applied in Slovenia, and they are established under Article 98 of the "Act on the methodology determining the regulatory framework and the methodology for charging the network charge for the electricity system operators”. The introduction of intelligent metering is outlined as a key factor for the participation of consumers in network efficiency in the Slovenian NEEAP.
Spain X TOU are offered. Wholesale price pass through tariffs apply to some customers - might differ on a daily basis as the share of the electricity part of the tariff reflects the daily wholesale price formation.
Sweden X TOU are offered to all customers by some grid companies. Mandatory for customers with main fuses above 80 A75. Focused on enabling price-based DR through smart meter rollout and dynamic tariffs.
UK X ToU tariffs exist for small medium consumers (e.g. Economy 7 and Economy 10 tariffs) and I&C sector (TNUOs charges (Triad avoidance)).
Sources: Various, including the on-going work of JRC (2016)
In general, the above table does not suggest widespread shifting behaviour from
ToU tariffs. As data on price based DR is not readily available, experiences in
selected MS geographically spread across Europe, and with a mix of existing
practices, are considered to see if it is possible to develop a representative estimate
of price based DR at an EU-wide level. The countries considered are:
UK
Germany,
Spain,
Finland, and
France.
United Kingdom
ToU tariffs have been in place in the UK since the 1970s for smaller consumers. In
2015 around 13% were subscribed to TOU tariffs,76 most of them on the Economy
7 or the Economy 10 tariff. Key features of these tariffs are as follows:
75 Thema Consulting Group, 2014, Demand Response in the Nordic electricity market.
Input to strategy on demand flexibility. 76 Fell, M. and others, 2015, Is it time? Consumers and time of use tariffs.
82 FINAL REPORT
“Economy 7” – offering lower electricity tariffs for 7 hours at night
(mainly targeting night storage heaters) – the difference between peak and
off peak tariffs is generally in the range of 1.5-1.8.
“Economy 10” – offering off-peak tariffs in various blocks of 2, 3 and 5
hours. This tariff is not offered by all suppliers.
Both tariffs currently tend to be limited to consumers with electric resistance
heating. Moreover, they are gradually being phased out by suppliers.
There is limited research on the impact that price differentials in two-part tariffs
can have on load shifting. One of the more comprehensive studies is that of
Faruqui, which supports a non-linear relationship between the ratio of peak and
off-peak price. His research distinguishes between ToU pricing and dynamic
pricing. For ToU tariffs his estimated relationship shows roughly 5% reduction in
peak demand for a 2:1 ratio of peak to off-peak pricing.
Figure 3: Relationship between price differential peak/off-peak and peak reduction (TOU)
Source: Own elaboration, according to Faruqui, Ahmad. “Arcturus.” The Brattle Group.
In the case of dynamic pricing, observations are largely concentrated in larger peak
to off-peak price ratios. For a price ratio of the order 6-8, a peak reduction of 12-
15% is estimated.
STUDY ON DOWNSTREAM FLEXIBILITY, PRICE FLEXIBILITY, DEMAND RESPONSE & SMART METERING
83
Figure 4: Relationship between price differential peak/off-peak and peak reduction (Dynamic)
Source: Own elaboration, according to Faruqui, Ahmad. “Arcturus.” The Brattle Group.
Faruqui´s numbers need to be treated with caution given that much of the evidence
– particularly for dynamic pricing - is from trial data with customers notably
incentivised to participate.
Applying Faruqui´s figures to the UK, where a price differential for Economy 7
and 10 of roughly 1.7 is observed, suggests a peak reduction of around 4%. If this
is combined with the fact that only 13% of smaller customers have these tariffs, the
reduction in peak demand resulting from these tariffs would be little more than
0.5% of the residential component of the peak.
In the UK, larger consumers are equipped with advance meters or smart meters that
allow half-hourly meter readings, and which permit tariffs ranging from half-
hourly real-time wholesale pricing, to static TOU tariffs. There is currently little
evidence of large time-based differentials in tariffs, which suggests that peak load
shifting may not be significantly higher than for residential customers. While any
estimate of the total price-based impact is subject to value judgements, on the
whole a total shifting of no more than 1% of peak load appears plausible.
Germany
ToU tariffs have been available for smaller consumers since the 1970s. The
predominant availability of particular tariffs is set out in the table below. However,
it is not known how many suppliers currently offer a ToU or dynamic tariffs. In
84 FINAL REPORT
2013, 76 % of the electricity suppliers offered some kind of time-varying tariff77,
yet most of them only offered a two part tariff with different tariffs for day and
night hours.
Figure 5: Map of TOU in Germany
Source: Ene’t GmbH, 201178
Grey: Night-and Day time supply tariffs, Turquoise: 2-part tariff, Dark blue: 2-23 part tariff
The most common tariff provided by regional suppliers to smaller customers is the
off-peak supply tariff (night-time electricity supply tariff), which is aimed at
storage heaters. However, over time the availability of this tariff is declining, while
at the same time prices are converging between peak and off-peak periods. The
other types of tariffs (Turquoise: 2-part tariff, Dark blue: 2-23 part tariff) are less
common. Moreover, generally the difference is just a few cents per kWh and thus it
does not have a great effect on load shifting.
77 Bundesnetzagentur & Bundeskartellamt, 2014, Monitoringbericht 2014 78 Ene’t GmbH, 2011, Anzahl der Versorger mit Smart-Meter-Tarifen seit Januar
verdoppelt. Available under: https://www.enet.eu/newsletter/anzahl-der-versorger-mit-
smart-meter-tarifen-seit-januar-verdoppelt
STUDY ON DOWNSTREAM FLEXIBILITY, PRICE FLEXIBILITY, DEMAND RESPONSE & SMART METERING
85
At the same time, fewer people are using storage heating, as Government has taken
explicit decisions not to subsidise storage heating due to environmental reasons.
These factors indicate that the estimated load shift for smaller customers will be
low and probably comparable to the level of the UK.
The JRC (2016) reports that larger customers make greater use of on- and off-
peak, and even real-time tariffs. However, there is limited evidence of customers
shifting to off peak periods to reduce their energy costs. Moreover, Government is
opposing the continued use of simple TOU tariffs on the grounds that they do not
reflect environmental costs, nor changed conditions in the wholesale market due to
the wider spread of renewable energy.
Based on the UK benchmark above, the amount of peak load shifting is also likely
to be less than 1%.
Spain
In Spain the main regulated tariff for households (< 10kW) is the PVPC tariff.
Around half of all households were supplied under this tariff in 2015, while the
other 50% were supplied by free market electricity retailers.
The share of the electricity components of the final PVPC tariff is calculated on a
daily basis based on the wholesale market price formation. The full wholesale price
is passed through to the consumer.
Figure 6: Time-of Use tariff for small consumers in Spain
Source: Red Electrica de España, 17 May 2016
Electricity consumers under the regulated PVCP tariff can choose between the
standard tariff or the two-part tariff, independently if they have a smart meter
installed in the house. For households without smart meters, an hourly price is
determined based on a standard consumption profile used by the TSO. In the
example shown from 17 May 2016, the lowest tariff during the day was 0,039 €/
kWh and the highest tariff 0,121 €/kWh at 21:00h, resulting in a ratio of around
3,1, much greater than that of the Economy-7 tariff in the UK.
86 FINAL REPORT
The above tariffs are new and relatively innovative, and expose customers with a
smart meter and who have not signed a supply contract to pool price volatility.
However, there is no evidence that customer behaviour is being influenced to date
by these tariffs – partly as they are new and partly as customers on a default tariff
are typically less responsive to price changes. Moreover, participation in ToU
tariffs in Spain is traditionally low for various reasons:
The electricity part of the tariff is relatively low – accounting for around
40% of the bill, with the remaining largely invariant to usage.
Generally, customers are able to save more money by contracting a tariff
that limits the total capacity than altering consumption patterns.
The Ministry of Energy reports that as of 2014 there was 1300MW of price based
DR from customers on ToU tariffs and with contracted demand <15kW and
1000MW for large industrial customers79. However, these figures, which imply a
5.5% shift in peak demand, appear unrealistic compared with customer-level data
on ToU tariffs. On the whole the evidence suggests that the extent of price-based
demand response is no higher than in UK or Germany, and potentially lower due to
the lower spread of space heating.
Finland
ToU tariffs are commonly used in Finland. Since the 70s, large price variations
between day and night have given Finnish households an incentive to install the
necessary equipment to move a large share of their electrical consumption from
day to night. In particular, there is a very large DR potential in the form of space
heating installations and large water tanks. Moreover, smart meter installation, the
time switch, water based heat distribution and tanks for accumulating and storing
heat makes it possible for Finnish households to take advantage of price differences
to lower their total electricity costs (Toivonen, 2013).
The following figure illustrates how Finnish households with electric heating
exercise their flexibility by moving their electricity demand from day to night.
Residential buildings without electric heating have a normal load profile, with their
largest demand occurring during the daytime, while that of buildings with electric
heating have the largest demand during the nightime.
79 Planificación Estratégica: Plan de Desarrollo de la Red de Transporte de Energía
Eléctrica 2015-2020, Ministerio de Inustria, Energía y Turismo, Gobierno de España
STUDY ON DOWNSTREAM FLEXIBILITY, PRICE FLEXIBILITY, DEMAND RESPONSE & SMART METERING
87
Figure 7: Load profile of residential customers in Finland
Source: VTT (2007)
The total impact of the load shifting is uncertain. Research by THEMA (for Nordic
Energy Research in 2014) suggests that approximately 90,000 villas have heat
storage that each comprise between 9-19kW (average around 12kW) from peak
hours to the nightime. In total this suggests around 1000MW may be taken away
from peak load in Finland – potentially as high as 6% of winter peak demand. In
fact, other studies suggest an even higher load shifting: the IEA (2011) reports
2000MW load shifting by the programme affecting up to 15% of peak demand.
However, in the Finnish case ToU pricing needs to be seen in the context of a
package with heat storage and load control system.
The Finnish experience is not directly applicable to other Nordic countries in the
EU. For example, there are no similar examples of load shifting in Sweden as
Sweden relies mainly on district heating. Furthermore, while there are a lot of
homes with electric heating – though not at the same scale as in Finland - they do
not have heat storage. In the case of tariffs there are conflicting signals regarding
price sensitivity – on one hand the volume of customers taking variable energy
prices is increasing, while the fixed component of grid tariffs has been gradually
increasing since deregulation.
France
France is an important case study as it provides examples of CPP. Électricité de
France (EDF) offers different tariff options for small/ medium consumers: a
standard tariff, a two part tariff with 8 off-peak hours per day, and the EDF Tempo
tariff.
The Tempo tariff is available for private household consumers as well as small
business customers with a minimum capacity of 9kVA since 1995. The Tempo
tariff unites two pricing structures in a single tariff – TOU and event pricing which
adds up to a total of six price categories. The TOU part of the tariff divides each
day in peak (6h00 to 22h00) and off-peak hours (22h00 to 6h00). The CPP part of
the tariff sets the actual price/kWh for each day. The days are divided into red,
white and blue days as follows:
88 FINAL REPORT
Red days (0-22 days per year) – are the most expensive days. For the
period 2015/16, they could not take place from the 1st of November to the
31st of March. In addition, Saturday and Sundays cannot be red days.
White days (0-43 days per year) – are less expensive than the red days. In
principle they can be distributed throughout the year, but they rarely occur
between May and October. They cannot be on a Sunday.
Blue days (105-301 days per year)– all remaining days are blue days
(cheapest days). Every Sunday of the year is obligatory a blue day.
Each day around 5:30 pm the colour of the following day is published on the
webpage of EDF. The signal is also transmitted to the customer and displayed both
on their meter and on a small box which can be plugged into any power socket.
The table below displays the current Tempo tariffs80 and the ratio compared to the
blue day tariff for the red and white days.
Table 4 Tempo Tariffs after the 1st of January 2016 (c€/kWh)
Colour of the day Peak tariff Off-peak tariff Peak-tariff ratio
compared to the
blue rate tariff
Red 62,07 24,02 5,4
White 15,85 13,36 1,4
Blue 11,47 9,67 n.a.
Source: EDF, 201681
The tempo tariff is well designed for the French electricity market as electrical
heating drives peak consumption in France, and where peaks arise they generally
affect particular days than a few hours.
Studies have been previously undertaken to measure the effect of the tempo tariff
on the national consumption and peak load reduction in France82. The following
results were obtained:
80 They do not differ depending on the contracted capacity. 81 EDF, 2016, Option Tempo. Available under: https://particulier.edf.fr/fr/accueil/facture-
et-contrat/contrat/consulter-les-jours-ejp-et-tempo/option-tempo.html 82 Studies might differ, as parameters such as consumer partipation, the tariff ratios etc.
changed over time.
STUDY ON DOWNSTREAM FLEXIBILITY, PRICE FLEXIBILITY, DEMAND RESPONSE & SMART METERING
89
compared to the lowest price level, customers have been measured
reducing consumption by 15% on the second highest price level and by
even 45% on the highest price level83;
4% of national peak shifting84.
It is also reported that a further 6 GW was traditionally shifted daily by the day-
night tariff (with price differential currently around 1.46) that is offered to the 27%
(10 million households) of homes that have electric water heaters. Many consumers
have automated water boilers that are programed to response to tariff changes.85
However, many organisations, including the IEA believe that with the opening of
electricity supply to competition the amount of traditional demand side response
has fallen and is closer to 2 GW. A much lower value (than 6GW) is also
consistent with the response of some participants in the interview phase of the
project, who report that CPP and ToU have not been particularly successful,86 with
much of the benefit arising from controlling water heating and boilers.
Summary
In general, there is limited evidence of price based DR in the EU, and only in
specific situations, namely:
Where there is a big price difference between peak and off-peak prices,
and
There are appliances that permit customers to easily shift usage from peak
periods to off peak periods.
These conditions are most prevalent in Finland, where there is a sufficient
difference between on-peak and off-peak electricity prices, and many customers
have appliances like storage heaters and hot water tanks, that make it beneficial to
shift demand to off-period periods. Moreover, the system in Finland works with
smart meters, suggesting it can be more easily adapted to changed market
conditions – and hence is sustainable. The data from France also supports a higher
load shifting through traditional tariff means, though this traditional form of price
response has been declining dramatically in magnitude in recent years.
Where these conditions do not apply, customers appears less willing to change
behaviour under flexible tariffs, with a likely finding that customers are expected to
choose a ToU tariff where its existing load profile results in lower bills under ToU
tariffs.
83 Intelligent Energy Europe, 2013, European Smart Metering Landscape Report 2012 –
updated 2013. 84 Pöyry, 2012,Time of Use tariff Mandate. A Report to the Commission for Energy
Regulation. 85 Pöyry, 2012,Time of Use tariff Mandate. A Report to the Commission for Energy
Regulation. 86 This was the response of a French aggregator during the interview process.
90 FINAL REPORT
In some cases, for example, the Czech Republic (and to a lesser extent, Hungary),
significant load of around 2500MW (or between 10-15% of peak winter load) has
been moved to off-peak periods using ripple control systems, for which ToU tariffs
are applied. However, in this case, the load shift cannot be considered to be price-
related or even incentive based related as the shift is largely administrative in
nature.
As a high level estimate for EU, studies and data support current load shifting due
to price based DR ranging from negligible (most MS), to around 1% (most
Northern European Countries), 2.5% (France) and 6-7% (Finland). If a value of 1%
is applied for Northern European countries and those with some reported DR (e.g.,
Spain), 2.5% for France and 6% for Finland, the overall load that is shifted due to
ToU tariffs to date would be of the order of 5.7GW or 1.2% of peak load. This
estimate should be seen in the context that:
The vast majority of this shifting is not related to economic costs in the
wholesale or network segment of the market (Finland appears an
exception), and
Traditional static ToU tariffs are being phased out, and hence this limited
shifting may not be applicable once smart meters are installed.
As a cross check these values are compared with the Gils estimates of DR potential
as per section 5.2. The amount of price-based DR in Finland considered above is
around the Gils potential for the relevant consumption categories, which is
consistent with the Finnish system being well developed and run. The estimates
quoted for France are above the Gils benchmark, which may suggest that under less
rigid and more market-driven approaches a lower (but more efficient) price
response is likely. This conclusion is consistent with concerns in France about
likely further reductions in price based DR.
Note that as a proportion of the Gils potential the estimate of price-based DR in
2016 is around 9%.
5.3.2 Estimates of price based DR in future years
In developing estimates of price-based DR in future years – under both the BAU
and Option 1 scenarios - the following variables have been considered:
Demand susceptible to price-based DR.
Time profile of smart meter installation.
Customer take up of new tariffs.
Demand impact of ToU, RTP and CPP.
5.3.2.1 Demand susceptible to price based demand
response
In considering changes from policy measures, focus is placed on residential and
small commercial customers as it is assumed that most industrial and large
commercial customers have a smart meter in place, and are already eligible for
STUDY ON DOWNSTREAM FLEXIBILITY, PRICE FLEXIBILITY, DEMAND RESPONSE & SMART METERING
91
time-based prices. Moreover, larger customers are most likely to participate in
demand response through incentive-based measures. In this sense, the main
incremental impact that policy measures can have relate to residential and small
commercial customers. At the level of peak demand there is little data on
contribution by sector. However, at the EU-28 level, approximately 30% of energy
consumption is due to residential customers, and an additional 30% due to
commercial customers and public services.87 This suggest that if half of
commercial consumption is susceptible for price based demand response, and
consumption share approximates share in peak demand, then roughly 45% of total
demand is accounted for by residential and small commercial customer categories.
An estimate of the amount of demand that is susceptible to demand response is
taken from the database developed by Gils and described in the previous section.
Consistent with the above assumption, the total load reduction potential for price
based demand response by MS is taken as the sum of the potential for all categories
of residential load plus half that of the commercial consumption categories. As
stated, this estimate is simplistic, but as a reasonably similar share of commercial
demand is likely to participate through incentive-based means – and captured by
the subsequent analysis on incentive based demand response - the overall picture
should not be misrepresented unduly.
The following tables summarises the load reduction potential through price based
DR for 2016, 2020 and 2030 estimated using the Gils database. The estimate for
2016 is made using linear interpolation from the data for 2010 and 2020. This data
differs from that set out in the previous section as it includes only the following
components:
All residential and half of commercial load reduction potential.
Half of the proposed electric vehicle load reduction potential.
One-quarter of the proposed heat pump load reduction potential
Table 5 Estimate of residential and small commercial load reduction potential using
Gils (2015) data, 2016, 2020, 2030 (MW)
Member State 2016 2020 2030
Austria 1284 1421 2050
Belgium 1775 2026 3096
Bulgaria 644 664 830
Croatia 394 412 527
Cyprus 134 143 186
Czech Republic 1123 1194 1536
Denmark 972 1064 1570
Estonia 173 181 226
Finland 1610 1738 2348
France 11551 12924 18713
Germany 12869 14345 21397
Greece 1565 1661 2031
Hungary 1008 1037 1241
Ireland 681 792 1264
Italy 9303 10772 15981
87 Based on data in Eurostat, Energy Balance Sheets 2013 data, 2015 edition.
92 FINAL REPORT
Member State 2016 2020 2030
Latvia 220 233 277
Lithuania 302 309 361
Luxembourg 80 84 85
Malta 61 64 67
Netherlands 2557 2848 4088
Poland 3534 3703 4562
Portugal 1165 1301 2107
Romania 1449 1495 1749
Slovakia 692 737 887
Slovenia 261 276 348
Spain 6623 7507 11654
Sweden 2984 3222 4110
UK 9788 11013 16273
TOTAL 74802 83169 119563
Source: Own calculations, adapted from Gils (2015).
The database shows demand response potential for the selected customer groups
growing over time as the share of electric vehicles and heat pumps increases. The
Gils figures on electric vehicles and heat pumps have been amended for the
following reasons:
Research by Ecofys88 that models the demand profile for 100 households,
94% of which have an EV, with and without demand response from EVs.
The modelling shows that the peak is reduced from 420kW to 240kW
using smart charging (no vehicle-to-grid). Per EV this is around 2kW of a
charging capacity of 3.7 kW – that is roughly 50%.
For Heat Pumps, the reduction potential is limited because the heat demand
profile of well insulated houses is already quite flat. There can be
interaction with other demand peaks (appliances and electric cars) which
makes the overall profile less peaky. On the whole a value of around 25%
is assumed.
5.3.2.2 Time based profile of smart meters
The time based profile of smart meter installation and use is considered at two key
levels:
MS roll out profiles up to 2020 and beyond; and
The proportion of installed smart meters that permit the use of dynamic
STUDY ON DOWNSTREAM FLEXIBILITY, PRICE FLEXIBILITY, DEMAND RESPONSE & SMART METERING
93
An estimate of the smart metering roll-out is based on the roll-out profiles reported
in the European Commission’s Benchmarking report (2014).89 Different profiles
are estimated for the BAU and Option 1 scenarios.
In the case of BAU the reported roll out profiles are as the Benchmarking report for
the period to 2020, with the following additional assumptions made:
For countries with no reported CBA90 no roll out is assumed up to 2030,
and hence no dynamic tariffs for the entire period.
For countries with a CBA with negative or inconclusive results91 the
proposed roll-out of the MS is applied. In some cases this amounts to no
roll out, in others cases a roll out of much less than 80% metering points is
proposed.92
For some countries, where installation progress in 2016 is well down on
the values assumed in the Benchmarking Report an adjustment is made to
better reflect the actual situation.93 However, no changes to the 2020
figures are included.
In addition, in the BAU scenario, a subset of the MS reporting a large scale roll out
by 2020 are assumed to have metering systems fully designed to accommodate
dynamic tariffs, and with such tariffs widely available to customers. This
categorisation is largely based on existing policy statements. Six MS – Denmark,
Finland, Ireland, Spain, Sweden and the United Kingdom - are assumed to offer
ToU or dynamic tariffs for domestic and small residential customers in 2020
without the need for any change in policy.
In practice, the requirement for two-way communication is not always clear cut.
For example, all Spanish suppliers will offer three-tier ToU tariffs in 2020, but
some will do so through software modifications rather than two-way
communications. Moreover, it is not always necessary to have two-way
communication to benefit from RTP or CPP – for example, where the actual prices
are available on the internet. Due to the observation that two-way communications
is not always necessary, for other countries engaged in a large-scale roll-out it is
reasonable to assume that by 2020 a high proportion of customers will be eligible
for ToU, RTP and CPP. In this case, 75% of customers are assumed eligible in
2020 and all by 2030.
89 European Commission, Report from the Commission: Benchmarking smart metering
deployment in the EU-27 with a focus on electricity (COM(2014) 356 and SWD(2014)
188), June 2014. 90 Bulgaria, Croatia, Cyprus, Hungary, Slovenia. 91 Belgian jurisdictions, Czech Republic, Latvia, Lithuania, Germany, Portugal, Slovakia 92 This is the case in Germany, Latvia and Slovenia. 93 This is the case in Austria (1 year delay); France, Netherlands and Romania (all half the
assumed value for 2016); and Germany, Greece and Slovakia (no installation as of 2016).
94 FINAL REPORT
The resulting estimates of metering points with smart meters, and the availability
of dynamic tariffs for the BAU scenario are set out below.
Table 6: BAU - Estimate of metering points with smart meters, and capability for dynamic tariffs
2016, 2020, 2030
Member State 2016 2020 2030 Widespread
availability of dynamic tariffs
2020
Austria 10% 95% 95% 75%-
Belgium 0% 0% 0% -
Bulgaria 0% 0% 0% -
Croatia 0% 0% 0% -
Cyprus 0% 0% 0% -
Czech Republic 0% 0% 0% -
Denmark 76% 100% 100% 100%
Estonia 79% 100% 100% 75%
Finland 100% 100% 100% 100%
France 20% 95% 95% 75%
Germany 0% 23% 31% 75%
Greece 0% 80% 80% 75%
Hungary 0% 0% 0% -
Ireland 20% 100% 100% 100%
Italy 99% 99% 99% 75%
Latvia 0% 80% 95% 75%
Lithuania 0% 0% 0% -
Luxembourg 48% 95% 95% 75%
Malta 100% 100% 100% 75%
Netherlands 25% 100% 100% 75%
Poland 32% 80% 100% 75%
Portugal 0% 0% 0% -
Romania 18% 80% 100% 75%
Slovakia 0% 23% 23% 75%
Slovenia 0% 0% 0% -
Spain 70% 100% 100% 100%
Sweden 100% 100% 100% 100%
UK 39% 97% 100% 100%
AVERAGE 35% 71% 74%
Source: Own analysis based on figures in Commission’s Benchmarking Report and
new information from Latvia
In the case of smart meters being available on demand (Option 1), the following
assumptions are made on the roll out of smart metering systems:
In countries with a reported large-scale roll out of smart metering systems,
the roll out occurs as planned. In all cases, customers will have access to
dynamic tariffs by 2020. This reflects greater customer and supplier
awareness of the benefits of smart meters.
In countries with either a limited roll out or no planned roll out, smart
meters will be made available to customers on demand.
The extent to which customers will choose the installation of a smart meter will
depend on a range of factors, including the proportion of overall benefits that it
could capture. Where a customer is faced with the full cost of smart metering
installation, extremely low take up is envisaged in the relevant MS based on
current technology use. The following table undertakes simple calculations of the
ratio of customer benefits to total costs based on analysis undertaken for the
STUDY ON DOWNSTREAM FLEXIBILITY, PRICE FLEXIBILITY, DEMAND RESPONSE & SMART METERING
95
Commission on the cost-benefit analysis of smart metering of countries for which a
large scale roll-out was not proposed at the time of publication.
Table 7: Estimate of costs of smart meter roll out and relationship with customer related
benefits, per metering point (€/metering point)
BE-BRU
BE-FLA
BE-WAL
CZ DE HU LT PT SK
Key costs
Meter 250,24 330,03 303,92 243,74 189,20 104,62 103,64 56,32 91,72
IT 70,79 60,08 60,91 96,23 84,17 9,58 12,73 5,18 27,34
Source: Calculations from Tables 8 and 11 of AF Mercados, NTUA (2015), Study on cost benefit analysis of
Smart Metering Systems in EU Member States, Final Report. Note: BRU – Brussels, FLA – Flanders, WAL -
Wallonia
The above calculations from the MS own data show that customer related benefits
from smart metering systems (on a per-metering point basis) are generally
significantly lower than corresponding per-metering point costs. In the two cases in
the above table where the ratio of costs to benefits is closer to 1 it is notable that
the MS has based its analysis and/or decisions on mandatory roll out for customers
above a certain consumption threshold:
In Germany a mandatory roll out for all customers above 6000kWh is
proposed.
In Slovakia, the CBA only considers customers with consumption above
4000kWh (covering 23% of metering points and 53% of LV consumption).
The German and Slovakian analysis suggests that customers with consumption
above 5-6,000kWh may choose, or be close to choosing, to take up a smart meter
even if it were to bear the full costs. The data from other MS cost benefit analysis
is less clear-cut as the analysis considers all customers – and hence a higher ratio of
cost to benefit is not surprising. Other analysis is also less clear cut – for example,
the case of Sweden where smaller customers can request charging on the basis of
hourly prices at zero cost. The change in tariff requires a change in the
functionality of the metering point to allow regular data transfer. However, as of
2013, only 6,300 households out of a total of 4.5 million had hourly metering. The
Swedish Energy Agency advise stated that the number has not increased
significantly in the subsequent period.
For the purpose of analysis, it is assumed that for all countries without a full roll
out of smart meters, take up of a smart meter for reasonable customer contributions
will be low in the short to medium term (up to 2020). However, it may well
increase significantly in the subsequent period to 2030 as the costs of meters,
communications and information technology are expected to fall, and the spread of
96 FINAL REPORT
appliances conducive to price-based demand response are anticipated to rise.
Therefore, the following estimates are assumed:
Take up of smart meters of around 10% of residential and small
commercial customers by 2020.
Take up of smart meters of 40% by 2030.
The resulting estimates of smart meter roll out and access to dynamic tariffs under
Option 1 are set out below. It is assumed that suppliers will offer most forms of
dynamic tariffs under this policy option, and that appropriate metering will be
installed that permits the required functionality.
Table 8: Option 1 - Estimate of metering points with smart meters, and capability for dynamic
tariffs 2016, 2020, 2030
Member State 2016 2020 2030 Widespread
availability of dynamic tariffs
2020
Austria 10% 95% 95% Yes
Belgium 0% 10% 40% Yes
Bulgaria 0% 10% 40% Yes
Croatia 0% 10% 40% Yes
Cyprus 0% 10% 40% Yes
Czech Republic 0% 10% 40% Yes
Denmark 76% 100% 100% Yes
Estonia 79% 100% 100% Yes
Finland 100% 100% 100% Yes
France 20% 95% 95% Yes
Germany 0% 23% 40% Yes
Greece 0% 80% 80% Yes
Hungary 0% 10% 40% Yes
Ireland 20% 100% 100% Yes
Italy 99% 99% 99% Yes
Latvia 0% 80% 95% Yes
Lithuania 0% 10% 40% Yes
Luxembourg 48% 95% 95% Yes
Malta 100% 100% 100% Yes
Netherlands 25% 100% 100% Yes
Poland 32% 80% 100% Yes
Portugal 0% 10% 40% Yes
Romania 18% 80% 100% Yes
Slovakia 0% 23% 40% Yes
Slovenia 0% 10% 40% Yes
Spain 70% 100% 100% Yes
Sweden 100% 100% 100% Yes
UK 39% 97% 100% Yes
AVERAGE 35% 72% 81%
Source: Own analysis based on figures in Commission’s Benchmarking Report
5.3.2.3 Customer take up of dynamic tariffs
The take up of dynamic tariffs for customers with smart meters is modelled using
the findings of a study by Redpoint Energy (2012) for the UK Department of
STUDY ON DOWNSTREAM FLEXIBILITY, PRICE FLEXIBILITY, DEMAND RESPONSE & SMART METERING
97
Energy and Climate Change (DECC).94 This study modelled the impact of demand
side response in the UK up to 2030, and included estimates of the take up of tariffs
with strong price based incentives, including static ToU (STOU) and critical peak
pricing (CPP) following the large scale roll-out of smart meters. The report defines
STOU as a tariff that differentiates unit prices for different blocks of time across
the day and CPP as a pre-specified high tariff applied for usage during periods
designed by the supplier as critical peak periods. The study was chosen due to
several reasons:
Its findings are broadly in accordance with the results of a majority of
international studies;
It is one of the most detailed studies undertaken in Europe that
differentiates between the uptake of DR from price-based and incentive-
based mechanisms and includes forecasts to 2030;
It considers and distinguishes between important parameters, such as the
effect of different types of tariffs on DR, the implications of electric
vehicles and heat pumps; and
It includes sensitivity analysis.
The core estimates in the study are presented below:
Table 9: Take up of STOU and CPP – Redpoint Energy estimates for the UK
Type of tariff
Demand/ electrification
Scenario
2015 2020 2025 2030
Static ToU Low 8% 18% 16% 18%
Central 8% 18% 20% 26%
High 8% 18% 20% 33%
CPP Low 0% 2% 6% 9%
Central 0% 3% 10% 16%
High 0% 3% 12% 19%
Source: Redpoint Energy (2012)
The results suggest that the expected take up of ToU tariffs will gradually increase
up to 2030, while those of CPP will increase by more than 5 times. The figures for
2020 – when the full roll out is expected to be in place in the UK - are reasonably
consistent with Scandinavian data on the take up of dynamic tariffs by customers.
However, the above estimates were made for the UK, a country with a full roll out
of smart meters planned. In the case of an optional take up of smart meters (as per
Option 1) a much higher take up of dynamic prices is anticipated as customers
opting for a smart meter are most likely to do so exactly because they can make
savings from doing so. For that reason, the take up of one of STOU, RTP or CPP in
these cases may well be universal, or at least double the estimates presented here
(44% taking one form of dynamic pricing).
94 Redpoint Energy (2012), Electricity System Analysis – future system benefits from
selected DSR scenarios, Final report pack, August 2012.
98 FINAL REPORT
These numbers have been applied in the following manner for MS’s proposing a
full scale roll out of smart meters:
First, Redpoint Energy’s central figures are taken as the most
representative.
Second, an estimate of the take up of dynamic tariffs for customers who
have a smart meter in place in 2016 is made by a combination of linear
interpolation and scaling up the 2015 values by the proportion of
customers who will have a smart meter in place. On that basis, the
potential take up by customers with a smart meter of static ToU tariffs in
2016 is estimated at 10%.
Third, it is assumed that these figures (and those for the roll out) already
take into account customers who for technical and other reasons cannot
access time of use charges. For example, the Irish CBA report95 includes
an adjustment value of 11% for inaccessible customers who may for
example, have a smart meter but for which 2-way communications is not
feasible. This could be the case if there are challenges regarding the
accessibility of certain private residences, which are vacant on a long-term
basis, for example holiday houses.
Fourth, these values are applied uniformly across this sub-category of MS.
That is, it is assumed that that take up of dynamic tariff per equipped smart
meter is equal across MS for a particular year. The same assumption
applies in the BAU and Option 1 scenarios. Thus, the assumptions do not
consider possible effects of extra incentives that might be given by
different EU MS in order to stimulate a faster price-based response.
The resulting take-up estimates are as follows:
Static TOU: 2016 – 10%, 2020 – 18%, 2030 – 26%
CPP: 2016 – 0%, 2020 – 3%, 2030 – 16%.
In the case of MS not currently planning a large scale roll out of smart metering
systems, and for which optional take up applies under Option 1, the same
methodology applies but with the take up rate for static TOU and CPP doubled in
2020 and 2030 for customers with a smart meter (52% and 32% respectively in
2030).
The core estimated figures are in line with international trial studies and practical
evidence, including:
95 NSMP (Electricity & Gas (Cost Benefit Analysis), PWC Report
STUDY ON DOWNSTREAM FLEXIBILITY, PRICE FLEXIBILITY, DEMAND RESPONSE & SMART METERING
99
The consumer survey of “Smart Energy GB survey”,96 which states that
around 30% of the people were either strongly or moderately in favour of
switching to a STOU tariff;
The take-up rate of the CPP tempo tariff in France that was slightly less
than 20% of the total consumers.
5.3.2.4 Price impact of dynamic pricing
An estimate of the load reduction impact of STOU and CPP mechanisms is made
based on the findings of previous studies.
Care needs to be taken when extrapolating from previous results as a number of
critical variables tend to affect study findings, as noted by Faruqui (2013)97,
including:
The ratio of peak to off peak price - the amount of demand response
increases as the peak to off-peak price ratio increases but at a diminishing
rate;
The length of peak period;
Number of pricing periods in a day;
Climate;
Appliance ownership;
Information provided to customers and user interactions more generally;
and
How customers were selected into the experiment.
Moreover, potential load reduction will strongly depend on the extent to which the
systems are combined with home automation systems, for example, smart
thermostats and load control devices that reduce load when the price exceeds a
certain level. Automation can combat potential response fatigue where the
customer has to take the decision at each instance of high prices.
Notwithstanding difficulties in comparing across schemes and markets, there is
high consistency between the findings of similar studies, which are summarised in
the following table.
96 Smart Energy GB, 2015, Is It Time? Consumers and Time of Use Tariff. 97 See Ahmad Faruqui, 2013, Dynamic Pricing – The bridge to a smart energy future.
100 FINAL REPORT
Table 10: International Studies on Price-based DR for domestic consumers and SME
Country Appliance Study Summary % of peak load shift Observation Source
Time-of-use Tariff
United Kingdom Total household load > Smart-meter trial including 61,344 households (18,370
households with smart meters)
> Participants were encouraged to use smart meters through
advice, historic and real-time feedback, and incentives to
reduce overall consumption
Up to 10 % (higher load
shifting on weekends, and
for smaller households)
Without smart meters no significant load
shifting was observed
EDF and SSE time of use
trial, 201198
United Kingdom Total household load > Smart-meter trial, including 574 domestic users between
Oct 2012- Sep 2013
> Their consumption behaviour was compared to a control
group
Electricity consumption
during the peak periods
1.5% - 11.3% less than the
control group99
n/a CLNR, 2015, Domestic
Time of Use tariff100
Ireland Total household load Smart-Meter Trial including 4,3000 participants (July to
December 2009)
Peak usage reduction by
8.8% - 11.3%
Smart-Meters and TOU in combination
with bi-monthly bills, energy usage
statement and electricity monitor achieved
significantly better peak load shifting
results
CER, 2011101
United Kingdom Smart appliances, heat
pumps and Electrical
Vehicles
Modelled scenario for 5 DSR tariff scenarios 10% (2015) to 40% (2030) n/a Redpoint Energy and
Element Energy, 2012102
United Kingdom Other appliances Modelled scenario for 5 DSR tariff scenarios 5% (2015) to 20% (2030) n/a Redpoint Energy and
Element Energy, 2012
Germany –
Rheine
Total household load
(selected households with
high reduction potential)
Smart Meter Trail, including 100 private households.
Participants were given specific incentives, including most
favourite billing
10% n/a Voss et al., 1991103
Germany – Total household load
(selected households with
Smart Meter Trail, including over 100 private households.
Participants were given specific incentives, including most
12% n/a Brand et al., 1990104
98 AECOM for Ofgem, 2011, Energy Demand Research Project 99 There was no statistically significant reduction in consumption during the single peak half-hour of demand over the whole year. 100 CLNR, 2015, Insight Report: Domestic Time of Use Tariff – A comparison of the time of use tariff trial to the baseline domestic profile 101 CER, 2011, “Electricity Smart Metering Customer Behaviour Trials (CBT) Findings Report” 102 Redpoint energy and element Energy, 2012, Electricity System analysis – future system benefits from selected DSR scenarios 103 Voss et al., 1991, Lastoptimierung in elektrischen Netzen mit dynamischen Tarifen. 104 Brand et al., 1990, Freiburger Modellversuche zu neuen Stromtarifen
STUDY ON DOWNSTREAM FLEXIBILITY, PRICE FLEXIBILITY, DEMAND RESPONSE & SMART METERING
101
Country Appliance Study Summary % of peak load shift Observation Source
Freiburg high reduction potential) favourite billing
Germany Total household load Simulation for households with three part tariff Weak reaction of
consumers: 10%
Strong reaction of
consumers: 20%
n/a Ecofys, 2009105
International Total household load Demand response impacts of 163 pricing treatments that
were offered on an experimental or full-scale basis in 34
projects
2%- 13%106 Various studies conclude very different
results; Price ratios (peak and off-peak)
explain a lot of the difference of different
studies
Faruqui Arcturus, Sergici
(2013)107
Time-of-Use tariff (with event pricing)
United Kingdom Total household load Trial on dynamic TOU tariff, including 5,333 customers for
smart meter trails and 1,119 customers on TOU
7.1%-11% Single event reduction increases the peak
load shift significantly
Low Carbon London108
France Total household load > Evidence of implemented scheme.
>Private households and SME minimum capacity of 9 kW.
> 2008, 350,000 residential and 100,000 small business
customers were subscribed to the Tempo tariff. - 300 blue
days (standard), 43 white days (medium), 22 red days (high)
> Reduction during medium
price period - 15%
> Reduction during high
price period - 45%
Results may be relatively high due to high
consumption of electrical heating
Smart Region, 2013
European Smart
Metering Landscape
Report 2012- updates
May 2013109
CPP
International Total household load See above 12% - 38% See above Faruqui Arcturus,
Sergici, 2013
Australia Total household load Trial for Dynamic peak price with peak, including 297
participants, 2006-2008
37% Incentives for joining (A$100) and
completion (A$200)
Integral Energy110
CPP with automation
International Total household load See above 14%– 48% See above Faruqui Arcturus,
Sergici, 2013
105 Ecofys, 2009, Einführung last-u zeitvariabler Tarife 106 Not considering the two lowest and highest outliers of the studies 107 Faruqui Arcturus, Sergici (2013), International Evidence on Dynamic Pricing 108 Low Carbon London, 2014, Residential Demand side Response for outage management and as an alternative to network reinforcement, Report A1 109 Smart Region, 2013, European Smart Metering Landscape Report 2012- updates May 2013 110 As referenced in UK Power Networks, 2014, Residential Demand Side Response for outage management and as an alternative to network reinforcement.
102 FINAL REPORT
In general, the findings are relatively consistent and show:
Potential for reduction of overall residential peak demand of 10% (and
rising over time) using ToU tariffs, and
Much higher reductions – of as much as 40-60% of controllable load using
RTP/CPP, where this is combined with automation and/or where it refers
to new forms of usage, including electric vehicles and heat pumps.
The estimates of the Redpoint Energy study are representative for this sample of
studies and are applied in the calculations in this section for the following
additional reasons:
Consistency in calculation methodology with the earlier estimates of the
take-up of ToU and CPP tariffs,
Inclusion of a profile of how the price impact varies over time, and
Breakdown of ToU impacts by standard appliances and those most
susceptible to price based response – namely electric vehicles, heat pumps
and smart appliances (rather than all load as per some studies), which
appears reasonably consistent with the Gils database.
The key estimates of Redpoint Energy of price based demand response are
summarised in the table below.
Table 11: Price based demand response - Redpoint Energy estimates for the UK
Type of tariff Scenario 2015 2020 2025 2030
Static ToU Normal appliances 5% 10% 15% 20%
Static ToU HP/EV/SA 10% 20% 30% 40%
CPP HP/EV/SA 30% 40% 50% 60%
Source: Redpoint Energy (2012). Note - Heat Pump (HP), Electric Vehicle (EV),
Smart Appliances (SA).
For the purpose of the calculations, these figures have been applied to the relevant
controllable load categories identified in the Gils database. It should be stressed
that these estimates do not reflect reductions in overall peak demand, but
reductions in the controllable demand for the relevant consumption category.
5.3.3 Limitations of the analysis
The analysis includes a number of simplifying assumptions:
Price based demand response is independent of incentive based demand
response. It is quite likely that should smaller customers begin to
participate in incentive-based demand response schemes, then their
responsiveness to price based incentives will increase.
STUDY ON DOWNSTREAM FLEXIBILITY, PRICE FLEXIBILITY, DEMAND RESPONSE & SMART METERING 103
Tariff structures are not taken into account. In practice, the extent to which
customers will change behaviour will be influenced by the relative
proportions of fixed and variable charges on its bill – including in the
network component. As average values from international studies have
been applied it is unclear whether this assumption is conservative or
potentially overstates the response at an EU level as a whole.
5.4 Incentive based demand response
Section 5.4 comprises an assessment of the incentive based demand response.
Similar to the previous section on the price based demand response, the section
presents an estimate of the current level of incentive based demand response
following by assessment of how the policy options could change the level. The
sub-sections include the following:
Assessment of the current level of incentive based DR
The EU target model compared to other market models
Measures to increase incentive-based DR
Approach to estimate the effects of the options
Links between price and incentive based DR
5.4.1 Assessment of the current level of incentive based DR
While EU Member States which took a decision to enable Incentive-based Demand
Response in 2013-14 have made significant progress, other Member States are still
undergoing regulatory reviews or have decided against making any significant
changes at this time. Belgium, Finland UK and France have reached a level where
incentive-based Demand Response is a commercially viable product.
We are presenting the status for incentive based demand response in MS in three
areas: participation in wholesale markets, balancing markets and capacity markets.
Mechanisms for grid management purposes are not included as they, for MS states
where such mechanisms are allowed, may vary between different utilities.
Incentive based demand response in wholesale energy markets
Most MS have established wholesale markets for energy, but there are still some
countries without well-functioning wholesale energy markets.
In most MS with day-ahead and intraday markets established, the demand side is
allowed to participate, represented by the BRP. Due to the target model for the
markets and the BRPs having a responsibility for scheduling their demand, in most
MS only BRP may place bids in the market. France is the only MS allowing bids
from non-BRP. Therefore, mainly large industrial consumers are proactive in the
markets, placing price sensitive energy bids in day-ahead markets and doing
rescheduling in the intraday market.
Demand response in the day-ahead market will be represented by price dependent
bids (volume of demand bid depending on the settled day-ahead price) by BRP..
104 FINAL REPORT
Trading from the demand side in the intraday market could either reflect demand
side flexibility or a need to change positions due to changes in needs (regardless of
energy price levels). We have summarised in which markets the demand side is
allowed to participate in the wholesale market in the table below. In addition, we
have checked the level of price-sensitive bids for selected hours in different
markets.
Naturally, the level of participation in the markets will depend on the risk the BRP
faces by not being active. If electricity prices are volatile and consumers/BRPs face
the risk of frequent price peaks, they will have an incentive to lower this risk by
placing price depending bids. Price caps in the markets lower this risk. Also, the
levels of penalties when scheduled volumes are not met, will influence the
incentives to reschedule energy demands during the hours before market closure.
Table 12: DS allowed to participate in wholesale energy markets in MS
Member State Day –ahead
Intra-day Comments
Austria X DS participation is allowed
Belgium X X
DS participation is allowed, but only a few large industrial players are active.
Bulgaria No DS participation and not a well-function market.
Croatia
No DS participation. Plans of launching DA and ID market in 2016.
Cyprus - - No wholesale markets exist
Czech Republic X X Bids only from BRP, only large consumers are active
Denmark X X Bids only from BRP
Estonia Bids only from BRP, DS participation unclear
Finland X X Bids only from BRP, large consumers are active
France X X Bids accepted from non-BRPs. 1,5 GWH from non-BRP in 2015
Germany X
DS participation is allowed in DA, but only large consumers are active
Greece DS participation is not allowed. Price caps have been removed.
Hungary X X DR from large consumers and aggregators take place
Ireland X X
DR participation by bidding and dispatch. NO BRP, energy is settled ex-post.
Italy X Bids only from BRP, increasing DS participation.
Latvia X
DS is allowed in the wholesale market (unclear which markets they have)
Lithuania Low competition and unclear whether DR takes place at all
Luxembourg No information
Malta - - No wholesale markets exists
Netherlands X X Bids only from BRP
Poland X X Bids only from BRP, low activity
Portugal X X
DS participation is allowed (BRP), but low level of participation. Price cap on electricity.
Romania X X
All trade must take place in the market places. DS and aggregators are allowed, but no activity.
Slovakia X X
DS participation (with licence) is allowed. Only large consumers are active
Slovenia DS participation is not allowed
Spain X X Bids only from BRP, level of participation is not known.
Sweden X X Bids only from BRP, large consumers are active
UK X X Bids only from BRP, limited DS participation.
Sources: The on-going work of JRC (2016), Entso-E (2016), THEMA (2016) and SEDC (2015)
A few MS do not have wholesale energy markets in place (Cyprus, Malta) and
some MS do not have well-functioning markets in terms of competition on the
generation side and/ or supplier side.
STUDY ON DOWNSTREAM FLEXIBILITY, PRICE FLEXIBILITY, DEMAND RESPONSE & SMART METERING 105
In MS where there are established wholesale energy markets, the demand side
participation is mainly from large, industrial players. The main reason for this is a
general requirement for participants to be BRP. In most markets, the level of DR in
the wholesale markets is considered to be low. This may be explained by low price
variations and price caps in the markets or by various restrictions and barriers in
the markets. Moreover, the share of total energy traded in the wholesale markets
varies between MS, and low volumes traded overall may be one explanation for
low DS participation in these markets.
The Greek electricity market is undergoing significant design and structural
changes, which are expected to include among other things: the introduction of an
intraday market (possibly by end 2017) and the introduction of forward trading,
Belgium is one of the MS where the demand side (BRP) may place price sensitive
bids in the wholesale energy markets. However, the share of the electricity traded
on the spot markets are low in comparison with the total market as retailers tend to
make agreements with generators, who they may also own (JRC, 2016).
In France, aggregators traded 1,5 GWh in the day-ahead and intraday markets in
2015 (Entso-E, 2016). There are currently 10 independent aggregators operating in
the market and there is regulation in place describing settlement between the
retailer (BRP) and the aggregator.
In Italy during 2013, the demand side placed price sensitive bids for 47 TWh out of
230 TWh being traded in the spot markets (SEDC, 2015). This indicates that 20
percent of the traded volumes was flexible. However, only 5,9 TWh of these bids
were accepted, representing a utilised level of DR of 2,6 percent of the traded
volumes. It is however unclear how this corresponds to reductions of the peak load
for Italy.
To illustrate some signs of DR taking place within the Day-ahead market, we have
checked the demand curve for three market places representing five MS. The
figures below show the price sensititvity in demand bids for the Iberian,
German/Austrian and French markets during the 2nd of February 2016 for the hour
9-10 in the morning. The curves show that consumption would have been 5000
MWh , 3360 MWh and 250 MWh and lower for that hour in Spain/Portugal,
Germany/Austria andFrance if prices had risen to a level of 100 EUR/MWh from
40, 22 and 32 EUR/ MWh, respectively.
Such demand reduction represents 12 % of peak load in Spain and Portugal, 4 % of
the sum of German and Austrial peak load and 0.3 % of peak load in France..
Please note that some volumes on the demand side may represent industial players
starting their own generation instead of buying electricity from the market. To
determine a more precise estimate of DR in the energy wholesale markets, in-depth
studies of the underlying data for the demand and supply curves are required,
including demand and generation types in the MS. This is outside the scope of this
study.
106 FINAL REPORT
Figure 8 Demand/ supply curve for the Iberian market 2nd of February 2016, hour 10
Source: OMIE (online)
Figure 9 Demand/ supply curves for the German/Austrian market 2nd of February
2016, hour 10
Source: Epex spot (online)
STUDY ON DOWNSTREAM FLEXIBILITY, PRICE FLEXIBILITY, DEMAND RESPONSE & SMART METERING 107
Figure 10 Demand/ supply curves for the French market 2ndof February 2016
Source: Epex spot (online)
From Nord Pool Spot, we have examples of price sensitive bids in high-price
periods when the price sensitivity is assumed to be at its highest. THEMA (2015)
describes the price sensitive bids from the demand side for one hour in 2010 and
one hour in 2015 in the day-ahead market. For 2010 and 2015, respectively, 83 and
89 per cent of the bids, were not price-sensitive. Hence, 17 and 11 per cent of the
bidding represented DR for these two hours. The price-insensitive bids are
probably from power intensive industry, but also some from pumped hydro. The
total flexible volume in the 2015 hour was 6 870 MW, of which about 2 300 MW
were above the system price (53.57 EUR/MWh). Note that parts of the demand
flexibility in the low price region (particularly at or below zero) represents pumped
hydro, which buys electricity at low prices. Moreover, the majority of the observed
demand response is available below prices of 100 EUR/MWh. The numbers
presented here only show single hourly bids. Other types of (more complicated)
bids are not included, thus there may be additional demand response available that
is not observable in these numbers.
The reduced demand (2 300 MW) due to prices above the placed bid for the 2015
hour represents 3.2 percent of the peak load for the Nordics in the winter of
2014/2015 (71 500 MW), whereas the total flexible demand bids represent 9.6
percent.
108 FINAL REPORT
Figure 11 Market cross for the Nordic day-ahead system price 15th of December 2015 for
the hour 18-19
Source: THEMA (2015 based on numbers from Nord Pool Spot)
When demand is faced with risk of high electricity prices, and are allowed to bid
into the wholesale energy markets, one should expect price sensitive bids up to the
level of 10 to 18 percent as seen in high price periods in the Nordics and the
Iberian market.
Incentive based demand response in balancing markets
There are often strict requirements to participate in balancing markets. For some
products, the activation time is very short, volumes high and there may be a short
resting time between activation. Some MS have adjusted requirements for the
demand side to increase participation in these markets and consequently to ensure
sufficient capacity. The main volumes are offered by large industries.
In France, Belgium, UK and the Nordics the demand side plays an active role in
balancing markets. In Belgium and France aggregators are also active, either
through bilateral contracts with the BRP, operating within a standard framework
(France) or in specific products where the normal market rules ensures
compensation for the BRP (JRC, 2016 and SEDC, 2015). In the Nordics and in
Belgium there is also some aggregation from suppliers offering aggregation to their
customers and placing common bids within their BRP.
Table 13 DS allowed to participate in balancing markets in MS (volumes in MW where
available)
MS FCR FFR RR Other Comments
Austria No Yes Yes
Belgium 27 321 FFR from 2014, FCR from 2016 Bilateral contracts with the BRP for the interruptible loads.
Bulgaria No No No
Croatia No No No Mandatory participation from generators
Cyprus - - - There are no such markets
Czech Republic
No No Yes DS can only participate in RR
Denmark 23 555 Yes Nordic market for primary and tertiary reserves. Mainly from electric boilers in district heating
Estonia No No No Most participants from outside Estonia, FCR
STUDY ON DOWNSTREAM FLEXIBILITY, PRICE FLEXIBILITY, DEMAND RESPONSE & SMART METERING 109
MS FCR FFR RR Other Comments
provided by Russia
Finland 100 Max 300
40 Nordic market for primary and tertiary reserves.
France 60 160 1800 Test phase for DSR participation of 1800 DR in RR
Germany Yes Yes Yes Low DS participation in balancing markets. Interruptible loads programme for large consumers
Greece No No No BEM will be included in new market design.
Hungary No No Yes DS can only participate in RR
Ireland No No No Yes Interruptible contracts for industrial sites used as short term reserves for the TSO
Italy No No No DS not allowed to participate.
Latvia No No No DSR not allowed to participate (FCR provided
by Russia)
Lithuania No No No DSR not allowed to participate (FCR provided by Russia)
Luxembourg No information
Malta - - - Such markets do not exist
Netherlands No Yes Yes
Poland Yes Yes Yes DSR does not participate on equal basis as thermal plants. No DS participation.
Portugal No No No DS not allowed to participate.
Romania Yes Yes Yes DSR does not participate on equal basis as generation, participation is low
Slovakia No No YEs DS can only participate in RR, bilateral contracts for large industries with TSO or DSO
Slovenia 20
Spain No No No DS not allowed to participate. DR only from large interruptible loads
Sweden Yes 10 626 Nordic market for primary and tertiary reserves.
UK 374 Yes
1260 Yes
(2015) DR-RR is established for large consumers to reduce demand during winter weekdays btw 4 and 8 PM
Sources: The on-going work of JRC (2016), Entso-E (2016), THEMA (2016), SEDC (2015)
and TSOs websites
Barriers usually stem from programme participation requirements, which are not
yet accommodated to cater for demand-side resources. For example, in Austria a
consumer may be required to install a secured and dedicated telephone line to
participate in the balancing market. In Norway, TSO signals are still delivered over
the telephone, and therefore the minimum bid-size remains high. Rules such as
these block the participation of all but the very largest industrial consumers.
However, the minimum volume for bidding in balancing markets has been lowered
to 0.5 MW in Belgium and from 10 to 5 MW in the Nordics to attract more bids.
According to Fingrid (fingrid.fi), loads from large-scale industry have, for a long
time, acted as reserves used for maintaining the power balance in Finland.
Demand-side management is a natural opportunity to increase supply on both
regulating power and reserve markets.
A lack of clarity around roles and responsibilities may also constitute barriers for
new entrants. For example, Germany, Poland and Slovenia lack a viable regulatory
framework for measurement, verification, prequalification and/or competition
between service providers, have complex, generation centred programme
requirements, and/or even network fees designed to incentivise a flat consumption
pattern, and hence penalise those who provide flexibility to the system.
110 FINAL REPORT
According to Entso-E (2016) DR provide 10 per cent of FCR resources and 16 per
cent of mFRR capacities in France (60 and 160 MW respectively).
Great Britain has a highly competitive energy market and balancing markets are
open to demand-side bidding, but, according to SEDC, the future of incentive-
based Demand Response in the country has become more difficult due to the
launching of the GB Capacity Market111. The short term operating reserve (STOR)
is the main market for DR in the UK. According to Curtis (2015) the resources are
awarded by tenders and the awards for these resources started at 40/50.000 £/MW
in 2007, peaked at 60/70.000 £/MW in 2012 and have decreased to 20/30.000
£/MW in 2015. Minimum levels are 3 MW and volumes may be aggregated.
Disconnections may last up to 2 hours and activation time may be up to 20
minutes. The main volume of flexibility (>80 per cent) is provided by consumers
having back-up generation on site.
The new Greek market design, passed in May 2016, includes a balancing market.
Also the TSO will be separated from the main power utility in Greece, PPE, and
partly privatised in the process (energypress.eu, 2016).
Capacity mechanisms
UK and Italy are the only MS with an established capacity market and France is
planning for market opening in 2017. When it comes to capacity mechanisms,
general experience is hard to extract as the schemes come in a large array of
different designs, and several capacity mechanisms are not open to demand-side
participation. We give an overview of some examples below.
It should however also be noted that the design of Capacity mechanisms varies
substantially between MS, although the outcome of the ongoing sector inquiry and
the pending revision of guidelines, may be that the design features are harmonized
to a larger extent.
Table 14 DS participation in capacity mechanisms in MS (volumes in MW where
available)
MS Mechanism DS Volume
DS participation
Austria
Belgium Strategic reserve
358
2015-2016 (elia.be)
Bulgaria
Over-capacity and no need for capacity mechanisms
Croatia
Cyprus
Czech Republic
Denmark No strategic reserve/ CM
Estonia No capacity market
Finland Strategic reserve 10
France Capacity market – DS only
Capacity market to start in 2017 including DS participation
STUDY ON DOWNSTREAM FLEXIBILITY, PRICE FLEXIBILITY, DEMAND RESPONSE & SMART METERING 111
Germany Interruptible load programme
694 Discussions on Capacity market, most likely not including DR
Greece Interruptible load program
Planning for capacity mechanism
1500 Interruptible loads program from 2016 – consumers > 5MW
Hungary
Ireland Fixed price per half hour through the year linked to
the energy market
Open to all, but with high requirements to participate. New capacity market planned to include DS.
Italy Capacity market
Interruptible loads
4061 Volume from interruptible loads from large industry (>1 MW). Exploring to include DS in capacity mechanism
Latvia Capacity market DS included
Lithuania
Luxembourg
Malta No capacity market
Netherlands
Poland Capacity reserves Generation only
Portugal
Romania
Slovakia
Slovenia No Capacity market
Spain Capacity mechanism Interruptible loads
2050 Generation only in the CM. Volumes from interruptible loads
Sweden Strategic reserves
626 The volume represents 42 per cent DR of total participation (2015)
UK Capacity market 174 Open to DS, but low participation
Sources: The on-going work of JRC (2016), Entso-E (2016), THEMA (2016), SEDC
(2015),and TSOs websites
Experience from the GB capacity auctions held so far, does not indicate a high
share of DR participation. For the year 2018 a volume of 49 GW was contracted, of
which 174 MW from demand (0,35 per cent). The reason may be that 1) the
capacity price realized in the GB auction was relatively low (much lower than
expected), and/or 2) that the product definitions are not attractive for demand
response.
In France a capacity market will be established from 2017. This will be a
decentralised market that obliges the retailers to by capacity certificates up to the
peak in their portfolio. This program is restricted to the demand side (JRC, 2016).
Finland, Sweden and Belgium have strategic reserves open to participation from
the demand side. According to THEMA (2015) a significant share of the peak-load
reserve consists of demand response in Sweden. The original plan was to gradually
phase out all of the generation capacity from the strategic reserve to 2020, resulting
in a reserve that consisted entirely of demand response. However, in reality it
turned out to be challenging to achieve the target. In 2015 there was 626 MW (42
per cent) of consumption in the Swedish PLR. SvK states that the requirements for
participation, such as continuous readiness and long-term commitment, is a barrier
to increase the share of demand response in the reserve. The plan to phase out all
generation capacity was therefore renounced. For DR participating in the reserve,
the obligation is to keep consumption under a specified maximum level during
stress situations, defined as situations the DAM algorithm is not able to establish an
equilibrium between supply and demand based on market bids (and nominations),
and/or the TSO is unable to secure sufficient reserves. Contrary to generation in the
peak load reserve, demand side resources are obliged to be active in the market.
112 FINAL REPORT
The load can either provide their flexibility as a price-sensitive bid in the DAM, or
as a bid in the reserve market.
Both Italy and Spain utilize a substantial level of DR through interruptible load
contracts for large industrial consumers. In Spain this programme acts as an
emergency action in case the system lacks sufficient generation and balancing
resources. However, the programme has not been activated in many years, and this
has raised a question whether this programme is promoted to enhance DR or is in
fact a disguised subsidy to the national industry (JRC, 2016). In the case of Italy, it
is unclear if the interruptible loads have ever been activated, even though the
payments are attractive and related mostly to the availability of volumes and not to
activation (JRC, 2016).
In Greece, the “disruption management” plan offers major industrial enterprises
electricity cost savings in exchange for shifting energy usage to off-peak hours
whenever required by the operator. The total annual sum to be offered by the plan
through auctions will be about EUR 48 million. Initial pilot auctions, one covering
longer-term agreements and the other short-term agreements for the month of
March was held at the end of February 2016. Subsequently, the second round of
auctions held at the end of March and covering April 1 to 30, increased the
electricity amounts offered to 650 MW for short-term agreements and 850 MW for
longer-term agreements (both up from 500 MW each in the first auction) to meet
increased demand expressed in the first auction and satisfy participant needs.
Summary
The table below summarize the amount of incentive based DR found and estimated
in the MS. DS are allowed to participate in several MS, so there may be more
volumes represented in balancing and capacity markets, but levels are indicated to
be low. See BAU in section 5.5.2 for methodology on estimated levels for
incentive based DR in MS where no volumes have been found in the literature.
Table 15 Incentive based DR
MS DSP in energy
markets DSP in balancing
markets DSP in capacity
mechanisms Estimated BAU
for 2016
Austria Yes Yes 104
Belgium Yes Yes Yes 689
Bulgaria No No 0
Croatia No No 0
Cyprus No market No market 0
Czech Republic Yes Yes 49
Denmark Yes Yes 566
Estonia Yes No 0
Finland Yes Yes Yes 810
France Yes Yes Yes 1689
Germany Yes Yes Yes 860
Greece No (2015) No 1527
Hungary Yes Yes 30
Ireland Yes Yes Yes 48
Italy Yes No Yes 4131
Latvia Yes No Yes 7
Lithuania unclear No 0
Luxembourg No information No information
STUDY ON DOWNSTREAM FLEXIBILITY, PRICE FLEXIBILITY, DEMAND RESPONSE & SMART METERING 113
MS DSP in energy
markets DSP in balancing
markets DSP in capacity
mechanisms Estimated BAU
for 2016
Malta No market No market
Netherlands Yes Yes 170
Poland Yes Yes No 228
Portugal Yes No 40
Romania Yes Yes 79
Slovakia Yes Yes 40
Slovenia No Yes 21
Spain Yes No Yes 2083
Sweden Yes Yes Yes 666
UK Yes Yes Yes 1792
Total 15628
As shown in Section 1.2.1, DR is participating in the wholesale energy markets in
many MS. The level of demand response (in terms of price-sensitive bids) will vary
over time depending on price levels and price volatility and are not represented in
the table. The energy markets may represent the highest DR volumes from
incentive based DR, and has been proved to represent over 10 per cent of peak load
in the Nordic markets in terms of volumes of price sensitive bids in high price
periods with high risk of price peaks. In periods with low prices and low risk of
price peaks, the price sensitive bids may be less than 1 per cent as shown for the
German/Austrian, French and Spanish/Portuguese markets. The DR in the
wholesale markets will be very dependent on specific conditions in each MS.
The actual volumes we found in literature for DR volumes is about 15 GW (data
from 12 Member States). We have included conservative estimates for Member
States that allow incentive based DR but where there is no directly available data
on volumes. One could argue that the volumes are not active in the markets as
some volumes are rarely activated (i.e. volumes for Italy and Spain). This is true –
but volumes are there, but the market design allows inefficiencies in DR
mechanisms – and that is a different discussion. On the other hand – this is an
argument that volumes may be reduced when efficient use is taking place – i.e. that
the volumes in Greece, Italy and Spain will be reduced if DR will participate in a
level playing field
5.4.2 The EU target model compared to other market
models
The observed level of DR in the EU MS are often compared with levels found in
other markets, mainly markets in the US. This comparison should be done with
great care, as a number of important market design features differ between US and
European markets. In most markets there are a combination of energy markets,
markets for balancing services and capacity mechanisms of some sort. To
categorise different market set-ups relevant for DR, the most important elements
are:
Whether there is a “demand curve” based on bids from demand or if
there is a central schedule and dispatch (done by the system operator)
114 FINAL REPORT
Whether the main investment incentives are based on energy or capacity
remuneration
The EU target model is energy-only and the market participants, including the
demand side, place bids and offers to establish the operating schedule. The market
design implies that the real-time balance is achieved step-wise:
1. Forward markets signal long-term prices to which supply and demand may adjust
2. Day-ahead market bids and offers represent the ability and costs associated with different levels of supply and demand
3. The intraday market offers opportunities to handle deviations from the day-ahead market solution due to forecast errors and contingencies that appear after gate closure in the day-ahead market and prior to gate closure in the intraday market
4. TSOs manage real-time (within the hour) deviations due to within the hour variations (structural imbalances) and forecast errors and contingencies not handled in the intraday market.
The day-ahead market is in essence a forward market (albeit short term), and
deviations from the day-ahead market solution will occur in real-time. Such
deviations may be handled by market agents’ trading in the intraday market, or by
the TSO in real-time. Forecast errors may appear and contingencies occur at any
time between closure of the day-ahead market and real-time.
However, even if the market agents handle all deviations from the hourly day-
ahead market solution in the intraday market, the TSO needs access to balancing
reserves. The reason for this is that the day-ahead market operates as if demand
(and supply) is stable within each hour, which it is not. In order to handle planned
and unplanned deviations in real-time, the TSOs must have access to reserves for
balancing within the hour.
TSOs has to procure reserves for real-time balancing in order to manage
imbalances and bottlenecks, incidents and disturbances during the operation hour.
Even if BRPs do not deviate from the day-ahead/intraday plan, their generation
and/or consumption is not constant within the hour. The TSOs are responsible for
the within the hour system balance. To this end TSOs purchase different kinds of
balancing reserves, including manual restoration reserves used to manage
congestions and imbalances, and automatic reserves used to ensure system security
(frequency) and to manage imbalances. The DR activated in balancing markets
may be described as reactive as these mechanisms respond to unwanted (but
sometimes inevitable) deviations from schedule.
It is important to note that neither form of Demand Response is a replacement for
the other. Even if most DR takes place in the energy markets, there will always be
deviations from schedule that needs to be handled real time. And there may also be
local DSO markets for flexibility not covered by the wholesale markets.
STUDY ON DOWNSTREAM FLEXIBILITY, PRICE FLEXIBILITY, DEMAND RESPONSE & SMART METERING 115
Figure 5-12: The EU target model for electricity markets
The energy markets’ timeframe is up until gate closure 1 hour before real time.
Loads participating in the balancing markets will be dispatched by the system
operator according to their bids (and location), or may be notified to curtail loads
within a defined (short) time frame.
In addition to the electricity markets, some MS have some sort of capacity
mechanisms in place, while others have implemented or are planning to implement
capacity markets to ensure long term capacity adequacy.
The bids in energy markets provide a baseline, while a baseline is
administratively set in the US markets
As stated earlier in this report, US markets have provided substantial levels of DR.
Before we look into different policies to increase DR in MS, it may be interesting
to take a closer look at the differences and similarities between the US markets and
the target model for the integrated EU energy market. It is important to notice the
difference in the role of the TSO, both in the scheduling and during the operating
hour in the target model versus in the US markets and also how the energy market
influences this role.
One purpose of the energy markets is to prevent and limit imbalances in the
operation phase, and may therefore be seen as proactive DR. In practical terms, the
day-ahead market solution (including nominated supply and demand) means
setting a baseline for the demand and generation for the operating hour and
participation is mandatory for both demand and supply in the form of balance
responsible parties (BRPs). BRPs are penalized if they do not adhere to the plan in
real-time (imbalances), unless they have managed (foreseen) imbalances in the
intraday market. Hence, the balance responsibility creates an incentive to handle
imbalances as soon as they become known. By placing bids in the energy markets,
the demand side also participate in the price formation, and may help prevent price
peaks.
The schedules for each market participant serve as a starting point for the TSO in
operation of the real time balancing of the system. The schedule from each market
participant also sets a baseline for the energy consumption if bids in balancing
markets are not activated. This baseline is helpful when settling imbalances and
rewards for activation.
The mandatory participation in scheduling real-time operation gives the BRPs a
responsibility not to deviate from schedule and the risk of penalties if they do so.
BALANCING
12-36 hours before real-time Real-time operation>1 before real-time
Managing energy Managing the system
FORWARD
>24 hours before real-time
Managing risk
DAY-AHEAD
Target model:
• Fysical transmission rights• Fysical transmission rights -
use-it-or-sell-it
Target model:
• Single price coupling – one algortihm calulationg all market prices
Target model:
• One European platform for continuos trade based on implicit auctions
INTRA-DAY
116 FINAL REPORT
This is not the case in the US markets, as the demand side at best is allowed to
place bids. In the US-markets the operating schedule is set by the TSO and there is
therefore no issue of imbalances or risk for the BRP in the case of independent
aggregators providing DR. Suppliers are settled on the basis of metered load and
have no up-front energy position. However, this approach raises questions
regarding the “business-as-usual” load that would have been consumed if it had not
been activated. Such a baseline is needed as a basis to verify and settle energy and
the level of DR activated. There are different ways of establishing a baseline for
loads that are active in the markets. It is important that the approach for
establishing a baseline avoids the opportunity for gaming, i.e. the possibility to
increase the baseline before activation to increase the reward of activation (which
is often the difference between the baseline and the actual metered load).
Manipulation of the baseline has been discovered, and penalized, in the US markets
(Brattle, 2015).
In energy-only markets the main incentive for DR is variable energy
prices
In several of the US markets often referred to when discussing DR, the market
design is fundamentally different for the EU target model. In PJM, ISO-NE
(combined with a day-ahead market) and Ontario the main incentive for
investments is capacity. In all of these examples it is voluntarily for the demand
side to place bids in the day-ahead markets. However, the price peaks are more
frequent in energy only markets compared to capacity based markets, and price
variations are the main incentive for the demand side to be active in these markets.
In a capacity based market design, the price variations of energy are generally
lower than in energy-only markets. Hence, the incentive for DR in energy markets
are significantly higher in energy-only markets (like the EU target model) than it is
in capacity markets. Implementing capacity markets in MS will to some extent,
depending on the actual design, reduce price variations in the energy markets and
thereby reduce incentives for DR in energy markets.
STUDY ON DOWNSTREAM FLEXIBILITY, PRICE FLEXIBILITY, DEMAND RESPONSE & SMART METERING 117
Figure 5-13: Weekly-average energy prices in Energy-Only markets (left) and Capacity markets
(right) (prices in AUD/MWh)
Source: AECM (2015)
Penalties for imbalances provides extra incentives for DR
A BRP that deviates from his spot market commitments is penalised by an
imbalance cost. This penalty is paid to the TSO who incurs costs in order to handle
the residual imbalance.
If the cost of energy in the balancing market is the same as the actual payment for
the energy, this will be a zero-sum game for everyone involved and there is no
incentive for the BRP to stay in balance. However, the cost of energy bought,
prices in the energy markets and prices in the balancing markets may not be the
same:
The supplier may have bought energy as part of a portfolio and in a long
time frame instead of buying the energy in the DA market. If compensation
for energy volumes is based on DA-prices this may result in compensation
to the supplier being higher or lower than the energy price in balancing
markets
According to the NC for balancing suggested by Acer, the TSO will set the
prices for imbalances. Imbalance price for shortage should represent at
least the weighted average price of FRR and RR reserves needed to restore
balance. For surplus on the other hand, the price of activating FRR and RR
is the upper limit for imbalance prices. The merit order curve for these
markets are not the same as for energy markets, and prices will most likely
be higher.
As long as it is cheaper to ensure balancing in the intraday market than in the
imbalance settlement, the balancing responsibility yields an incentive to place bids
and nominations as accurately as possible, and to manage imbalances in the
intraday market.
118 FINAL REPORT
Incentive-based demand reduction in the wholesale energy markets helps reduce
imbalances in the operating hour by improving the planning of supply and demand
ahead of the operating hour, thereby improving price formation and reducing the
need for balancing reserves. In addition, flexible DR can also help manage
imbalances in the operating hour, e.g. in the form of interruptible loads.
The main advantage of including both the generation side and the demand side in
wholesale price formation is to minimize unforeseen imbalances in the operating
hours. Handling of imbalances in real-time is in general both riskier and costlier for
the system. The costs are higher because the costs of provision (of flexibility) are
higher when notification is short, and all flexibility resources are not able to react
on very short notice. Thus, the barrier for the demand side to participate is lower in
the day-ahead and the intraday markets since the notification time is longer (ahead
of real-time). Moreover, price formation becomes more efficient with participation
of DR, as price sensitive bids in the day-ahead or intraday markets should reveal
the available volumes of flexibility and the associated cost of DR.
5.4.3 The role of aggregators in the wholesale energy and
balancing markets
As opposed to service providers and technology that helps the consumers respond
to price signals in the market (and thereby bringing the market to the loads, see the
figure below), the aggregator acts as an intermediate between the consumer and the
different market participants procuring flexibility . The energy markets are
complicated for most users and even industrial consumers may use service
providers or suppliers to nominate loads in day-ahead and intraday markets, and to
sell flexibility in balancing markets. Service providers may help commercial and
industrial consumers to better understand the markets and to adjust to markets to
save costs. Such services will mainly be price-based by providing market data and
automation to help adjust loads according to price signals.
Figure 5-14: Service providers enabling demand response
Below we discuss four different models for aggregated DR in the markets:
The suppliers integrate aggregated DR as part of their service offering
The aggregator and supplier must bilaterally settle imbalances and costs
The aggregator must take on a second balance responsibility for activated
loads
Marked
and -data
Consumer
and loads
Information and
automation
Aggregator
STUDY ON DOWNSTREAM FLEXIBILITY, PRICE FLEXIBILITY, DEMAND RESPONSE & SMART METERING 119
The aggregator operates independently of balance responsibility and
without compensation
The supplier offering aggregated DR
In essence, suppliers may take advantage of, or offer, aggregated DR in the sense
that, in addition to supplying electricity and taking on the balance responsibility for
their customer portfolio, the supplier may integrate a DR service comprising all or
some consumers in their portfolio as illustrated in the figure below. By doing so,
the supplier may submit price-sensitive bids in the wholesale market, provide
flexible volumes to the intra-day market, and improve their own balance, thereby
reducing the cost of imbalances. If imbalance costs are high, this approach may be
attractive for suppliers. The supplier/ aggregator may also provide DR to balancing
markets and local markets for flexibility to the DSO. When the flexibility products
are priced differently, the supplier may optimize the use of DR across the different
flexibility markets.
An advantage of this setup, according to Enfo Energy (2014), is the integration
between the financial and physical power markets, without altering the main
market rules in the EU target model.
In a well-functioning market, one would think that suppliers would be interested in
aggregation, either on their own accord or via external aggregator (service
providers). In a competitive market where the consumers are interested in
providing incentive based DR, adding aggregated DR to the service offering will
be necessary to keep market share. This will only be valid if the consumer is able
to change supplier at a very low cost.
Aggregation (and energy management) of flexible loads is a different business than
retail electricity provision, this may serve as a barrier for suppliers to enter into
aggregation (at least without service providers). Moreover, retail electricity sale is
an economies of scale business, and it may take time to build a sufficient customer
base for aggregators to take on the role of electricity suppliers.
On the other hand, this kind of setup may cause consumer lock-in. To avoid lock-in
effects, there should be several suppliers offering aggregated DR in the market.
Reducing barriers to enter the retail market may therefore be one essential task in
order to encourage efficient retail aggregation.
NordREG, the cooperation body of the Nordic electricity regulators, recommends
that only suppliers should be allowed to offer aggregated DR in mature and well-
functioning markets as the Nordic (NorREG, 2016). Also in Belgium, the TSO
states that all markets are open to the aggregated bids as long as they are handled
by the supplier (JRC, 2016).
120 FINAL REPORT
Figure 5-15: The supplier as an aggregator
Source: Enfo Energy AS and The Norwegian Smart Grid Centre (2014)
Independent aggregators compensating BRPs
Aggregators and suppliers may act independently of each other in the markets, and
settle the costs of energy and imbalances after activation of bids. The settlement
process could either be based on bilateral agreements between aggregators and
suppliers or be subject of regulated standard agreements. In the first case, the
suppliers will have the power to keep aggregators out of the markets if they do not
see any benefits for themselves in entering into an agreement. Standard agreements
could make aggregators able to enter the market without the consent from suppliers
and remove this barrier for aggregated DR. Regulated standard agreements will
contain regulated prices for costs of imbalances and energy that may not correctly
represent the cost of the supplier.
In order for this solution to be interesting for aggregators, the value of bids in the
markets must be higher than the BRP’ cost of imbalances caused by the DR, or else
there will be no revenue to split between the aggregator and the consumer after
compensating the supplier. This depends on how the penalties for imbalances are
set up and the TSOs cost of balancing.
The case of load reductions by an independent aggregator is shown in Figure 5-16.
The principle will be the same if there is no aggregator and supplier involved,
except that the consumers handle the flow of energy and payments themselves (i.e.
large industries).
STUDY ON DOWNSTREAM FLEXIBILITY, PRICE FLEXIBILITY, DEMAND RESPONSE & SMART METERING 121
Figure 5-16: Energy and payment flows when an independent aggregator curtails a load
Source: Baker et. Al (2015)
In this model, as in the markets in the US, there will be an issue of setting up a
baseline for the activated loads. Even if the bids are placed as an aggregated bid,
the question arises if the baseline needs to be for every load participating to be able
to both verify the loads activated and to provide correct settlement for costs and
rewards.
France and Belgium (for specific products) are the only MS that has opened
wholesale and balancing markets to independent aggregators. The relationship
between aggregators and retailers/BRPs is regulated, and a standardized process
has been put in place. In France even residential consumers have been activated,
possibly due to aggregation-friendly product definitions. However, there are
ongoing disputes about the imbalance settlements and the level of compensation
(JRC, 2016).
In Germany, aggregators must currently make bilateral agreements with the
balance responsible supplier on compensation, and there is no standard agreement
or no obligation for the retailer to enter into such agreements (JRC, 2016).
Aggregators as BRPs
An alternative way of dealing with balancing responsibilities is to make both
suppliers and aggregators BRPs, and let the TSOs handle the imbalance settlement
between the different BRPs. Acer states in their recommendation for NC balancing
codes in 2015 that aggregators should be able to operate without consent or
contract with the supplier (BRP), and that the aggregator in that case should be
BRP in addition to the BRP for the same connection point. The TSO should then
adjust positions and determine the final positions for both BRPs; the supplier and
the aggregator. The TSO will also be responsible for the financial settlement for
both parties. In this case the aggregator will have a profit in the markets as long as
the reward for activation is higher than the reimbursement to the supplier which
will normally be the case.
122 FINAL REPORT
In this case, two BRPs are responsible for the same consumer/connecting point. If a
high number of consumers end up having two BRPs, however, the settlement
process may become extremely complex and costly. The baseline for supplier’s
bids or nomination is set for the total load from all the suppliers customers and the
aggregators bids also represents an aggregated volume for a number of loads. The
activated loads will correspond to consumers from many different suppliers.
According to NordREG (2016), it seems challenging to ensure a correct estimate of
the different BRP’s imbalances, as the settlement function would not be able to
separate the origin of the aggregated imbalance volumes. A mitigating measure
may be to require the independent aggregator to split and separate the demand
response bids according to from which supplier’s BRP the demand response
originates. Even if this separation is made, it seems challenging for the settlement
function to validate if the bids are correctly split between the different supplier’s
BRPs. Address (2011) argues that if this option gives widely used DR from
independent aggregators, there is no longer any way of setting up a reference
baseline for the consumers involved in aggregated bids. Unless there is a baseline
and a separate settlement calculation for every load involved in the bids it will be
impossible to know which deviations for the baseline is a result for actual
imbalances or activation of DR.
Figure 5-17: The balancing settlement for two BRP on the same connection point
Source: NordREG (2016)
Aggregators operate independently of balancing costs
One could argue that independent aggregators could be an option to increase DR
from small consumers as the administrative procedures for the different models of
settle imbalances and costs are administratively heavy. However, this is not in line
with the pro-activeness of DR in the target model as it will make scheduling for the
STUDY ON DOWNSTREAM FLEXIBILITY, PRICE FLEXIBILITY, DEMAND RESPONSE & SMART METERING 123
operating hour less accurate, the same resource may be double rewarded and the
risk for the supplier will increase.
Aggregators that are not BRPs will not have to face imbalance costs due to demand
response. As the aggregator faces no risk of penalties in the markets, this option
will increase the risk of gaming by aggregators (Address, 2011).
Figure 5-18 Independent aggregator without balancing cost, information of actions to the
retailer
Source: Enfo Energy AS and The Norwegian Smart Grid Centre (2014)112
NordREG (2016) presents some examples of cases where an aggregator without
balance responsibility place bids in the market for system services, of which we
present one example in the textbox below. As we can see, since the “independent
aggregator” does not have balance responsibility, it would, in this setup, end up
with a positive net result of 550 €, i.e. the full value of the upward regulating bid.
At the same time, the supplier is also rewarded for the same demand response, as it
has an imbalance that is helping the market. Due to the two-price system in the
Nordic imbalance settlement, the supplier – who is a passive contributor as it does
not participate actively in the balancing market – is compensated based on the day-
ahead price, while the aggregator – who has actively bid the DR into the balancing
market – is paid according to the marginal balancing price, which, in the Nordic
market, has to be higher than the day-ahead price.
The double rewarding of the demand response implies a net increase in the total
cost settlement. These losses would somehow need to be covered, either by the grid
users through tariffs or by other BRPs in the balance settlement. According to the
suggested NC of balancing from ACER, the terms and conditions for imbalance
prices will be set up by the TSOs, and the suggested pricing will generally have the
same risk of double awarding for independent aggregators as the Nordic model.
124 FINAL REPORT
Source: Nord Reg (2016)
To reduce the retailers’ balancing costs caused by aggregators, the aggregator or
the consumer could be required to inform the supplier about the agreed terms of
load changes between the consumer and the aggregator. In such arrangements, the
BRP may include the costs or the risk of imbalances in the contractual terms with
the consumer. However, the savings of the consumer by providing demand
response via an aggregator may be significantly reduced by increased costs to the
supplier. On the other hand, if the actions of the aggregator can be foreseen by the
Scenario:
1. The BRP (supplier) has procured 10 MWh in the DA market
The supplier submits a consumption schedule of 10 MWh
2. The Independent Aggregator is not a BRP and has no supply commitment, and
therefore does not procure electricity in the DA market
The aggregator does not submit a schedule
3. The Independent Aggregator (not BRP) submits a 10 MWh upward regulating bid to
the balancing market
4. The TSO buys a 10 MWh upward regulating bid from the Independent Aggregator (not
BRP)
Financial result of the BRP (supplier):
Since the BRP (supplier) has a consumption schedule of 10 MWh, but ends up consuming 0
MWh, the BRP (supplier) would have a positive imbalance of 10 MWh. Further, the BRP
(supplier) has already procured 10 MWh in the DA market. The net result of this in would be:
Market Volume Price Cost/payment
Procurement in DA -10 MWh 50 €/MWh -500 €
Sale of balancing bid 0 MWh 55 €/MWh 0 €
Settlement position 10 MWh 55 €/MWh 550 €
Net result 50 €
The BRP (supplier) would end up with a net result of 50 €, since it would end up with a positive
imbalance of 10 MWh. (Note that the positive net result is due to the Nordic market rules which
imply that the retailer is compensated for imbalances that helps the system according to the
reserve price.)
Financial result of the Independent Aggregator (not BRP):
Since the Independent Aggregator (not BRP) does not have balance responsibility, it would not
have an imbalance or even be settled for imbalances. It would only receive a payment from the
TSO for the 10 MWh upward regulating bid. This net result of this would be:
Market Volume Price Cost/payment
Procurement in DA 0 MWh 50 €/MWh 0 €
Sale of balancing bid 10 MWh 55 €/MWh 550 €
Settlement position 0 MWh 55 €/MWh 0 €
Net result 550 €
STUDY ON DOWNSTREAM FLEXIBILITY, PRICE FLEXIBILITY, DEMAND RESPONSE & SMART METERING 125
retailer, there is also a chance that aggregators predicable actions are taken into
account when the supplier places bids (if there is no baseline per activated load).
Conclusion on the aggregators role within the EU target model
There are two main questions regarding aggregators in the wholesale energy
markets:
Should aggregated bids be allowed?
If so, how should the aggregated loads be verified and settled to ensure
fairness for all parties involved?
Aggregation is probably the only way of activating loads for consumers not being
BRP themselves. One should note, however, that suppliers aggregate loads of their
consumers when they bid into the energy markets and knowledge of price
sensitivity in the retail market will then convert into price-sensitive bids in the DA
market. A large part of the DR potential comes from smaller loads that may in total
make a difference in managing the power system. To overcome the barrier of
minimum volumes in balancing and capacity markets, small commercial loads may
be aggregated and bid into the markets in one “block”. An aggregator could exploit
economies of scale by aggregating DR from several suppliers, thereby being able
to place more competitive bids. Small loads (commercial and buildings) must be
handled in a simple and standardized way to reduce costs – if not, they will not be
cost efficient flexibility sources compared to larger loads (industry) or generation.
Aggregators may play an important role to bring some economy of scale in DR
from smaller loads.
Aggregators will also simplify the use of DR for the TSOs. The higher the number
of bids in the markets, the more complicated the operation and activation of bids.
Aggregators help limit the increase in bids and at the same time bring new loads
into the market places.
We have discussed four different ways to organise aggregation. The table below
shows how each option affects the need for a baseline per load, what settlement
process is needed and how risk is divided between the supplier and the aggregator.
The first and the last option has the lowest administration and complexity in the
settlement process. The first option, suppliers offers aggregated DR, is the simplest
set-up in all terms, as this can be done without changing any main processes in the
EU target model. The two models with a financial settlement between suppliers
and aggregators introduce complexity in the settlement, since compensation
between the parties must be handled, but shares the risk between the two parties.
This requires a discussion on what the compensation for energy should be, a
question there is no exact answer to. The first option does not introduce any new
risk for the retailer as they have full control of their own actions, bids and
responsibilities. If there is no settlement between the retailer and the aggregator,
the supplier will hold the full risk imbalances (which may in some cases also be to
their benefit), but will generally increase the cost for the system (by double-
rewards) compared to the other options representing a zero-sum game. The supplier
126 FINAL REPORT
will in this case have a responsibility (being BRP), but do not have the power to
handle this risk – or to take on the full responsibility of being BRP.
Table 16: Summary of different organisation of the aggregator role
Option Baseline Settlement Risk
Aggregated DR as
part of suppliers
service
No (suppliers bid is
sufficient) Not needed No added risk
Bilateral settlement
(standard) Per load
Per load, suppliers
and aggregator
Shared, but
depending on the
agreement
Supplier and
aggregator BRP for
the same load
Per load Per load, suppliers
and aggregator Shared
No settlement
between aggregator
and supplier
Per load
Per load – energy
Per aggregator -
financially
Supplier and the
system takes the
risk, and incentives
for gaming
(aggregator)
Allowing aggregators, or rather, small loads to participate in the market could be a
means to enhance the competition, both towards large industries delivering most
DR today, and also to the generation companies. Increased competition could
reduce overall system costs as long as a level playing field is ensured for all
participants. In that sense, aggregators should not have any advances compared to
other market participants in the long run, even if one could give incentives in the
short run to increase aggregators' role in the markets in order to enhance demand
response. First, the barriers for market entry should be lowered including any
unnecessary barriers for becoming a BRP in the market.
In addition, or to speed up this process, independent aggregators may be allowed to
challenge the usual business of traditional suppliers. Setting up regulated standard
agreements for the regulation of the relationship between the BRP and the
aggregator could reduce the barrier to entry for aggregators. Up to a certain
volume, or for a limited time, aggregators may also be allowed to operate
independently of balancing responsibility to help establishing a market for
aggregated DR until a better solution is established. This is mostly relevant for MS
where demand side do not have access to day-ahead markets.
In the longer term however, the role of the aggregator should be integrated with the
role of the supplier or the aggregator should be held responsible for the cost of the
imbalances they cause, in order to ensure a level playing field for all market
participant and to not allow independent aggregators to be free riders. An
STUDY ON DOWNSTREAM FLEXIBILITY, PRICE FLEXIBILITY, DEMAND RESPONSE & SMART METERING 127
alternative is to partly or fully release the suppliers from the balancing
responsibility and let the TSO take over the scheduling responsibility. Other
implications of this must then be taken into account. The suppliers will no longer
have the incentive to promote proactive DR from their consumers and the
nomination will be administrative rather than market based.
5.4.4 Measures to increase incentive-based DR
Important policies to facilitate and incentivize DR in all markets is to ensure that
all market players, on both the generation and the demand side, can participate on
equal terms. At the same time, to ensure efficient market solutions, it is also
important that all participation is associated with a balance responsible party. The
balance responsibility ensures that a large part of the planning of the system
balance up to real-time is entrusted to the market participants in the day-ahead and
intraday markets, while the momentary balance is the responsibility of the
authorities, i.e., the TSOs by delegation.
Important barriers to incentive-based DR identified by SEDC, cf. section 3.2.3, are
that
Loads are not accepted as a resource in the markets (neither directly nor by
There are no measurement and verification rules for DR participation
(neither directly nor by aggregation)
The payment structure is inadequate and non-transparent, and penalty
structures act as a critical barrier
Policies to increase or introduce DR in the market should thus be directed at these
barriers. Possible measures to incentivise participation of DR in wholesale markets,
besides allowing such participation, include:
To ensure that demand participates at a level playing field with generation
To reduce the market resolution (i.e. from hourly to 15 minutes or less)
To move market closure closer to the operation hour
To extend the number of bidding possibilities to take account of the wider
range of heterogeneity on the demand-side
Allowing aggregated bids when possible
Correspondingly, possible concrete measures to incentivise DR participation in
balancing markets are:
128 FINAL REPORT
Reduce minimum bid volumes to allow for smaller loads to participate
Adjust product designs to better fit the demand side (bid size, duration,
recovery time, response time, etc.)
Set up standard processes and settlement between aggregators and
suppliers
It should be noted that these measures are not independent of each other. If the
market resolution is not adapted to the participation of demand-side resources in
terms of product definitions and market resolution, ensuring a level playing field
with generation may not accomplish much.
5.4.5 Approach to estimation of DR potential in the options
So how much of the (remaining) DR potential could changes in regulations and
market designs, plus implementation of incentive-based schemes bring about?
In general, there is no limit to how much of the (remaining) theoretical DR
potential that incentive-based mechanisms could deliver, if barriers are removed
and incentives are made strong enough. Hence, the expected potential for
incentive-based DR depends on:
› The removal of barriers to DR
› The remuneration of DR in different schemes
The first step is to remove the barriers to DR. The policy options presented in
chapter 4 focus on a step-wise removal of the main barriers related to DR
participation in the markets:
› Consumer access and aggregation
› Programme description and requirements
› Finance and penalties
The first step is of course to allow DR participation in the markets, and to provide
the rules and regulations to ensure a level playing field. However, as argued above,
and as shown by some of the experience, adaptation of product definitions and the
facilitation of aggregation should also reduce the barriers for participation.
Secondly, the potential depends on the cost of providing the flexibility, the price
structures and the alternative flexibility resources in the market. It is likely that the
potential will grow over time as technology is developed and more widely used, as
well as due to innovation in contractual arrangements and service definitions.
It should be apparent from the above sections that the basis for estimating the
potential for DR based on different policy measures is very weak indeed. We have
some evidence and estimates from different countries, but many schemes are
limited and for many schemes it is still early days. Some reasons why it is difficult
to draw solid conclusions based on the evidence are:
STUDY ON DOWNSTREAM FLEXIBILITY, PRICE FLEXIBILITY, DEMAND RESPONSE & SMART METERING 129
The experience from one market cannot easily be transferred to another as
the potential for incentive-based DR depends on the general market design,
including the degree of price-based DR. For example, the US in general
has a market design that is very different from the European target model.
The price structure and the exposure of end-users to TOU or RTP pricing,
and hence the resulting price-based DR, varies between markets. For
example, the Nordic market is characterized by much smaller diurnal price
variations than markets in the rest of Europe, while in many MS retail
prices are to a large extent regulated, heavily influenced by taxes and
levies, or based on averages.
The potentials realized in small pilot experiments may be over-estimated
for several reasons: self-selection of participants, combination with
information and novelty motivation, short time duration, non-cost based
compensation, etc.
The specific assumptions for each of the options is presented further in subsequent
section on each option. Before assessing the business as usual case, the next sub-
section discusses possible overlaps between the estimation of price and incentive
based demand response.
5.4.6 Link between price and incentive based demand
response
There is an obvious link between price based DR and the demand sides’
participation in the wholesale energy market for suppliers representing small
consumers. The supplier (BRP) place purchase bids (or nominations) on behalf of
their customers. The bids may be price-sensitive based on the experience of the
supplier when it comes to how its customers adjust to prices. Hence, the bids may
reflect to some extent price-based DR of end-users, depending on their exposure to
wholesale market prices. In addition, or alternatively, the supplier may employ
incentive-based schemes with explicit contracts with its customers, on which basis
it can place more flexible bids in the day-ahead market. Such incentive schemes
may be promoted via provision of home automation, information in the case of
peak-prices in the day-ahead market, etc.
On the one hand, Price-based Demand Response can be accessed by a wider range
of consumers through supplier-enabled dynamic pricing programmes. To some
extent price-based DR can be thought of as “easy DR” (low-hanging fruits).
However, the potential for incentive-based DR is probably larger if the price-based
potential is not already tapped into. For example, if end-users only face average
retail prices, they have a weak incentive for price-based DR, and the potential that
can be activated by incentive-based mechanisms is larger.
On the other hand, activation of price-based DR by way of smart metering and
RTP pricing, may make it easier for end-users to participate in incentive-based
schemes as well. (By the same line of argument, incentive-based schemes
involving installation of smart meters may increase price-based DR, as it gives
130 FINAL REPORT
end-users the means to respond to hourly prices – and to choose TOU or RTP
pricing if available.)
Regarding the link between price and incentive based demand response; the
following is our approach:
Industrial customers that act as BRP are unlikely to respond directly to
price, but will bid in volumes of consumption into day ahead and intra-day
markets and may also participate in balancing and capacity markets.
Hence, the key mechanism will be incentive-based DR.
Smaller residential customers may respond to price signals. Aggregating
their load to participate in wholesale balancing and capacity markets is
administratively complex under the Target Model (due to the need for a
baseline and settlement of energy and financial compensation per activated
load), and potentially costly. Hence, the key mechanism will probably be
price-based DR. Smaller commercial customers can be considered similar
to residential customers in this respect.
For the medium to larger commercial customers both mechanisms could
apply:
o Once these customers have smart meters and automation they
could respond to prices as long as they know the day-ahead price
etc., (price-based)
o In addition, they could cooperate with suppliers, or aggregate
balancing reserve in the balancing and capacity markets (incentive-
based).
Relating the above to the levels of incentive based DR:
o For all MS (except Finland where industrial loads are relatively
high) with incentive based DR volumes in todays situation, the
actual level is higher than the industrial Gils potential. This means
that either Gils potentials are low or non-industrial loads are
providing DR.
o To avoid double counting, we have not included any (extra)
volumes in the policy options for the energy market in addition to
volumes found in balancing and capacity markets.
o In policy option BAU – all MS (except the MS already reporting
DR levels) have incentive based DR lower than industrial potential
o In policy option 1 – MS have lower or slightly over the industrial
Gils potential (with the same exception as above)
o In policy option 2 and 3, most MS have higher incentive based DR
than the industrial potential, meaning that commercial loads must
participate. This is also in line with the fact in bullet point one
Where the market is more price sensitive for small customers will it affect the
incentive-based response of larger customers?
STUDY ON DOWNSTREAM FLEXIBILITY, PRICE FLEXIBILITY, DEMAND RESPONSE & SMART METERING 131
For this to be the case, price-based DR of small customers would need to
reduce price volatility in wholesale markets. As small customers will not
participate directly in these markets, the impact on price formation is not
clear cut. The impact of price based DR on incentive based DR may
depend on how the retailer responds in the wholesale market by
experiencing price response in the consumer markeds and turn this in to
price-dependent bids in the DA and ID markets.
Where there is more equipment and automation to drive price-based DR,
this equipment will also be available to promote incentive-based DR, as
long as the equipment allows for remote control from i.e., an aggregator.
Can the price-based and incentive-based responses be added?
It will not always be the case that the price-based and incentive-based
responses work at the same period. While some price-based response will
respond to price (particularly where automation is involved), other
response may be more closely linked to reducing peak loads (more
sophisticated ToU tariffs, CPPs), whereas incentive-based measures will
affect periods of high prices that need not necessarily correspond to peak
load, but rather low generation or incidents affecting security of supply or
imbalances.
Commercial customers could decide whether to be compensated through
price or be dispatched – therefore participation is a case of either through
price based approaches or incentive based mechanisms – i.e., we have to
be careful not to double count.
Commercial customers could also choose to be first lower their loads based
on price signals, and then bid in the rest of the load to balancing or
capacity markets. In this case, the potential for incentive based DR is
lowered by the price response, but a portion is still there.
5.5 Business as usual
Based on the assessment of price and incentive based demand response, the
specific estimation of how much demand response will be realised under the BAU
option is described in the following two sub-sections.
5.5.1 Assessment of price-based DR in BAU
Based on the stated methodology as described in Section 5.3, the resulting
estimates of incremental price based DR estimates in the BAU scenario are set out
below. These figures are over and above the estimates of more “traditional” price
based DR set out in section 5.3.1. These assume that across the EU-28 the
following load is shifted or reduced:
2016 – 5,779 MW (99.6% standard appliances, 0.4% EV,HP, SA)
132 FINAL REPORT
2020 – 6,433 MW (88% standard appliances, 12% EV,HP, SA)
2030 – 15,383 MW (35% standard appliances, 65% EV,HP, SA).
The estimate by country is set out in the following table.
Table 17: Price based DR – BAU scenario 2016, 2020, 2030 (MW)
Member State 2016 2020 2030
Austria 94 104 326
Belgium 130 116 75
Bulgaria 54 46 29
Croatia 34 30 20
Cyprus 12 11 8
Czech Republic 93 80 50
Denmark 78 97 251
Estonia 15 16 33
Finland 140 156 375
France 841 963 2915
Germany 930 842 1441
Greece 137 145 241
Hungary 88 76 48
Ireland 49 69 206
Italy 699 848 2559
Latvia 19 20 37
Lithuania 27 23 15
Netherlands 195 226 661
Poland 306 318 646
Portugal 90 79 56
Romania 128 131 240
Slovakia 60 55 56
Slovenia 22 19 11
Spain 537 689 1815
Sweden 269 299 633
UK 733 976 2634
TOTAL 5779 6433 15383
Source: Own calculations
5.5.2 Incentive based demand response
The baseline option assumes that the current incentive-based DR mechanisms are
continued, and that new efforts are meagre. As we have shown in section 3.2.3, the
existence of incentive-based mechanisms varies between Member States.
Moreover, existing schemes differ, and only a few MSs employ several schemes.
Hence, the modelling of the baseline should be based on an MS-to-MS assessment.
Looking at the different consumer groups (processing industry, C/I, retail), we may
assume that where access to the market is allowed, some large industry (as BRP) is
in a position to participate directly in the markets, i.e. both in the wholesale and in
the balancing/reserve markets. When it comes to C/I customers, they are likely to
only participate via aggregators, provided that they have smart metering, etc. We
do not expect retail customers to be able to participate in incentive-based DR.
These are very different flexibility products: Energy efficiency (EE) may
participate in capacity mechanisms, if EE investments permanently lower demand
levels, including peak demand. Demand interruption is easy to measure, while
demand reduction of time-shift of demand may be related to a baseline.
STUDY ON DOWNSTREAM FLEXIBILITY, PRICE FLEXIBILITY, DEMAND RESPONSE & SMART METERING 133
The possibility of participation by DR does not imply that the full potential can be
activated if prices are high enough. For example, there may be no discrimination
between generation and demand in the regulation or product definitions in the
reserve markets. Still, the volumes, response time, duration and other
characteristics, defined by the TSO, may serve as a barrier for participation in DR
in these markets.
In general, it can be assumed that incentive-based DR is non-existing or limited in
some MS in the baseline scenario, i.e. MS not having introduced the EU target
model. However, some MS have reported high levels of DR in line or even above
levels in US markets. In the estimate of DR levels, the price sensitivity in the
energy wholesale market is not included in the table, but levels up 18 % of peak
load have been seen in some MS.
It is assumed that further uptake of the incentive based demand response will
require further changes to the regulation; see the assumptions for Option 2.
The estimation approach for incentive based DR
DR potential is based on evidence where available –in terms of % of peak load. For countries where no evidence is available, the following estimates were applied:
o For MS where DS is not allowed in markets: 0 % of peak load o For MS where DS is allowed to participate in the energy wholesale
market: 0.5 % of peak load o For MS where DS is allowed in energy markets and two additional
markets: 1.0 % of peak load
These levels are low compared to the levels we have found in MS where the DS is
allowed to participate. Below is an example of how these rules are applied to the
BAU, including actual volumes of DR where this is found. The assumptions for the
BAU by Member States are presented below.
Table 18: Assumptions for Incentive based DR – BAU scenario 2016, 2020, 2030
Country Peak load in GW BAU assumptions for peak load reductions
2016 2020 2030 2016 2020 2030
Austria 10 11 12 1.00% 1.00% 1.00%
Belgium 14 14 15 5.00% 5.00% 5.00%
Bulgaria 6 6 6 0.00% 0.00% 0.00%
Croatia 3 3 4 0.00% 0.00% 0.00%
Cyprus 1 1 1 0.00% 0.00% 0.00%
Czech Republic 10 10 12 0.50% 0.50% 0.50%
Denmark 6 6 7 10.00% 10.00% 10.00%
Estonia 1 1 2 0.00% 0.00% 0.00%
Finland 14 14 14 6.00% 6.00% 6.00%
France 84 87 85 2.00% 2.00% 2.00%
Germany 86 84 98 1.00% 1.00% 1.00%
Greece 8 9 12 19.00% 19.00% 19.00%
134 FINAL REPORT
Country Peak load in GW BAU assumptions for peak load reductions
2016 2020 2030 2016 2020 2030
Hungary 6 6 7 0.50% 0.50% 0.50%
Ireland 5 5 5 1.00% 1.00% 1.00%
Italy 52 55 64 8.00% 8.00% 8.00%
Latvia 1 2 2 0.50% 0.50% 0.50%
Lithuania 2 2 2 0.00% 0.00% 0.00%
Netherlands 17 17 20 1.00% 1.00% 1.00%
Poland 23 24 30 1.00% 1.00% 1.00%
Portugal 8 8 10 0.50% 0.50% 0.50%
Romania 8 8 12 1.00% 1.00% 1.00%
Slovakia 4 4 5 1.00% 1.00% 1.00%
Slovenia 2 2 3 1.00% 1.00% 1.00%
Spain 42 46 58 5.00% 5.00% 5.00%
Sweden 22 23 25 3.00% 3.00% 3.00%
United Kingdom 51 50 55 3.50% 3.50% 3.50%
Total 486 500 568
Source: Own calculations and peak load data from Entso-E
The percentages are converted to % of theoretical potential to enable estimates of
DR on end use level. The results are presented in the below table.
Table 19: Incentive based DR – BAU scenario 2016, 2020, 2030 (MW)
Member State 2016 2020 2030 Austria 104 106 122
Belgium 689 697 749
Bulgaria 0 0 0
Croatia 0 0 0
Cyprus 0 0 0
Czech Republic 49 49 61
Denmark 566 592 716
Estonia 0 0 0
Finland 810 846 836
France 1689 1744 1695
Germany 860 840 984
Greece 1527 1640 2305
Hungary 30 31 37
Ireland 48 49 50
Italy 4131 4367 5109
Latvia 7 8 10
Lithuania 0 0 0
Netherlands 170 171 200
Poland 228 244 300
Portugal 40 42 50
Romania 79 82 123
STUDY ON DOWNSTREAM FLEXIBILITY, PRICE FLEXIBILITY, DEMAND RESPONSE & SMART METERING 135
Member State 2016 2020 2030 Slovakia 40 43 48
Slovenia 21 23 26
Spain 2083 2288 2898
Sweden 666 685 748
United Kingdom 1792 1764 1922
Grand Total 15628 16309 18988
Source: Own calculations
5.6 Policy option 1
Similar to the assessment of BAU, the potential for price and incentive based
demand response under policy option 1 is assessed and estimated using the
approach and methodology described in Section 5.3 and 5.4.
5.6.1 Price based demand response
The main difference between this option and the BAU is that price-based demand
response would be greater in scope due to the broader take up of smart meters by
customers. Moreover, where customers are choosing to take up a smart meter it is
anticipated that this will be accompanied by some form of STOU, RTP or CPP
pricing.
The resulting estimates of price based DR under Option 1 are set out below. These
assume that across the EU-28 the following load is shifted or reduced:
2016 – 5,779 MW (99.6% standard appliances, 0.4% EV,HP, SA)
2020 – 6,943 MW (86% standard appliances, 14% EV,HP, SA)
2030 – 17,862 MW (33% standard appliances, 67% EV,HP, SA).
The estimate by country – as well as the increment over BAU in 2030 is set out in
the following table.
Table 20: Price based DR – Option 1 scenario 2016, 2020, 2030 (MW)
Member State 2016 2020 2030 Increase 2030 compared with
BAU
Austria 94 123 339 13
Belgium 130 122 366 291
Bulgaria 54 47 94 65
Croatia 34 30 58 38
Cyprus 12 11 20 12
Czech Republic 93 83 175 125
Denmark 78 97 260 9
Estonia 15 17 34 1
Finland 140 156 388 13
France 841 1135 3022 107
Germany 930 986 2552 1111
Greece 137 147 247 6
Hungary 88 77 137 89
136 FINAL REPORT
Member State 2016 2020 2030 Increase 2030 compared with
BAU
Ireland 49 69 214 7
Italy 699 956 2648 89
Latvia 19 21 38 1
Lithuania 27 23 40 25
Netherlands 195 254 684 23
Poland 306 324 662 16
Portugal 90 83 246 190
Romania 128 133 246 5
Slovakia 60 62 98 42
Slovenia 22 19 40 28
Spain 537 689 1874 59
Sweden 269 299 653 20
UK 733 976 2727 94
TOTAL 5779 6943 17862 2479
Source: Own calculations
The results show at an EU-26 (not enough data available for Malta and
Luxemburg) level an additional 2.5 GW of demand response than under the BAU
scenario. Greatest benefits are shown in Germany, Belgium and Portugal,
reflecting the assumption that a large number of customers will choose to take up a
smart meter, and in these cases a form of dynamic tariff. While high, the resulting
estimates of customers with dynamic tariffs in Germany, Belgium and Portugal in
2030 is similar to the estimate of electric vehicles assumed to be in place by this
date. The lowest increases are found in MS that already are assumed to have
policies that promote price based demand response (UK, Ireland, Denmark,
Finland, Spain and Sweden).
On the whole, the results show that in 2030 at an EU-wide level:
For normal appliances, 4.9% of potential demand response is captured,
while
For electric vehicles, heat pumps and smart appliances, 18.6% of potential
demand response is captured.
These estimates are sensitive to the take up of new forms of tariff and in particular
RTP/CPP. The proportion of potential DR for electric vehicles and heat pumps
captured ranges from around 13% for MS not currently supporting a widespread
roll out of smart metering systems to around 21% if it is planning a full scale roll-
out.
5.6.2 Incentive based demand response
Option 1 does not include anything that will fundamentally change the situation for
incentive based demand response, and therefore the level is similar to the level
assumed under the BAU.
Table 21: Incentive based DR – Option scenario 1, 2016, 2020, 2030 (MW)
Member State 2016 2020 2030
Austria 104 106 122
Belgium 689 697 749
STUDY ON DOWNSTREAM FLEXIBILITY, PRICE FLEXIBILITY, DEMAND RESPONSE & SMART METERING 137
Member State 2016 2020 2030
Bulgaria 0 0 0
Croatia 0 0 0
Cyprus 0 0 0
Czech Republic 49 49 61
Denmark 566 592 716
Estonia 0 0 0
Finland 810 846 836
France 1689 1744 1695
Germany 860 840 984
Greece 1527 1640 2305
Hungary 30 31 37
Ireland 48 49 50
Italy 4131 4367 5109
Latvia 7 8 10
Lithuania 0 0 0
Netherlands 170 171 200
Poland 228 244 300
Portugal 40 42 50
Romania 79 82 123
Slovakia 40 43 48
Slovenia 21 23 26
Spain 2083 2288 2898
Sweden 666 685 748
United Kingdom 1792 1764 1922
Grand Total 15628 16309 18988
Source: Own calculations
5.7 Policy option 2
This section presents how the potential for price and incentive based demand
response under policy option 2 is assessed and estimated using the approach and
methodology described in Section 5.3 and 5.4.
The potential for price based demand response is assumed to be the same as under
policy Option 1.
5.7.1 Incentive based demand response
There is international evidence that the demand side may provide peak load
reductions of 1-2 per cent of peak load from participation in the wholesale market
and 1-6 per cent of peak load from other incentive based DR (Brattle, 2015). Data
from FERC summarised by Brattle (2015) and University of Oxford (2015)
indicates a total incentive based DR of approx. 8 per cent of peak load reductions
in PJM where the incentive based DR has the largest uptake. Some US markets
138 FINAL REPORT
have even had more than 10 per cent peak reductions from DR one of the years
between 2009 and 2012, see figure below.
Figure 5-19: Levels of incentive based DR in terms of MW and peak load reductions
Source: University of Oxford (2015)
DR is already represented in some way in the wholesale energy markets in half of
the member states. In policy option 2, we assume that all member states having
introduced some incentive based DR already will reach a level of 5 per cent peak
reduction in 2030, gradually increasing from today's level. The increased level of
DR compared to option 1 is due to adjustments in programme requirements to
better reflect the needs of demand side. This includes allowing aggregated bids in
the markets allowing to aggregators enter the market as a service provider for the
industry and large commercials. There is also a standard process for settlements
between aggregators and suppliers to facilitate aggregation.
Also, all member states will introduce incentive based DR and the MS not
currently having incentive based DR, will reach a level of 3 per cent of peak load
in 2030, the potential gradually being introduced from 2021. The reasoning for
take-up of DR in these MS are the same, but they will start from a lower level than
MS where DR is already taking place.
The estimation approach for incentive based DR comprises the following steps:
DR potential is based on evidence where available – often in terms of % of
peak load. For countries where no evidence is available, the following
estimates were applied:
o For MS where DS is not currently allowed in any markets: 3 % of
peak load in 2030, gradually increasing from 0 % in 2016
o For MS where DS is already allowed to participate in the energy
wholesale market: 5 % of peak load, gradually increasing from
0.5% in 2016
o For MS where DS is allowed in energy markets and two additional
markets: 5 % of peak load, gradually increasing from 1% in 2016
STUDY ON DOWNSTREAM FLEXIBILITY, PRICE FLEXIBILITY, DEMAND RESPONSE & SMART METERING 139
These levels are low compared to the levels we have found in MS where
the DS is allowed to participate. Below is an example of how these rules
are applied to the BAU.
The percentages are converted to % of theoretical potential to enable estimates of
DR on end use level using data as described under the BAU. The results are
illustrated in the below table.
Table 22: Incentive based DR – Option scenario 2, 2016, 2020, 2030 (MW)
Member State 2016 (MW) 2020 (MW) 2030 (MW)
Austria 104 227 612
Belgium 689 697 749
Bulgaria 0 55 167
Croatia 0 29 123
Cyprus 0 8 42
Czech Republic 49 174 612
Denmark 566 592 716
Estonia 0 19 95
Finland 810 846 836
France 1689 2740 5085
Germany 860 2040 5901
Greece 1527 1640 2305
Hungary 30 130 441
Ireland 48 118 300
Italy 4131 4367 5109
Latvia 7 19 59
Lithuania 0 15 68
Netherlands 170 366 1001
Poland 228 522 1499
Portugal 40 149 496
Romania 79 175 615
Slovakia 40 68 144
Slovenia 21 49 132
Spain 2083 2419 3477
Sweden 666 815 1247
United Kingdom 1792 1980 2745
Grand Total 15628 20260 34575
Source: Own calculations
5.8 Policy option 3
This section presents how the potential for price and incentive based demand
response under policy option 3 is assessed and estimated using the approach and
methodology described in Section 5.3 and 5.4.
140 FINAL REPORT
The potential for price based demand response is assumed to be the same as under
policy Option 1.
5.8.1 Incentive based demand response
In policy option 3, we assume that all member states having introduced some
incentive based DR already will reach a level of 8 per cent peak reduction in 2030,
gradually increasing from today's level. In addition, all member states will
introduce incentive based DR and the MS not currently having incentive based DR,
will reach a level of 5 per cent of peak load in 2030, the potential gradually being
introduced from 2021.
The increased level of DR compared to option 2 is due to aggregators entering the
market as a service provider for the commercial sector. In addition, the prices for
balancing reserves have increased due to increased imbalances in the energy
market.
The estimation approach for incentive based DR comprises the following steps:
DR potential is based on evidence where available – often in terms of % of
peak load. For countries where no evidence is available, the following
estimates were applied:
o For MS where DS is not currently allowed in any markets: 5 % of
peak load in 2030, gradually increasing from 0 % in 2016
o For MS where DS is already allowed to participate in the energy
wholesale market: 6.5 % of peak load, gradually increasing from
0.5% in 2016
o For MS where DS is allowed in energy markets and two additional
markets: 6.5 % of peak load, gradually increasing from 1% in 2016
These levels are low compared to the levels we have found in MS where
the DS is allowed to participate. Below is an example of how these rules
are applied to the BAU.
The percentages are converted to % of theoretical potential to enable estimates of
DR on end use level using data as described under the BAU. The results are
illustrated in the below table.
Table 23: Incentive based DR – Option scenario 3, 2016, 2020, 2030 (MW)
Member State 2016 (MW) 2020 (MW) 2030 (MW)
Austria 104 272 796
Belgium 689 757 974
Bulgaria 0 91 279
Croatia 0 48 205
Cyprus 0 13 70
Czech Republic 49 216 795
Denmark 566 592 716
Estonia 0 25 123
Finland 810 866 905
STUDY ON DOWNSTREAM FLEXIBILITY, PRICE FLEXIBILITY, DEMAND RESPONSE & SMART METERING 141
Member State 2016 (MW) 2020 (MW) 2030 (MW)
France 1689 2865 5509
Germany 860 2160 6393
Greece 1527 1640 2305
Hungary 30 139 478
Ireland 48 125 325
Italy 4131 4367 5109
Latvia 7 28 99
Lithuania 0 25 113
Netherlands 170 439 1301
Poland 228 627 1949
Portugal 40 185 645
Romania 79 210 800
Slovakia 40 93 240
Slovenia 21 58 172
Spain 2083 2484 3767
Sweden 666 913 1622
United Kingdom 1792 2196 3569
Grand Total 15628 21435 39255
Source: Own calculations
5.9 Summary of effects
The total demand response under each of the policy options is summarised in the
table adding the price and incentive based demand response.
Table 24: Total DR potential price + incentive based in 2030 (MW)
Member State BAU PO1 PO2 PO3
Austria 450 460 950 1130
Belgium 820 1110 1110 1340
Bulgaria 30 90 260 370
Croatia 20 60 180 260
Cyprus 10 20 60 90
Czech Republic 110 240 790 970
Denmark 970 980 980 980
Estonia 30 30 130 160
Finland 1210 1220 1220 1290
France 4610 4720 8110 8530
Germany 2420 3540 8450 8940
Greece 2550 2550 2550 2550
Hungary 90 170 580 620
Ireland 260 260 510 540
Italy 7670 7760 7760 7760
Latvia 50 50 100 140
Lithuania 10 40 110 150
142 FINAL REPORT
Member State BAU PO1 PO2 PO3
Netherlands 860 880 1680 1980
Poland 950 960 2160 2610
Portugal 110 300 740 890
Romania 360 370 860 1050
Slovakia 100 150 240 340
Slovenia 40 70 170 210
Spain 4710 4770 5350 5640
Sweden 1380 1400 1900 2270
United Kingdom 4560 4650 5470 6300
Total 34380 36850 52420 57110
5.10 Cost and benefits of options
Based on the assessment of the demand response under the alternative policy
options, the net effects on the overall electricity system costs are estimated.
The effects include the change in costs and the change in benefits. Wider, indirect
economic impacts are not included in the assessment. Wholesale market prices that
are associated with the different scenarios have not been explicitly modelled. In a
well-functioning market however reduction of costs will mean a reduction in
prices.
5.10.1 Costs of options
To make demand response and its benefits possible, cost need to be incurred in the
system. For the activation costs of demand response three classes are defined:
Parameter Cost component Unit
Variable costs Costs for loss of
production, inconvenience
costs, storage losses
€/kWh
Annual fixed costs Information costs,
transaction costs, control
costs
€/kW
Investment costs Installation of
measurement-equipment,
automatic measurement for
control, communication
equipment
€/kW
Variable costs for demand response are the costs for using the potential demand
response. In case of load shifting these costs are assumed to be zero since in many
STUDY ON DOWNSTREAM FLEXIBILITY, PRICE FLEXIBILITY, DEMAND RESPONSE & SMART METERING 143
cases the lost output can be produced later.113 When loads are curtailed, variable
costs are not zero however, load curtailment is not analysed in this study.
Moreover, it is possible that demand response causes additional costs for
inconvenience or efficiency losses due to partial load operations, however these
costs are not considered in this study.
The annual fixed costs are incurred on a regular basis and are not related to the
actual use of demand response. Predominantly, these costs relate to administration
and to incentivise consumers for demand response. This study only focusses on the
system costs, therefore the annual fixed costs are assumed zero.
Investment costs are incurred once the demand response potential is activated.
Costs of this type include
Investments in communication equipment both at the consumer side as in
the grid. This enables remote sending of instructions to the consumers
which then can provide demand response.
Investments in control equipment are needed to carry out load reductions
automatically. With control equipment it is possible to provide demand
response upon receipt of a signal.
Metering equipment is required to be able to verify that the load reduction
is achieved.
At the moment there is relatively little information available of these investment
costs for demand response. Per consumer type, the method to determine the costs is
explained.
Industrial consumers often already have equipment installed that can activate
demand response. On average, it is however assumed that a very small investment
is still required. According to available literature114, the investments is be estimated
to be one EUR/kW. No information is provided on the thinking behind the
estimation.
To present the costs as yearly costs, an annuity factor is used: 𝑟
1−(1+𝑟)−𝑛,
𝑟 : cost of capital, assumed to be 3.5%
𝑛: depreciation period, assumed to be 10 years
This results in an activation cost for industrial demand response of 0.12€/kW/year.
113 It is possible that other costs, such as labour, are different at the alternative production
time, for example because of additional pay for night shifts. The assumption is however
that a shift to production hours with higher labour costs do not take place. 114 Quantifying the costs of demand response for industrial business, Anna Gruber, Serafin
von Roon, 2013
144 FINAL REPORT
In another article115, the potential of demand response is estimated for residential
consumers. To enable demand response for residential consumers, smart appliances
must be installed. This means the costs of appliances will be higher. Currently,
most new appliances already have an electronic controller which can make the
appliance “smart”. However, the appliance also has to be equipped with a
communication module, which will typically be either a powerline communication
(PLC) or a wireless module (such as WLAN or ZigBee). It is assumed that due to
mass production of smart appliances in the future, the additional costs will be
between 1.70 EUR and 3.30 EUR per year for all appliances that enable smart
operation 116.
Furthermore, costs are required for the smart appliance to communicate with a
central gateway in a building. This can be integrated into a smart meter or can be
offered as a separate device. The gateway enables communication between the
residential consumer and an external load manager or aggregator. The link between
the appliances and the gateway (powerline or wireless communication) does not
require the installation of additional wires.
Small additional costs can be assumed due to electricity consumption as a result of
standby mode of smart appliances. This is assumed to increase the electricity
consumption of the appliance between 0.1% and 2%. Related to the production cost
of electricity, the additional cost for standby consumption range between 0.02 and
0.55 EUR per appliance and year for a moderate energy cost scenario and up to
1.10 EUR per appliance and year for the high energy cost scenario. Finally, an
assumption is made on the flexibility per appliance. In Figure 20 the capital costs
are given in €/kW/year for different residential appliances.
115 Smart Domestic Appliances Supporting the System Integration of Renewable Energy,
2009 116 Stamminger R. (2009b): R. Stamminger, with contributions from G. Broil, C. Pakula, H.
Jungbecker, C. Wendker: Strategies and Recommendations for Smart Appliances; a report
from the Smart-A project.
STUDY ON DOWNSTREAM FLEXIBILITY, PRICE FLEXIBILITY, DEMAND RESPONSE & SMART METERING 145
Figure 20: Activation costs of demand response for residential consumers