DGA (dissolved-gas analysis) on Oil-Paper Transmission Cable Systems, including Extruded Cable Terminations and Transformers Nirmal Singh, DTE Energy Electric, Detroit, MI, US CIGRE SCB1 Meeting, October 9-12, New Delhi, India [email protected]1
Transcript
DGA (dissolved-gas analysis) on Oil-Paper Transmission Cable Systems, including Extruded Cable Terminations and
Transformers
Nirmal Singh, DTE Energy Electric, Detroit, MI, US
CIGRE SCB1 Meeting, October 9-12, New Delhi, India
• Aging of paper & dielectric fluid and general DGA considerations
• Sampling, analysis & interpretation
• DGA methods, including EPRI’s
• Termination vs. splices vs. cables vs. risers
• DGA of HPFF/HPGF/SCFF cable systems
• General DGA guidelines for cables/Transformers
• DGA of fluid-filled extruded cable terminations
• Cable vs. transformer, DGA-wise
• Case histories of cables/transformers
2
Skid Wires
Outer Shielding
Moisture Barrier Carbon Tapes
Conductor Shielding
Binder Tapes
Typical HPFF cable
Cable Types Covered for DGA
3
PIPE COATING
STEEL PIPE
PRESSURIZED FLUID
SKID WIRES
INSULATION SHIELD
INSULATION
CONDUCTOR SHIELD
CONDUCTOR
Cross-section of HPFF/HPGF cable
Sectional view of submarine SCFF cable with key components
Condition & Life Considerations
• Life of a cable is primarily governed by the condition of the impregnated taped insulation, provided the fluid pressure and integrity of the steel pipe/sheath are maintained
• Of the two insulating components, namely, paper and fluid, the latter is quite stable up to about 140oC (absence of oxygen helps). However, paper degrades under thermal stresses
• As paper ages, its mechanical properties are reduced. During thermal aging of paper, carbon oxides (2 key DGA gases), moisture and minute amounts of methane and hydrogen are evolved. In addition, paper loses its initial DP (degree of polymerization) value and produces furans that readily dissolve in the dielectric liquid, its Copper No. increases – opposite of DP, but like furfural
• These traditional (mechanical) & non-traditional (DP, furans, copper no.) properties enable us to estimate cable life well for cables & transformers
4
Condition & Life Considerations………
• The dielectric fluid is affected by general contamination –moisture, oxygen and particulates. The impact of such external factors can be readily measured by a series of electrical (DF@100oC, BD) and chemical (moisture, peroxide, IFT)
• As for other fluid-filled equipment, the cable fluid offers a convenient means to assess the condition of the cable through various fluid quality tests and, most importantly, via Dissolved-Gas Analysis that is being increasingly recognized as the most viable and cost-effective diagnostic test for cable systems/transformers
• DGA responds well as a diagnostic test for cables and transformers that are advancing in age and, as such, require better condition/life assessment in the present climate of fiscal restraints worldwide
5
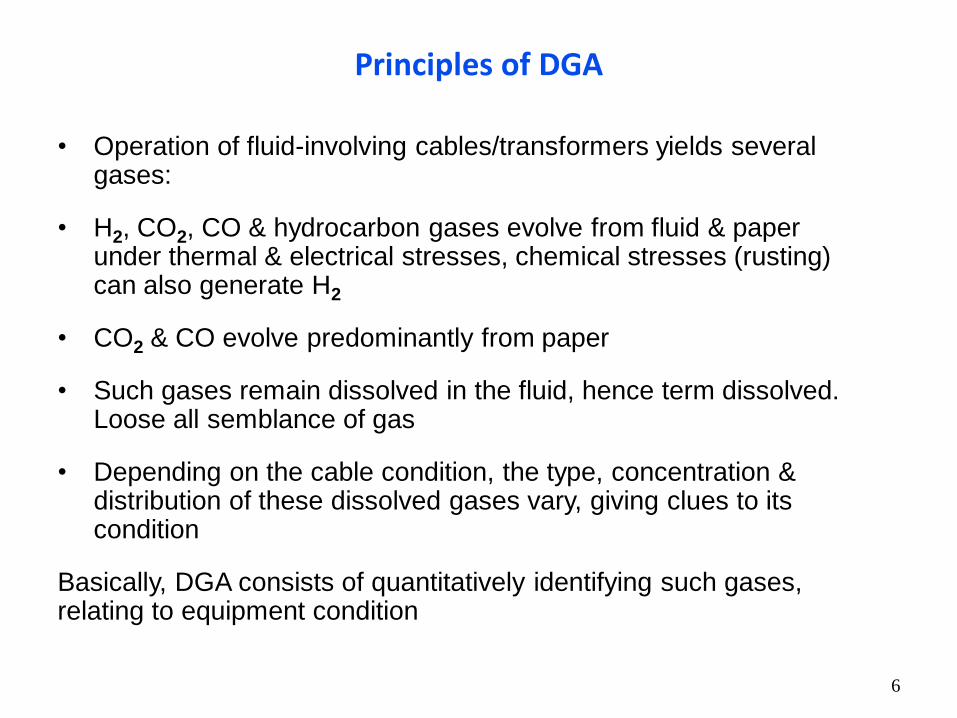
Principles of DGA
• Operation of fluid-involving cables/transformers yields several gases:
• H2, CO2, CO & hydrocarbon gases evolve from fluid & paper under thermal & electrical stresses, chemical stresses (rusting) can also generate H2
• CO2 & CO evolve predominantly from paper
• Such gases remain dissolved in the fluid, hence term dissolved. Loose all semblance of gas
• Depending on the cable condition, the type, concentration & distribution of these dissolved gases vary, giving clues to its condition
Basically, DGA consists of quantitatively identifying such gases, relating to equipment condition
6
DGA Steps
• Sampling, proper tools & written procedures – sampling errors are often made in the field
• Chemical Analysis, periodic reconditioning of GC columns, calibration, occasional cross-checking of accuracy & precision using standard gas-in-oil solutions
• Interpretation
Effectiveness of DGA is critically dependent on these three sequential steps
Both individual gas levels and the entire gas pattern are important for proper interpretation; availability of extensive lab/field data properly generated is invaluable, including exposure to cases relating gasing problems revealed through the opening of cable systems & transformers
7
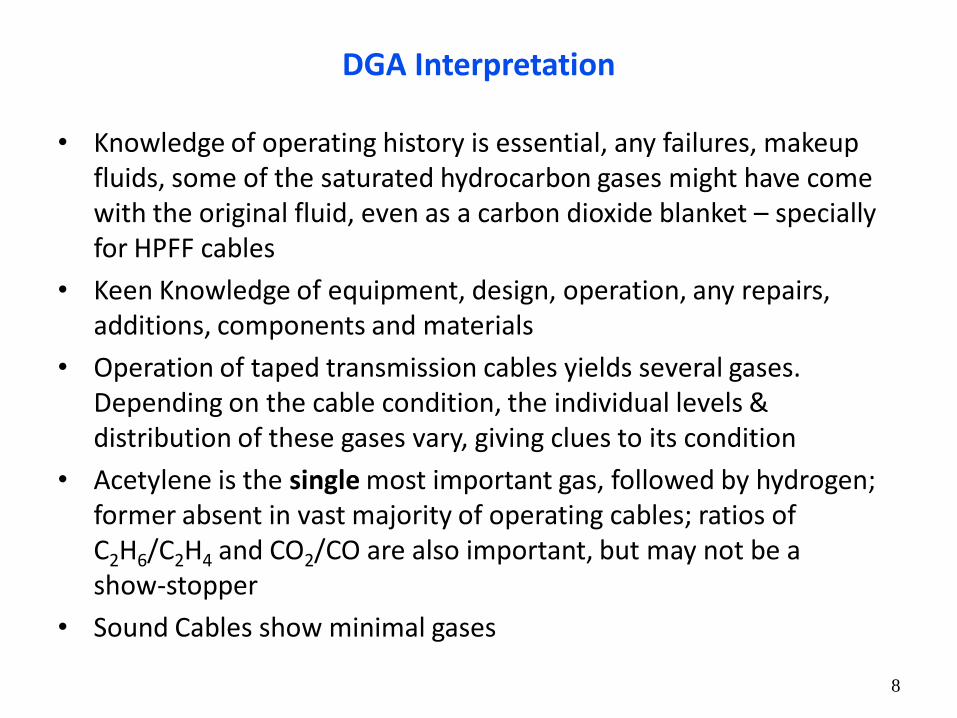
DGA Interpretation
• Knowledge of operating history is essential, any failures, makeup fluids, some of the saturated hydrocarbon gases might have come with the original fluid, even as a carbon dioxide blanket – specially for HPFF cables
• Keen Knowledge of equipment, design, operation, any repairs, additions, components and materials
• Operation of taped transmission cables yields several gases. Depending on the cable condition, the individual levels & distribution of these gases vary, giving clues to its condition
• Acetylene is the single most important gas, followed by hydrogen; former absent in vast majority of operating cables; ratios of C2H6/C2H4 and CO2/CO are also important, but may not be a show-stopper
• Sound Cables show minimal gases
8
Interpretation continued……..
• Both individual gas levels & the entire gas pattern “as a whole” are important along with certain ratios
• Depending on the cable system condition, gas limits are classified into four categories: normal, acceptable, concern & action levels; these levels correspond to increasing order of severity & are associated with progressively ascending gas concentrations
• Normal & acceptable condition requires routine attention
• In concern level, the concentration of gases, particularly C2H2, H2 and the C2H4/C2H6 & CO/CO2 ratios are high enough to necessitate close monitoring through DGA
9
Interpretation continued…..
Action level condition requires immediate investigation into high gas levels & how and why of their formation. It includes high DGA frequency, location of source, additional fluid tests with focus on moisture/DF/BD, understanding of cable line profile, heavy vehicular traffic, degassing, stoppage of fluid circulation for forced-cooled HPFF lines, DGA history, addition or loss fluid, history of any companion circuit, inspection & any repairs. Consult with internal & external experts. Importance & nature of the equipment involved also govern the action plan(s); termination failures are safety hazard, requiring prompt attention. The ultimate action is utility’s call
10
Unique Features of DGA
• High measurement accuracy
• High sensitivity to electrical/thermal stresses, distinguishing each stress
• Low detection limits with readily available, relatively low cost chemical equipment
• Apparently higher sensitivity than PD measurements, exceedingly more economical approach & better understood – users can readily rate to DGA - (over 1 million annual DGAs)
• Once formed, dissolved gases stay in place, accumulative process, not intermittent like corona activity, unless the fluid moves
• Can locate a problem source through fluid movement, often done successfully for HPFF cables
• Potential for remaining life assessment via carbon oxides, as they evolve during paper aging – a thermal phenomena
• Sampling on energized transformers and HPFF/HPGF cables, but not terminations & SCFF cables; the bottom of 345 kV, and even that of 230 kV HPFF terminations can be sampled, albeit with due care – has been done on several occasions
11
DGA Shortcoming & Challenges
• A potential problem source will generate gases, precise problem location with respect to various dielectric media involved is often hard to define, some can be harmful to various degrees, others almost innocuous (e.g. in pipe fluid)
• Unless properly followed, one cannot say when the gas generation started – it can increase, stabilize; on-line monitoring can help
• The upper limits of various gases cannot be properly defined nor expressly sought (too many factors involved), failure location activity can also complicate matters; DGA is both science & art (to some extent), lab & massive field data helpful, with good operational history of the system
• Because of its low solubility, the upper limit of hydrogen is more easy to identify, remembering repairs at 50 psi for HPFF cables
12
DGA of Terminations vs. Splices
• The confined nature of the limited termination fluid requires a different sampling procedure to cover the entire termination length
• The gas limits and distribution for terminations are markedly different from that of cables
• Use both top & bottom valves, when available
• First sample bottom valve, followed with 2 samples from the top valve, 1-3 gallon interval, depending on the volume
• If only top valve is available, take first sample with appropriate drainage, followed by 2 additional samples as the fluid is drained, to cover the entire
• Terminations tend to yield much more acetylene, splices much less acetylene but more hydrogen - HPFF cables; SCFF splices can give appreciable acetylene, much less hydrogen
13
Gases measured, their Generation & what they Indicate
• Gas generation is a thermodynamic phenomenon - electrical activity simply exposes a macro- fluid volume to localized, elevated temperatures. Depending on the level/intensity, range of temperatures /fluid nature and duration/covrage of this activity, a large number of gases such as hydrogen, carbon oxides, methane, lower (C1s) and higher hydrocarbon gases (C2s, C3s)……….requiring higher energies to evolve, are generated
• Paper essentially yields carbon oxides, fluids the rest
• Depending on the problem faced by the cable(or transformer), the type, distribution & concentration of the evolved gases vary – giving a handle on the nature of the problem
• Considering that several fluids of differing chemical nature and viscosities are involved in taped cables, we measure 16 gases. The four isomers of butane add 4 to this total. The starting material for polybutene fluid is isobutylene gas, hence this measurement. Moreover, this large number helps identify the extent of any contamination of original pipe fluid in some HPFF cables, where it has been observed
14
Indications by Main Gases
• Acetylene is the single, most important gas for diagnosis by DGA; generated only if any electric arc (visible, if eye could see it, howsoever, feeble) is involved. Any severity short of arc formation will not form acetylene, as demonstrated by earlier EPRI work
• Hydrogen is related to very mild corona activity. Large concentrations of Hydrogen are possible in HPFF cables, observed. Rusting situations can lead to hydrogen, demonstrated. Can also evolve from metals (where it is absorbed) from previous manufacturing processes or welding
• Ethylene & ethane are basically related to electrical activity, which falls between the levels of acetylene and hydrogen. Of the two, ethylene requires higher level of electrical energy. In addition, thermal activity also contributes. Propylene & propane follow the same pattern, except higher energy levels are involved. Ethylene is invariably associated with the presence of acetylene. Ethylene is higher than ethane in unsatisfactory situations, an important lesson
15
Indications by Main Gases…..
• Carbon dioxide & monoxide are related to thermal activity in paper. The latter is also associated with electrical activity on paper. The concentrations CO2 are much higher than that of CO, 4-10. If CO level is higher than the CO2, a problem is indicated, another important lesson. We rarely see CO/CO2 ratio > 1
• Methane is related to low level thermal activity
• Isobutylene is predominantly encountered in polybutene fluids & is related to thermal activity and possibly mechanical action of pumps. Being a higher hydrocarbon gas, it requires greater energy level compared to lower hydrocarbons
• Again, while individual gases may be important, one has to look at the pattern as a whole, one cannot generally go with one gas – the levels involved are also important, when looking at ratios or otherwise
• Gas trending is of utmost importance, so is previous DGA history 16
Dry Paper
Time (hours) C. Monoxide (ppm) C. Dioxide (ppm)
0 nd 0.83
5 2.77 1.11
34 13.22 1.21
52 14.77 0.94
75 14.38 0.75
144 15.91 0.7
172 13.06 0.72
196 16.94 0.67
212 17.43 0.69
Impregnated Paper
0 7.0 1.0
72 7.4 1.2
80 8.0 1.1
96 10 1.6
128 12.8 2.7
Gas Generation Under Electrical Stress for Dry & Impregnated Paper showing Carbon Oxides Evolution, in Nitrogen 2.5 kV Applied to Sphere-Plane 34 mils Total Paper Thickness2.75 in. Sphere Diameter
17
Gas Concentration at Saturation Level in Dielectric Fluids at 40oC and 200 psig in Thousands ppm
Gas Cosden 0EG Chevron DO100 Cosden 6EG Cosden 15EG
Nitrogen n/a 1,575 1,830 4,261
Hydrogen 1,341 1,404 1,188 812
C. Monoxide 2,197 2,134 2,313 2,416
C. Dioxide 14,382 12,473 13,017 8,522
Methane 6,425 5,626 13,117 4,894
Ethane 27,953 37,953 33,259 26,334
Ethylene 24,503 23,571 20,441 12,817
Acetylene 14,282 19,176 13,882 10,287
18
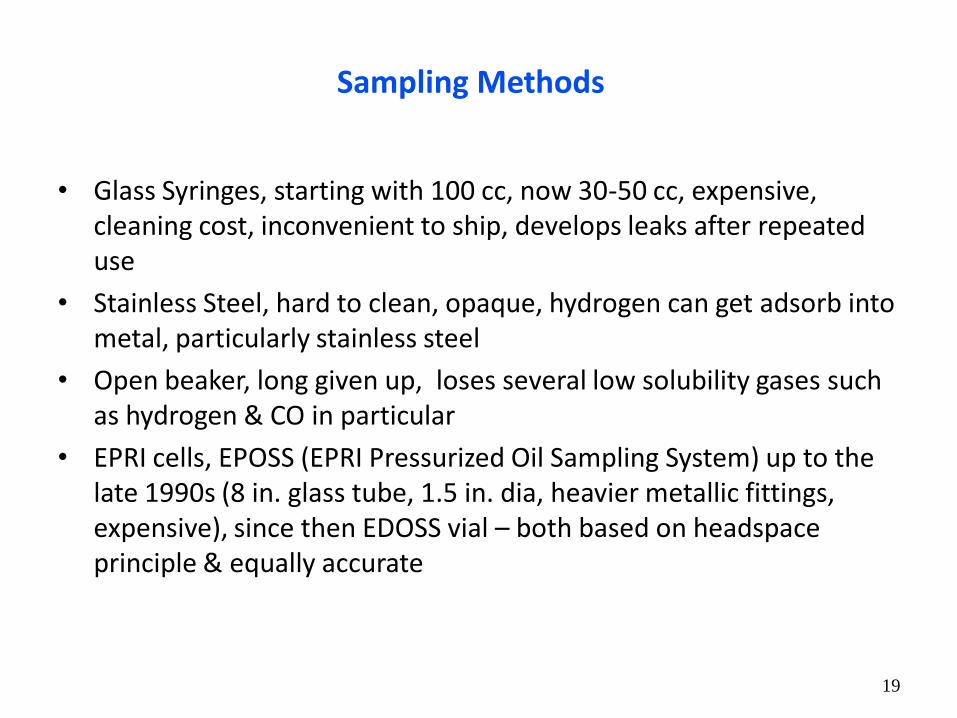
Sampling Methods
• Glass Syringes, starting with 100 cc, now 30-50 cc, expensive, cleaning cost, inconvenient to ship, develops leaks after repeated use
• Stainless Steel, hard to clean, opaque, hydrogen can get adsorb into metal, particularly stainless steel
• Open beaker, long given up, loses several low solubility gases such as hydrogen & CO in particular
• EPRI cells, EPOSS (EPRI Pressurized Oil Sampling System) up to the late 1990s (8 in. glass tube, 1.5 in. dia, heavier metallic fittings, expensive), since then EDOSS vial – both based on headspace principle & equally accurate
19
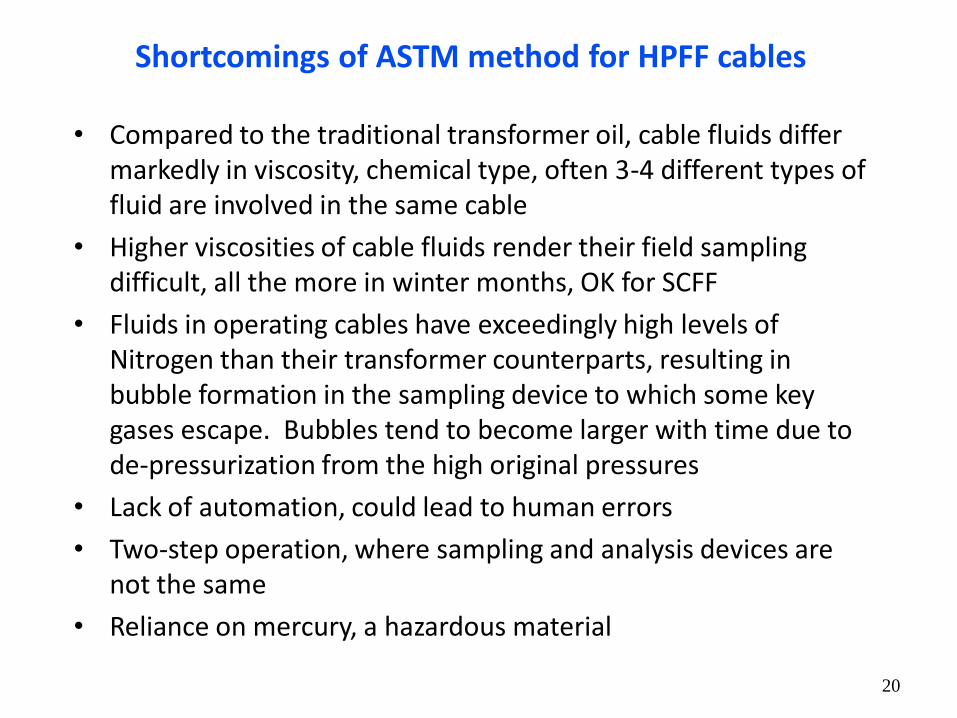
Shortcomings of ASTM method for HPFF cables
• Compared to the traditional transformer oil, cable fluids differ markedly in viscosity, chemical type, often 3-4 different types of fluid are involved in the same cable
• Higher viscosities of cable fluids render their field sampling difficult, all the more in winter months, OK for SCFF
• Fluids in operating cables have exceedingly high levels of Nitrogen than their transformer counterparts, resulting in bubble formation in the sampling device to which some key gases escape. Bubbles tend to become larger with time due to de-pressurization from the high original pressures
• Lack of automation, could lead to human errors
• Two-step operation, where sampling and analysis devices are not the same
• Reliance on mercury, a hazardous material
20
Shortcomings Continued……………
• Extraction efficiency problems, when gas content is low (typical in transformers) or high (as often can be for cables)
• Relatively large sample (50-100 cc), which some systems such as transformer bushing & extruded cable terminations, cannot readily afford
• Repeated use of sampling devices can lead to leaks, their scrupulous cleaning is also time-consuming
• Traditional devices do not offer long storage
• Heavier, bulkier and expensive sampling system; does not lend to transport in large numbers
• Based on a unique, custom-made sampling system, which also serves as the analysis vessel, nothing seemingly comparable in the market. Utilizes commercially available equipment (headspace analyzer with a 50-sample carrousel, gas chromatograph) with some modifications
• Advantages
– Requires small sample volume 5/6 cc; suitable for low fluid volume equipment
– Light, easy-to-apply in the field, fast, easy shipment and inexpensive sampling system for HPFF and SCLF cable systems (and transformers); HPGF cables require a steel cylinder. Caters for a wide viscosity range, no plastic tubing/valves, no undesirable bubble formation
– Automated, cost-effective analysis system, no human errors
– Long shelf - life of evacuated vials, (~2 months), easy/permanent labeling
Power Transformers
Cables
Terminations
Filter
3-way valve
Needle assembly
Vial coupler
EDOSS vial
Fluid flush
Pump
EDOSS Sampling Schematics for Transformers, HPFF Cables & Extruded Cable Terminations, including Vial Box
24
Box of 18 vials
HPFF 345-kV Splice Sampling
25
General Gas Limits for HPFF/HPGF/SCFF Cable Systems
• The suggested gas limits are based on field (bulk of which is on HPFF cables) and lab data & relate to normal, acceptable, concern and action levels, along with two gas ratios
• These limits should not be signify firm gas limits and are meant to provide general guidelines. As more experience is gained, they would be modified – in a way, they represent a “living document” with a sound foundation. The upper gas limits cannot be well defined nor sought due to several factors in play
• These limits vary significantly depending on the accessories and the very type of cable. This is understandable due to design differences and, in particular, the amount of fluid involved
• Again, of all gases, acetylene is the single most important gas
Some unusual DGA cases for HPFF cable systems follows the guidelines
26
27
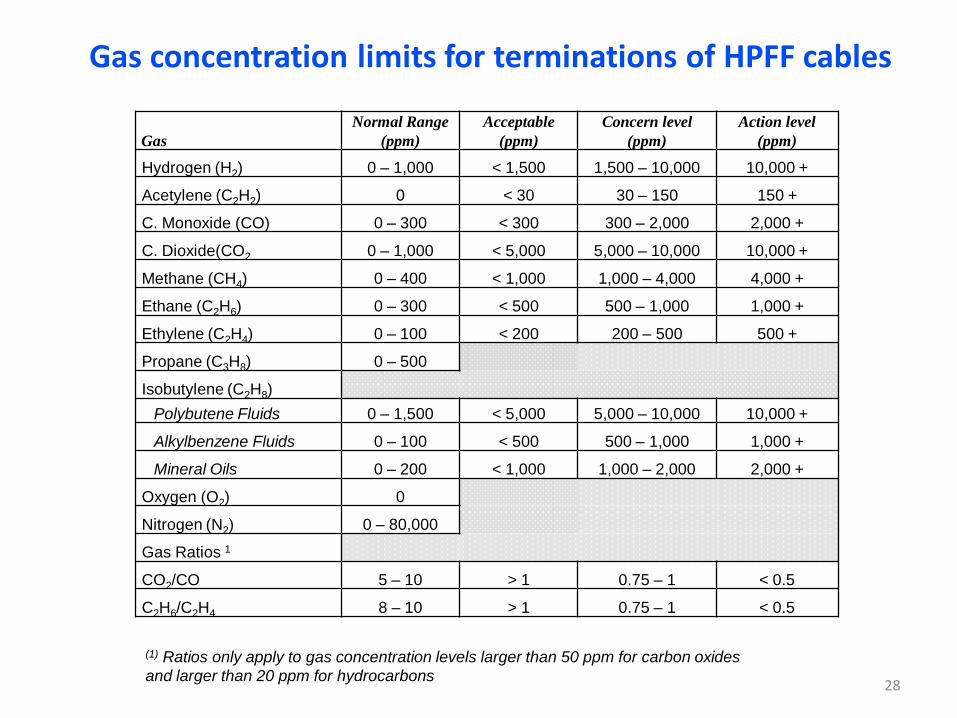
Gas concentration limits for splices and cable runs of static HPFF cables
(1) Ratios only apply to gas concentration levels larger than 50 ppm for carbon oxides and larger than 20 ppm for hydrocarbons
30
Gas concentration limits for HPGF cables (200 psi nitrogen)
GasNormal Range
(ppm) (1)
Acceptable (ppm)
Concern Level(ppm) 1
Action Level(ppm) 1
Hydrogen (H2) 0 – 75 < 700 700 – 2,200 2,200 +
Acetylene (C2H2) 0 < 0.07 0.07 - 0.4 0.4 +
C. Monoxide (CO) 0 – 15 < 75 75 – 150 150 +
C. Dioxide(CO2 0 – 75 < 150 150 – 350 350 +
Methane (CH4) 0 – 30 < 75 75 – 300 300 +
Ethane (C2H6) 0 – 15 < 40 40 – 75 75 +
Ethylene (C2H4) 0 – 80 < 15 15 – 40 40 +
Propane (C3H8) 0 – 36
Isobutylene (C2H8)
Polybutene Fluids 0 – 100 < 350 350 - 750 750 +
Alkylbenzene Fluids 0 – 10 < 40 40 - 100 100 +
Mineral Oils 0 – 20 < 80 80 – 200 200 +
Oxygen 0
Gas Ratios 2
CO2/CO 5 – 10 > 1 0.75 – 1 < 0.5
C2H6/C2H4 8 – 10 > 1 0.75 – 1 < 0.5
(1) Gas concentrations must be multiplied by the ratio of cable operation pressure in psi to atmospheric pressure in psi. The numbers given in this table have already being corrected
(2) Ratios only apply to gas concentration levels larger than 40 ppm for carbon oxides and larger than 10 ppm for hydrocarbons
31
DGA schedule for splices and terminations
Accessory Normal Concern Action
Splice 2 to 4 years,
depending on cable
voltage class
6 months to 1
year
Establish whether or not the
splice is the source of gas.
Drain fluid to obtain sample
from the cable, both sides if
possible. Consult with experts
before opening the splice.
Cable Run
1 to 2 years, if a
problem has been
identified
6 months to 1
year
Consider changing cable length
in question
Termination 2 to 4 years 6 monthsOpen termination for visual
inspection/ rebuild.
32
Comparison of DGA Results Between MH17139 and Adjoining Manholes, Stephens-Caniff HPFF 345 kV Cable.
Failure took place on June 15, 1988
Gases (ppm) MH17140 MH17139 MH17138
Methane 301 2,078 108
Ethane 153 1,074 78
Ethylene 248 1,387 87
Acetylene 22 147 0.8
Propane 211 309 131
Propylene 163 820 61
Isobutane 114 196 78
n-Butane 81 105 67
t-2-Butene 38 85 31
1-Butene 32 94 22
Isobutylene 667 2,335 406
Hydrogen 2,283 14,278 1,089
C. Monoxide 881 1,055 443
C. Dioxide 851 1,042 711
Nitrogen 154,937 137,391 186,30433
Stephens-Caniff 345 kV, Sampling at the Test Failure (MH17132) and Adjoining Manholes
Date 7/7/1988 7/6/1988 7/7/1988
Gases (ppm) MH17140 MH17139 MH17138
Methane 316 492 369
Ethane 146 155 119
Ethylene 242 337 227
Acetylene 2.1 25 1.4
Propane 228 214 177
Propylene 148 222 148
Isobutane 121 132 115
n-Butane 93 95 85
t-2-Butene 42 56 46.5
1-Butene 34 44 35
Isobutylene 653 870 739
Hydrogen 1616 2,938 708
C. Monoxide 1173 736 659
C. Dioxide 609 424 387
Nitrogen 221,675 98,320 62,74634
DGA & Revealed Damage Extending to Cuter and tapes,138 kV GIS Termination
35
Gases
Methane 169,700
Ethane 20,017
Ethylene 20,063
Acetylene 1,314
Propane 8,993
Propylene 22,330
Iso-butane 9,577
nButane 768
t2Butene 1,059
1Butene 1,886
Isobutylene 123,930
Hydrogen 74,970
C Monoxide 2,078
C Dioxide 1,234
Nitrogen 73,620
Variation of acetylene concentration (average) with time, 138 kV SF6 HPFF Termination
36
HPFF cases involved in major/minor fires, involving different HPFF cables
Year 1990 2001
Gases (ppm) / Location Manhole X Manhole Y Manhole Z
Methane 27,168 862 869
Ethane 7,468 287 283
Ethylene 2,316 83 84
Acetylene 2 0 0
Propane 6,694 822 806
Propylene 4,381 134 131
Isobutane 2,022 107 104
n-Butane 3,228 229 223
t-2-Butene 468 33 34
1-Butene 1,153 67 68
Isobutylene 11,932 607 600
Hydrogen 6,177 9,961 11,783
C. Monoxide 7,746 160 156
C. Dioxide 46,092 1,611 1,650
Nitrogen 72,466 89,040 83,338
37
DGA Results on a 138 kV HPFF Cable System, including its Reservoir, April 23, 1992
Downtown Substation
Gases (ppm) Manhole Phase A Phase B Phase C Reservoir
Methane 158,384 2,708 2,000 2,554 542
Ethane 81,380 9,707 17,685 18,958 13,001
Ethylene 1,431 223 204 219 141
Acetylene 0 0 0 0 0
Propane 44,080 12,817 24,410 24,805 21,157
Propylene 11 24 22 23 20
Isobutane 6,031 1,001 101 1,011 959
n-Butane 3,277 2,830 2,822 2,840 2,568
t-2-Butene 85 91 92 92 83
1-butene 16 23 23 23 21
Isobutylene 470 637 640 645 585
Hydrogen 629 129 232 138 23,207
C. Monoxide 0 14.8 11.3 5.2 0
C. Dioxide 109 279 202 242 99
Nitrogen 33,568 120,693 120,054 120,042 83,296
38
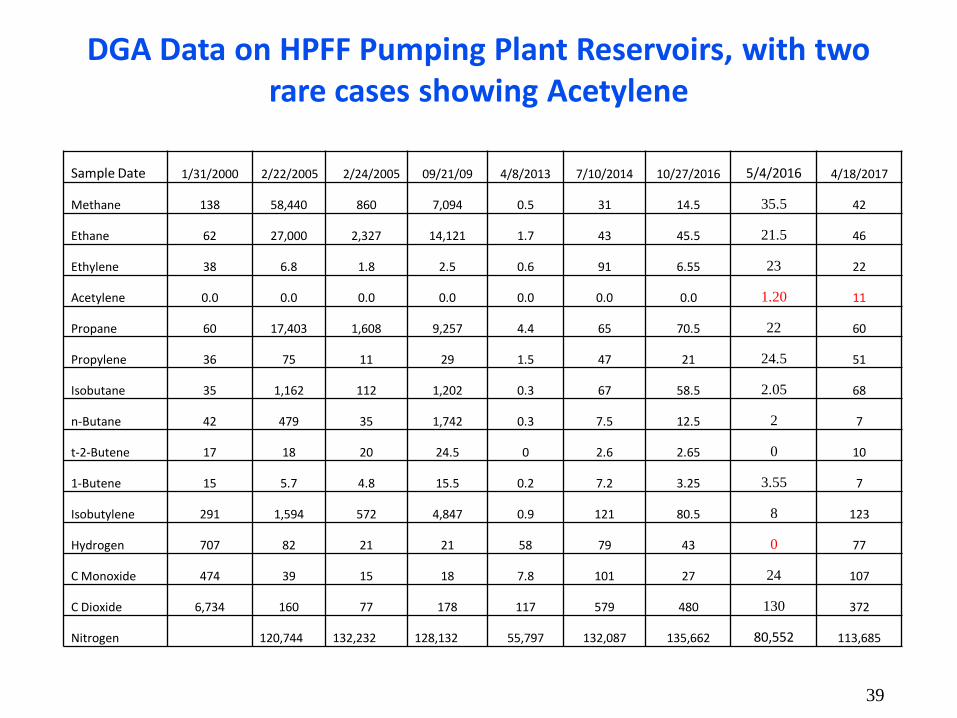
DGA Data on HPFF Pumping Plant Reservoirs, with two rare cases showing Acetylene
Follow-up of Hydrogen beyond the Splice, showing Reduction in the Pipe, 138 kV
42
HPGF & SCFF Cable systems
• Due to extensive reliance on HPFF cable systems (nearly 80%) in the US, the GA data on HPGF and DGA on SCFF cable systems are limited, however, both are performed. The success of HPGF/reservoir headspace/hydrogen-cooled generators data supports the application of GA for dry extruded transmission terminations
• The concentration of gases in HPGF cables is significantly smaller due to diffusion/lack of accumulation and limited fluid amount resulting from the replacement by nitrogen. However, the gas pattern follows similar trends in problem/failure situations
• For reasons of much lesser fluid in SCFF cables compared to HPFF ones, the gas levels are much smaller. However, SCFF splices can yield markedly higher levels of acetylene due to any electrical activity occurring in the splice region which has limited fluid compared to HPFF counterparts
43
SCFF Cable Splice Sampling by EDOSS
44
DGA on HPGF and SCFF Cables, 120-138 kV
Gases HPGFHPGF (after
failure SCFF
Methane 0.43 3.29 48.7 59 2.1 20 12
Ethane 0.31 1.063 1.5 8.2 2.3 5 7
Ethylene 0.12 2.564 8.9 44 0.6 4 6
Acetylene 0 0.016 14.4 60 0 3.3 0
Propane 0.33 0.757 0.2 5.4 3.1 5 6
Propylene 0.17 1.516 2.1 18 1.4 3 4
Iso-butane 0.09 0.367 0.6 1.5 0 1 1
n-butane 0.15 0.411 0.02 0.3 0 2 1
Isobutylene 0.60 4.29 6.6 7.2 0 2 3
Hydrogen 56.4 188.5 564.9 219 0 1,359 170
C. Monoxide 32.1 7.5 412.9 11 18 20 8
C. Dioxide 17 31.3 98.7 172 183 98 30
45
DGA on Extruded Cable Terminations
• Recognizing that DGA is applicable to fluid-filled equipment, DGA for extruded cable terminations is being considered
• The high viscosity fluids employed in such terminations (3,500 – 10,000 SUS at 400C) coupled with the limited fluid volume present sampling challenges – and proper sampling is a must. Here EDOSS, with its mentioned low sample requirement and combined with a micropump, is most appropriate & has been consistently utilized to generate DGA data by DTE
• While XLPE cables can yield large amounts of methane & butanes, with some lower concentration of other hydrocarbon gases, it is noteworthy that acetylene & hydrogen do not evolve from XLPE, including the cross-linking process. With experience, one can amply distinguish any common hydrocarbon gases. The contribution of cable insulation to the formation of ethylene and propylene is too minute. Acetylene is the best indicator of potential trouble
• As a result of laboratory and gradually increasing field efforts, significant progress has been made toward the application of DGA to extruded cable terminations, supported by data. A few recent extruded cable termination failures have placed focus on development of diagnostic methods for this accessory and DGA offers a sound option
46
Extruded Cable Termination Sampling by EDOSS combined with a Micropump & narrow Tygon Tubing/fittings
While the bottom termination valve should be used, the sample can be also extracted from the termination top with tygon tubing – it is necessary to cover a few elevations of the termination fluid. The excess fluid can be put back in the termination by the two-way micropump, shown below
Extruded 138 kV Cable Termination Sampling Set-up from Top Utilizing a Micro Pump with a Narrow Tygon Fluid Extraction Tubing at a Test Facility
DGA sampling of horizontal terminations by EDOSS in
conjunction with a micro-pump at a Test Facility
EDOSS sampling set-up for a modern 230 kV
termination by micropump and its accessories in
the field
Reversible
Micro pump
EDOSS Vial
47
DGA Results (ppm) on 138 kV and a modern 230 kV Extruded Cable Termination
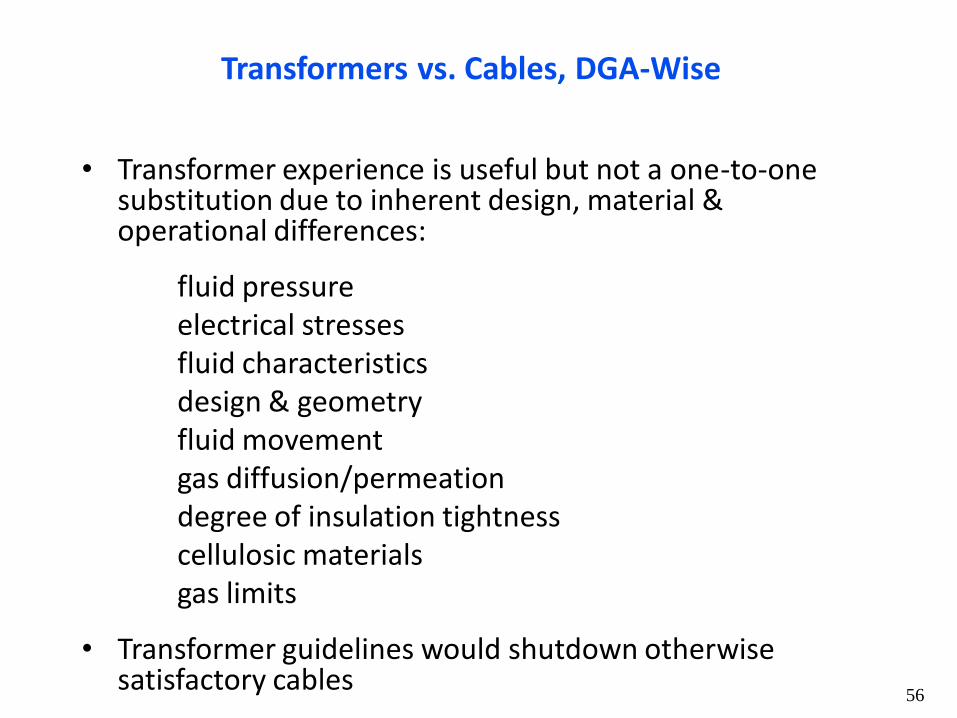
• Transformer guidelines would shutdown otherwise satisfactory cables
56
Transformers vs. Cables, Main Material Differences
• Compared to transformers, high voltage cellulosic cable papers are of high quality, no additives for thermal upgrading (even distilled water is utilized for final washes), only the turn insulation paper comes closer to cable paper
• Transformers have a range of cellulosic materials ranging from turn insulation papers to press boards to ducts to barriers to maple wood……..
• Besides the conductor, the inevitable core of transformers also constitutes a heating source, oil often with metal contact
• Transformers experience more heat, and all run close to rated temperature than cables, subject more to hot-spot, vibrations, short-circuit forces, impairment of cooling systems………….
• Accordingly, gas generation is impacted differently
57
Transformers vs. Cables continued……
• HPFF Cables can have a minimum of two fluids (pipe & impregnant), each with widely varying viscosity and often type; viscosity of these cable fluids is significantly higher than that of transformers; SCFF have one low viscosity, with viscosity similar to that of transformers
• Contamination of the original pipe fluid with saturated hydrocarbons has been observed in several earlier cables (late 60-mid 70s) – blanketing or otherwise -Ruled out for transformers & SCFF
• Generally the same sampling & analysis methods; EDOSS is fully applicable• Because of design and material differences, interpretation is markedly
different for the two products, e.g. the TDCG for transformers is typically up to 800 ppm. However, several thousands ppm of hydrogen are not at all uncommon for HPFF cables, making the corresponding TDCG concept irrelevant
• Unlike HPFF cables & splices (but not terminations), transformers can yield much higher ethylene and acetylene levels, even some monomers of butane
• The concept of key ratios generally tends to hold in both cases• Large transformers are design-ordered, and thus designs vary significantly,
unlike cables. While general guidelines have commonality, the observed gas patterns can be equipment - specific, and it should be kept in mind.
58
Transformer Sampling by EDOSS
59
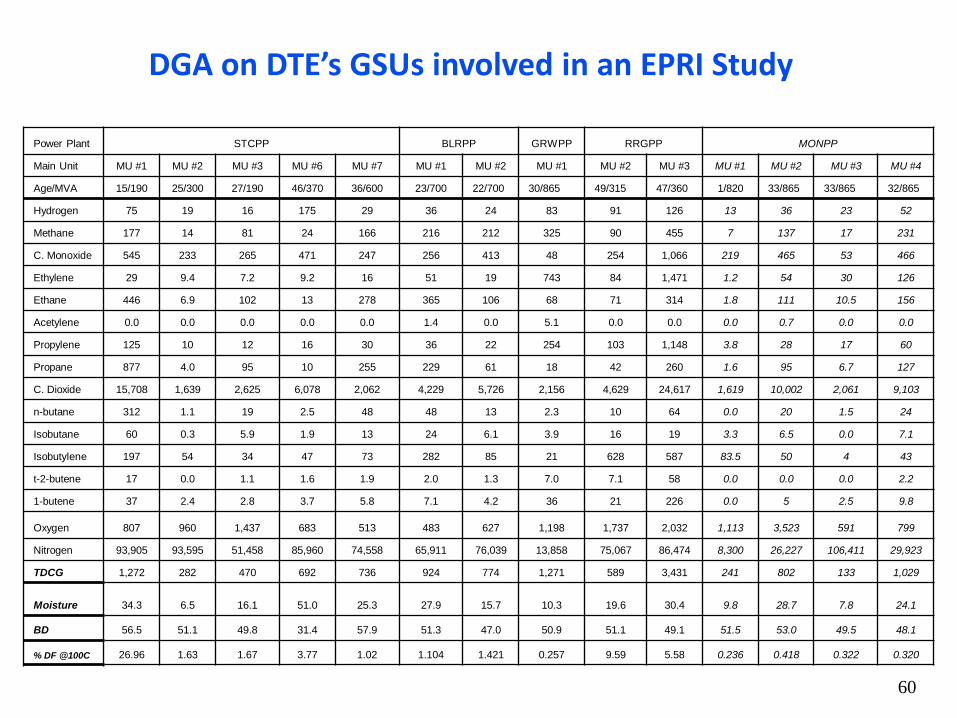
DGA on DTE’s GSUs involved in an EPRI Study
Power Plant STCPP BLRPP GRWPP RRGPP MONPP
Main Unit MU #1 MU #2 MU #3 MU #6 MU #7 MU #1 MU #2 MU #1 MU #2 MU #3 MU #1 MU #2 MU #3 MU #4
Dissection of the Removed 865 MVA GSU without Failure
Winding Damage Occurred within The Innermost Turn of HV Coil Number 28
Damaged Portion of the Inside Turn of Coil 28
In the area of one of the Auxiliary Legs between the B and C Phases, a Localized Hot Spot was Found on the Core 64
General Gas Concentration Limits for Transformers based on DTE Energy Laboratory/Field Data, with
Considerations to Publish Literature
GasNormal Range
(ppm)Acceptable
(ppm)Concern Level
(ppm)Action Level
(ppm)
Hydrogen (H2) 0-150 151-250 251-750 >750
Acetylene (C2H2) 0-3 4- 10 11–20 >20
C. Monoxide (CO) 0 – 200 201-500 501 – 1000 >1000
C. Dioxide (CO2) 0 – 2,000 2001-5000 5,001-10,000 >10,000
Methane (CH4) 0 – 100 101-400 401 –800 >800
Ethane (C2H6) 0 – 100 101-200 201–300 >300
Ethylene (C2H4) 0 – 100 101-200 201–500 >500
Propane (C3H8) 0 – 500
Isobutylene (C2H8) 0 – 50 50-100 101-200 >200
TDGC 0–500 500-2,000 2,001–4,000 >4,000
Oxygen (O2) 750 1,000 2,500 >4,000
Gas Ratios 2
CO2/CO 4 – 10 > 1 0.75 – 1 < 0.25
C2H6/C2H4 2 – 4 4 - 5 < 0.25
(1) With the exception of appreciable amount of acetylene, other gases have to be
looked in relation to others
(2) Ratios only apply to gas concentration levels larger than 50 ppm for carbon
oxides and larger than 20 ppm for hydrocarbons 65
Summary
• DGA is an economical & effective diagnostic test for taped cables and transformers, as shown by its growing worldwide application. Generally better understood, users can readily relate to DGA data
• Acetylene is the single, most important DGA gas for all equipment, so is its increase over time. However, its upper limit, like other gases, cannot be accurately given. A 25 ppm level of acetylene poses concern for a power transformer, 150 for HPFF termination, 50 for a SCFF termination, and 20 ppm for an HPFF splice
• DGA success critically depends on proper sampling, analysis and interpretation. Field sampling is under full control of the user; it is here that most mistakes are made
• DGA behavior of terminations is markedly different from that of splices, cables per se and risers, significantly varies amongst cable types, and DGA offers the most value for all types cable terminations – the limited fluid volume renders this test quite sensitive and quite decisive.
• Cable DGA should not be confused with that of transformers’
• Due to much higher viscosity of HPFF fluids, sampling can present a challenge, all the more in winter – readily overcome by EPRI method(s). Small sample requirement of EDOSS is valuable in many applications
• A keen understanding of cable’s operational history (and construction) is essential for realizing maximum value from DGA, same for transformers. DGA trending is invaluable to monitor the dormant, stable and deteriorating nature of the problem.
• DGA holds great promise for HV extruded cable terminations with fluid & potential for dry ones; provides assessment of crosslinking gases in the former. Based on the high viscosity and limited fluid volume , EDOSS may offer the only viable approach to DGA for fluid-filled terminations. An acetylene level of about 10 ppm poses concern for fluid-filled extruded terminations, requiring close monitoring, more data needed.
• DGA On-line systems & sensors should be considered for oil-paper cables, and extruded cable terminations
• DGA can be equipment-specific. While guidelines are useful, the user should develop his/her own DGA expertise on properly generated-data, as many results can defy accepted norms
66
Acknowledgements
• The continuing support of EPRI since the early 1980s and that of over 75 North American and Overseas Utilities in DTE Energy’s DGA efforts is deeply acknowledged


![Comparison of Different DGA (Dissolved Gas Analysis ... · PDF filestandard IEC 60567 [2] more unprecise. In this contribution therefore another system for DGA usable](https://static.documents.pub/doc/80x56/5a9e4dea7f8b9a36788ded06/comparison-of-different-dga-dissolved-gas-analysis-iec-60567-2-more-unprecise.jpg)


