Global Science and Technology Journal Vol. 6. No. 2. June 2018 Issue. Pp.15-34 15 Dhaka City Surface Water Source: A Case Study on the Quality Status and Trend Md. Serajuddin 1* , Md. Aktarul Islam Chowdhury 2 , Sadia Afrin Beauty 3 , Umme Sabrina Haque 4 and Tahmina Ferdous 5 The unprecedented gradual pollution of Sitalakhya river, the source of drinking water in Dhaka, has become a concern to the authority. This study was conducted to assess the present status & trend of water quality of the Sitalakhya river, the lifeline of Dhaka. The largest treatment plant in Dhaka and the Sitalakhya water at the intake is the place and water of study. Water samples were collected & tested from 2013 to 2017 mostly in the laboratory of the plant following standard methods and analyzed. Around 15000 samples were assessed for 20 parameters throughout five years, in each month covering the whole hydrological cycle. The water quality of Sitalakhya river at the intake of the plant is beyond the suitability of treatment for drinking water, especially during the dry season. Most of the results surpass the recommended value of surface water quality guideline of Bangladesh The dissolved oxygen limit is less than 1 mg/L in the dry months. The maximum concentration of turbidity, colour, COD, TSS, ammonia, and E coli are found to be 96, 40, 127, 38, 23 mg/L, 350,000 U/100 ml respectively, which all are beyond the well-known international guidelines. This raw water quality may not be in a position to sustain the conventional treatment at the largest water treatment plant for potability. This needs attention both in terms of regulatory measures and of proactive strategies on how to handle the resulting future challenges. Keywords: River water, pollution, drinking water, water quality Field of Research: Civil and Environmental Engineering, Water Resources Engineering, Drinking Water Quality Management 1. Introduction We live on a water planet, covering over 70% of the earth's surface. Oceans contain 97% of the Earth's water (by volume), which is too salty for drinking, irrigation or industrial use. That leaves 3% of earth's total water that is considered fresh water. About 2.997% of this fresh water is trapped in polar ice caps and deep within earth’s surface, which is too costly to extract. That leaves only 0.003% of earth’s total available water by volume for human use. If the world’s water were contained in 100 liters, then what is readily available to us would amount to one-half teaspoon. It has _____________________________ 1* Md. Serajuddin, Department of Civil & Environmental Engg. (CEE), Shahjalal University of Science & Technology (SUST), Sylhet, Bangladesh, Email: [email protected]2 Md. Aktarul Islam Chowdhury, Department of Civil & Environmental Engg. (CEE), Shahjalal University of Science &Technology (SUST), Sylhet, Bangladesh, Email: [email protected]3 Sadia Afrin Beauty, National University, Bangladesh, Email: [email protected]4 Umme Sabrina Haque, Suez International (Bangladesh Branch), Dhaka, Bangladesh, Email: [email protected]5 Tahmina Ferdous, Suez International (Bangladesh Branch), Dhaka, Bangladesh, Email: [email protected]
Transcript
Global Science and Technology Journal
Vol. 6. No. 2. June 2018 Issue. Pp.15-34
15
Dhaka City Surface Water Source: A Case Study on the Quality Status and Trend
Md. Serajuddin1*, Md. Aktarul Islam Chowdhury2, Sadia Afrin Beauty3, Umme Sabrina Haque4 and Tahmina Ferdous5
The unprecedented gradual pollution of Sitalakhya river, the source of drinking water in Dhaka, has become a concern to the authority. This study was conducted to assess the present status & trend of water quality of the Sitalakhya river, the lifeline of Dhaka. The largest treatment plant in Dhaka and the Sitalakhya water at the intake is the place and water of study. Water samples were collected & tested from 2013 to 2017 mostly in the laboratory of the plant following standard methods and analyzed. Around 15000 samples were assessed for 20 parameters throughout five years, in each month covering the whole hydrological cycle. The water quality of Sitalakhya river at the intake of the plant is beyond the suitability of treatment for drinking water, especially during the dry season. Most of the results surpass the recommended value of surface water quality guideline of Bangladesh The dissolved oxygen limit is less than 1 mg/L in the dry months. The maximum concentration of turbidity, colour, COD, TSS, ammonia, and E coli are found to be 96, 40, 127, 38, 23 mg/L, 350,000 U/100 ml respectively, which all are beyond the well-known international guidelines. This raw water quality may not be in a position to sustain the conventional treatment at the largest water treatment plant for potability. This needs attention both in terms of regulatory measures and of proactive strategies on how to handle the resulting future challenges.
Keywords: River water, pollution, drinking water, water quality Field of Research: Civil and Environmental Engineering, Water Resources Engineering, Drinking Water Quality Management
1. Introduction We live on a water planet, covering over 70% of the earth's surface. Oceans contain 97% of the Earth's water (by volume), which is too salty for drinking, irrigation or industrial use. That leaves 3% of earth's total water that is considered fresh water. About 2.997% of this fresh water is trapped in polar ice caps and deep within earth’s surface, which is too costly to extract. That leaves only 0.003% of earth’s total available water by volume for human use. If the world’s water were contained in 100 liters, then what is readily available to us would amount to one-half teaspoon. It has
_____________________________ 1*
Md. Serajuddin, Department of Civil & Environmental Engg. (CEE), Shahjalal University of Science & Technology (SUST), Sylhet, Bangladesh, Email: [email protected] 2
Md. Aktarul Islam Chowdhury, Department of Civil & Environmental Engg. (CEE), Shahjalal University of Science &Technology (SUST), Sylhet, Bangladesh, Email: [email protected] 3 Sadia Afrin Beauty, National University, Bangladesh, Email: [email protected]
4 Umme Sabrina Haque, Suez International (Bangladesh Branch), Dhaka, Bangladesh,
been said that the water will probably be the next resource over which wars will be fought. Water scarcity has been increased with the growth of global population and
the industrial revolution. Water is the most critical for the sustenance of life and economic development. The environment, economic growth, and developments are all highly influenced by water-its regional and seasonal availability and the quality of surface and groundwater. The quality of water is affected by human activities and is declining in many parts of the world due to the increasing urbanization, population growth, industrial production, climate change and other factors. The resulting water pollution is a serious threat to the well-being of both the Earth and its population (Suchona 2016).
The undeniable seriousness of the global water situation was first brought to the attention of the international community at the 1992 United Nations Conference on Environment and Development in Rio de Janiero, at what came to be known as the Rio Earth Summit. In response to the Rio Summit, the United Nations General Assembly designated the 22nd of March, 1993 as the first World Water Day. International World Water Day has been held annually thereafter, as a means of focusing attention on the importance of freshwater and advocating for the sustainable management of freshwater resources. The celebration of an annual World Water Day was followed by the proclamation of the International Year of Fresh Water in 2003; and the declaration in 2005 of the United Nations International Decade of Action ‘Water for Life’, which set clear goals with respect to water supply and sanitation globally to be met by 2015 in tandem with those of the Millennium Development Goals. Water policy experts maintain that we must respond simultaneously to all these issues if we are to avoid a crisis of scarcity in many places in the world. In September 2000, eight Millennium Development Goals (MDGs) were defined at the Millennium Summit. These goals, which were broken down into quantifiable targets, set out a global development action plan to lift people out of poverty by 2015. A goal dedicated to clean water and sanitation was recently endorsed by the United Nations General Assembly as part of the Sustainable Development Goals (SDGs) framework for 2015–2030 that has followed the UN’s Millennium Development Goals (MDGs). Drinking water, sanitation, and hygiene form a central part of the clean water and sanitation goal (SDG 6) and are reflected especially in targets 6.1 to 6.3. They are also recognized for their role in reducing health risks as part of the good health and well-being goal (SDG 3) in targets 3.3 and 3.9 (Bigas 2012). Bangladesh is a low lying flat deltaic land created and flown over by numerous rivers including some of the biggest rivers in the world. Pollution of river bodies has become a major problem that is becoming critical because of inadequacy or non-existence of surface water quality protection measures and sanitation. Wastes are most often discharged into the receiving water bodies with little or no regard to their assimilative capacities. The discharge of raw sewage, garbage, as well as oil spills are threats to the diluting capabilities of the rivers in the major cities. The natural purification of polluted waters in itself is never fast, while heavily polluted water may traverse the long distance in days before a significant degree of purification is achieved. In addition, rivers and canals are becoming increasingly polluted from industrial wastewater dumped by factories, many of the textile industry. Agricultural input including fertilizers & pesticides, sewage & domestic waste is also a significant
Serajuddin, Chowdhury, Beauty, Haque & Ferdous
17
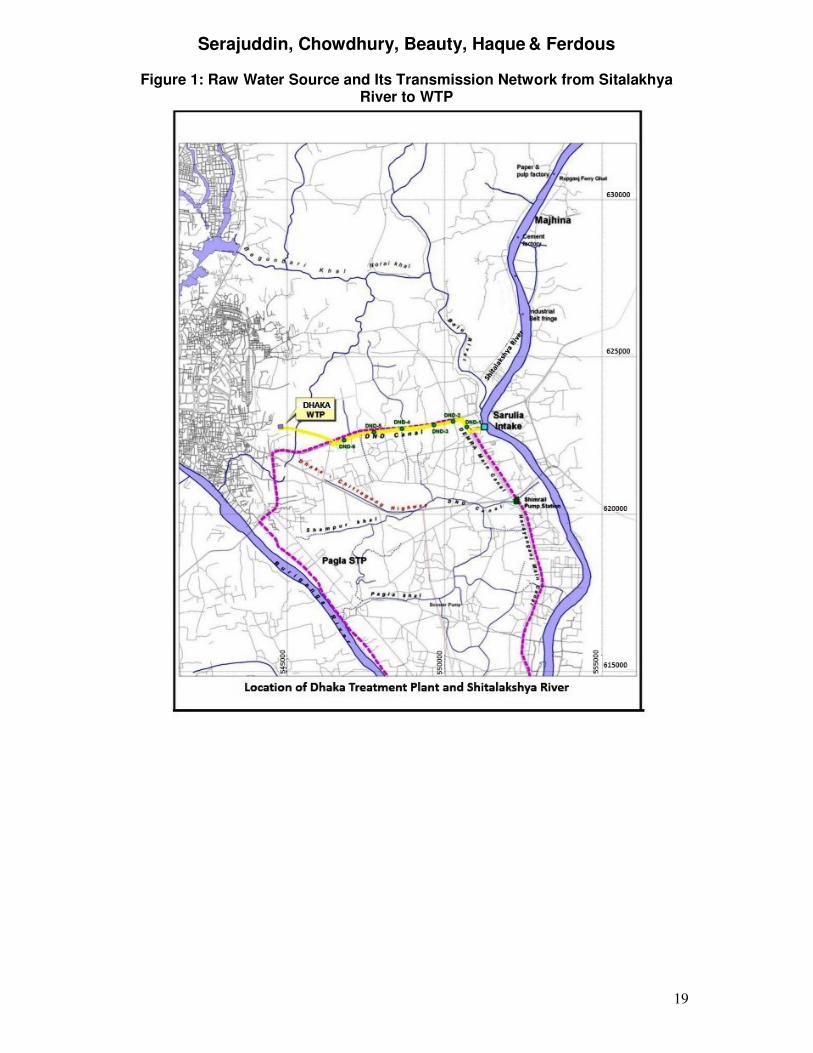
source of pollution to water. The water pollution is raising both environmental and human health concerns. Dhaka now, with a population of over 15 million is one of the most populous and congested cities in the world. This mushrooming city is located on the northern bank of the river Buriganga and surrounded by other rivers, namely, the Turag to the west, the Tongi Khal to the north and the Balu & the Sitalakhya to the east. Yet, the city carried a legacy of water shortage since the independence of Bangladesh in 1971 up to very recently (DWASA 2007; Mujibur 2010; Serajuddin 2009, 2011). The city dwellers at present can get around 2240 MLD of water, out of which 78% coming from underground. Before 2012 underground water contribution was 87%. As an inevitable corollary of excessive water level depletion due to overexploitation of groundwater in Dhaka, it is planned to shift most of the supply to surface water sources (Mujibur 2010; Serajuddin 2012). In this context, Dhaka surface water Treatment Plant (Plant 1) was constructed with a capacity of 225 MLD, the largest water treatment plant in the country and put into operation on July 27, 2002 (Serajuddin 2002). The Sitalakhya river at the eastern periphery of Dhaka city which is approximately six kilometers away is the source of raw water for the plant (Fig.1). A replication of a similar plant with the same size and almost same design has been commissioned as the second phase (Plant 2), where the third phase of 450 MLD of water is postulated in near future (Mujibur 2010; Serajuddin 2011). The river Sitalakya was recommended as the source of raw water for the aforesaid plants after several feasibility studies by the local and international experts (BCEOM 1992, DWASA 1992, 1994). Unfortunately, the Sitalakhya river is now faced with serious problems of pollution, principally contributed by industries owned by the influential section of the society (Banani & Takashi 2012; Begum 2010; Dalwar & Hadiuzzaman 2005; GOB & UNDP 2010; Sania et al.2012; Shahidul 2011). The Sitalakhya river is the lifeline of Dhaka city. At least thirty million denizens are directly dependent on the drinking water produced and supplied through this river by treating in the largest treatment plant at Dhaka. Raw water quality of this river is very vital to the sustainable development of the city as well as the sustainable supply of drinking water to the citizens. Although several reports on the assessment of water quality based on physicochemical and bacteriological quality distributions in the Sitalakhya river have been published by several researchers but the number of parameters was limited due to logical reason as well as the duration & number of sampling for the tests was limited only in a part of the year. With this background, this investigation was initiated, whose primary objective was to examine, the current status of as well as the trend over a period of sixty months continuously, the water quality of as much as twenty parameters of raw water of the Sitalakhya. The physicochemical parameters were also compared with the water quality standards in order to assess the present water quality condition of this major river of Dhaka. Trustworthy information on the characteristics of water quality is direly needed so as to control pollution effectively and manage sustainable water resources. As a consequence, it is really necessary to assess this river water. The present baseline information of the physicochemical properties of the river water derived from this study would be a useful tool for further ecological assessment and monitoring of the river quality and to demonstrate to all
Serajuddin, Chowdhury, Beauty, Haque & Ferdous
18
stakeholders regarding our unabated atrocity in polluting this valuable water source and make them aware of the probable disaster in near future for this. A visual display on this aspect can also facilitate decision makers to efficiently brainstorm a suitable way out to keep the river clean in order to get acceptable raw water quality and thus enabling large withdrawal to meet the anticipated additional demand. Analysis of this study can be one of the measuring tools to decide on industrialization or deindustrialization of certain very polluting industries in the study area. Based on the results, easy and optimal solutions could also be suggested for harnessing as much as benefit from this naturally abundant resource. The main objective of this study is to assess the status & the trend of the Sitalakhya river water quality with a large number of the parameters at the intake of the largest drinking water treatment plant in Bangladesh and to give some notions how the deteriorating water quality is creating problem in obtaining the treatment objective of the plant. This paper is organized as follows: Section 1 deals with ‘Introduction’ including rationale & objective of the study, and section 2 deals with literature review and Section 3 focuses on ‘Materials & methods’ and Section 4 contains ‘Results and discussions’, and ‘Conclusions & Recommendations’ is provided in Section 5. This paper is organized as follows. While literature review is provided in section 2,
2. Literature Review As regards to surface raw water quality for drinking water, there are no action levels or MCL (Minimum concentration level) set by most of the authorities over the world except few very developed countries in Western Europe and North America like EU, Govt. of France, Water security Agency the USA, etc. & in India (Bureau of Indian Standard 2012, EU 1975, Govt. of France 2007, US EPA 2006,). Though there are numbers of the study found in the literature on the surface water quality of water bodies in and around Dhaka city (Dalwar & Hadiuzzaman 2005; Didarul & Gausul 2015, Ibrahim & Ashraf 2015, IWM 2005, Jashua & Nazrul 2015, Mahbub et al.2011, Naushad et al. 2006, Roy et al. 2011, Serajuddin & Islam 2017, Shahidul 2011, Shishir et al.2009,) but very few are found exclusively for Sitalakhya river, in particular very few studies with source water of intake point of Dhaka’s largest drinking water treatment plant. Moreover, most of the papers deal with 5 to 10 water quality parameters and frequency of analysis are also limited.
Serajuddin, Chowdhury, Beauty, Haque & Ferdous
19
Figure 1: Raw Water Source and Its Transmission Network from Sitalakhya River to WTP
Serajuddin, Chowdhury, Beauty, Haque & Ferdous
20
In a study (Nawshad et al.2006) it was shown that the DO starting at less than 3 mg/L in 1994 diminishes to less than 1mg/L in 1998; Electric conductivity starting as 100 µS/cm in 1980 rises to 1400 µS/ cm in 1998. In another study (Sania et al.2009) it was found that turbidity is 14.67 NTU, DO is 2.17, TSS is 145.73(all are in mg/L), EC is 7.62 µS/ cm. A master thesis in 2005 (Dalwar & Hadiuzzaman 2005) found different concentration as follows; DO= 0.9, BOD= 28.8, Cd= 0.006, Cr= 0.25, Pb= 0.05, Al= 2.95, phosphate= 1.025, TSS= 8.89 (all units are mg/L), E.coli= 5.2 k, turbidity= 210 NTU, EC= 355 µS/cm. Another study (Didarul & Gaushul 2015) found the following results; DO= 4.2, BOD=35, COD= 130, Pb= 0.05, Cr= 0.06 (all unit are mg/L), EC=2500 µS/cm .Further (Shishir et al. 2010) it was found that Cr = 0.005, (2010 data), Ni= 0.007(2009 Data), Pb= 0.038(2010 Data), (all unit are mg/L). Amazingly, by analyzing the historical data, the feasibility study report of the plant it was forecasted that by next decade the maximum raw water pollution would be within permissible limit which can be handled by conventional water treatment technology (BCEOM 1992). This important feasibility study and allies report along with the presently visible atrocity of will full pollution activity of influential peoples and the recent problem faced in the treatment process in Dhaka plant incited to authorize this paper to study the present status & trend of the raw surface water quality parameter. The present study is done with very recent data, for much longer time duration than the earlier studies, more extensive sampling with twenty parameters.
3. Materials and Methods Water samples were collected from the treatment plant intake from the river Sitalakhya. The duration is long five years since the operation of Dhaka’s most modern water treatment plant starts its operation. The protocol of testing is so designed that there is no chance of missing representative information. It gives a true picture of the field and an overall total picture of the water quality to be utilized for future operation of such plants. Samples were collected in clean plastic cans of 2 lit capacities for physicochemical analysis. The collected samples were transferred to the laboratory of the plant, by following the precautions laid by standard methods (APHA 1995). pH, DO, temperature, turbidity was determined within the felid of the collection, the other parameters like Chromium, NO3 , SO4, Aluminum, Colour, E.coli, COD, DO, Ammonia, Nitrate-Nitrite, pH, Sulfate, TSS, Turbidity, etc, were analyzed in the laboratory within the stipulated period. The methods, equipment, and standards of testing are given in Table 1, which are internationally followed methods. Each of the water samples was analyzed for 20 parameters. The experimental values were compared with targeted values recommended by the authority which corresponds to in most of the cases to WHO (WHO 2011) and GOB guidelines (GOB 1997) (Table 02).
Serajuddin, Chowdhury, Beauty, Haque & Ferdous
21
Table 1: List of Water Quality Parameters Tested with Name of the Equipment and Methods Utilized
Serial No.
Name of the Parameters
Equipment Utilized Methods Used Method No Comments
01 Ammonia HACH DR 6000 spectrophotometer
Nessler Method 8038 On site lab
02 Colour HACH DR 6000 spectrophotometer
Platinum-Cobalt standard method
8025 On site lab
03 COD
HACH DR890 Colorimeter, HACH DRB200 COD reactor
Reactor Digestion Method
8000 On site lab
04 Nitrate HACH DR890 Colorimeter
Cadmium Reduction Method
8039 On site lab
05 Nitrite HACH DR890 Colorimeter
Diazotization Method
8507 On site lab
06 PO4 HACH DR890 Colorimeter
Amino Acid Method
8178 On site lab
07 Sulfide HACH DR890 Colorimeter
Methylene Blue Method
8131 On site lab
08 Alkalinity Digital Titrator Phenolphthalein and Total Alkalinity
8203 On site lab
09 Turbidity HACH 2100Q Turbidity meter
Nephelometric Method
- On site lab
10 Dissolved Oxygen
HACH Probe LDO101, Multimeter HQd40
Electrometric Method
- On site lab
11 pH HACH Probe PHC101, Multimeter HQd40
Electrode Method 8156 On site lab
12 Suspended Solid
Analytical Balance & Drying Oven
Gravimetric Method
- On site lab
13 Aluminum DR 6000 Aluminon 8012 On site lab
14 Chromium - Alkaline
Hypobromite Oxidation
SM 3113 B Out sourced lab
15 Nickel
-
PAN 8150 USEPA 200.9; SM 3111 B
Out sourced lab
16 Lead -
Dithizone 8033 USEPA 200.9 Rev 2.2; SM 3111 B Methods
Measurement of algal concentrations via fluorescence
- On site lab
Serajuddin, Chowdhury, Beauty, Haque & Ferdous
22
Table 2: Water Quality Parameters with Expected Raw Water and Targeted Treated Water Quality
Sl. No.
Parameter Unit
Expected Raw Water
Targeted Treated Water Dry Season
Wet Season
1 pH - 6.5-8.5 6.8-7.3 6.5-8.5
2 Turbidity NTU 20 20-100 <10
3 colour Pt Co <60 <20 <20
4 DO mg/L ≥5.0 - 6.0
5 TSS mg/L - - 10
6 Aluminum mg/L - - 0.2
7 Lead mg/L 0.05 - 0.05
8 Nickel mg/L - - 0.1
9 Chromium mg/L 0.05 - 0.05
10 E.Coli CFU/100 ml
5000 - 0
11 Conductivity uS/cm 1000 - 2500
12 Temperature °C 20-30 - 20 - 30
13 Chlorophyll µg/L - - -
14 COD total mg/L 30 - <4
15 Ammonia mg/L <4 <2 <1.5
16 Alkalinity mg/L - - 1
17 Nitrates mg/L - 10
18 Nitrites mg/L - - 0.9
19 Sulfides mg/L 20 - <0.05
20 Phosphate mg/L 9.0 - 6.0
4. Results and Discussions The monthly maximum and the average concentration of twenty physical, chemical, heavy metal and biological water quality parameters are tested taking the raw water of Sitalakya extracted at the intake of the largest water treatment plant of Dhaka since the year 2013 up to the year 2017 and are analyzed. This study gives a complete picture of all the possible quality parameters for a treatment plant over a long period of time covering all the months which differs from the findings of the earlier studies. The test result values are all used in this paper, some of the very important parameters are shown in figures, some in description and others are in tabular form for the ease of understanding and page limitation respectively. This vast information covering all the water quality variables necessary for a drinking water treatment plant & beyond covering a period of sixty months continuously in a plant environment was never found to be done in recent time. The outcome gives a firm base to answer the research question and quest. The global number of the sample tested in this study period is around 15000 comprising almost equally in each year covering all seasons in detail for 20 parameters. The protocol of the tests performed is given in Table 3.
Serajuddin, Chowdhury, Beauty, Haque & Ferdous
23
Table 3: Analytical Treated Water Sampling Program
Serial No.
Parameter tested Frequency (Dry season) (November- April)
Frequency (Wet season) (May- October)
1. Ammonia Daily 3 times a week
2. Color 3 times a week 2 times a week
3. Chlorophyll Depending on situation 2 times a week
4. Total COD Daily Daily
5. Dissolved oxygen Daily Daily
6. pH Daily Daily
7. Conductivity 3 times a week 2 times a week
8. Alkalinity 2 times a week 2 times a week
9. E.Coli Daily Daily
10. Temperature Daily Daily
11. Turbidity Daily Daily
12. Nitrates 3 times a week 3 times a week
13. Nitrites 3 times a week 3 times a week
14. TSS 3 times a week Daily
15. Phosphate 3 times a week Monthly
16 Sulfides 2 times a week Once a week
17 Aluminum 2 times a week 2 times a week
18 Chromium Once a month Once a month
19. Lead Once a month Once a month
20. Nickel Once a month Once a month
Figure 2 and 3 shows the monthly average and maximum values of COD respectively. The shapes of these graphs are more or less symmetric. The maximum of the average value in January have a value around 20-35 mg/L which sharply increases to 50, 60, and 70 mg/L in the month of February-March then gradually dropped to less than 15 mg/L and again starts rising in October till February and March. For the maximum values, the peak reaches even to 125 mg/L in February-March. Almost all the average values are above the allowable 4 mg/L of water limit of COD as per any guideline.
Serajuddin, Chowdhury, Beauty, Haque & Ferdous
24
Figure 2: COD (mg/L), Avg. Value vs. Months
Figure 3: COD (mg/L), Maxm. Value vs. Months
In Figure 4 each yearly average value of COD is shown along with trend line with the statistical regression analysis. The coefficient of determination is also drawn showing R2 value 0.73 indicating a good correlation. By extending this line we noticed that by the year 2022 the average value may reach to greater than 40 mg/L signifying a gradually increasing trend of pollution by industrial discharge, which is 133% above the worst water allowed to use as the raw water source by many standards.
Serajuddin, Chowdhury, Beauty, Haque & Ferdous
25
Figure 4: COD (mg/L) Avg. Value vs. Years
Similarly figure 5 show the pattern of colour which is symmetrical like COD, peak is in February-March. The average value even reaches nearer to 120 mg/L which is 800% higher than the allowable drinking water level.
Figure 5: Colour (Pt-Co), Avg. Value vs. Months
Serajuddin, Chowdhury, Beauty, Haque & Ferdous
26
Figure 6: Colour (Pt-Co) Maxm. Value vs. Year
The increasing trend line showing the maximum values of colour in figure 6 is distinct with the coefficient of determination more than 0.74 signifying a good correlation. This indicates that the dying industries and washing plants are discharging wastewater containing very high colour out of the norm of the discharge along with an increase in the number of such industries. This graph has very good similarity with the graphs of Ammonia in similar prediction which is dealt with in other paper separately in detail.
Most of the DO values in any part of the year the concentration level never can reach the allowable guidelines of 6 mg/L which clearly signifies unabated anthropogenic will full pollution. If we look into the regression line of DO in fig.7 we found the coefficient of determination R2= 0.88 which is an excellent correlation even for yearly maximum values.
Figure 7: DO (mg/L) Yearly maxm. vs Year
Serajuddin, Chowdhury, Beauty, Haque & Ferdous
27
If we look into the concentration of conductivity, there is trend of the increase over time. Regarding E. Coli from the result, it is evident that every year the number of E. Coli is increasing, however the particular time of peak increase is not fixed. It signifies high anthropogenic and human excreta pollution. The quantum is in some months more than 50 times of allowable limit in raw water recommended to use for drinking water treatment. It also indicates severe lack of hygienic sanitation practices along the river bank as well as non- sewered areas of the dwelling.
Figure 8: E-Coli (CFU/100 ml) Avg. Value vs. months
In case of TSS, it is found that the monthly average value is found within the permissible limit in 14 months and rests 46 months have the deviation from the target. The turbidity over the study periods shows that no sample contains less than the drinking water allowable concentration. The monthly average value ranges from below 11 NTU up to 90 NTU. It can be seen that the chlorophyll, TSS, & turbidity concentration are gradually increasing over time, suddenly we found a lesser yearly average value than before in 2017. The reason might be that in 2017 we had a very particular weather condition – heavy rains for a long period of the year.
Serajuddin, Chowdhury, Beauty, Haque & Ferdous
28
Figure 9: Turbidity (NTU) Avg. Value vs. months
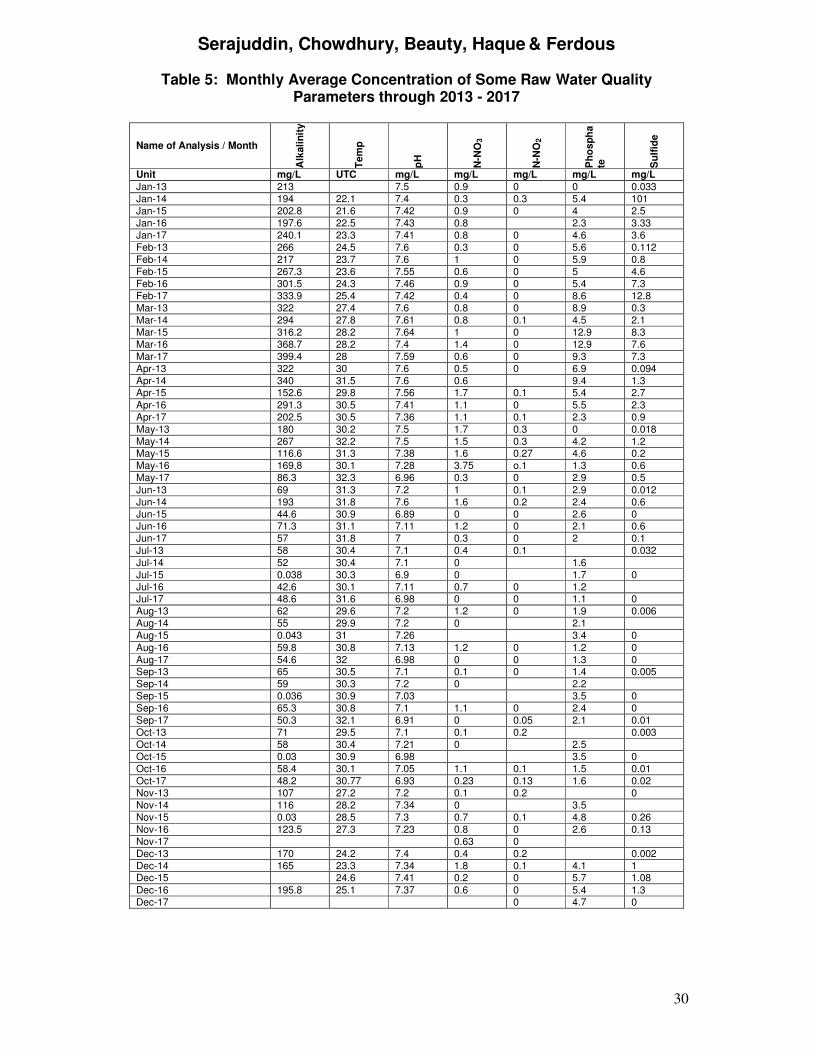
If we look on the yearly average values of raw water through 2013 – 2017 we observed that out of 16 physiochemical parameters only four parameters namely pH, nitrates, nitrites and phosphates are within the allowable drinking water level guidelines. It is shown in Table 4. Four heavy metal namely Al, Cr, Ni, Lead, are tested under this study. More or less one sample in each month of the dry seasons is tested. Similarly, a random sample from wet months is also tested for the raw water. All these tests are done in BUET laboratory. Most of the sample tested showed a result below the detection levels. A few concentrations those detected were all much within the permissible level of Bangladesh standard. The trend of concentration of Al. NO3, NO2, phosphate, and sulfide are also in the increasing tendency through not very sharply but notable especially in the dry seasons. This can be seen in Table 5. It is a widely discussed fact that in general, this river is being polluted by the discharge of untreated industrial effluent, urban wastewater, agrochemicals, sewage water, storm runoff, solid waste dumping, oil spillage, sedimentation and also illegal encroachment of canals and rivers which is increasing with the increase of population (Azim & Baten 2011, Dalwar & Hadiuzzaman 2005, ,Didarul & Gaushul 2015, GOB & UNDP 2010, Ibrahim & Ashraf 2015, IWM 2006, Naushad et al. 2006, Roy et al., Serajuddin 2009, Shahidul 2011, Shishir et al. 2009, 2006).
Serajuddin, Chowdhury, Beauty, Haque & Ferdous
29
Table 4: Water Quality Parameters with Yearly Average Values of Raw Water and Targeted Treated/ Raw Water Quality
Sl. No.
Parameter Unit Yearly Average values of Raw Water Targeted
8 Temperature °C 28.4 28.7 28.5 28.9 29.25 20 - 30 20-30
9 Chlorophyll µg/L 30 36 25 31 15 - 40
10 COD total mg/L 59.0 56.2 56.9 64.5 76.3 <4 30
11 Ammonia mg/L - - - - - <1.5 <4
12 Alkalinity mg/L 159 168 106 161 149 1 150
13 Nitrates mg/L 0.06 0.063 0. 74 1.22 0.40 10 -
14 Nitrites mg/L 0.09 0.17 0.06 0.01 0.031 <1.0 -
15 Sulfides mg/L 0.06 2.61 1.63 2.1 2.05 <0.05 20
16 Phosphate mg/L 3.45 4.2 4.76 3.78 3.68 6.0 9.0
Estimation reveals that there are over 12,000 industries in Dhaka metropolitan area located mostly in three clusters, namely, Hazaribagh, Tejgaon, and Dhaka- Narayanganj - Demra dam area (Shahidul 2011). However, among all these the dyeing factories are the main polluters of the rivers (IWM 2005). It is found that the untreated liquid waste originates around 61 percent from industrial and 39 percent from domestic sources (IWM 2005, Shahidul 2011). Seventy percent of the population of the city does not have access to improved sanitation facilities (Shahidul 2011). The fertilizer factories, washing plants, the leachate of the waste dumping sites, the open drained domestic waste are the main sources of ammonia in the raw water. At present, the industry owners under pressure are constructing Effluent treatment plants (ETPs) to comply with the rules of Department of Environment (GOB 1997). However, they are reluctant to operate them because of a high recurring cost of imported ETPs and untreated wastes are discharged into the water bodies (Shahidul 2011).
Serajuddin, Chowdhury, Beauty, Haque & Ferdous
30
Table 5: Monthly Average Concentration of Some Raw Water Quality Parameters through 2013 - 2017
It has become long overdue that all stakeholders have to be careful regarding future man-made willful reckless pollution. The continuous pollution by the vested quarter is uninterruptedly going on making the water system operation a challenge for the water authority and nightmare for the denizens of the city.
5. Conclusions and Recommendations The rivers surrounding Dhaka are the lifeline of this capital city, a city which history is attuned with the history of the country, history of the culture & development and which future will determine the destiny of the citizens of the city. This research portrait a comprehensive picture of the present status and trend of the raw water quality of the Sitalakhya river, the source water of the largest treatment plant of Bangladesh. Study on this particular surface water quality with a continuous quality data for five years covering each & every month of the year is probably conducted for the first time in Dhaka. This is a concerted approach to share the picture of water quality of raw water source with the mass people as well as the policymakers with all aspect of the daily needed requirement. This will help to awaken the people regarding the gloomy picture of water situation probably coming in future if necessary measures are not taken urgently. To protect the river the provisions of both the ECA (As amended up to 2010) and the Paribesh Adalat Ain, 2010 should be strictly enforced. The order of High court Division of the Supreme Court of Bangladesh on June 23, 2009, for the closure of the industries in case of failure to install effluent treatment plants and other appropriate pollution fighting devices by June 30, 2010, should be enforced (Shahidul 2011). In this regard, provisions of monetary incentives, rewards, and recognition for the polluters who reduce pollution may work effectively. The polluters shall be ordered to shoulder the responsibility of cleaning them under auspices of the DoE (GOB & UNDP 2010). Indigenous low-cost water treatment process with locally available chemicals as developed in BUET should be made mandatory for the industries (Quader 2010). Mass level awareness should be raised about the fact on the discharge of untreated effluents and its consequences. The surrounding rivers of Dhaka city have already been declared critically sensitive zones by Act. The biological pretreatment for ammonia removal employed on the present site has to be continued judiciously. If needed, a de-nitrification unit could be installed after proper feasibility. The efficient solid waste management system should be introduced & continued (Shahidul 2011). The whole city should be brought under formal sewerage system as soon as possible (GOB & UNDP 2010). Like many other countries of the world, implementation of a “Water Police Brigades” system reporting to the court may be implemented in Bangladesh. The upcoming projects of larger capacity water treatment plants are to be planned at a clean and safe water source. As the immediate measure, the water authority has already started implementation of three large treatment plants abstracting water from big rivers like the Padma, the Meghna, which are several kilometers away from Dhaka city. If the raw water of Sitalakhya continues to deteriorate in such a manner, a situation may so arise that it will create water shortage for the denizens of Dhaka since the plant has to be shut down whenever it receives excessively high pollution. Only one day of shut down of the plant means at least three million people will be directly out
Serajuddin, Chowdhury, Beauty, Haque & Ferdous
32
of water supply (Serajuddin 2012). In a city like Dhaka, this is beyond imagination. If the situation does not change, Bangladesh will face serious consequences. Every stakeholder has to act to save the rivers from pollution and thus to save Dhaka from being abandoned due to lack of potable water. The information of the physicochemical properties of river water derived from this study would be a useful tool for further ecological assessment and monitoring of the river quality and to demonstrate to all stakeholders regarding our unabated atrocity in polluting this valuable water source and make them aware of the probable disaster in near future for this. The water quality situation solely in the dry seasons could not be shown in this paper due to limitations. Further research may be conducted on this issue separately. The identification and pinpointing of the source of pollution for this river could not be conducted under the limitation of this study. The season wise raw water quality indexing would be of interest to many professionals which could not be conducted under this study which is also a limitation of this study. Further similar research may be conducted taking water from different locations upstream & downstream and also in other rivers surrounding the city.
Acknowledgements A number of Engineers and technical staffs from the Dhaka plant and a number of experts from M/s SUEZ International, the constructor of Dhaka Plant project, especially Dr. Jean Claude Seropian, assisted in the study and this co-operation are greatly appreciated.
References APHA 1995, Standard Methods for the Examination for Water and Wastewater, 19th
edition, Washington. Azim U & Baten, 2011, Water supply of Dhaka city: Murky future, the issue of access
and inequality, a report, The Innovators October, Dhaka. Banani, B., & Takeshi, H, 2012, ‘Relation between Hazaribagh Tannery Industry
Development and Buriganga River Pollution in Bangladesh’, International Journal of Environment, Vol.2, No.2, Pp. 117–127.
Begum, D.A., & Tanvir, 2010, ‘Water quality aspects in and around Dhaka city’, In: Proceedings of the International Conference on Environmental aspects of Bangladesh (ICEAB10), Sept.2010, Japan, Pp.175-178.
Bigas, H (ed.) 2012, The Global Water Crisis: Addressing an Urgent Security Issue, Papers for the Inter Action Council, 2011-2012, Hamilton, Canada: UNU-INWEH.
Bureau of Indian Standard, 2012, Drinking water specification (second revision) IS 10500, Delhi.
Dalwar, R., & Hadiuzzaman, M, 2005, ‘Pollution status and trends in water quality of the Shitalakhya and Balu rivers’ MSc thesis, BUET, Dhaka.
Didar-Ul,I., & Gausul, A, 2015, ‘Seasonal variation of physicochemical and toxic properties in three major rivers: Shitalakhya, Buriganga and Turag around Dhaka city, Bangladesh’, Journal of Biological & Environmental Science, Vol. 7, No. 3, Pp. 120-131.
Serajuddin, Chowdhury, Beauty, Haque & Ferdous
33
DWASA 1992, Dhaka WASA IV project. Saidabad site feasibility Assessment, Dhaka.
DWASA 1994, Dhaka WASA IV project. EIA study, Dhaka.. DWASA 2007, Joint Feasibility Study of Pre-treatment for water supply for the
Saidabad Water Treatment Plant, Dhaka, Bangladesh, Final Report, Dhaka. European Union, 1975, EU Council Directives 1975, Concerning quality required of
surface water intended for the abstraction of drinking water in the member states, 75/440/EE,. Paris.
GoB 1997, Environmental Conservation Rules, Ministry of Environment and Forest, Government of the People’s Republic of Bangladesh, Dhaka.
GOB & UNDP 2010, Pollution Abatement Strategies for Rivers and Wetlands in and Around Dhaka City, Bangladesh, Parliamentary Standing committee on Ministry of Environment & Forests, Dhaka.
Government of France 2007, Journal official de la Republic Francaise , Texte 17 Sur 121, Decret, arretes, circulaires, Paris.
Ibrahim, S., & Ashraf, A, 2015, ‘Pollution of water bodies within and around Dhaka city: the Case of Gulshan lake’, Journal of civil Engg., IEB, Vol.43, No.1, Pp. 23 – 39.
IWM 2005, Assessment of the Water Quality of Lakhya River with special reference to the Intake point of Saidabad Water Treatment Plant, Draft Final Report, Dhaka.
IWM 2006, Resource Assessment and Monitoring of Water Supply Sources for Dhaka City, Final Report, Dhaka.
Joshua, N., & Nazrul, I, 2015, ‘Water Pollution and its Impact on the Human Health’ Journal of Environment and Human, Vol. 2, No.1, Pp.36 - 46.
Mahbub, K., Nahar, A., Ahmed, M., Chakrabarty, A, 2011, ‘Quality Analysis of Dhaka WASA Drinking Water: Detection and Biochemical Characterization of the Isolates’, Journal of Environmental Science & Natural Resources,Vol.4,No.2, Pp. 41-49.
Mujibur, R 2010, ‘Sustainable water Supply: A Tale of a Megacity’, International Symposium on ‘Environmental Degradation and Sustainable Development ISEDSD, Dhaka, 10-11April, Bangladesh, BUET, WEDC, British council, pp. 16-20.
Naushad, A., Fazle, E., Didar, A, 2006, ‘Risk and Water Quality Assessment over view of River. Sitalakhya in Bangladesh’ , Academic Open Internet Journal , vol. 19, pp.1-9.
Quader, A 2010, ‘Wastewater treatment in textile industries for clean environment’, In: Souvenir of the Twenty First Convention of Chemical Engineers of Bangladesh, Dhaka, April 2010. BSCE,pp. 55-62.
Roy, S., Banna, L.N.,Hossein, M., Rahman, H, 2014, ‘Water quality of Narai canal and Balu river of Dhaka City: An impact of Industrialization’, Journal of Bangladesh Agril. Univ, Vol. 12, No. 2, Pp. 285–290.
Sania M; Nawshad H; Lutfur R, 2012, ‘A study on the Industrial River Pollution in DEMDP area and planning Approaches’ The Jahangir nagar review, Part II: Social Science, Vol. XXXIII. No. Nil, Pp.259 – 270.
Serajuddin 2002, ‘Water Treatment at Saidabad Plant: State – of - the Art’, Engineering News, Institution of Engineers, Bangladesh (IEB), Vol. 28, No. 4, Pp. 20-26.
Serajuddin 2009, ‘Issues and challenges of water supply for a safer megacity ---Perspective Dhaka’, In: Proceedings of the National Seminar on Engineers
Serajuddin, Chowdhury, Beauty, Haque & Ferdous
34
Role in developing a safer Megacity, Dhaka, March 2009. The Institution of Engineers, Bangladesh (IEB), Pp.37 – 48.
Serajuddin 2011, ‘Issues of Raw Water Quality in the Treatment of Drinking Water at Dhaka’, Proceedings of the international Conference on Environmental Technology & Construction Engineering, ICETCESD, SUST, Sylhet, Bangladesh, Pp.45 - 54.
Serajuddin 2012, ‘Saidabad Water Treatment Plant Phase II: A Remarkable Advancement towards Sustainability’, Souvenir published by Dhaka Water Supply & Sewerage Authority on the occasion of inauguration of Saidabad Water Treatment Plant II, Dhaka,13 December, Bangladesh, Pp.31- 40.
Serajuddin & Islam A 2017, ‘Surface water quality susceptibility in drinking water treatment at Dhaka, Bangladesh’, Journal of Biodiversity and Environmental Sciences (JBES), Vol. 11, No.1, Pp. 134 – 151.
Shahidul, I 2011 , ‘Legal Issues of River Pollution through Industrial Effluents’, Eastern University Journal, Vol. 3, No. 3, Pp. 88 – 99.
Shishir, K., Mafiz, R., Alim, B., Sharmistha, D, 2009, ‘Status of heavy metal in the peripheral rivers around Dhaka city’, International Journal of Sustainable Devlopment , Vol.08, No.02, Pp.39 - 44.
Suchana,S, 2016, ‘Effect of ammonia on formation of Trihalomethanes (THMs) during chlorination of potable water’, MSc thesis, BUET, Bangladesh.
United State Environmental Protection Agency 2006, Drinking Water Standards and Health Advisories, USEPA, Washington, D.C
WHO 2011, Guidelines for Drinking-water Quality, Fourth Edition, Geneva.