African Economic Conference 2009 Fostering Development in an Era of Financial and Economic Crises 11 – 13 November 2009 • United Nations Conference Centre • Addis Ababa, Ethiopia African Development Bank Group Economic Commission for Africa Dhows to Planes: Trade Relations between the Arabian Gulf and Africa and their Impacts on Development Mwangi wa Gĩthĩnji
Transcript
African Economic Conference 2009Fostering Development in an Era of Financial and Economic Crises
11 – 13 November 2009 • United Nations Conference Centre • Addis Ababa, Ethiopia
African Development Bank Group Economic Commission for Africa
Dhows to Planes: Trade Relations between the Arabian Gulf and Africa and their Impacts on Development
Mwangi wa Gĩthĩnji
Dhows to Planes: Trade Relations between the Arabian Gulf and Africa and their Impacts on
Development
Mwangi wa Gĩthĩnji Department of Economics
University of Massachusetts – Amherst Amherst, MA. USA.
Zero Draft please do not cite without authors permission.
October 1, 2009
ABSTRACT: The relationship between the Arabian Gulf and the African continent is a long standing one. While the contacts after the rise of Islam in the 7th Century are well documented there is evidence of contact between the regions prior to that period going back as early as the first century AD. While the size of the trade itself is impressive, more impressive are the long lasting effects of growth and development that came out of the trade‐ the growth and development of the Sudanic empires of West Africa and the city‐states of the East African coast. Today, fueled not by the mineral riches of Africa but those of the Oil rich Arabian Gulf trade between the regions continues. Although this trade is no longer at the center of world trade as it once was, it is an important part of the trade of many of the African countries. In this paper we will examine the recent history of trade between the countries of the Gulf Cooperation Council namely, Bahrain, Kuwait, Oman, Qatar, Saudi Arabia and the United Arab Emirates and African countries and its potential impact on industrialization. We will briefly discuss the relationship between trade and industrialization and the degree to which this relationship has held in the post‐independence period of African countries. This will be followed by an examination of the volume and trend in trade between Africa and the Gulf and a first estimation of how it has changed. After establishing what the volume of trade is we examine what kind of trade occurs. In other words we examine the sophistication of exports from both regions to each other in an attempt to uncover whether the trade of today has the ability not only to affect growth because of its size but also to impact the process of industrial transformation because of the kind of goods traded. We will examine the sophistication of exports using the ten groups of exports created by Sanjaya Lall as well as the Lall‐Weiss‐Zhang index of sophistication (Lall, 2000; Lall et al., 2006). We will end the paper with some suggestions on the lessons that policy makers should take away from our exercise.
Dhows to Planes – Draft – Please do not Cite Page 2
Figure 1: Trade Routes between Africa and the World before the 14th Century. ................................... 4
The Relationship between Trade and Industrialization ................................................................................ 6
Figure 2: Trade as Proportion of GDP 1965‐2005 .................................................................................... 6
Figure 3: Price Indices of Leading Exports for Cote d’Ivoire 1965‐2005 ................................................... 8
Figure 4: Price Indices of Leading Exports for Cameroon 1965‐2005 ....................................................... 8
Figure 5: Price indices of Leading Exports for South Korea 1965‐2005 .................................................... 9
Some Basic Comparisons of African and Gulf States .................................................................................. 10
Figure 6: Basic Comparison of African Countries to Gulf States ............................................................. 11
Basic Trade Patterns between African and Gulf States .............................................................................. 11
Figure 7: Gulf Exports to Africa for 1980 and 2005 ................................................................................ 12
Figure 8: African Exports to the Gulf for 1980 and 2005 ........................................................................ 13
Figure 9: Trade Balances between the African and Gulf Regions 1980 and 2005. ................................ 14
Figure 10: Major African Exporters and Importers to and from the Gulf ............................................... 15
Figure 11: Gulf Trade Balances with leading Trade Partners in Africa.................................................... 16
The Sophistication of Exports and Industrialization ................................................................................... 17
Figure 12: Lall‐Weiss‐Zhang Index for Groupings of Products based on Technical Sophistication (2005) ................................................................................................................................................................ 18
Figure 13: Percent of Countries within Income Group by Export Sophistication Level (2005) for Low Technology Exports ................................................................................................................................. 20
Figure 14: Percent of Countries within Income Group by Export Sophistication Level (2005) for High Technology Exports ............................................................................................................................. 21
The Sophistication of African and Gulf Trade ............................................................................................. 21
Figure 15: The Sophistication of Gulf Exports to Africa .......................................................................... 22
Figure 16: The Sophistication of African Exports to the Gulf .................................................................. 23
Summary of Findings and Policy Implications ............................................................................................. 24
Appendix 1 ‐ The Lal‐Weiss‐Zhang Index .................................................................................................... 26
Appendix 2. Technological Groupings ( Based on Lall 2000) ..................................................................... 27
Dhows to Planes – Draft – Please do not Cite Page 3
Introduction
The relationship between the Arabian Gulf and the African continent is a long standing one. While the
contacts after the rise of Islam in the 7th Century are well documented there is evidence of contact
between the regions prior to that period going back as early as the first century AD as documented by
Greeks from Ptolemaic Egypt who describe the trade between Egypt, the East African coast and the far
east that occured through the Gulf region (Anon, 1989; Davidson, 1991). During the well documented
period of the spread of Islam, camel caravans from West Africa and the Sudanic Kingdoms of Ghana,
Mali, Songhai, Kanem Bornu and others connected to the Gulf via North Africa and the Tran‐Saharan
routes which brought West African gold among other products to world markets. This trade was itself
built on existing local African trading networks. For example archaeological evidence suggests that
Timbuktu which was incorporated into Mali in the 14th. Century emerged before the 12th. Century as a
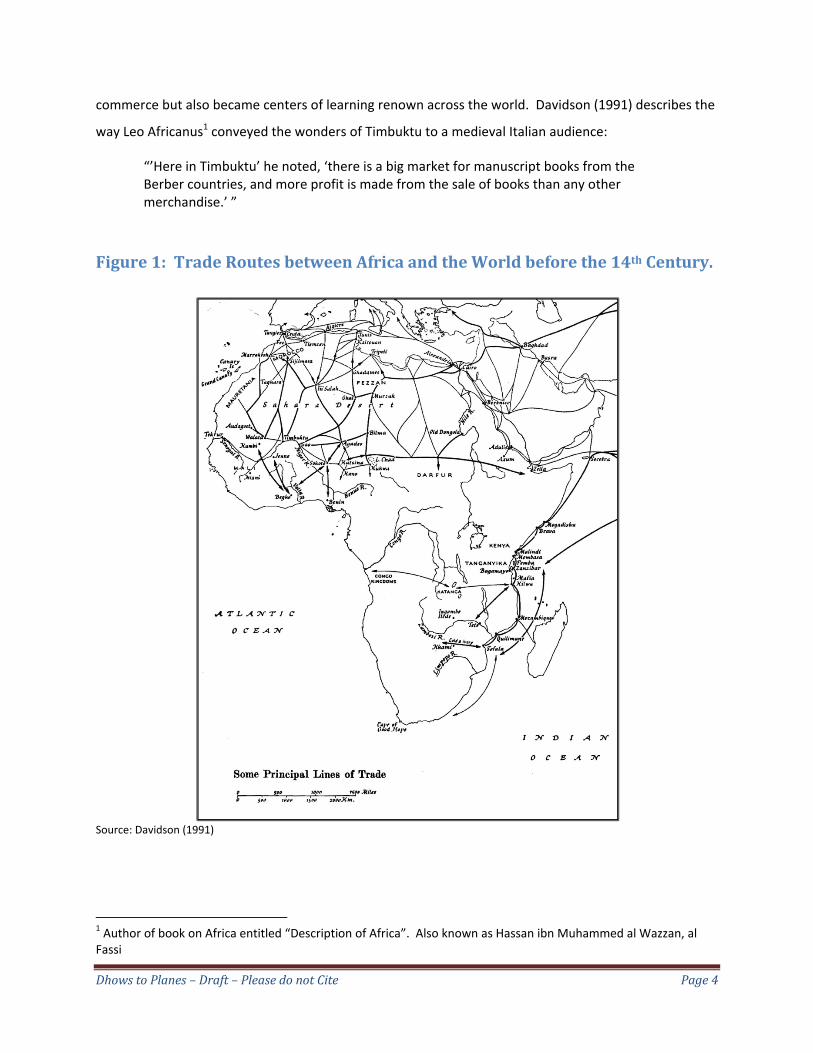
local center of trade (Insoll, 2000). In the east the trade which took part over sea using dhows and the
favorable monsoons connected the gulf with the city states of eastern Africa again bringing primarily
gold, ivory and iron to world markets including markets as far away as China (See Figure 1 – following
page). In both instances while we do not have actual measures of the trade we have indications that it
was large. West African gold prior to the discovery of the America’s was the major source of gold for the
vast markets of Europe, North Africa and parts of Asia that were connected via the Mediterranean. In
fact the size of the deposits were so large that when Mansa Musa the ruler of Mali did his hajj in 1324 it
is said he distributed so much gold along the way that the price of gold in Cairo was depressed for
numerous years thereafter. On the east coast we know that once the Portuguese, then one of the
world’s naval superpowers, controlled the east coast of Africa despite their superior firepower they did
not have sufficient vessels to keep the trade going and the volume of trade collapsed during this era
(Davidson, 1991). The importance of the east coast of Africa was such that the empire of Oman moved
its capital from its homeland in the Gulf to the island of Zanzibar in the 1800s.
While the size of the trade itself is impressive, more impressive are the long lasting effects of growth
and development that came out of the trade. In West Africa there was an expansion of the existing
African urban centers fueled by the proceeds of the trade. The centers not only expanded as centers of
Dhows to Planes – Draft – Please do not Cite Page 4
commerce but also became centers of learning renown across the world. Davidson (1991) describes the
way Leo Africanus1 conveyed the wonders of Timbuktu to a medieval Italian audience:
“’Here in Timbuktu’ he noted, ‘there is a big market for manuscript books from the Berber countries, and more profit is made from the sale of books than any other merchandise.’ ”
Figure 1: Trade Routes between Africa and the World before the 14th Century.
Source: Davidson (1991)
1 Author of book on Africa entitled “Description of Africa”. Also known as Hassan ibn Muhammed al Wazzan, al Fassi
Dhows to Planes – Draft – Please do not Cite Page 5
In Eastern Africa, on the foundation of the existing urban centers grew larger Islamic city states, and a
new civilization peopled by the Swahili, borne out of the encounter between African and Arab. This new
civilization spread from the coasts of modern Somali to those of Mozambique left a long learning legacy,
not least of which is a language and culture that today binds tens of millions of east Africans. Not only
was the effect felt on the coasts but along the entire inland trading routes that supported the commerce
impressive growth took place resulting in Kingdoms such as those of Monomotapa and structures such
as the Great Zimbabwe. Although the establishment and expansion of this trade like trade in much of
the world then and since was accompanied by violence, bloodshed and the abominable trade in humans
its impacts point to the possible catalytic role that trade can play in the economic development of a
region or state.
Today, fueled not by the mineral riches of Africa but those of the oil rich Arabian Gulf trade between the
regions continues. Although this trade is no longer at the center of world trade as it once was, it is an
important part of the trade of many of the African countries. In this paper we will examine the recent
history of trade between the countries of the Gulf Cooperation Council namely, Bahrain, Kuwait, Oman,
Qatar, Saudi Arabia and the United Arab Emirates and African countries and its potential impact on
industrialization. In the next section we will briefly discuss the relationship between trade and
industrialization and the degree to which this relationship has held in the post‐independence period of
African countries. This will be followed by an examination of the volume and trend in trade between
Africa and the Gulf and a first estimation of how it has changed. After establishing the volume of trade
we examine what kind of trade occurs. In other words we examine the sophistication of inter‐regional
exports in an attempt to uncover whether the trade of today has the ability not only to affect growth
because of its size but also to impact the process of industrial transformation because of the kind of
goods traded. We will examine the sophistication of exports using the ten groups of exports created by
Sanjaya Lall as well as the Lall‐Weiss‐Zhang index of sophistication (Lall, 2000; Lall et al., 2006). We will
end the paper with some suggestions on the lessons that policy makers should take away from our
exercise.
Dhows to Planes – Draft – Please do not Cite Page 6
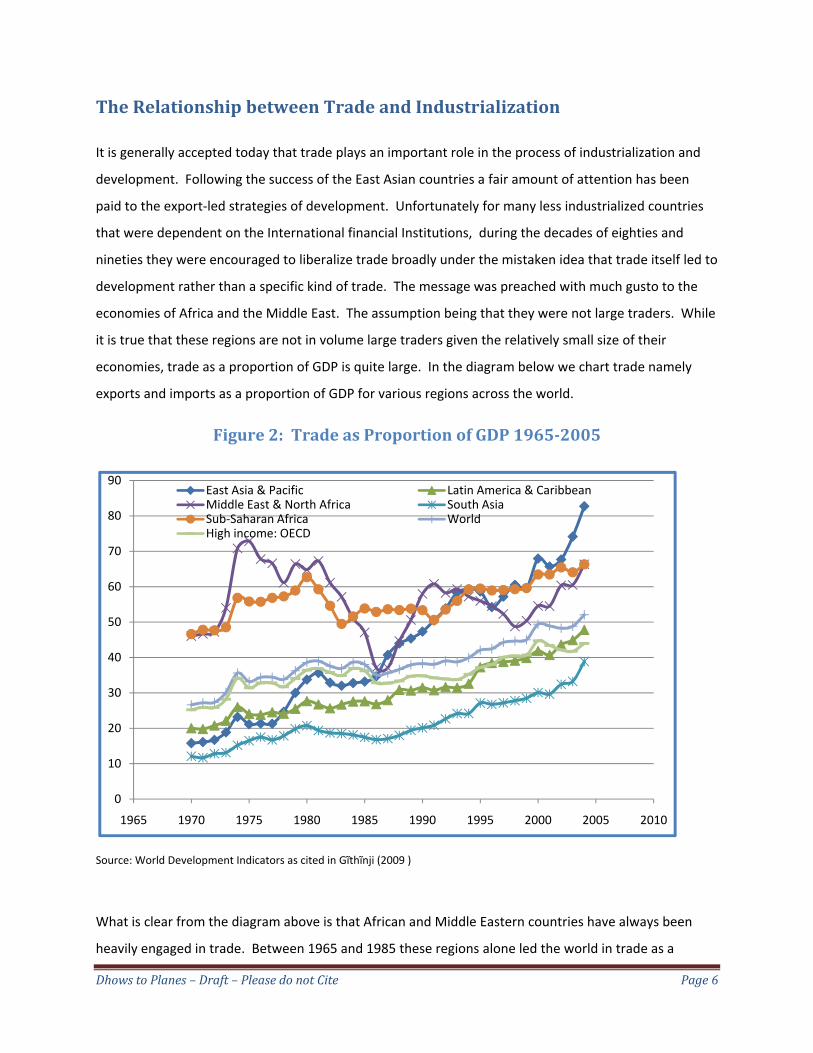
The Relationship between Trade and Industrialization
It is generally accepted today that trade plays an important role in the process of industrialization and
development. Following the success of the East Asian countries a fair amount of attention has been
paid to the export‐led strategies of development. Unfortunately for many less industrialized countries
that were dependent on the International financial Institutions, during the decades of eighties and
nineties they were encouraged to liberalize trade broadly under the mistaken idea that trade itself led to
development rather than a specific kind of trade. The message was preached with much gusto to the
economies of Africa and the Middle East. The assumption being that they were not large traders. While
it is true that these regions are not in volume large traders given the relatively small size of their
economies, trade as a proportion of GDP is quite large. In the diagram below we chart trade namely
exports and imports as a proportion of GDP for various regions across the world.
Figure 2: Trade as Proportion of GDP 19652005
Source: World Development Indicators as cited in Gĩthĩnji (2009 )
What is clear from the diagram above is that African and Middle Eastern countries have always been
heavily engaged in trade. Between 1965 and 1985 these regions alone led the world in trade as a
0
10
20
30
40
50
60
70
80
90
1965 1970 1975 1980 1985 1990 1995 2000 2005 2010
East Asia & Pacific Latin America & CaribbeanMiddle East & North Africa South AsiaSub‐Saharan Africa WorldHigh income: OECD
Dhows to Planes – Draft – Please do not Cite Page 7
proportion of GDP. Around 1985 they were joined by East Asian and Pacific countries with the
engagement of China with the world economy. It took however till 1998 before the East Asian block of
countries were bigger traders as a proportion of GDP than the African and Middle East Countries. While
in the case of African countries imports have been larger than exports but the exports were substantial.
In practically all cases being over 40 per cent of GDP (Gĩthĩnji, 2009 ). If particularly African countries
were such big traders relative to GDP why have they not seemed to have reaped the same rewards from
trade that the East Asian countries have. Although there are a variety of factors that differentiate the
East Asian countries trade from African countries, one factor that stands out is the nature of exports
that were produced by East Asian countries versus those produced by African countries. Whereas
African countries depended on primary products for the bulk of their exports during this period the east
Asian countries changed their exports from primary exports to more technologically intensive
manufactures. With the expansion of World income during this period the amount of consumption of
higher value manufactures increased at a rate much higher than that of primary products. While African
countries remained exporters of primary products whose prices briefly saw an upswing in the nineteen
seventies followed by a downward trend since then until the recent past, East Asian countries were
diversifying away to more sophisticated exports. These more sophisticated exports required higher
human capital and also resulted in higher wages for the producers. The overall impact was one of
industrialization in East Asia and stagnation in Africa.
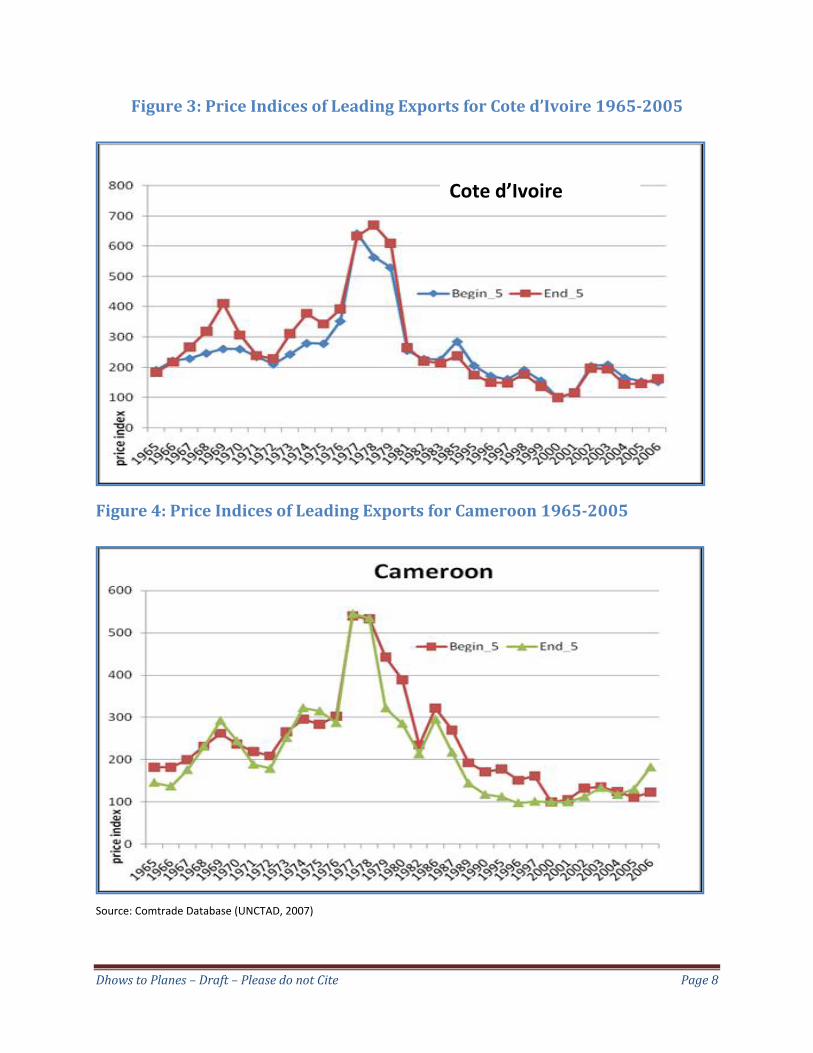
These paths can be illustrated quite easily by examining the path of prices for the leading exports over
time for African countries in comparison to East Asian countries. In the diagrams below we chart the
exports of two African countries Cote d’Ivoire and Cameroon and compare that to the exports of South
Korea over time. We do not want to claim that all African countries follow this exact pattern but these
two countries exhibit a pattern that is fair typical across the continent. There are two series in each
graph. These are Beg_five and end_five. Beg_five is a price index of a basket of goods comprising the
top five exports of the country in 1965. End_five is a similar basket but comprised of the top five
exports in 2005. Because most African countries exports are fairly limited these indices actually cover a
substantial amount of the exports of the country.
Dhows to Planes – Draft – Please do not Cite Page 8
Figure 3: Price Indices of Leading Exports for Cote d’Ivoire 19652005
Figure 4: Price Indices of Leading Exports for Cameroon 19652005
Source: Comtrade Database (UNCTAD, 2007)
Cote d’Ivoire
Dhows to Planes – Draft – Please do not Cite Page 9
Before comparing South Korea to the two African examples, let us first take note of two characteristics
of the paths of the African price indices. First we note that the two price indices practically overlap in
the case of both countries. This is because the primary exports of both countries hardly changed
during this period. African countries in many instances are still dependent on a pattern of exports first
established in the colonial era – and not established to benefit African economies. The second thing to
note is that the price indices are practically a depiction of the pattern of growth in Africa. An early
increase in growth in the 1960s and early 1970s due to the high commodity prices that existed and then
with the collapse in demand for the commodities after the oil crises of the mid to late 1970s a fall in the
prices of commodities and African growth that lasts through the 1990s and only begins to ameliorate in
the new century.
Figure 5: Price indices of leading Exports for South Korea 19652005
Source: Comtrade Database
Dhows to Planes – Draft – Please do not Cite Page 10
The price indices for South Korea in comparison are substantially different. We note first that the two
indices are very different and do not coincide in trend. In fact they portray a very telling story. The
index for South Korea’s initial basket of goods has a down ward trend while that of the dominant goods
at the end has an upward trend. These facts point to some important differences between South Korea
specifically and East Asia more generally and African countries. The first is that the basket of goods that
dominated exports in South Korea in the 1960s was not the same as the basket of goods that dominates
the exports today. Secondly the price of the initial basket of goods falls while that of the final basket
rises over time. In fact these two series form a scissors of sorts. What is occurring is that South Korea
diversifies away from primary goods that have a downward trend in prices as world income and trade
expands and moves to more sophisticated goods that have an upward trend in prices. The result is
higher incomes to South Korean exporters and industry resulting in higher income for the South Korean
population.
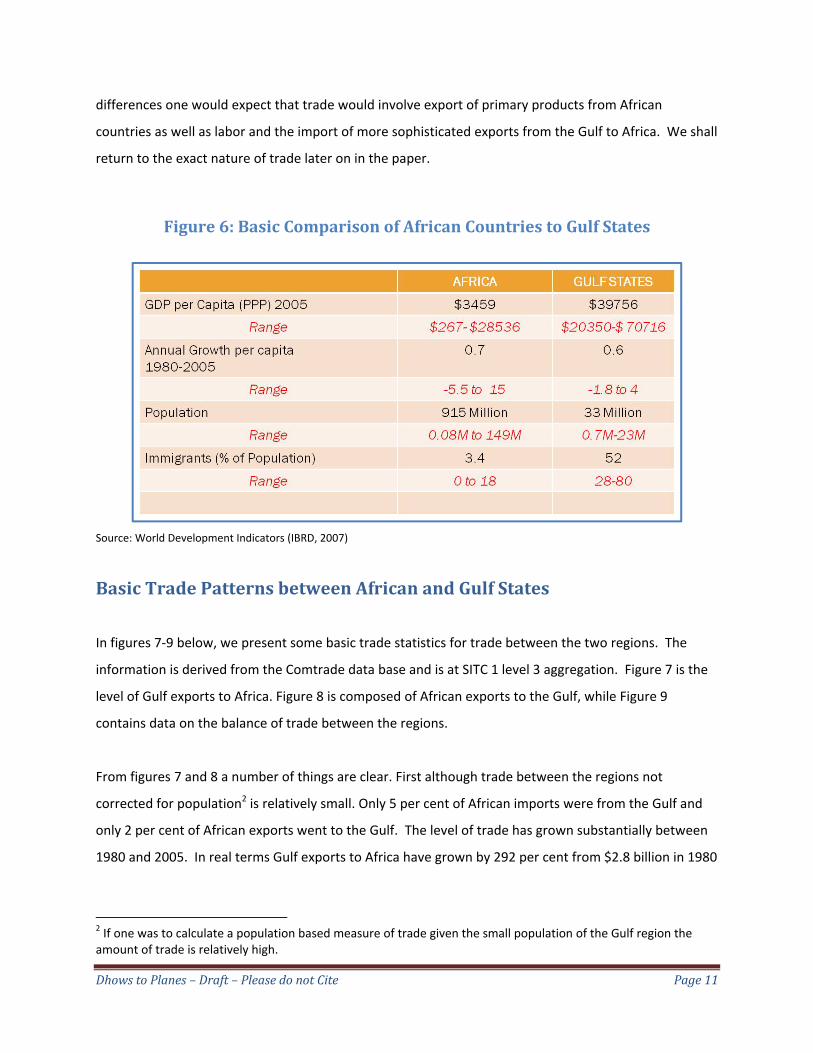
Some Basic Comparisons of African and Gulf States
African countries and their Gulf counter parts have a number of differences and similarities that have an
impact on the nature of trade between the regions. In figure 2 below we present some basic facts on
the two regions. In this section we use data for 2005 for the present as it is the most recent year that we
have data on a large number of African and Gulf States. On average the Gulf States are much richer in
per capita income terms. The average income for Gulf residents is PPP$ 39756, while that for Africa is
slightly less than one tenth of that at PPP$3459, The difference is also captured in the range of incomes
for African states versus Gulf states, while the range for African countries starts at PPP$ 267 and runs to
PPP$ 28536, the range for Gulf states starts at the high end of the African range at PPP$ 20350, and runs
all the way to PPP$ 70716. So while African states are dominated by low income states, the oil rich Gulf
States are dominated by upper middle income to high income states. There are also significant
differences in population size and some demographic characteristics; The African region has a total
population of close to a billion people while the Gulf region is under 40 million. The countries in the Gulf
tend to be small with the largest being only 23 million. African populations on average are larger, with
most having over 10 million people and the largest country Nigeria coming in at around 150 million. In
demographic characteristics African countries have much smaller immigrant communities and more
often than not are net exporters of labor while the Gulf States are heavily dependent on immigrant
labor ranging from 28 to 80 per cent of their populations being made up of immigrants. Given these
Dhows to Planes – Draft – Please do not Cite Page 11
differences one would expect that trade would involve export of primary products from African
countries as well as labor and the import of more sophisticated exports from the Gulf to Africa. We shall
return to the exact nature of trade later on in the paper.
Figure 6: Basic Comparison of African Countries to Gulf States
Source: World Development Indicators (IBRD, 2007)
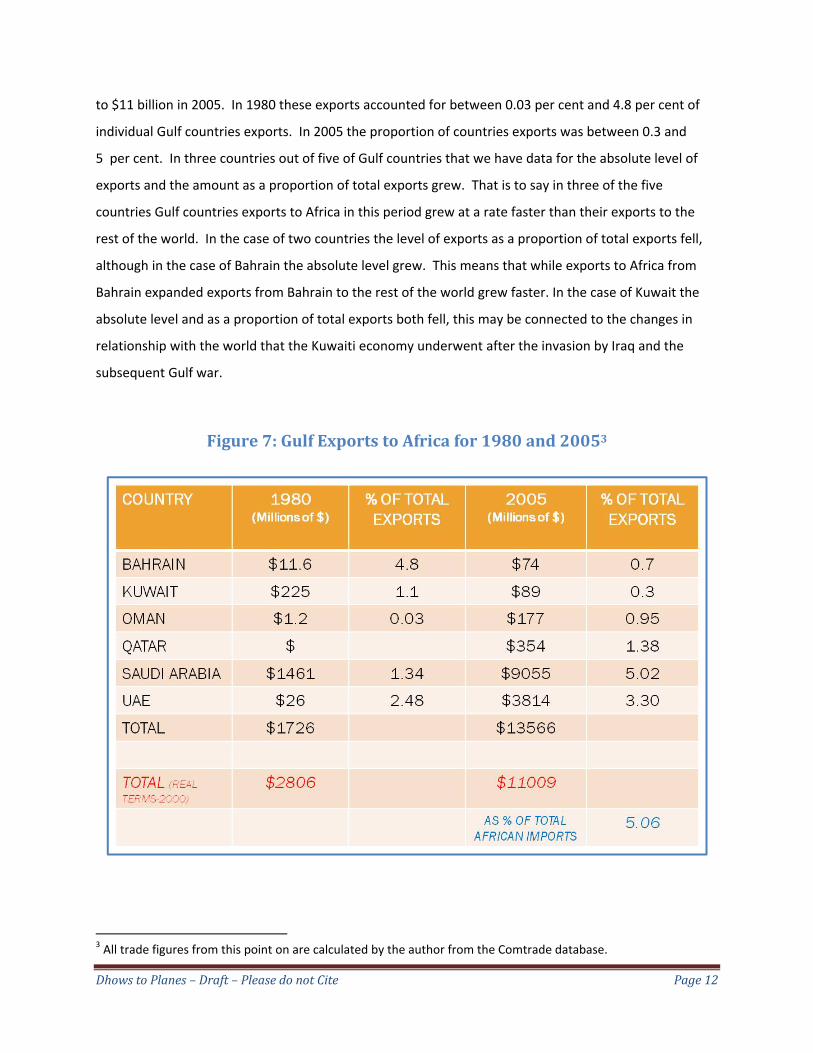
Basic Trade Patterns between African and Gulf States
In figures 7‐9 below, we present some basic trade statistics for trade between the two regions. The
information is derived from the Comtrade data base and is at SITC 1 level 3 aggregation. Figure 7 is the
level of Gulf exports to Africa. Figure 8 is composed of African exports to the Gulf, while Figure 9
contains data on the balance of trade between the regions.
From figures 7 and 8 a number of things are clear. First although trade between the regions not
corrected for population2 is relatively small. Only 5 per cent of African imports were from the Gulf and
only 2 per cent of African exports went to the Gulf. The level of trade has grown substantially between
1980 and 2005. In real terms Gulf exports to Africa have grown by 292 per cent from $2.8 billion in 1980
2 If one was to calculate a population based measure of trade given the small population of the Gulf region the amount of trade is relatively high.
Dhows to Planes – Draft – Please do not Cite Page 12
to $11 billion in 2005. In 1980 these exports accounted for between 0.03 per cent and 4.8 per cent of
individual Gulf countries exports. In 2005 the proportion of countries exports was between 0.3 and
5 per cent. In three countries out of five of Gulf countries that we have data for the absolute level of
exports and the amount as a proportion of total exports grew. That is to say in three of the five
countries Gulf countries exports to Africa in this period grew at a rate faster than their exports to the
rest of the world. In the case of two countries the level of exports as a proportion of total exports fell,
although in the case of Bahrain the absolute level grew. This means that while exports to Africa from
Bahrain expanded exports from Bahrain to the rest of the world grew faster. In the case of Kuwait the
absolute level and as a proportion of total exports both fell, this may be connected to the changes in
relationship with the world that the Kuwaiti economy underwent after the invasion by Iraq and the
subsequent Gulf war.
Figure 7: Gulf Exports to Africa for 1980 and 20053
3 All trade figures from this point on are calculated by the author from the Comtrade database.
Dhows to Planes – Draft – Please do not Cite Page 13
Figure 8: African Exports to the Gulf for 1980 and 2005
Although African exports to the Gulf are smaller the broad trends are similar. During the period exports
from African countries to the Gulf have grown from just under a billion dollars in 1980 to slightly over3
billion dollars in 2005 in real terms, representing a threefold increase. In this case both the absolute
level of African exports to the Gulf and the percentage of these exports as part of overall Gulf imports
have grown for each Gulf country. In 1980 the total absolute level of African exports ranged between 9
to 508 million dollars and accounted for between 0.4 to I.7 per cent of total imports. By 2005 the
absolute level had risen to a range of between $ 61 million and $ 1 billion and a range of 0.7 to 2.9 per
cent as a percentage of total Gulf imports. That is to say that African exports to the Gulf grew faster
than exports from the rest of the world to the Gulf. In the case of the United Arab Emirates in particular
the growth has been spectacular. In 1980 total imports were only 29 million dollars representing only
0.36 per cent of all imports. By 2005 this had grown to 1.6 billion dollars representing 1.9 per cent of all
imports.
Dhows to Planes – Draft – Please do not Cite Page 14
Figure 9: Trade Balances between the African and Gulf Regions 1980 and 2005.
Over this period the direction of trade has strongly favored the Gulf region (see figure 9). In nominal
terms exports from the Gulf grew eightfold while imports to the Gulf from African countries grew only
six fold. The result is that in real terms the trade balance in favor of the Gulf States grew slightly more
than fourfold from $ 1.8 billion dollars to $ 8 billion dollars.
In the previous two pages we established a number of key characteristics at the regional level for Africa
and at the regional and country level for Gulf States. These included the following three important
characteristics. First trade as proportion of each regions exports or imports is relatively small. Second
though small the trade is growing rapidly, in most instances both at regional and country level for the
Gulf countries it is growing faster than trade with the rest of the world. Lastly trade is overwhelmingly
in favor of the Gulf States as measured by the overall balance of trade, and this in fact had become more
favorable to the Gulf over the period we examine 1980‐2005.
In the following pages we examine the same issues at the level of individual countries in Africa. In the
figures below we present, the major trading partners in Africa to the Gulf. In figure 10 we present
African countries whose exports or imports to and from the Gulf region account for more than 2 per
cent of total African exports or imports. The first thing we note is that trade between the Gulf and
African countries is dominated by countries along the North African or the Eastern Africa coasts.
Second all the countries with the exception of Zambia have significant Muslim communities. Geographic
Dhows to Planes – Draft – Please do not Cite Page 15
and cultural ties therefore may play an important role in the trade between the regions. The ties may
be historic as is the case with many North African and East African countries or may be also based on
participation in common organization such as the organization of Islamic states in the case of Nigeria
(the only west African country with signiicant trade ties).
Figure 10: Major African Exporters and Importers to and from the Gulf
For two of Africa's larger economies namely South Africa and Egypt the trade is extremely important.
In the case of South Africa it accounts for 30 per cent of all exports and 25 per cent of imports from the
region. In the case of Egypt it accounts for 34 per cents of exports to the Gulf region while it imports 19
percent of all imports from the region. The other top eleven countries in Africa export between 2 to 6
per cent of total exports to the Gulf and 2 to 10 per cent of the imports. On average most of these
countries have significant trade imbalances with the Gulf countries (see figure 11). Most of the
countries have negative trade balances running from US$ 56 million for Tunisia to US$2.2 billion for
South Africa. In fact of the top trading partners in Africa in 2005, only Zambia had a positive trade
balance vis‐à‐vis the Gulf. In fact only, three African countries in our sample have positive trade
balances, and the other two had relatively small balances of under US 16 million dollars.
Dhows to Planes – Draft – Please do not Cite Page 16
Figure 11: Gulf Trade Balances with leading Trade Partners in Africa.
In this section we establish that while trade is not large at the regional level it is important for specific
African countries. This importance seems to be dominated by geographical (cost) and cultural ties.
Compared to the ancient trade with Africa‐missing is the entire west African region, which played an
extremely important role in the trade of the middle ages. In the next section we will examine the
sophistication of trade in order to explore the likely impact of Africa‐Gulf trade on industrialization in
both regions.
Dhows to Planes – Draft – Please do not Cite Page 17
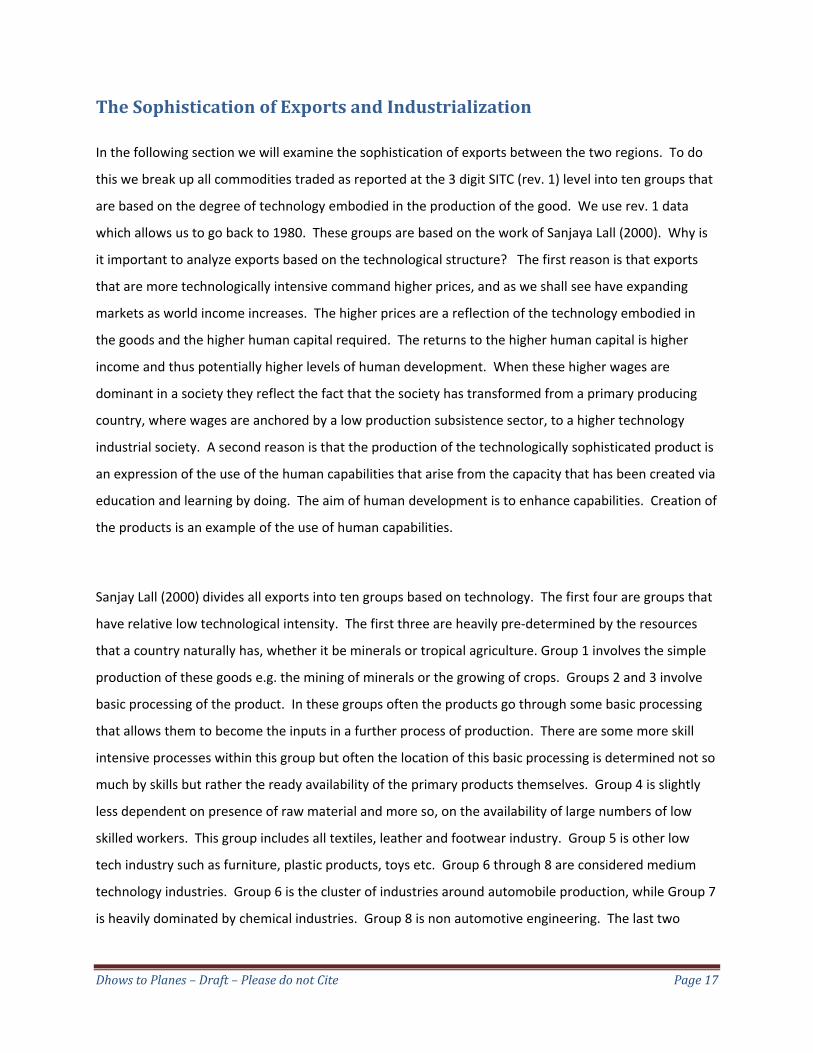
The Sophistication of Exports and Industrialization
In the following section we will examine the sophistication of exports between the two regions. To do
this we break up all commodities traded as reported at the 3 digit SITC (rev. 1) level into ten groups that
are based on the degree of technology embodied in the production of the good. We use rev. 1 data
which allows us to go back to 1980. These groups are based on the work of Sanjaya Lall (2000). Why is
it important to analyze exports based on the technological structure? The first reason is that exports
that are more technologically intensive command higher prices, and as we shall see have expanding
markets as world income increases. The higher prices are a reflection of the technology embodied in
the goods and the higher human capital required. The returns to the higher human capital is higher
income and thus potentially higher levels of human development. When these higher wages are
dominant in a society they reflect the fact that the society has transformed from a primary producing
country, where wages are anchored by a low production subsistence sector, to a higher technology
industrial society. A second reason is that the production of the technologically sophisticated product is
an expression of the use of the human capabilities that arise from the capacity that has been created via
education and learning by doing. The aim of human development is to enhance capabilities. Creation of
the products is an example of the use of human capabilities.
Sanjay Lall (2000) divides all exports into ten groups based on technology. The first four are groups that
have relative low technological intensity. The first three are heavily pre‐determined by the resources
that a country naturally has, whether it be minerals or tropical agriculture. Group 1 involves the simple
production of these goods e.g. the mining of minerals or the growing of crops. Groups 2 and 3 involve
basic processing of the product. In these groups often the products go through some basic processing
that allows them to become the inputs in a further process of production. There are some more skill
intensive processes within this group but often the location of this basic processing is determined not so
much by skills but rather the ready availability of the primary products themselves. Group 4 is slightly
less dependent on presence of raw material and more so, on the availability of large numbers of low
skilled workers. This group includes all textiles, leather and footwear industry. Group 5 is other low
tech industry such as furniture, plastic products, toys etc. Group 6 through 8 are considered medium
technology industries. Group 6 is the cluster of industries around automobile production, while Group 7
is heavily dominated by chemical industries. Group 8 is non automotive engineering. The last two
Dhows to Planes – Draft – Please do not Cite Page 18
groups are the high technology sector. Group 9 is electrical and electronic appliances, while Group 10 is
dominated by pharmaceuticals and the aerospace industry.
Figure 12: LallWeissZhang Index for Groupings of Products based on Technical Sophistication (2005)
To give a feeling of how these groups compare we have also calculated the Sophistication index
designed by Lall Weiss and Zhang (2006)4. This is a simple index that represents the average income of
the producing countries of each of the goods normalized to run between 0 and 1. The goods at the
three level SITC code that is on average produced by mostly the poorest countries gets a ranking closer
to zero, while those that are produced by the richest countries gets a ranking closer to one. As one
would expect the first five groups on average have a lower index than the last five. Group 2 and 3
4 See full description in the appendix.
Group Name/Description Lall Weiss Zhang (LWZ)
Sophistication Index
Average Per Capita Income of Countries exporting Products within group (US$)
1 Primary Products 0.47 22576
2 Resource Based Manufacture Agriculture 0.52 24543
3 Resource Based Manufacture Other (mainly minerals)
0.55 25767
4 Textiles Garments and Footwear 0.35 18679
5 Other Low Tech 0.52 24597
6 Medium Tech Automotive 0.63 28255
7 Medium Tech Process Industries (such as synthetic fibers, plastics, paints etc).
0.55 25697
8 Medium Tech engineering industries (such as engines, industrial machinery etc.)
0.67 29911
9 High Technology Manufactures (Electronics and Electrical Products)
0.51 24248
10 Other High Technology (Pharmaceuticals, aerospace, optical measuring instruments)
0.78 33776
Dhows to Planes – Draft – Please do not Cite Page 19
because they are location plus technology based tend to be associated with slightly higher incomes than
group 1 and 4. This is because the occurrence of natural resources is not determined by technology but
rather geography. Rich countries that have them will continue mining them as well as processing them.
We should note that Group 9 because of the continual breakdown in electronic production which allows
for more labor intensive, less skills intensive production of components has a lower index than one
might expect. Along with the index we present the associated average income of the countries that
export within this group. Because international trade is dominated by richer countries the averages are
all rather high although those from Group 1 to 5 which run from US$ 18679 to US$ 25767 are on
average lower than those from Group which range from US$ 24248 to US$33776. Countries that
specialize in production in the sectors with lowest income tend to produce items that on average are
more labor intensive and less skills intensive and thus command lower prices per labor hour on the
international market. The process of development/industrialization is essentially one of moving from
producing and exporting labor intensive commodities (Groups 1‐5) to producing and exporting skills
intensive goods (group 6‐10).
To illustrate the relationship between the ten groups and income a little more clearly we present below
two charts that capture the relationship. We have divided countries into the standard income groupings
used by the World Bank, namely Low income, Lower Middle income, Upper Middle income and High
Income countries. For each commodity group we have classified a country as an exporter only if its
exports are at least 5% of its total trade. We do this in order to capture meaningful exports. If we did
not use such a criteria then most countries produce and export at least minute quantities within each
category and the relationship would not be so easily presented with a simple chart as below.
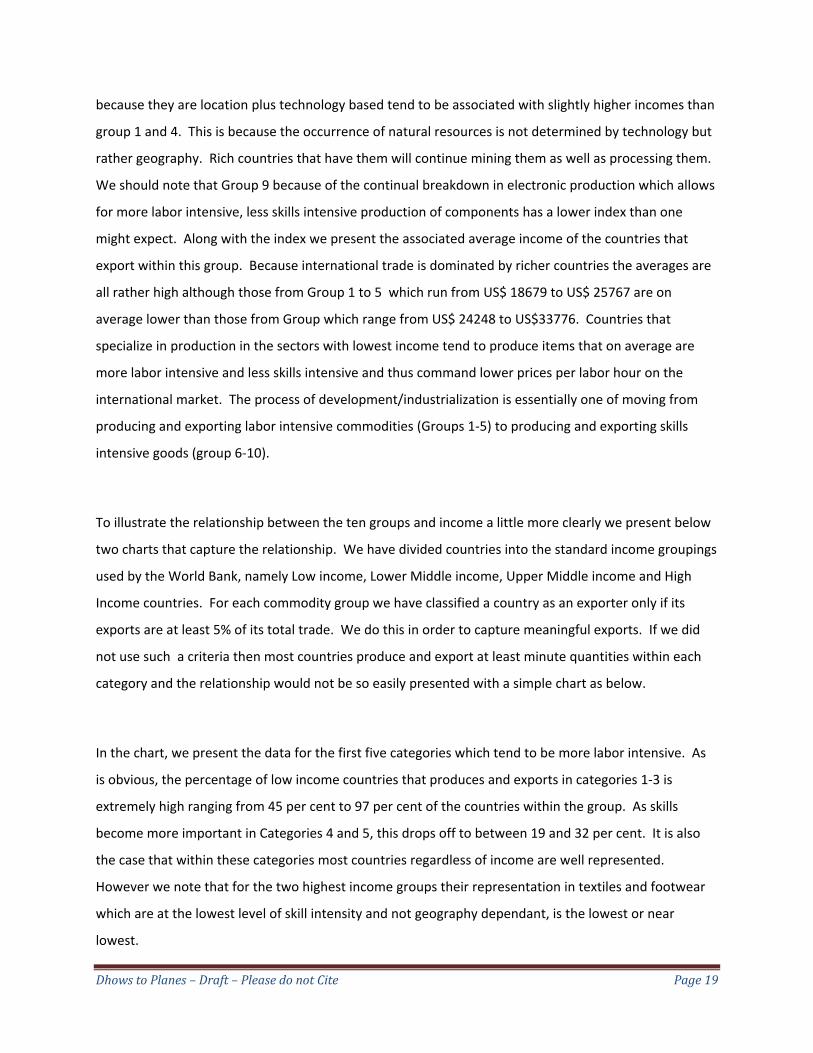
In the chart, we present the data for the first five categories which tend to be more labor intensive. As
is obvious, the percentage of low income countries that produces and exports in categories 1‐3 is
extremely high ranging from 45 per cent to 97 per cent of the countries within the group. As skills
become more important in Categories 4 and 5, this drops off to between 19 and 32 per cent. It is also
the case that within these categories most countries regardless of income are well represented.
However we note that for the two highest income groups their representation in textiles and footwear
which are at the lowest level of skill intensity and not geography dependant, is the lowest or near
lowest.
Dhows to Planes – Draft – Please do not Cite Page 20
Figure 13: Percent of Countries within Income Group by Export Sophistication Level (2005) for Low Technology Exports5
1='Primary Products' 2='Resource Based Manufacture Agriculture' 3='Resource Based Manufacture Other'4= 'Textile Garments & Footwear' 5='Other Low Tech.
In Figure 14, we present the distribution across the five more technology intensive groups. For poor
countries, the trend of lower representation on average continues with countries participating in these
industries being only between 6 to 19 percent of the group. The two highest income groups are well
represented in all the groups with the exception of the last category where only the richest countries are
well represented.
5 Comtrade Data and World Development Indicators (2008)
1 2 3 4 5
97
45
71
32
19
83
6274
5243
6656 59
31
5663
53
75
18
75
Low Income Countries
Low Middle Income Countries
Upper Middle Income Countries
Upper Income Countries
Dhows to Planes – Draft – Please do not Cite Page 21
Figure 14: Percent of Countries within Income Group by Export Sophistication Level (2005) for High Technology Exports6
In this section we will examine whether African exports to the Gulf are more sophisticated than all
African exports and whether Gulf exports to Africa are more sophisticated than Gulf exports to the
world as a whole. We do this using the ten Lall groups. The aim of this is to examine whether trade
between the regions has the potential to be transformative in the same manner that the earlier trade
between the regions had been.
In figure 15 we present our findings for Gulf exports to Africa, for the years 1980 and 2005. There are
three striking results that we should take account of. The first is that in this period there was a drastic
change in the type of exports from the Gulf to African countries. In 1980 these exports were
overwhelmingly dominated by unprocessed primary products mainly crude oil. By 2005 this had been
6 Comtrade Database and World Development Indicators (2008)
1 2 3 4 5
1019
10 6 910
52
26
147
41
5950 47
9
50
8175 75 72
Low Income Countries
Low Middle Income Countries
Upper Middle Income Countries
Upper Income Countries
Dhows to Planes – Draft – Please do not Cite Page 22
reduced from just under 84 per cent of all Gulf exports to Africa to under 38 per cent in the context of
growing trade between the regions. Further this occurred while Gulf trade with the world was still
dominated by unprocessed crude oil exports which were 72.4 per cent of all Gulf exports in 2005.
Figure 15: The Sophistication of Gulf Exports to Africa and the World
This means that while the overall export structure of the Gulf is still dominated by crude oil exports its
exports to Africa have significantly changed. This point is more clearly brought out by examination of
groups 2‐10 of Lall sophistication groups. We find that with the exception of the “other high tech
manufactures” two important things hold. The first is that there has been an increase in
all these groups between 1980 and 2005, with the greatest gains being in the exports of higher value oil
based manufactures. For example basic resource based manufactures rose from being 4 per cent of
total Gulf exports to being 20.6 per cent of all exports to Africa. More impressively medium technology
process industries such as plastics and synthetic fibers rose from being a mere 1.1 per cent of exports to
Africa to 12. 2 per cent of exports to Africa, The other important finding along these lines Is that in all
these cases the proportion of exports to Africa in these groups above group one are higher than the
Dhows to Planes – Draft – Please do not Cite Page 23
exports of these products world as a whole. This means that Gulf firms are more competitive in Africa
across a range of more technology sophisticated exports than they are in the world as a whole.
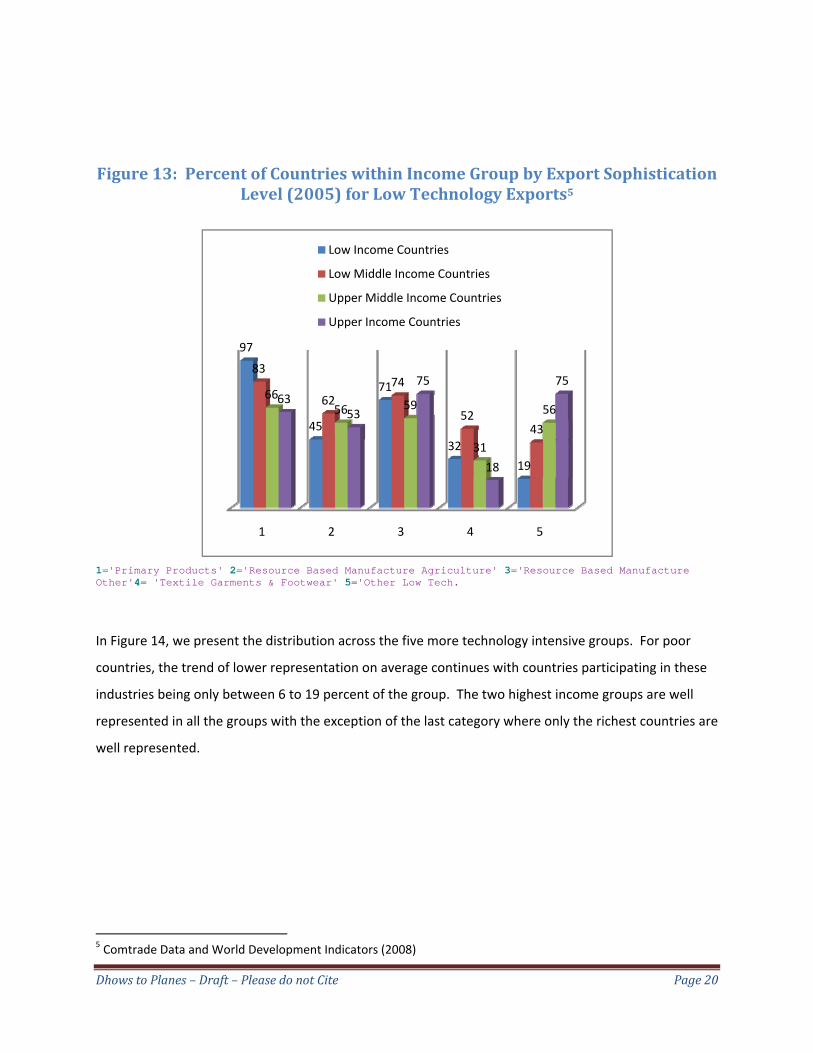
Figure 16: The Sophistication of African Exports to the Gulf and the World
In figure 16 we examine the same issues from the perspective African exports to the Gulf. Because the
South African economy is considerably more industrialized than all other African economies we present
these figures both with South Africa included in 2005 and without it. Across the board we find very
similar results to those that hold for Gulf exports to Africa. First and foremost primary product exports
have fallen from 82.4 per cent in 1980 to. 39.2 per cent in 2005. The numbers are more Impressive in
fact without South Africa as they fall to 2.5 per cent of exports. Both these numbers are significantly
below the 48.7 per cent which represent the proportion of African primary product exports to the rest
of the world. Even without examining the other African exports to the Gulf the trend is clear. African
exports to the Gulf are more technologically sophisticated than exports to the rest of the world.
Dhows to Planes – Draft – Please do not Cite Page 24
Examining groups 2 through 10 reinforces this point. With the exception of non agricultural resource
based manufacture, African countries export higher levels of sophisticated products to the Gulf
countries than they do to the world. In all instances even when South Africa is removed this is the case.
Particular striking cases in this instance are group 6 ‐medium tech automotive ‐ which becomes 26 per
cent of African exports in the absence of South African from 1.7 per cent and compared to the 3.8 per
cent of exports to the world. The other case is that of high tech manufactures, which is only 1.1 per
cent of exports with South Africa, and 13.1 per cent of exports without South Africa compared to 1.3 per
cent to the world on average.
Our basic finding from this examination of exports is simple but powerful both the Gulf region and
Africa trade in more technologically sophisticated products with each other than they do with the world
as a whole. This potentially has significant implications for industrialization and development strategies
in both regions.
Summary of Findings and Policy Implications
Our study of trade between the Gulf and African countries points to four main findings:
1. While trade between the regions is small as a per cent of their total trade it is growing rapidly.
2. The balance of trade heavily favors the Gulf countries.
3. The trade is dominated by countries with Geographic and cultural ties.
4. Over the last twenty years trade has changed over time from being dominated by primary products to more technologically sophisticated products.
There are two main contexts which we should consider our findings. The first is the context of export
led development strategies that many African countries are taking up, while the second is in the context
of recurrent cyclical crises that the world faces.
The fact that on average, inter‐regional exports are more sophisticated compared to exports to the
world, suggests that firms in the region are competitive. This may be due to proximity thus lowering
total costs of transportation, cultural and religious ties, or other forms of privileged market access. This
Dhows to Planes – Draft – Please do not Cite Page 25
success gives firms an opportunity to practice before taking on the broader world market. An
examination of why specifically firms are competitive in the region should be undertaken at country
level with the aim of exploring whether the competitive advantages can be replicated in other regions of
the world. For African firms this is particularly important as the Gulf markets with their high incomes
are sought by firms from across the world. Understanding how firms have been successful there could
be very instructive for participation in other competitive markets.
The second context in which we should consider our results is that of the current world cyclical
downturn and more importantly in the context of repeated cyclic events that affect the global l market
economy, In this respect the Increased trade and sophistication of exports to each other is good because
it is diversification at two levels. The first is that in increasing their trade to each other countries in both
regions are diversifying to whom they export, Rather than simply exporting to the farmer colonial
powers or primarily OECD countries as has been the case in the past. This diversification is important in
the event of a global down turn because of the differential impact of down turns on various parts of the
world. Thus diversification can be important in reducing the magnitude of losses during a slowdown of
the world economy. The second level of diversification is that of products, Particularly for African
countries the dependence on primary products has been fraught with negative consequences due to the
high volatility of prices and cyclical long term down turn in prices. Diversification to other products will
lower volatility in prices and a relative upward trend in prices of the more sophisticated products may
cushion the impact of the downturn to which African countries have traditionally been subject.
Beyond the two contexts there are two other policy related issues that arise from consideration of our
findings. The first is the need to explore the broader relationships between Gulf countries and African
countries in terms of migration, human capital, remittances and investments and the relationship to
trade. The second is the need for Individual African countries in the context of this growing trade with
potential large positive externalities for industrialization, to establish coherent trade strategies vis‐à‐vis
Gulf countries and for that matter other emerging trade partners.
Dhows to Planes – Draft – Please do not Cite Page 26
Appendix 1 The LalWeissZhang Index
The Lal‐Weiss‐Zhang (2006) is calculated as follows:
SI (i)=100*(US(i)‐US(min))/(US(max)‐US(min)
Where SI is the index and US(i) is the average per capita income of all countries producing the good. US(max) is the average income for the most sophisticated product and US(min) is the average income for least sophisticated. Both these are averages of incomes of countries producing the good.
Dhows to Planes – Draft – Please do not Cite Page 27
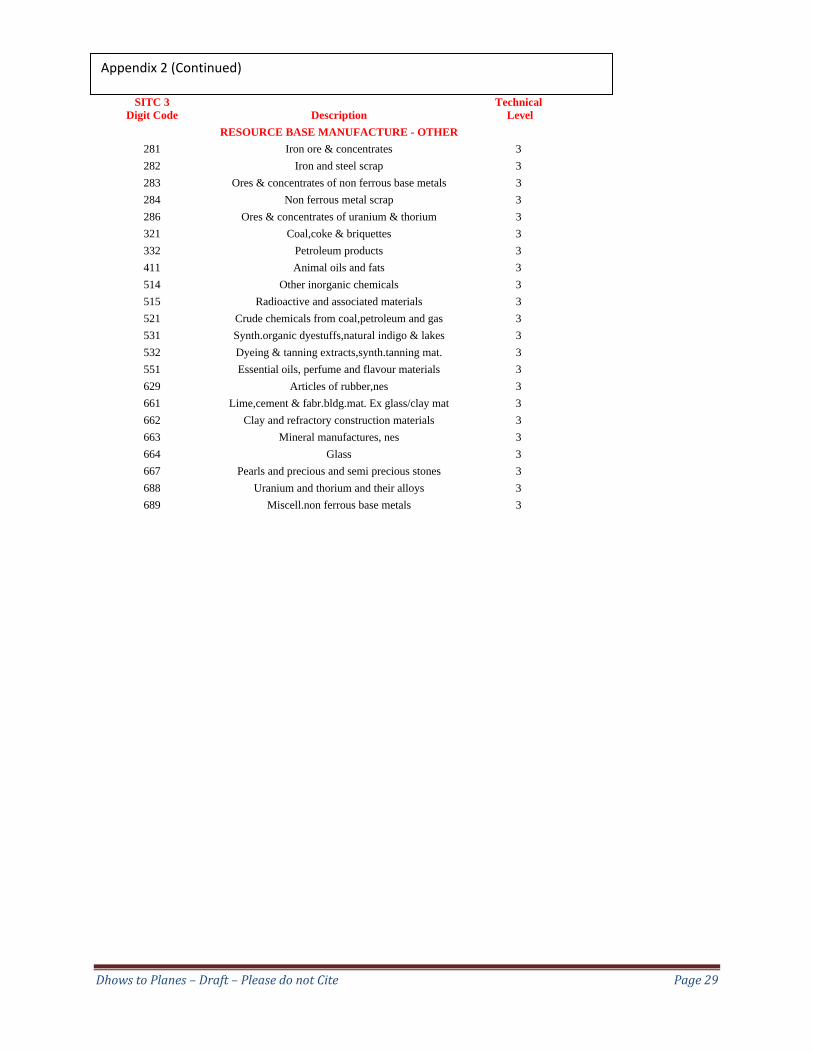
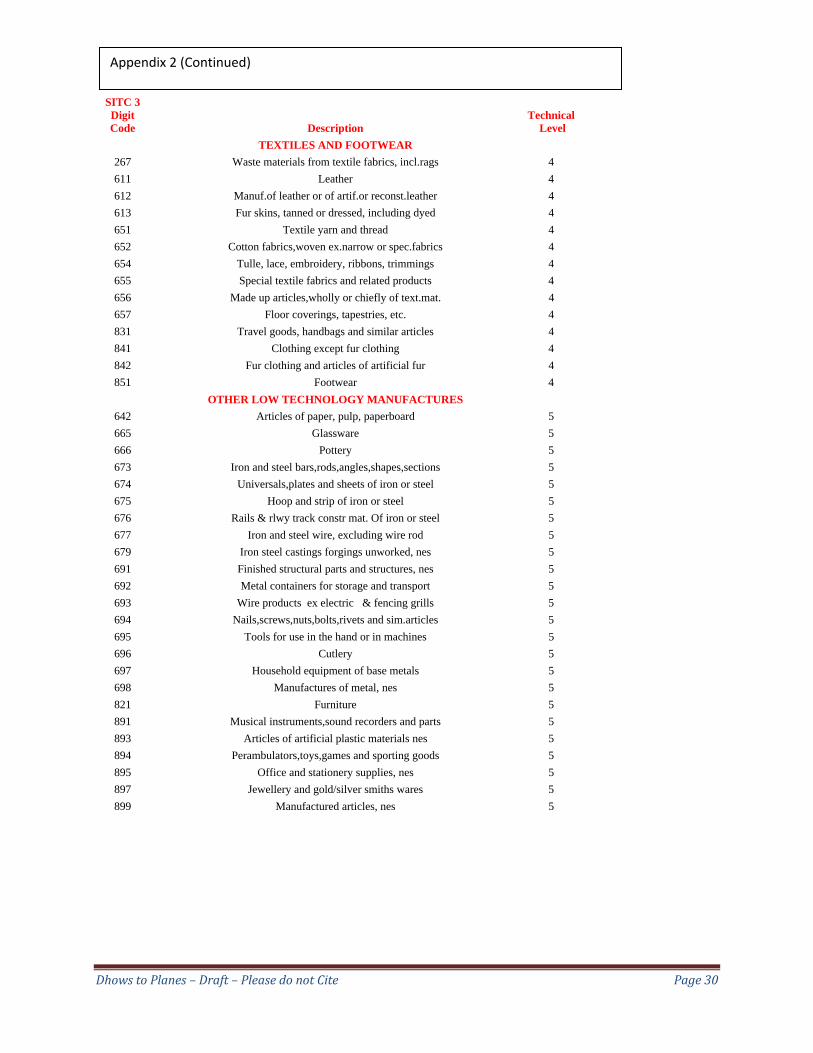
Appendix 2. Technological Groupings ( Based on Lall 2000)
SITC 3 Digit Code PRIMARY PRODUCTS Technical Level 001 Live animals 1 011 Meat, fresh, chilled or frozen 1 013 Meat in airtight containers nes & meat preptns 1 022 Milk and cream 1 025 Eggs 1 031 Fish,fresh & simply preserved 1 032 Fish,in airtight containers,nes & fish preptns. 1 041 Wheat including spelt and meslin, unmilled 1 042 Rice 1 043 Barley, unmilled 1 044 Maize corn unmilled 1 045 Cereals,unmilled excl.wheat,rice,barley & maize 1 051 Fruit, fresh, and nuts excl. Oil nuts 1 052 Dried fruit including artificially dehydrated 1 054 Vegetables, roots & tubers, fresh or dried 1 071 Coffee 1 072 Cocoa 1 074 Tea and mate 1 075 Spices 1 081 Feed. Stuff for animals excl.unmilled cereals 1 091 Margarine & shortening 1 121 Tobacco, unmanufactured 1 211 Hides & skins, exc.fur skins undressed 1 212 Fur skins, undressed 1 221 Oil seeds, oil nuts and oil kernels 1 241 Fuel wood & charcoal 1 244 Cork, raw and waste 1 261 Silk 1 262 Wool and other animal hair 1 263 Cotton 1 271 Fertilizers, crude 1 273 Stone, sand and gravel 1 274 Sulphur & unroasted iron pyrites 1 275 Natural abrasives incl.industrial diamonds 1 276 Other crude minerals 1 285 Silver & platinum ores 1 291 Crude animal materials,nes 1 292 Crude vegetable materials,nes 1 331 Petroleum, crude and partly refined 1 341 Gas,natural and manufactured 1 681 Silver and platinum group metals 1 682 Copper 1 683 Nickel 1 684 Aluminium 1 685 Lead 1 686 Zinc 1
Dhows to Planes – Draft – Please do not Cite Page 28
687 Tin 1
SITC 3 Digit Code Description
Technical Level
RESOURCE BASE MANUFACTURE - AGRICULTURE
012 Meat, dried, salted or smoked 2 023 Butter 2 024 Cheese and curd 2 046 Meal and flour of wheat or of meslin 2 047 Meal & flour of cereals,except wheat/meslin 2 048 Cereal preps & preps of flour of fruits & vegs 2 053 Fruit,preserved and fruit preparations 2 055 Vegetables, roots & tubers pres or prepared nes 2 061 Sugar and honey 2 062 Sugar confy, sugar preps. Ex chocolate confy 2 073 Chocolate & other food preptns cont. Cocoa, nes 2 099 Food preparations,nes 2 111 Non alcoholic beverages,nes 2 112 Alcoholic beverages 2 122 Tobacco manufactures 2 231 Crude rubber incl.synthetic & reclaimed 2 242 Wood in the rough or roughly squared 2 243 Wood,shaped or simply worked 2 251 Pulp & waste paper 2 264 Jute 2 265 Vegetable fibres,except cotton and jute 2 421 Fixed vegetable oils, soft 2 422 Other fixed vegetable oils 2 431 Anim./veg. Oils & fats,processed,and waxes 2 621 Materials of rubber 2 631 Veneers,plywood boards & other wood,worked,nes 2 632 Wood manufactures,nes 2 633 Cork manufactures 2 641 Paper and paperboard 2
Appendix 2 (Continued)
Dhows to Planes – Draft – Please do not Cite Page 29
SITC 3 Digit Code Description
Technical Level
RESOURCE BASE MANUFACTURE - OTHER 281 Iron ore & concentrates 3 282 Iron and steel scrap 3 283 Ores & concentrates of non ferrous base metals 3 284 Non ferrous metal scrap 3 286 Ores & concentrates of uranium & thorium 3 321 Coal,coke & briquettes 3 332 Petroleum products 3 411 Animal oils and fats 3 514 Other inorganic chemicals 3 515 Radioactive and associated materials 3 521 Crude chemicals from coal,petroleum and gas 3 531 Synth.organic dyestuffs,natural indigo & lakes 3 532 Dyeing & tanning extracts,synth.tanning mat. 3 551 Essential oils, perfume and flavour materials 3 629 Articles of rubber,nes 3 661 Lime,cement & fabr.bldg.mat. Ex glass/clay mat 3 662 Clay and refractory construction materials 3 663 Mineral manufactures, nes 3 664 Glass 3 667 Pearls and precious and semi precious stones 3 688 Uranium and thorium and their alloys 3 689 Miscell.non ferrous base metals 3
Appendix 2 (Continued)
Dhows to Planes – Draft – Please do not Cite Page 30
SITC 3 Digit Code Description
Technical Level
TEXTILES AND FOOTWEAR 267 Waste materials from textile fabrics, incl.rags 4 611 Leather 4 612 Manuf.of leather or of artif.or reconst.leather 4 613 Fur skins, tanned or dressed, including dyed 4 651 Textile yarn and thread 4 652 Cotton fabrics,woven ex.narrow or spec.fabrics 4 654 Tulle, lace, embroidery, ribbons, trimmings 4 655 Special textile fabrics and related products 4 656 Made up articles,wholly or chiefly of text.mat. 4 657 Floor coverings, tapestries, etc. 4 831 Travel goods, handbags and similar articles 4 841 Clothing except fur clothing 4 842 Fur clothing and articles of artificial fur 4 851 Footwear 4
OTHER LOW TECHNOLOGY MANUFACTURES 642 Articles of paper, pulp, paperboard 5 665 Glassware 5 666 Pottery 5 673 Iron and steel bars,rods,angles,shapes,sections 5 674 Universals,plates and sheets of iron or steel 5 675 Hoop and strip of iron or steel 5 676 Rails & rlwy track constr mat. Of iron or steel 5 677 Iron and steel wire, excluding wire rod 5 679 Iron steel castings forgings unworked, nes 5 691 Finished structural parts and structures, nes 5 692 Metal containers for storage and transport 5 693 Wire products ex electric & fencing grills 5 694 Nails,screws,nuts,bolts,rivets and sim.articles 5 695 Tools for use in the hand or in machines 5 696 Cutlery 5 697 Household equipment of base metals 5 698 Manufactures of metal, nes 5 821 Furniture 5 891 Musical instruments,sound recorders and parts 5 893 Articles of artificial plastic materials nes 5 894 Perambulators,toys,games and sporting goods 5 895 Office and stationery supplies, nes 5 897 Jewellery and gold/silver smiths wares 5 899 Manufactured articles, nes 5
Appendix 2 (Continued)
Dhows to Planes – Draft – Please do not Cite Page 31
SITC 3 Digit Code Description
Technical Level
MEDIUM TECHNOLOGY - AUTOMOBILES 732 Road motor vehicles 6 733 Road vehicles other than motor vehicles 6
MEDIUM TECHNOLOGY - PROCESS 266 Synthetic and regenerated artificial fibres 7 512 Organic chemicals 7 513 Inorg.chemicals elems.,oxides,halogen salts 7 533 Pigments, paints, varnishes & related materials 7 553 Perfumery, cosmetics, dentifrices, etc. 7 554 Soaps,cleansing & polishing preparations 7 561 Fertilizers manufactured 7 571 Explosives and pyrotechnic products 7 581 Plastic materials,regenerd.cellulose & resins 7 599 Chemical materials and products,nes 7 653 Text fabrics woven ex narrow, spec, not cotton 7 671 Pig iron, spiegeleisen, sponge iron etc 7 672 Ingots & other primary forms of iron or steel 7 678 Tubes,pipes and fittings of iron or steel 7 731 Railway vehicles 7 862 Photographic and cinematographic supplies 7
MEDIUM TECHNOLOGY - ENGINEERING 711 Power generating machinery, other than electric 8 712 Agricultural machinery and implements 8 715 Metalworking machinery 8 717 Textile and leather machinery 8 719 Machinery and appliances non electrical parts 8 723 Equipment for distributing electricity 8 725 Domestic electrical equipment 8 726 Elec.apparatus for medic.purp.,radiological ap. 8 735 Ships and boats 8 812 Sanitary,plumbing,heating & lighting fixtures 8 864 Watches and clocks 8 951 Firearms of war and ammunition therefor 8
HIGH TECHNOLOGY ELECTRIC 714 Office machines 9 722 Electric power machinery and switchgear 9 724 Telecommunications apparatus 9 729 Other electrical machinery and apparatus 9
HIGH TECHNOLOGYOTHER 541 Medicinal & pharmaceutical products 10 718 Machines for special industries 10 734 Aircraft 10 861 Scientific,medical,optical,meas./contr.instrum. 10
Appendix 2 (Continued)
Dhows to Planes – Draft – Please do not Cite Page 32
SITC 3 Digit Code Description
Technical Level
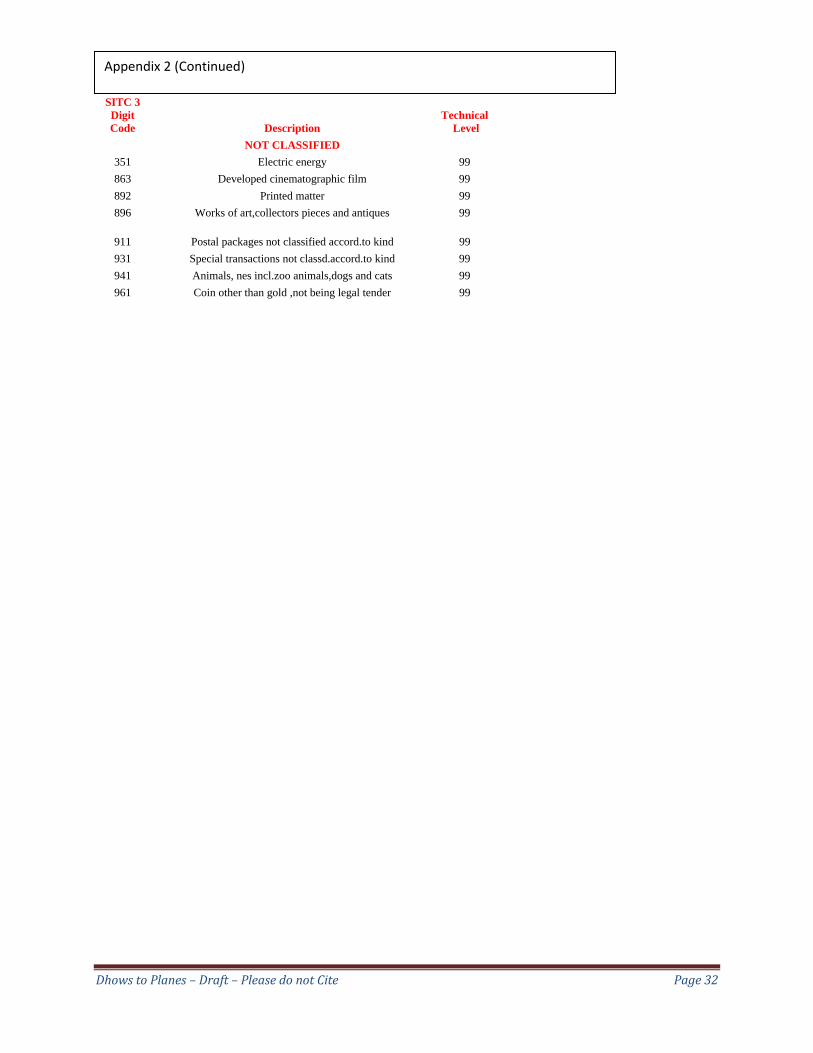
NOT CLASSIFIED 351 Electric energy 99 863 Developed cinematographic film 99 892 Printed matter 99 896 Works of art,collectors pieces and antiques 99
911 Postal packages not classified accord.to kind 99 931 Special transactions not classd.accord.to kind 99 941 Animals, nes incl.zoo animals,dogs and cats 99 961 Coin other than gold ,not being legal tender 99
Appendix 2 (Continued)
Dhows to Planes – Draft – Please do not Cite Page 33
References
Anon, 1989, Periplus Maris Erythraei. In: Lionel Casson (Ed.). Princeton University Press, Princeton. Davidson, Basil, 1991, Africa in History. Simon and Schuster, New York. Gĩthĩnji, Mwangi, 2009 Is that a Dragon or Elephant on your Ladder: The Potential Impact of China and
India on Export Led Growth in African Countries? In: Diery Seck, Sylvain Boko (Ed.), Sector Led Growth in Africa and Implications for Development. African World Press, New Jersey.
IBRD, 2007, World Development Indicators. World Bank. Insoll, Timothy A, 2000. Trade and Empire. Archaeology, 53(6). Lall, Sanjaya, 2000. The Technological Structure and Performance of Developing Country Manufactured
Exports, 1985‐1998. Oxford Development Studies, 28(3), 337‐369. Lall, Sanjaya, Weiss, John and Zhang, Jinkang, 2006. The 'Sophistication' of Exports: A New Trade
Measure. World Development, 34(2), 222‐237. UNCTAD, 2007, COMTRADE. UNCTAD.