13
DI ANALYTICS CUSTOMER SLIDES May 2015
| Date post: | 06-Aug-2015 |
| Category: |
Technology |
| Upload: | drillinginfo |
| View: | 277 times |
| Download: | 0 times |

DI ANALYTICS CUSTOMER SLIDES
May 2015

PRODUCT LINE OVERVIEW: DI ANALYTICS
DI Analytics delivers refined, analytics-ready datasets that provide insights on:– WHAT has happened over time with leasing, permitting and production– WHO has been active in an area and WHO has acreage in the best parts of a play– WHICH operators are performing better than others– WHY does one operator perform better/worse than another operator
DI Analytics is focused on unconventional and hybrid plays– Bakken, Barnett, Eaglebine, Eagleford, Fayetteville, Haynesville, Granite Wash,
Marcellus, Mississippian Lime, Niobrara, Permian, Tuscaloosa Marine, and Woodford
With refined data and custom charts/graphs, DI Analytics allows users to visualize the data, enabling customers to see trends and anomalies and gain insights to base decisions on.
COREGraded Acreage
Production Scenario
DI Analytics Product Line
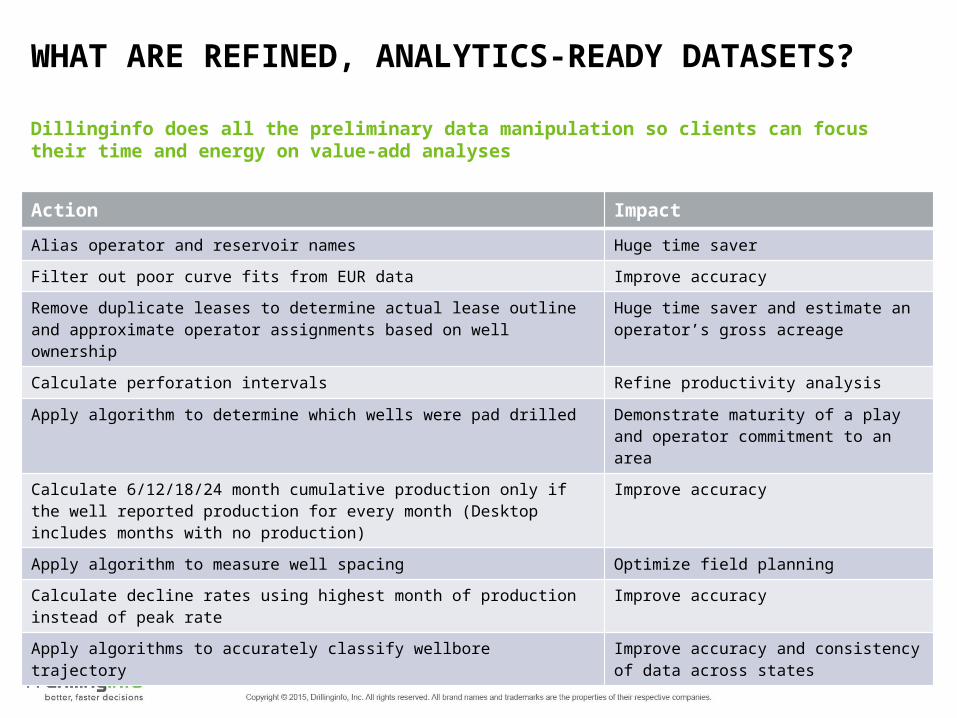
WHAT ARE REFINED, ANALYTICS-READY DATASETS?
Action Impact
Alias operator and reservoir names Huge time saver
Filter out poor curve fits from EUR data Improve accuracy
Remove duplicate leases to determine actual lease outline and approximate operator assignments based on well ownership
Huge time saver and estimate an operator’s gross acreage
Calculate perforation intervals Refine productivity analysis
Apply algorithm to determine which wells were pad drilled Demonstrate maturity of a play and operator commitment to an area
Calculate 6/12/18/24 month cumulative production only if the well reported production for every month (Desktop includes months with no production)
Improve accuracy
Apply algorithm to measure well spacing Optimize field planning
Calculate decline rates using highest month of production instead of peak rate Improve accuracy
Apply algorithms to accurately classify wellbore trajectory Improve accuracy and consistency of data across states
Dillinginfo does all the preliminary data manipulation so clients can focus their time and energy on value-add analyses
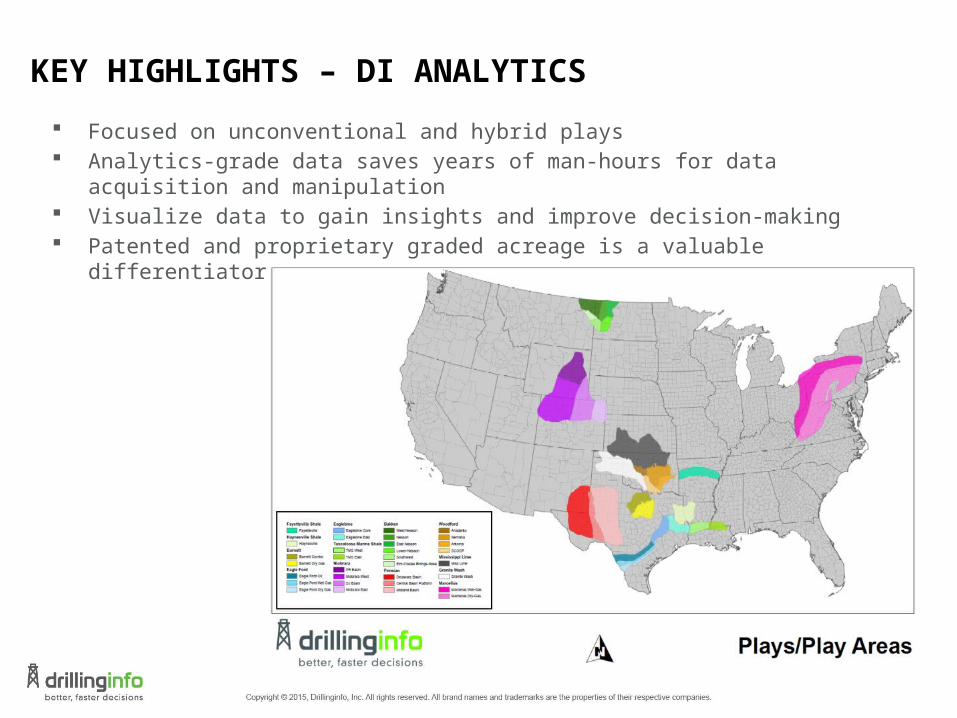
KEY HIGHLIGHTS – DI ANALYTICS
Focused on unconventional and hybrid plays Analytics-grade data saves years of man-hours for data acquisition and manipulation Visualize data to gain insights and improve decision-making Patented and proprietary graded acreage is a valuable differentiator

OVERVIEW: DI ANALYTICS CORE
Leasing: analyze lease polygons by grantee, track active versus expiring acreage, see leasing activity over time, estimate an operator’s gross acreage after assignments based on well ownership
Production/Productivity: analyze top operators in an area, compare type curves by operator/API/county/play/vintage, compare EURs, identify outliers, and create various plots to assess the impact of drilling, completion and stimulation technologies on production. Utilize algorithms that calculate well spacing and pad drilling.
Permits: view permit activity by operator, view trends over time by county/operator/play, and see statistics
DI Analytics Core subscription is required to access Production Scenario and Graded Acreage
CORE

OVERVIEW: DI ANALYTICS GRADED ACREAGE
What is Graded Acreage? Isolates the impact of reservoir quality on production, independent of how the well is
drilled/completed Grade by oil, gas and BOE (BTU and economic basis) Currently available in Bakken, Barnett and Eagleford. More coming. Grades sub-surface quality from A to J (10 grades) Currently, DI Graded Acreage available in Bakken, Barnett
and Eagleford with more coming
Why it is important? Graded acreage normalizes the geoglogy, to make an apples to apples comparison. Without it, you
cannot tell if an operator performed better than another unless you know they are drilling in the same quality reservoir.
How do you use it? Benchmark operator performance Evaluate reservoir quality associated with a lease Identify targets for acquisition/divestiture
Graded Acreage

OVERVIEW: DI ANALYTICS PRODUCTION SCENARIO
Production Scenario is a WORKFLOW that uses Drillinginfo data as an input
Build custom decline curves, computer production profiles and create single well cash flow models
Run sensitivity analyses of model results: – At what oil/gas price will my investment in the well break-even? – What happens to my profitability if I change my discount rate? – How much can I spend on drilling and completion and still make a 10% return? Or a 20% return?
Compare returns for one operator versus another, or one play versus another
Generate return on investment, net present value, internal rate of return, payback period
Quickly and accurately assess investment scenarios as a screening tool for acquisitions
Production Scenario

HOW DI ANALYTICS SOLVES CUSTOMER CHALLENGES
Leverage analytics-grade data to uncover hidden value drive in sub-optimized reservoirs.
• Unprecedented time savings and insights: Build type curves for top operators, by play, in minutes versus months. Identify outliers and anomalies: where is an operator making money in low grade acreage? Which operators are recompleting wells?
• Uncover best practices to improve operations and ROI: inflection points on a creaming curve can indicate where operators have changed completion techniques. Drill down and discover best/worst practices.
• Proactive investment by identify and quantifying: find deals before they are marketed, utilize graded acreage model for comparative analyses of operators and leases, and evaluate potential returns using well economics.

DI ANALYTICS OFFERS
Uncover Best Practices and Improve ROI
BEST PRACTICES: Compare operator strategies to identify best practices
PRODUCTIVITY: Create various plots to evaluate impact of completion techniques on production
LEASING: Quickly flag expiring and inactive acreage by grade
Proactive Investment
COMPARE OPERATORS: Benchmark performance to see best/worst-performing operators in an area
DE-RISK GEOLOGY: Patented and proprietary Acreage Grading rates acreage quality
FORECAST: creaming curves indicate when production has increased, decreased or plateaued for new wells. Predict if a company will make earnings estimates.
Save Time and Money
ANALYTICS-READY DATA: Aliasing, wellbore trajectories, pad drilling, EURs
ANOMALIES: Gain insights on changes in leasing, permitting and production over time
GRAPH: Chart vintage type curves, production by well, decline curves
EXPORT: Easily export to Excel, Aries, PHDWin and other applications
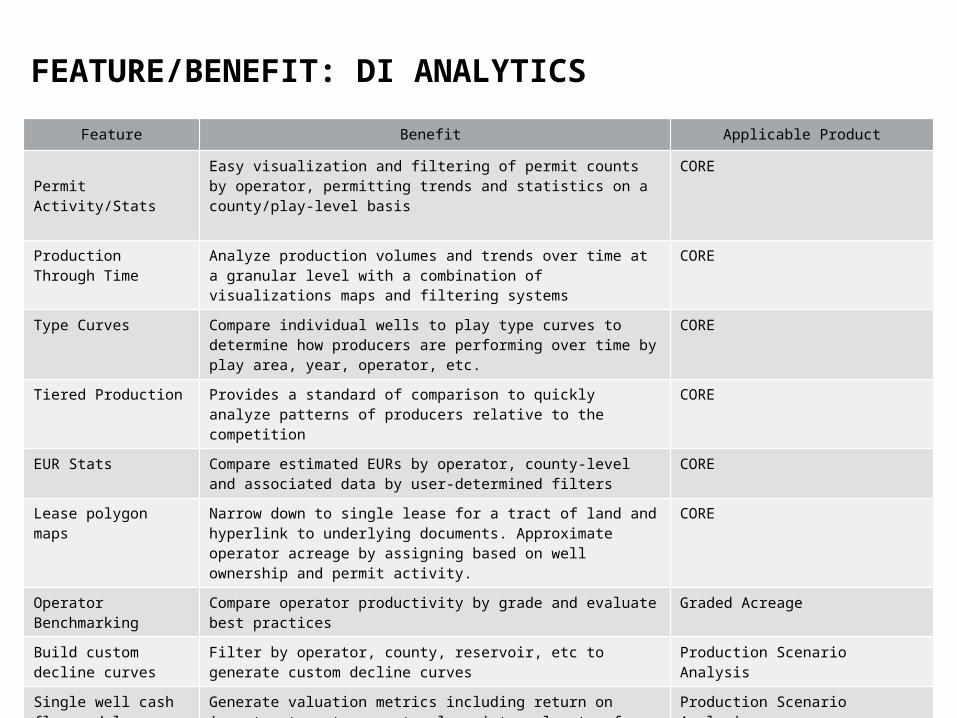
FEATURE/BENEFIT: DI ANALYTICS
Feature Benefit Applicable Product
Permit Activity/StatsEasy visualization and filtering of permit counts by operator, permitting trends and statistics on a county/play-level basis
CORE
Production Through Time
Analyze production volumes and trends over time at a granular level with a combination of visualizations maps and filtering systems
CORE
Type Curves Compare individual wells to play type curves to determine how producers are performing over time by play area, year, operator, etc.
CORE
Tiered Production Provides a standard of comparison to quickly analyze patterns of producers relative to the competition
CORE
EUR Stats Compare estimated EURs by operator, county-level and associated data by user-determined filters
CORE
Lease polygon maps Narrow down to single lease for a tract of land and hyperlink to underlying documents. Approximate operator acreage by assigning based on well ownership and permit activity.
CORE
Operator Benchmarking Compare operator productivity by grade and evaluate best practices Graded Acreage
Build custom decline curves
Filter by operator, county, reservoir, etc to generate custom decline curves
Production Scenario Analysis
Single well cash flow model
Generate valuation metrics including return on investment, net present value, internal rate of return, and payback period
Production Scenario Analysis
Export Data Tabs Provides an ability to export aliased, analytics ready information based on user-defined filters
All products

FEATURE/BENEFIT: DI ANALYTICS GRADED ACREAGE
1Available end of Q1’152Style guide is available from Drillinginfo
3only for ESRI Map Service
Feature Benefit
De-risk geology Use Acreage Grading to reduce risk of underlying geology in asset valuation
Operator comparisons
Determine which operators are most/least efficient producers, normalized for differences in underlying geology
Creaming curves See trend in an operator’s production efficiency and predict how their next well will perform
Various plots Analyze impact of various drilling and completion techniques on production
Select Eagleford Operators
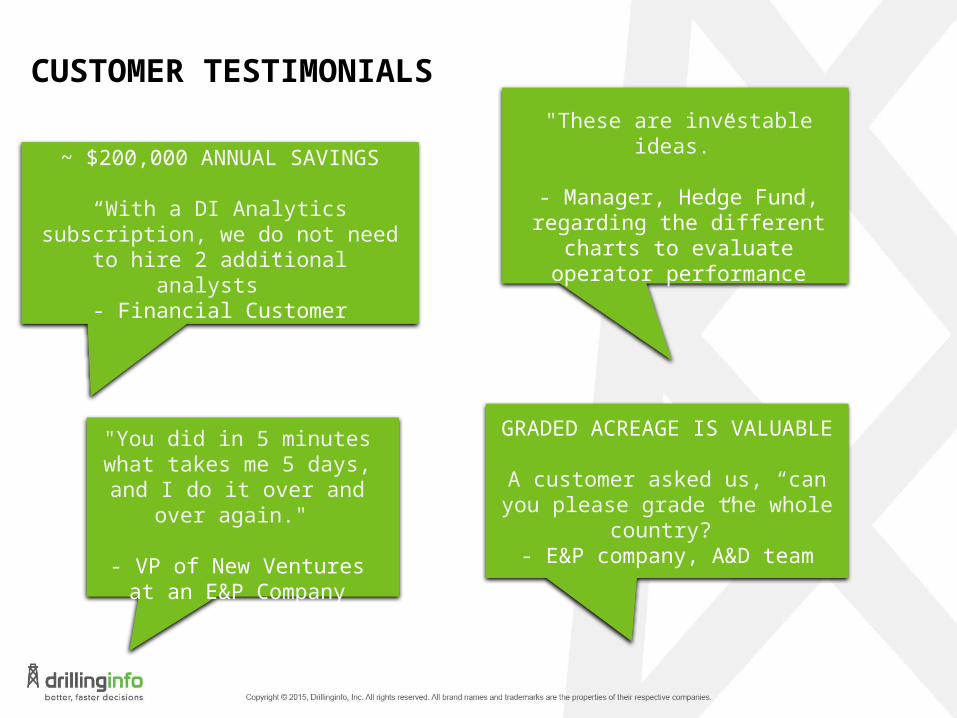
CUSTOMER TESTIMONIALS
~ $200,000 ANNUAL SAVINGS
“With a DI Analytics subscription, we do not need to hire 2 additional analysts”
- Financial Customer
GRADED ACREAGE IS VALUABLE
A customer asked us, “can you please grade the whole country?”
- E&P company, A&D team
"These are investable ideas.”
- Manager, Hedge Fund, regarding the different charts to evaluate operator performance
"You did in 5 minutes what takes me 5 days, and I do it
over and over again."
- VP of New Ventures at an E&P Company

THANK YOU


