INT. J. DIAB. DEV. COUNTRIES (1997), VOL. 17 5 Diabetes Care in India --- Patient’s Perceptions, Attitudes and Practices Anil Kapur*, Sanjeev Shishoo*, MMS Ahuja**, Vidya Sen***, Kalpana Mankame*** INTRODUCTION Diabetes is a major health care problem in India. There are an estimated 30 million persons with diabetes, majority living in urban areas. Over 98% are believed to have Type 2 diabetes. There are no reliable figures on how many are diagnosed and how many treated. Based on sales of anti- diabetic pharmaceuticals, we estimate that a meagre 10-12% receive modern pharmacological treatment. All involved with diabetes care agree that patients play a major role in the successful management of diabetes. To be able to provide comprehensive care including appropriate education and advice it is essential to understand perceptions, attitudes and practices amongst patients with diabetes. Such studies are rarely conducted, and if conducted rarely reported. Physician’s often decide on what is good for the patient based on their better knowledge of the disease and their assumptions are at best empirical. The treatment of diabetes, particular Type 2 requires constant review and change as the disease progresses. Initial treatment with diet and exercise, gives way to oral medications and further - to insulin, as has been known for long[1, 2, 3] and is now documented in UKPD study. Hesitation of patients to insulin therapy is well known and recognised but rarely researched and reported. Preliminary results from the UKPD study[4] indicate that 27% of the 676 patients assigned to insulin refused it initially, but does not examine the issue further. A recent study [5] examined NIDDM patients’ fears and hopes about insulin therapy and recommended that health care providers examine their patient’s perceptions, actively elicit and respond to patient needs to avoid unwitting promotion of negative attitudes toward diabetes management. In a separate paper we will report on physician’s perceptions, attitudes and practice (DIPPAP-2 study) [6] and how these can influence patient attitudes. In this study we report from a survey on 475 persons with diabetes living in urban India, their attitudes, perceptions and practices. RESEARCH DESIGN & METHODS We carried out the study amongst persons with diabetes from urban India with the objective of understanding their perceptions, attitudes and practices in relation to their disease and its management. The study design was an initial listing followed by a qualitative survey using a structured questionnaire. Eight hundred and twenty-four adults with diabetes, visiting randomly selected pharmacies to buy anti-diabetes medicines from four metros viz. Mumbai, Delhi, Calcutta and Chennai and four mini metros viz. Ahmedabad, Lucknow, Patna and Cochin were randomly selected for listing and questioned about their currently used anti-diabetic medicine. The cities selected are fairly representative of urban India. * Novo Nordisk India Ltd., Bangalore ** Sitaram Bhartiya Institute, New Delhi *** ORG MARG Ltd., Mumbai
Transcript
INT. J. DIAB. DEV. COUNTRIES (1997), VOL. 17 5
Diabetes Care in India --- Patient’s Perceptions, Attitudes and Practices Anil Kapur*, Sanjeev Shishoo*, MMS Ahuja**, Vidya Sen***, Kalpana Mankame*** INTRODUCTION Diabetes is a major health care problem in India. There are an estimated 30 million persons with diabetes, majority living in urban areas. Over 98% are believed to have Type 2 diabetes. There are no reliable figures on how many are diagnosed and how many treated. Based on sales of anti-diabetic pharmaceuticals, we estimate that a meagre 10-12% receive modern pharmacological treatment. All involved with diabetes care agree that patients play a major role in the successful management of diabetes. To be able to provide comprehensive care including appropriate education and advice it is essential to understand perceptions, attitudes and practices amongst patients with diabetes. Such studies are rarely conducted, and if conducted rarely reported. Physician’s often decide on what is good for the patient based on their better knowledge of the disease and their assumptions are at best empirical. The treatment of diabetes, particular Type 2 requires constant review and change as the disease progresses. Initial treatment with diet and exercise, gives way to oral medications and further - to insulin, as has been known for long[1, 2, 3] and is now documented in UKPD study. Hesitation of patients to insulin therapy is well known and recognised but rarely researched and reported. Preliminary results from the UKPD study[4] indicate that 27% of the 676 patients assigned to insulin refused it initially, but does not examine the issue further. A recent study [5] examined NIDDM patients’ fears and hopes about insulin therapy and recommended that health care providers examine their patient’s perceptions, actively elicit and respond to patient needs to avoid unwitting promotion of negative attitudes toward diabetes management. In a separate paper we will report on physician’s perceptions, attitudes and practice (DIPPAP-2 study) [6] and how these can influence patient attitudes. In this study we report from a survey on 475 persons with diabetes living in urban India, their attitudes, perceptions and practices. RESEARCH DESIGN & METHODS We carried out the study amongst persons with diabetes from urban India with the objective of understanding their perceptions, attitudes and practices in relation to their disease and its management. The study design was an initial listing followed by a qualitative survey using a structured questionnaire. Eight hundred and twenty-four adults with diabetes, visiting randomly selected pharmacies to buy anti-diabetes medicines from four metros viz. Mumbai, Delhi, Calcutta and Chennai and four mini metros viz. Ahmedabad, Lucknow, Patna and Cochin were randomly selected for listing and questioned about their currently used anti-diabetic medicine. The cities selected are fairly representative of urban India. * Novo Nordisk India Ltd., Bangalore ** Sitaram Bhartiya Institute, New Delhi *** ORG MARG Ltd., Mumbai
There were differences between the three groups; the mean age being 37.6 yr. ± 13.3 (l), 41.5 ± 11.0 yr (C) and 46.0 ± 12.3 yr (T). At the time of diagnosis patients currently on insulin were relatively young as compared to patients on tablets or combination. The mean duration of diabetes was 15.4 ± 11.3 yr. for patients on insulin, 13.9 ± 8.9 yr. for patients on combination and 9.5 ± 8.9 yr. on tablets, as shown in Figure 4. This is perhaps a reflection of the natural history of Type 2 diabetes.
39% patients were illiterate or had not passed school, 26% had passed school, 23% were university graduates and 8% were postgraduates. This is in line with current literacy levels in urban India. Only 24% patients belonged to upper and upper middle income group. The mean monthly household income was INR 5232.2 ± 3096. There was no income difference between the three groups suggesting that the choice of treatment was perhaps not determined by the income. Monthly income and education is shown in Figure 5. How Was Diabetes Diagnosed?
Table 1 gives the presenting symptoms or complaint that led to the diagnosis. Weakness was the presenting complaint in over one-fourth. Classical symptoms, such as frequent thirst and urination were seen less often. Diabetes was detected in roughly 21% as a consequence of regular or pre-surgical check-up, or evaluation for another condition, confirming the asymptomatic nature of the condition.
Table 1
Symptoms or cause
Feeling of weakness 23% Body Pain 17% Felt sick 17% Urine Problems 14% Frequent thirst 10% Delayed wound healing 7% Check up for other conditions 9% Regular check up 6% Presurgical check up 6%
INT. J. DIAB. DEV. COUNTRIES (1997), VOL. 17 8
Who Was Treating 36% patients were under the care of Diabetologists, 33% Consulting Physicians and 31% General Practitioners. More patients on combination or insulin were being treated by Diabetologists, compared to those on oral tablets. 42% of tablet users were under the care of GPs. The break-up is shown in Figure 6. Considering the study which was conducted in large cities where services of specialists are readily available these figures are likely to be skewed. Monitoring Both urine and blood sugar were tested by 76% patients, only blood sugar by 22% and only urine sugar by 2%. Over 95% patients had their blood sugar tests done in pathology labs; only 5% monitored their blood sugar at home. Frequency of home blood glucose monitoring was higher for insulin users (11%) as compared to tablet users (2%). Even urine sugar tests were also done in labs only (84%). Doctors as expected were the most important influencers, for testing. Surprisingly, more tablet users got tested on their own will as compared to those on combination or insulin alone, where the family / friends influenced testing. This may reflect guilt and avoidance. Frequency of monitoring was rather poor. Very few tested blood sugar daily. Amongst insulin taking patients, 40% tested blood sugar once a month, only 22% more than once a month, 38% measured blood sugar bimonthly or less frequently. Amongst tablet users, the frequency of blood sugar testing was even worse, with only 20% measuring once a month, 30% once in two months, 18% once in three months, and 17% once in six months. 22% patients did not bother about urine
testing. Of those who tested urine sugar only 24% on insulin and 34% on combination measured urine sugar monthly or more frequently.
Table 2
Influencer Insulin Comb Tab
Doctor 65% 74% 64%
Self 4% 3% 28%
Family/Friend 29% 22% 6%
Lab Tech. 2% 1% 2 %
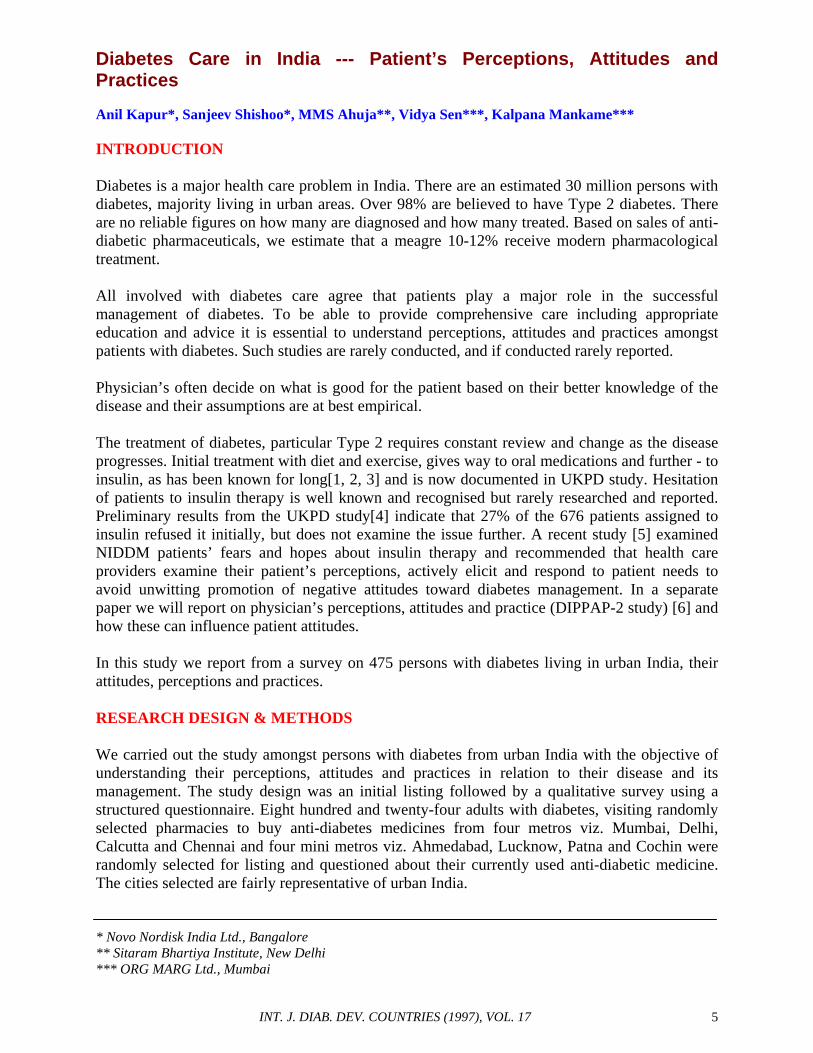
Knowledge Of Target Values For Control Patients were asked what level of blood sugar ensured that their diabetes was under control. From a given list, they indicated what they thought should be the fasting and post meal glucose level to ensure good control. Almost 40% were unable to indicate any value for FBG and 34% for post prandial value. The mean value for those responding was fasting 117.8 ± 69.3 mg/dl and post prandial 174.3 ± 83.9 mg/dl. The mean values are fairly close to the ideal and may indicate that many patients are fairly well aware about the target values. Whether the targets are implemented in real life is another issue. Patients on tablets indicated lower values compared to those on insulin alone or on combination, both for fasting as well as post prandical values. We cannot explain this finding but it perhaps reflects an underlying extra caution for hypoglycemia amongst insulin users. The spread of target values is shown in Table 3.
INT. J. DIAB. DEV. COUNTRIES (1997), VOL. 17 9
Table 3
Insulin Tab Comb All
FBG (n) ® 144 227 104 475
Mean Value ± 117.6 109.9 135.7 117.8
(SD) mg/dl (60.3) (68.8) (79.8) (69.3)
70 – 150 mg/dl 56% 42% 41% 46%
151 – 220 mg/dl 7% 11% 15% 10%
> 220 mg/dl 3% 4% 7% 4%
Don’t Know 34% 43% 37% 39%
PP2BG (n) ® 144 227 104 475
Mean Value ± 172.5 159.7 209.6 174.3
(SD) mg/dl (83.0) (82.4) (79.98) (83.9)
100 – 180 mg/dl 42% 41% 31% 39%
181 – 240 mg/dl 21% 19% 29% 21%
> 240 mg/dl 8% 9% 11% 10%
Don’t know 29% 31% 29% 30%
Visit to Doctors Patients visited their doctors fairly often (often than they carried out blood sugar estimations), 34% once a month and 27% once a quarter. The frequency of visits for insulin users (alone or in combination) was much higher than tablet users. Approx. 58% of insulin users visited the doctor monthly or more often, compared to 38% tab users.
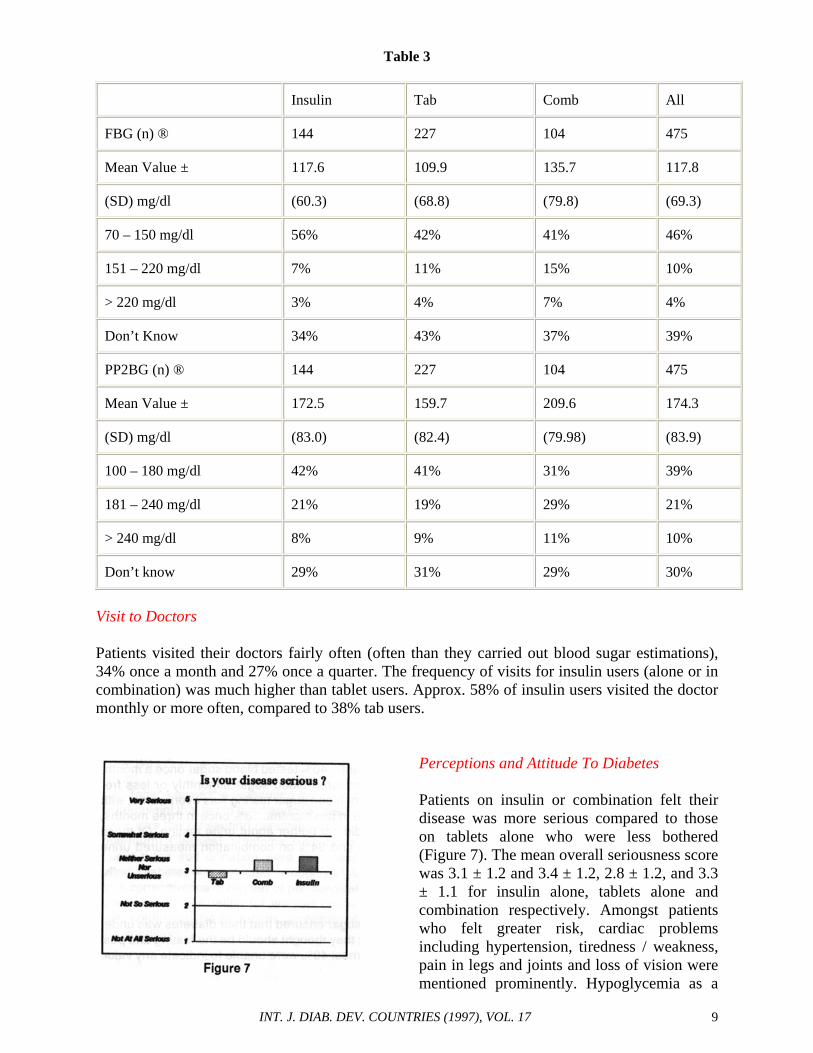
Perceptions and Attitude To Diabetes Patients on insulin or combination felt their disease was more serious compared to those on tablets alone who were less bothered (Figure 7). The mean overall seriousness score was 3.1 ± 1.2 and 3.4 ± 1.2, 2.8 ± 1.2, and 3.3 ± 1.1 for insulin alone, tablets alone and combination respectively. Amongst patients who felt greater risk, cardiac problems including hypertension, tiredness / weakness, pain in legs and joints and loss of vision were mentioned prominently. Hypoglycemia as a
INT. J. DIAB. DEV. COUNTRIES (1997), VOL. 17 10
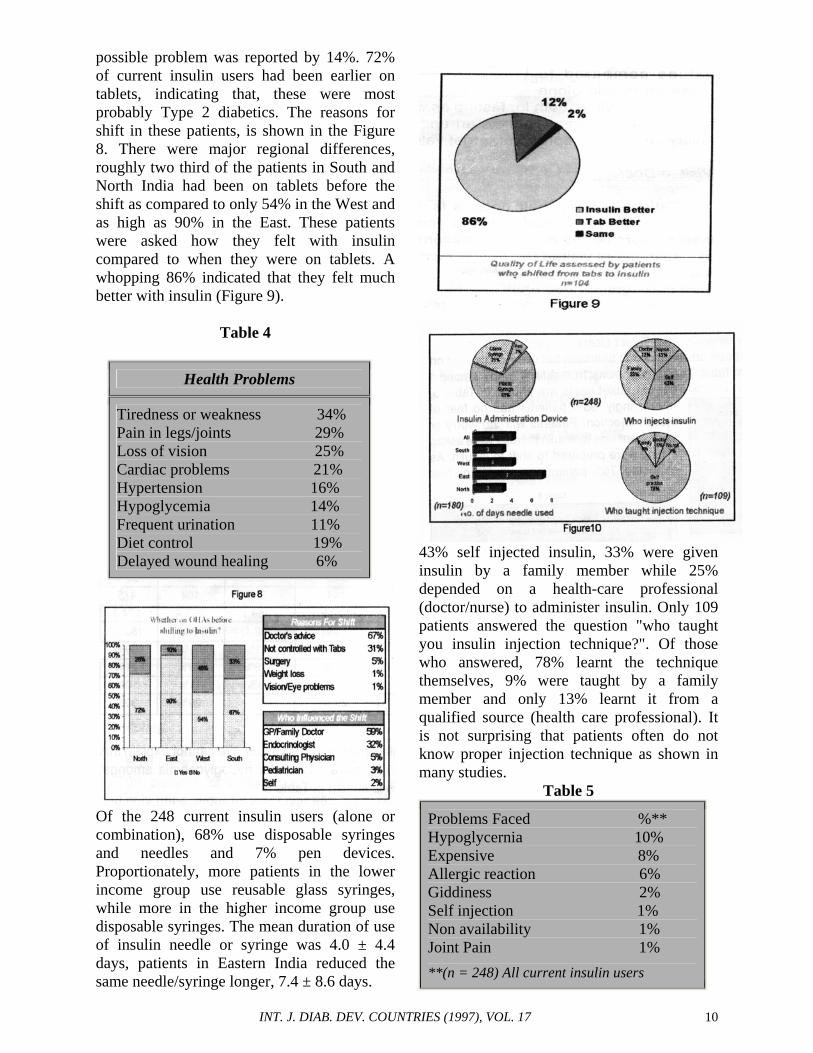
possible problem was reported by 14%. 72% of current insulin users had been earlier on tablets, indicating that, these were most probably Type 2 diabetics. The reasons for shift in these patients, is shown in the Figure 8. There were major regional differences, roughly two third of the patients in South and North India had been on tablets before the shift as compared to only 54% in the West and as high as 90% in the East. These patients were asked how they felt with insulin compared to when they were on tablets. A whopping 86% indicated that they felt much better with insulin (Figure 9).
Table 4
Health Problems
Tiredness or weakness 34% Pain in legs/joints 29% Loss of vision 25% Cardiac problems 21% Hypertension 16% Hypoglycemia 14% Frequent urination 11% Diet control 19% Delayed wound healing 6%
Of the 248 current insulin users (alone or combination), 68% use disposable syringes and needles and 7% pen devices. Proportionately, more patients in the lower income group use reusable glass syringes, while more in the higher income group use disposable syringes. The mean duration of use of insulin needle or syringe was 4.0 ± 4.4 days, patients in Eastern India reduced the same needle/syringe longer, 7.4 ± 8.6 days.
43% self injected insulin, 33% were given insulin by a family member while 25% depended on a health-care professional (doctor/nurse) to administer insulin. Only 109 patients answered the question "who taught you insulin injection technique?". Of those who answered, 78% learnt the technique themselves, 9% were taught by a family member and only 13% learnt it from a qualified source (health care professional). It is not surprising that patients often do not know proper injection technique as shown in many studies.
Problems and Worries with Insulin 76% of current insulin users reported no problems with insulin. Frequently reported problems and worries are shown in Table 5 & 6. 66% had no worries about insulin therapy; 8% were worried about wound healing, 4% each worried about expenses, pain, side effects and hypoglycemia.
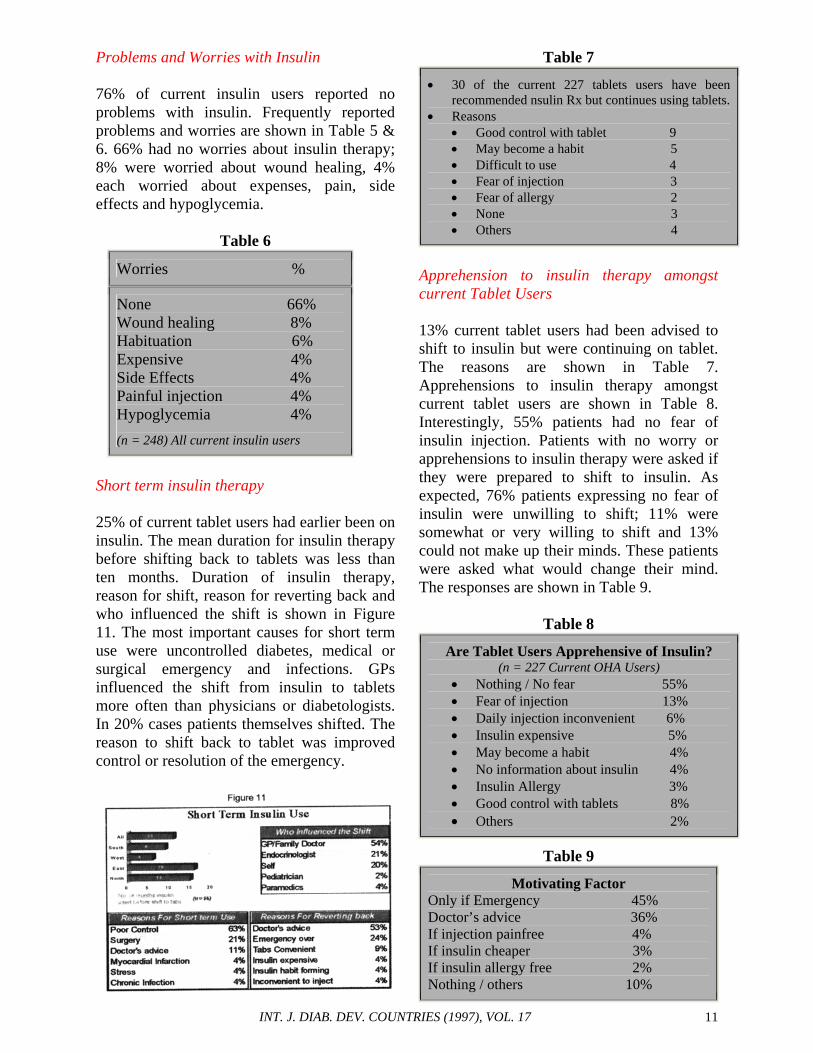
Short term insulin therapy 25% of current tablet users had earlier been on insulin. The mean duration for insulin therapy before shifting back to tablets was less than ten months. Duration of insulin therapy, reason for shift, reason for reverting back and who influenced the shift is shown in Figure 11. The most important causes for short term use were uncontrolled diabetes, medical or surgical emergency and infections. GPs influenced the shift from insulin to tablets more often than physicians or diabetologists. In 20% cases patients themselves shifted. The reason to shift back to tablet was improved control or resolution of the emergency.
Table 7
• 30 of the current 227 tablets users have been recommended nsulin Rx but continues using tablets.
• Reasons • Good control with tablet 9 • May become a habit 5 • Difficult to use 4 • Fear of injection 3 • Fear of allergy 2 • None 3 • Others 4
Apprehension to insulin therapy amongst current Tablet Users 13% current tablet users had been advised to shift to insulin but were continuing on tablet. The reasons are shown in Table 7. Apprehensions to insulin therapy amongst current tablet users are shown in Table 8. Interestingly, 55% patients had no fear of insulin injection. Patients with no worry or apprehensions to insulin therapy were asked if they were prepared to shift to insulin. As expected, 76% patients expressing no fear of insulin were unwilling to shift; 11% were somewhat or very willing to shift and 13% could not make up their minds. These patients were asked what would change their mind. The responses are shown in Table 9.
Table 8
Are Tablet Users Apprehensive of Insulin? (n = 227 Current OHA Users)
• Nothing / No fear 55% • Fear of injection 13% • Daily injection inconvenient 6% • Insulin expensive 5% • May become a habit 4% • No information about insulin 4% • Insulin Allergy 3% • Good control with tablets 8% • Others 2%
Table 9
Motivating Factor Only if Emergency 45% Doctor’s advice 36% If injection painfree 4% If insulin cheaper 3% If insulin allergy free 2% Nothing / others 10%
INT. J. DIAB. DEV. COUNTRIES (1997), VOL. 17 12
Will proper knowledge change attitude? These patients were asked, if they were made aware of the risk of complications affecting the eye, heart, kidney or other organs, that result from uncontrolled diabetes and if insulin was required for control, would they still resist insulin? The responses before and after being made aware of the consequences of uncontrolled diabetes are shown in Figure 12. Sixty five percent were now willing to take insulin, while 22% were still not willing. We would like to further analyse these responses based on age, education, income, sex etc. to gain further insight to this attitude. The most worrying health problem for patients are shown in Table 10.
Quality of Life on OHAs To assess the quality of life of current tablet users, they were asked how do they generally feel (what was their zest for life)?
Approximately 45% complained of feeling somewhat or completely tired. Fig.13. Based on their current perceptions and knowledge of insulin, these patients were asked to opine what would happen to their quality of life if they shifted to insulin. 30% said their quality of life may improve somewhat or greatly, 31% said that it would remain the same and 29% said that it may decline somewhat or considerably. 10% did not respond. The results of this study must be viewed in context of patients’ knowledge of their disease. Only 10% patients had ever participated in the teaching programme or seminar for diabetic patients. Only 30% had ever received any information/booklet on diabetes. Fig 14. It appears that persons with diabetes even in urban India do not receive much support from the health care delivery system. It is perhaps the system of health care delivery, which is responsible for this state. Due to heavy workload doctors cannot devote much time for education be it in the private or in government run institutions. Because of other more pressing and heavy workload scant resources are allocated for diabetes care and education. The concept of nurse educators does not exist to take the load off the doctors. There is an urgent need for additional resources and all other stakeholders, including the pharmaceutical industry should help develop pragmatic solutions to this big problem. A vast majority of patients indicated an intense desire to be part to be part of patient education and awareness programmes and the areas that were of most interest to them are shown in the Table 11.
INT. J. DIAB. DEV. COUNTRIES (1997), VOL. 17 13
Table 11
• Diet & Diabetes • Diabetes control • Diabetes cause/s • Hypoglycemia • Insulin types, storage, usage etc. • Need for regular check ups • Exercise
Conclusion From the results of this large study, it is clear that with the limited support from the health care system, the person with diabetes even in urban India is fairly ignorant about his disease. Despite this, there are not many negative ideas about diabetes. Health care professionals’ concern about the average patients’ fears, apprehensions and ability to handle insulin therapy, appear unduly exaggerated. The patient appears quite open and receptive but in the absence of proper knowledge and guidance feels lost. Those who need insulin quickly learn to cope with it and do not find it as problematic as they envisaged, actually an overwhelming majority comment on the better quality of life. On the other hand, substantial number of tablet users comments on the less than optimum vitality. Most tablet users believe that their quality of life will not worsen with insulin, one third say they believe it will improve. Majority of OHA users though not fearing insulin, is still reluctant to use insulin until and unless properly advised on the necessity of it. Once explained they are willing to accept the
change and quickly learn to handle it. While insulin taking diabetics attach a certain seriousness to their disease, patients on tablets do not feel the same and consider their disease less serious compared to those on insulin. This is a clear reflection of lack of knowledge of the consequences of improperly managed diabetes. Clearly patients need more information. In a still largely traditional society the physician’s attitudes does influence the patients and this is an important consideration. A recent study[5] mentions how clinical interactions between the doctor and patient can unwittingly create barriers to insulin. The authors of this study mention that patients often spoke of health care providers using insulin as a threat to promote behavioural changes, or as a punishment for failure to comply or as a bargaining tool in promising its withdrawal as a reward for behavioural change. While this works in the short term, to get desired results, in the long run it creates the impression that insulin is something that must be avoided and thus only serves to increase reluctance and increase barriers to it. Socio--economic background is an important consideration that moulds attitudes to a chronic disease. This can be clearly seen in the frequency of monitoring and reuse of syringes. Monitoring if not non-existent is very infrequent and should be a matter of concern to all. Based on this pilot study, we plan to conduct a more extensive study involving both urban and rural India as well as detailed analysis of some aspects that have been noted in this study. REFERENCES 1. Wolffenbuttle BHR, Drossaert CH, Visser AP.
Determinants of injecting insulin in elderly patients with Type 2 diabetes mellitus. Patients Educe Counseling. 1993; 22 : 117-25.
NIDDM, a balanced overview. Diabetes Care 1992; 15 : 318-68.
INT. J. DIAB. DEV. COUNTRIES (1997), VOL. 17 14
4. United Kingdom Prospective Diabetes Study
Group : United Kingdom Prospective Diabetes Study 13. Relative efficacy of randomly allocated diet, sulphonylurea, insulin or metformin in patients with newly diagnosed non-insulin dependent diabetes followed for three years. Br. Med. J 1995; 310 : 83-8.
5. Hunt LM, Valenzuela MA, Pugh JA. NIDDM
patients’ Fears and Hopes About Insulin Therapy. Diabetes Care 1997; 20 : 292-8.