Diabetes, Genetics and the State of Comprehensive Diabetes Care Louis H. Philipson, M.D., Ph.D., FACP Departments of Medicine and Pediatrics Director, Kovler Diabetes Center Chicago February 15, 2011 There, and Back again* *Bilbo Baggins
Transcript
Diabetes, Genetics and the State of Comprehensive Diabetes Care
Louis H. Philipson, M.D., Ph.D., FACPDepartments of Medicine and Pediatrics
Director, Kovler Diabetes Center
Chicago February 15, 2011
There, and Back again*
*Bilbo Baggins
American Diabetes Association
Jeannette Flom, Executive Director –Chicago
312-346-1805 x656
130 N Michigan Ave #2015
Chicago, IL 60602
www.diabetes.org
Calvin WilliamsSarah Carl, Emily HudsonPiper Below, Anna PluzhnikovSusan Tucker
Outline: Diabetes 2011
Definitions
Epidemiology
Lifestyle Modifications
Key Pharmacologic Agents
Goals of Therapy
Insulin
Combination Therapy
Thoughts about Compliance/Adherence
Case Presentation
“When he came to
the hospital, he was
emaciated, weak and
dejected; his thirst
was unquenchable;
and his skin dry, hard,
and harsh to the
touch, like rough
parchment.”
J.L. 12/15/22
wt 15 lb, age 3 yrs
J.L. after insulin
2/15/23, wt 29 lb
Before and after
pictures of another
1922 patient,
thought too
indelicate for lay
viewing
Type 1-diabetes: Beta-cells are destroyed by the immune system
Slack: Development 121, 1569-1580 (1995)
InsGlu
SomGlu
PPGlu
Acinar cells
Islet of Langerhans
Insulin producing beta cells
”Once diabetic –
always diabetic”
Beta-cells do not come back?
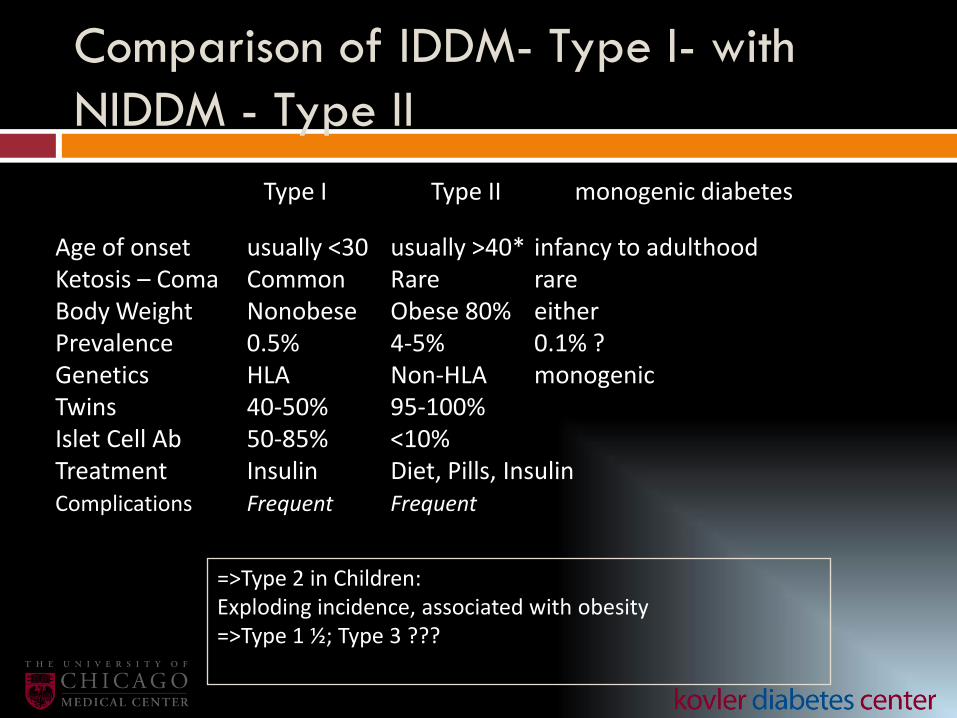
Comparison of IDDM- Type I- with
NIDDM - Type II
Type I Type II monogenic diabetes
Age of onset usually <30 usually >40* infancy to adulthoodKetosis – Coma Common Rare rareBody Weight Nonobese Obese 80% eitherPrevalence 0.5% 4-5% 0.1% ?Genetics HLA Non-HLA monogenicTwins 40-50% 95-100%Islet Cell Ab 50-85% <10%Treatment Insulin Diet, Pills, InsulinComplications Frequent Frequent
=>Type 2 in Children:Exploding incidence, associated with obesity=>Type 1 ½; Type 3 ???
MODY
• Monogenic diabetes = maturity onset diabetes of youth
• Heterogeneous disorder
• Non ketotic
• Autosomal dominant
• Autoimmunity absent
• Onset < 25 yo, freq childhood/adolescence
• Primary defect in function of beta cells, in insulin secretion (not insulin action)
• May account for 1-5% cases of diabetes in industrialized countries
• Up to 10% of patients classified as type 1 but without high risk HLA may have MODY
Giuffrida and Reis. Diab, Obes, Metab 2005.
DIABETES: INABILITY TO UTILIZE FUEL
Signs and Symptoms
Polyphagia
Polydipsia
Polyuria
Wt loss
Hyperglycemia
glycosuria
Diagnosis Guidelines
Category FPG (mg/dL)
Normal <110Impaired Fasting Glucose* (IFG) 110 – 125Diabetes >126
*Not to be confused with impaired glucose tolerance (IGT):2 h OGTT 75 g at 140–200 mg/dL
Expert Committee on the Diagnosis and Classification of Diabetes Mellitus. Diabetes Care. 1997;20:1183-
1197.
Plasma Glucose Normally Maintained in Narrow Range
Adapted from Polonsky KS, et al. N Engl J Med. 1988;318:1231-1239.
Plasma
Glucose,
mg/dL
6 AM 10 AM 2 PM 6 PM 10 PM 2 AM6 AM
Time of Day
400
300
200
100
0
Diabetic
Control
Normal Impaired Glucose Tolerance Late Diabetes
Glucose and Insulin ProfilesAfter Oral Glucose Challenge
Reaven GM, et al. Diabetologia. 1977;13:201-206.
80
120
160
200
240
280
320
360
400
0 1 2 3
Plasma
Glucose,
mg/dL
Time, Hours1/2
Plasma
Insulin,
U/mL
Time, Hours
0
30
60
90
120
150
0 1 2 31/2
Glucose Contributions to HbA1c
+
Postprandial Glucose
influenced by:• Preprandial glucose
• Insulin secretion
• Glucose load from meal
• Insulin sensitivity in
peripheral tissues
Fasting Glucose influenced by:
• Hepatic glucose production
• Hepatic sensitivity to insulin
.
HbA1c = Normal about 4-6%
Relative Risk
of
Complications
UKPDS 33. Lancet. 1998;352:837-853.
DCCT Research Group. N Engl J Med. 1993;329:977.
Slide adapted from Kendall D, International Diabetes Center, Minneapolis.
0
4
8
12
16
6 7 8 9 10 11 12Hemoglobin A1c
120 150 180 210 240 270 300Average Glucose
Schematic Representation: Benefit of Lowering
HbA1c (Type 1 and Type 2 Composite Data)
Reduced Risk of Complications
*Percent risk reduction per 0.9% decrease in HbA1C; UKPDS. Lancet. 1998;352:837-853.
Lowering HbA1C Reduces Risk of Complications
Reduction in r
isk (
%)*
p=0.029
p=0.0099
p=0.052
p=0.015
p=0.000054
0
-10
-20
-30
-40
-50
-12
-25
-16
-34
-21
Any diabetes-related endpoint
Microvascular endpoint
MI
Retinopathy
Albuminuria at 12 years
United Kingdom Prospective Diabetes Study (UKPDS)
Good Glycemic Control (Lower HbA1c)
Reduces Incidence of Complications
HbA1c
Retinopathy
Nephropathy
Neuropathy
Macrovascular disease
* not statistically significant
DCCT
9 7%
63%
54%
60%
41%*
Kumamoto
9 7%
69%
70%
–
–
UKPDS
8 7%
17-21%
24-33%
–
16%*
Diabetes Control and Complications Trial (DCCT) Research Group. N Engl J Med. 1993;329:977-986.
Ohkubo Y et al. Diabetes Res Clin Pract. 1995;28:103-117.
UK Prospective Diabetes Study Group (UKPDS) 33: Lancet. 1998;352:837-853.
The epidemic of type 2 diabetes
obesity
inactivity
Abdominal fat
Excess calories
World-wide distribution
Age-adjusted Percentage of U.S. Adults Who Were Obese
or Who Had Diagnosed Diabetes
Obesity (BMI ≥30 kg/m2)
Diabetes
1994
1994
2000
2000
No Data <14.0% 14.0-17.9% 18.0-21.9% 22.0-25.9% >26.0%
No Data <4.5% 4.5-5.9% 6.0-7.4% 7.5-8.9% >9.0%
CDC’s Division of Diabetes Translation. National Diabetes Surveillance System available at
Start with 1 unit per choice or 1 unit per 15 grams
Typical dose is 2-4 units per choice in type 2 diabetes
Titrate based on postprandial glucose monitoring
Generally, start with lispro/aspart/glulisine administered
before meals
Oral Agents for Diabetes
First line treatment is meal planning, weight loss, and
exercise
Sometimes these measures are not enough to bring
blood glucose levels down near the normal range
Oral agents work best when used with meal planning
and exercise
3 therapies working together to lower blood
glucose levels
Four Goals of Diabetes Management
FOCUS MEASUREMENT GOAL FREQUENCY
GLUCOSE
A1C <7.0% Every 3-6 months
Before meal, bedtime, and
mid-sleep finger-prick
glucose
70-130 mg/dL
As needed to ensure
control and to avoid
hypoglycemia
1-2 hours after meal finger-
prick glucose<180 mg/dL
As needed to ensure
control
BLOOD
PRESSUREOffice blood pressure <130/80 mm Hg Every visit
CHOLESTEROL
Apolipoprotein B (ApoB-
100)
<90 mg/dL (<80 mg/dL with
vascular disease, smoking, fam hx
early CAD, HTN)
Annually; more often while
adjusting treatment
-or- Non-HDL cholesterol
(total cholesterol – HDL
chol.)
<130 mg/dL (<100 mg/dL with
vascular disease, smoking, fam hx
early CAD, HTN)
-or- LDL cholesterol
(requires fasting)
<100 mg/dL (<70 mg/dL with
vascular disease, smoking, fam hx
early CAD, HTN)
HDL cholesterol >40 mg/dL (>50 mg/dL for women)
Triglycerides (requires
fasting)<150 mg/dL
Buse JB. Standards of Care. In: The Uncomplicated Guide to Diabetes Complications. 3rd ed. Pfeifer M, ed. Alexandria, VA: American Diabetes Association; 2009.
Screen for diabetes starting at age 30-45 every 3-5
years in everyone, earlier in those with risk factors
Opportunistic therapy of ABCs of diabetes Early treatment of hyperglycemia to achieve lowest HbA1C
possible without adverse consequences
Certainly <7%, probably <6%; at least in primary prevention,
except the lessons from ACCCORD in older patients with heart
disease (7.5%)
Is there a particular role of non-hypoglycemic and
nonobesogenic agents?
Is there a changing role for thiazolidinediones
and secretagogues?
Summary: Diabetes Care 2011
Opportunistic therapy of ABCs of diabetes (cont’d) Control blood pressure Certainly <140/85 mm Hg; probably <130/80 mm Hg;
possibly <120/80 mm Hg (probably not from ACCORD)
Statins to control LDL <100 mg/dL, non-HDL <130 mg/dL If triglycerides >200 mg/dL and HDL cholesterol <35 mg/dL,
consider targeting dyslipidemia What is the role of niacin? Consider lower targets for those with family history of premature