22
Diabetes in the UK 2011/2012: Key statistics on diabetes December 2011
| Date post: | 06-Apr-2018 |
| Category: |
Documents |
| Upload: | mark-anthony-betito |
| View: | 219 times |
| Download: | 0 times |
8/2/2019 Diabetes in the UK 2011 12
http://slidepdf.com/reader/full/diabetes-in-the-uk-2011-12 1/22
Diabetes in the UK 2011/2012:
Key statistics on diabetes
December 2011
8/2/2019 Diabetes in the UK 2011 12
http://slidepdf.com/reader/full/diabetes-in-the-uk-2011-12 2/22
Diabetes in the UK 2011/2012 Key statistics on diabetes 2
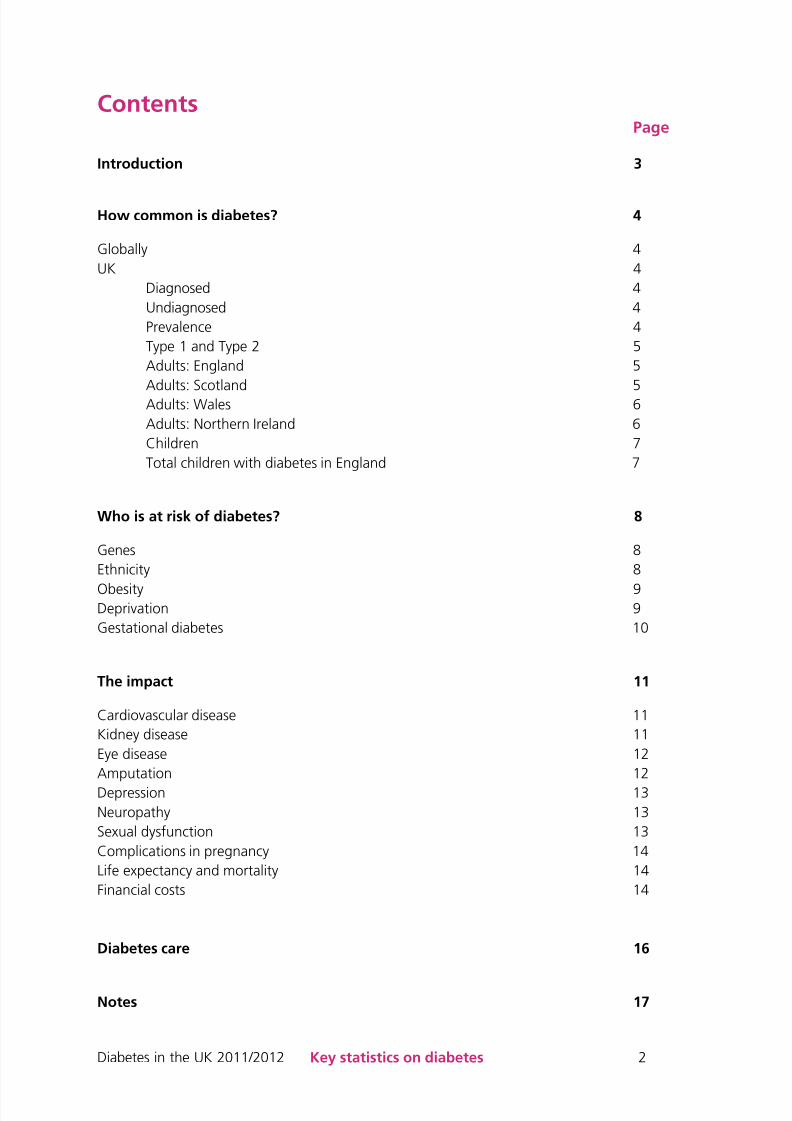
ContentsPage
Introduction 3
How common is diabetes? 4
Globally 4
UK 4
Diagnosed 4
Undiagnosed 4
Prevalence 4
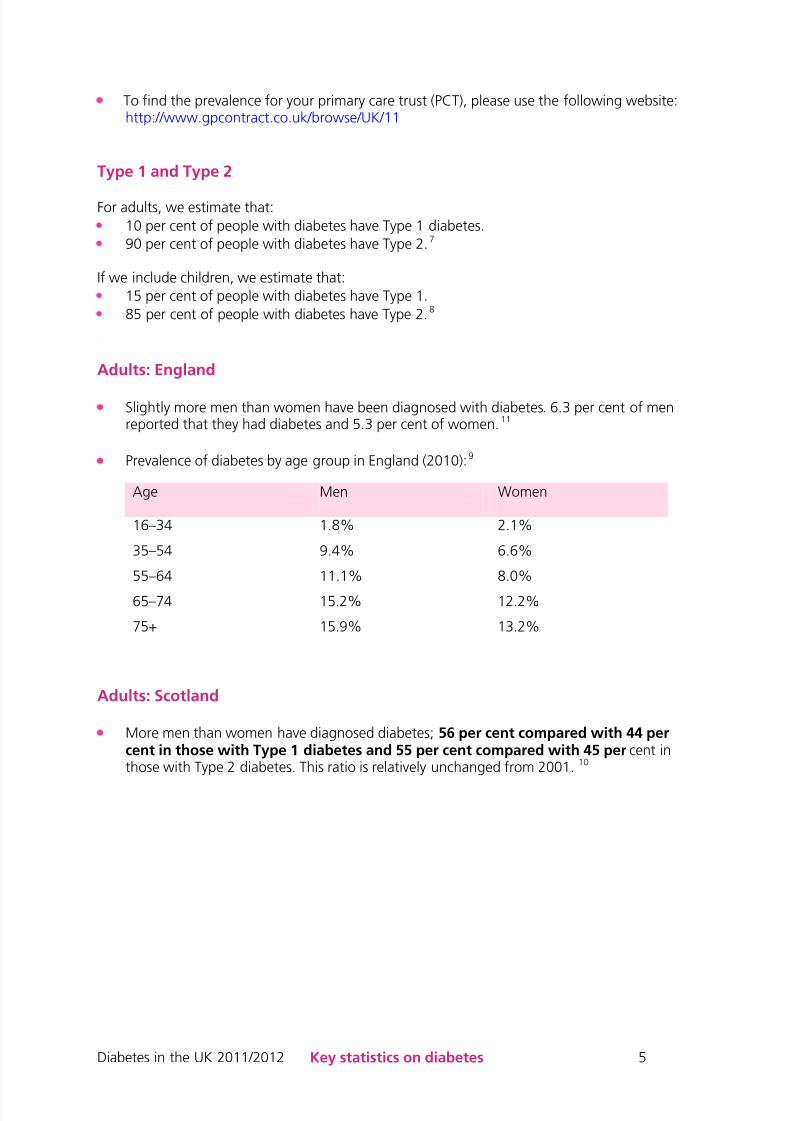
Type 1 and Type 2 5
Adults: England 5
Adults: Scotland 5Adults: Wales 6
Adults: Northern Ireland 6
Children 7
Total children with diabetes in England 7
Who is at risk of diabetes? 8
Genes 8
Ethnicity 8
Obesity 9Deprivation 9
Gestational diabetes 10
The impact 11
Cardiovascular disease 11
Kidney disease 11
Eye disease 12
Amputation 12
Depression 13
Neuropathy 13
Sexual dysfunction 13
Complications in pregnancy 14
Life expectancy and mortality 14
Financial costs 14
Diabetes care 16
Notes 17
8/2/2019 Diabetes in the UK 2011 12
http://slidepdf.com/reader/full/diabetes-in-the-uk-2011-12 3/22
Diabetes in the UK 2011/2012 Key statistics on diabetes 3
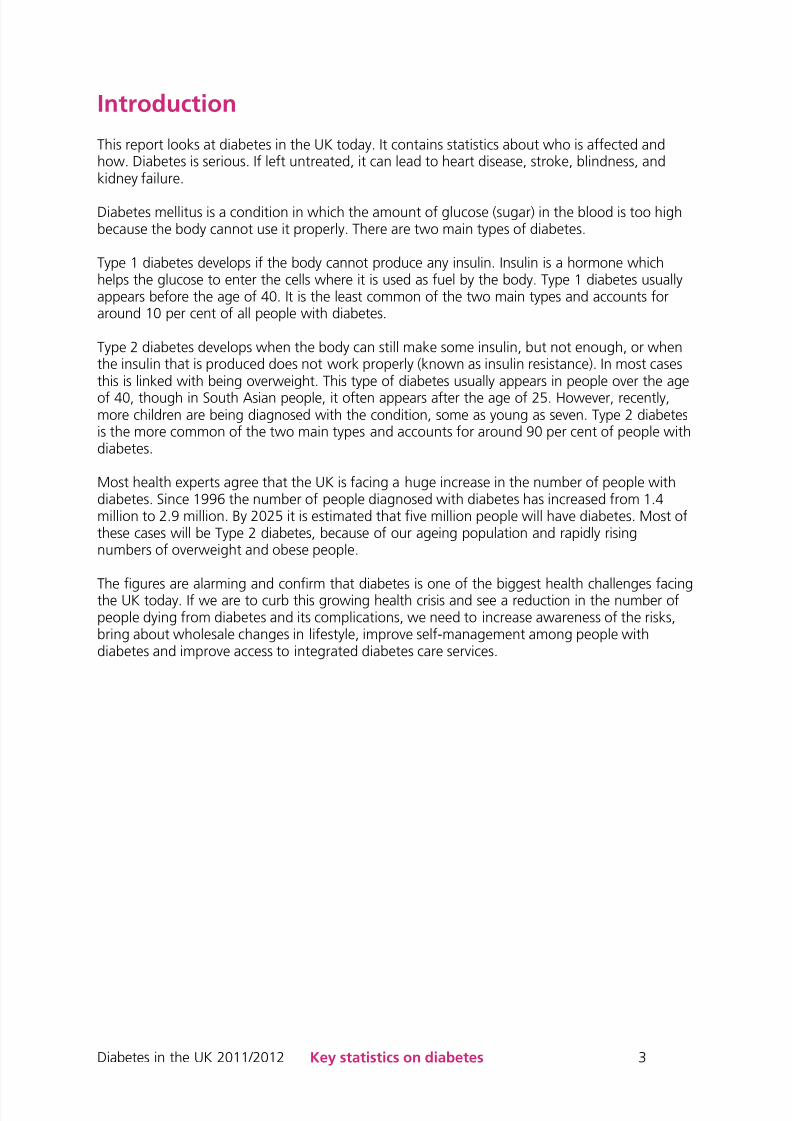
Introduction
This report looks at diabetes in the UK today. It contains statistics about who is affected andhow. Diabetes is serious. If left untreated, it can lead to heart disease, stroke, blindness, andkidney failure.
Diabetes mellitus is a condition in which the amount of glucose (sugar) in the blood is too highbecause the body cannot use it properly. There are two main types of diabetes.
Type 1 diabetes develops if the body cannot produce any insulin. Insulin is a hormone whichhelps the glucose to enter the cells where it is used as fuel by the body. Type 1 diabetes usuallyappears before the age of 40. It is the least common of the two main types and accounts foraround 10 per cent of all people with diabetes.
Type 2 diabetes develops when the body can still make some insulin, but not enough, or whenthe insulin that is produced does not work properly (known as insulin resistance). In most casesthis is linked with being overweight. This type of diabetes usually appears in people over the age
of 40, though in South Asian people, it often appears after the age of 25. However, recently,more children are being diagnosed with the condition, some as young as seven. Type 2 diabetesis the more common of the two main types and accounts for around 90 per cent of people withdiabetes.
Most health experts agree that the UK is facing a huge increase in the number of people withdiabetes. Since 1996 the number of people diagnosed with diabetes has increased from 1.4million to 2.9 million. By 2025 it is estimated that five million people will have diabetes. Most ofthese cases will be Type 2 diabetes, because of our ageing population and rapidly risingnumbers of overweight and obese people.
The figures are alarming and confirm that diabetes is one of the biggest health challenges facingthe UK today. If we are to curb this growing health crisis and see a reduction in the number ofpeople dying from diabetes and its complications, we need to increase awareness of the risks,bring about wholesale changes in lifestyle, improve self-management among people withdiabetes and improve access to integrated diabetes care services.

8/2/2019 Diabetes in the UK 2011 12
http://slidepdf.com/reader/full/diabetes-in-the-uk-2011-12 4/22
Diabetes in the UK 2011/2012 Key statistics on diabetes 4
How common is diabetes?
Globally
The estimated diabetes prevalence worldwide for 2011 was 366 million and it is expectedto affect 552 million people by 2030.
The International Diabetes Federation (IDF) estimated that in 2011 the five countries withthe largest numbers of people with diabetes were China, India, the United States ofAmerica, Russia and Brazil.
The IDF also reported that in 2011 the five countries with the highest diabetes prevalence inthe adult population were Kiribati, Marshall Islands, Kuwait, Nauru and Lebanon.
Low and middle income countries face the greatest burden of diabetes.1
UK
It is estimated that more than one in 20 people in the UK has diabetes (diagnosed orundiagnosed).
Diagnosed
There are 2.9 million people who have been diagnosed with diabetes in the UK (2011).2
By 2025, it is estimated that five million people will have diabetes in the UK.3
It is equivalent to:- more than 400 people every day
- over 17 people every hour- around three people every ten minutes.4
Undiagnosed
It is estimated that there are around 850,000 people in the UK who have diabetes but havenot been diagnosed.5
Prevalence
In 2011, the prevalence of diabetes in the adult population across the UK was as follows:
This gives a UK average prevalence of 4.45 per cent in adults.6
Country Prevalence Number of people
England 5.5% 2,455,937
Northern Ireland 3.8% 72,693
Scotland 4.3% 223,494
Wales 5.0% 160,533
8/2/2019 Diabetes in the UK 2011 12
http://slidepdf.com/reader/full/diabetes-in-the-uk-2011-12 5/22
8/2/2019 Diabetes in the UK 2011 12
http://slidepdf.com/reader/full/diabetes-in-the-uk-2011-12 6/22
Diabetes in the UK 2011/2012 Key statistics on diabetes 6
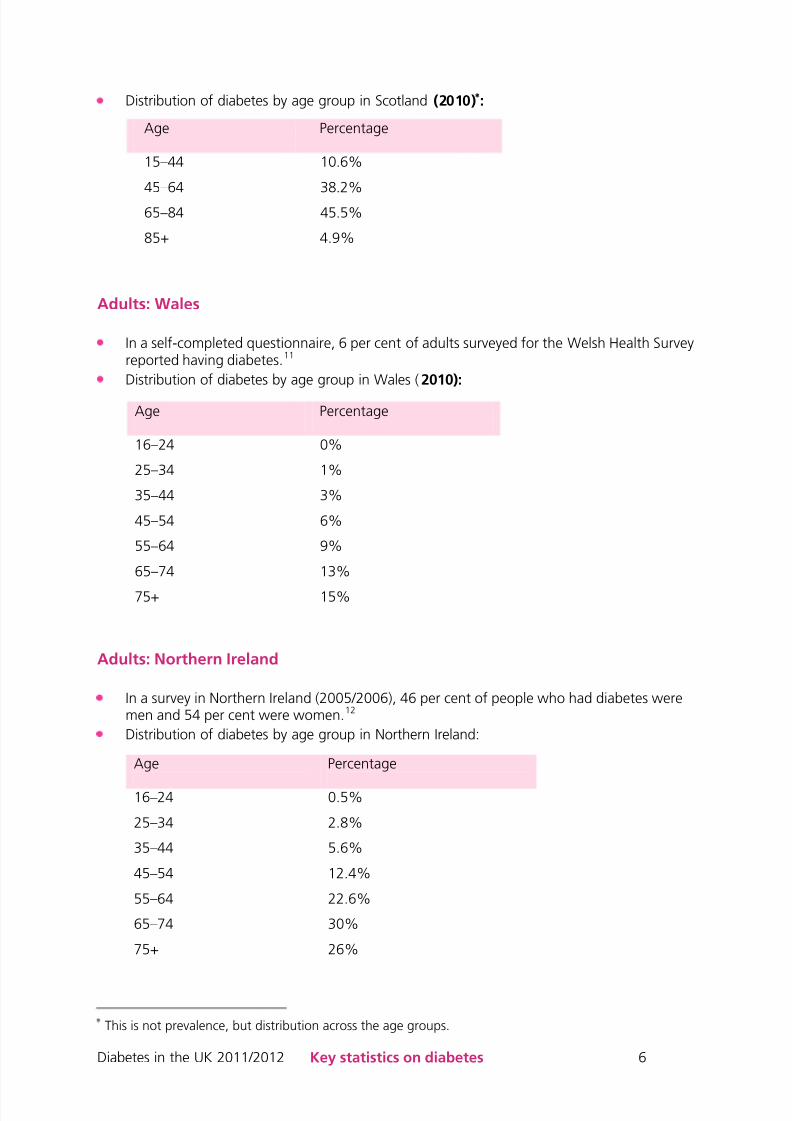
Distribution of diabetes by age group in Scotland (2010) :
Adults: Wales
In a self-completed questionnaire, 6 per cent of adults surveyed for the Welsh Health Surveyreported having diabetes.11
Distribution of diabetes by age group in Wales (2010):
Adults: Northern Ireland
In a survey in Northern Ireland (2005/2006), 46 per cent of people who had diabetes weremen and 54 per cent were women.12
Distribution of diabetes by age group in Northern Ireland:
This is not prevalence, but distribution across the age groups.
Age Percentage
15–44 10.6%
45–64 38.2%
65–84 45.5%
85+ 4.9%
Age Percentage
16–24 0%
25–34 1%
35–44 3%
45–54 6%
55–64 9%
65–74 13%
75+ 15%
Age Percentage
16–24 0.5%
25–34 2.8%
35–44 5.6%
45–54 12.4%
55–64 22.6%
65–74 30%
75+ 26%

8/2/2019 Diabetes in the UK 2011 12
http://slidepdf.com/reader/full/diabetes-in-the-uk-2011-12 7/22
Diabetes in the UK 2011/2012 Key statistics on diabetes 7
Children
There are about 29,000 children and young people with diabetes in the UK. About 26,500of them have Type 1 diabetes and about 500 have Type 2 diabetes. There are a further2,000 children and young people in the UK with diabetes whose diagnosis is not known.13
Type 1
The current estimate of prevalence of Type 1 diabetes in children in the UK is one per 700–
1,000.
Local authorities and primary care trusts (PCTs) can expect between 100 and 150 childrenwith diabetes to live in their area.
The peak age for diagnosis is between 10 and 14 years of age.14
Type 2
In 2000, the first cases of Type 2 diabetes in children were diagnosed in overweight girlsaged nine to 16 of Pakistani, Indian or Arabic origin. It was first reported in whiteadolescents in 2002.15
In 2004, children of South Asian origin were more than 13 times more likely to have Type 2diabetes than white children.16
Total children with diabetes in England
There are almost 23,000 people under the age of 17 with diabetes in England. 97 per centhave Type 1 diabetes, 1.5 per cent have Type 2 and 1.5 per cent are recorded as ‘other’.
Please see the table below for an age breakdown:17
Age
Percentage
of Type 1
Percentage
of Type 2
Percentage
of other
0–4 4% 0% 9.7%
5–9 19.1% 1.8% 10.6%
10–14 42.5% 39.1% 35.6%
15 11.4% 22.0% 14.1%
16 12.2% 21.7% 15.9%
17 10.7% 15.6% 14.1%

8/2/2019 Diabetes in the UK 2011 12
http://slidepdf.com/reader/full/diabetes-in-the-uk-2011-12 8/22
Diabetes in the UK 2011/2012 Key statistics on diabetes 8
Who is at risk of diabetes?
Diabetes is a common health condition. The chances of developing it may depend on a mix ofgenes, lifestyle and environmental factors.
The risk factors are different for Type 1 and Type 2 diabetes. Type 1 diabetes develops when theinsulin-producing cells in the pancreas have been destroyed. No one knows for certain whythese cells have been damaged, but the most likely cause is the body having an abnormalreaction to the cells. This may be triggered by a viral or other infection.
Type 2 diabetes usually appears in middle-aged or older people, although more frequently it isbeing diagnosed in younger overweight people, and it is known to affect South Asian people ata younger age. Type 2 diabetes occurs when the body is not making enough insulin, or theinsulin it is making is not being used properly. The risk of developing Type 2 diabetes can bereduced by changes in lifestyle.18
Some of the risk factors are provided in more detail below.
Genes
Type 1 diabetes
Although more than 85% of Type 1 diabetes occurs in individuals with no previous first degreefamily history, the risk among first degree relatives is about 15 times higher than in the generalpopulation.19
On average:if a mother has the condition, the risk of developing it is about 2–4 per cent
if a father has the condition, the risk of developing it is about 6–9 per cent
if both parents have the condition, the risk of developing it is up to 30 per cent
if a brother or sister develops the condition, the risk of developing it is 10 per cent (rising to10–19 per cent for a non-identical twin and 30–70 per cent for an identical twin).20
Type 2 diabetes
There is a complex interplay of genetic and environmental factors in Type 2 diabetes. Ittends to cluster in families. People with diabetes in the family are two to six times more
likely to have diabetes than people without diabetes in the family.21
Ethnicity
Type 2 diabetes is up to six times more common in people of South Asian descent and upto three times more common among people of African and African-Caribbean origin.22
According to the Health Survey for England 2004 , doctor diagnosed diabetes is almost fourtimes as prevalent in Bangladeshi men, and almost three times as prevalent in Pakistani andIndian men compared with men in the general population.

8/2/2019 Diabetes in the UK 2011 12
http://slidepdf.com/reader/full/diabetes-in-the-uk-2011-12 9/22
Diabetes in the UK 2011/2012 Key statistics on diabetes 9
Among women, diabetes is more than five times as likely among Pakistani women, at leastthree times as likely in Bangladeshi and Black Caribbean women, and two-and-a-half timesas likely in Indian women, compared with women in the general population. In the same survey, diabetes was generally rare among those aged 16–34, but was highestamong Indian men (2 per cent), Black African men (1.7 per cent) and Irish women (1.7 percent).23
Prevalence of self-reported doctor diagnosed diabetes in England by minority ethnic groupand sex:24
Obesity
Obesity is the most potent risk factor for Type 2 diabetes. It accounts for 80–85 per cent of theoverall risk of developing Type 2 diabetes and underlies the current global spread of the
condition.25
Almost two in every three people in the UK are overweight or obese (62 per cent of womenand 66 per cent of men).26
In 2009/10, almost one in four children in England measured in reception year wasoverweight or obese. In Year 6 in England, the rate was one in three.27
The Department of Health recommends that everyone has at least 30 minutes moderateintensity physical activity a day on five or more days a week.28
Across Great Britain, only 39 per cent of men and 29 per cent of women are meetingrecommended physical activity levels.29
Deprivation
Deprivation is strongly associated with higher levels of obesity, physical inactivity, unhealthy diet,smoking and poor blood pressure control. All these factors are inextricably linked to the risk ofdiabetes or the risk of serious complications for those already diagnosed.30
The statistics on deprivation shown on the next page are taken from three different healthsurveys.31 32 33 Statistics for England and Scotland are broken down into five household incomegroups. Statistics for Wales are broken down into eight socio-economic groups so it is notalways possible to make direct comparisons.
Minority ethnic group Men Women
Bangladeshi 8.2% 5.2%
Black African 5% 2.1%
Black Caribbean 10% 8.4%
Chinese 3.8% 3.3%
Indian 10.1% 5.9%
Irish 3.6% 2.3%
Pakistani 7.3% 8.6%
General population 4.3% 3.4%
8/2/2019 Diabetes in the UK 2011 12
http://slidepdf.com/reader/full/diabetes-in-the-uk-2011-12 10/22
Diabetes in the UK 2011/2012 Key statistics on diabetes 10
The most deprived people in the UK are two-and-a-half times more likely than average tohave diabetes at any given age.34
Women in England who live in homes with the lowest income are more than four times aslikely to get diabetes as those who live in homes with the highest income.
The prevalence of diabetes among men in England is highest in those who live in homeswith the lowest income (7 per cent) and the highest income (6.8 per cent).
Diabetes in Wales is almost twice as high in the most deprived areas compared to the leastdeprived.
In Scotland, the odds of developing Type 2 diabetes are 77 per cent higher for people fromthe most deprived areas compared to those in the most affluent areas.
Gestational diabetes
Gestational diabetes is a type of diabetes that arises during pregnancy (usually during thesecond or third trimester). In some women, it occurs because the body cannot produce enoughinsulin to meet the extra needs of pregnancy. In other women, it may be found during the firsttrimester of pregnancy, and in these women, the condition most likely existed before thepregnancy.
Gestational diabetes affects up to 5 per cent of all pregnancies.35
Women who are overweight or obese are at a higher risk of gestational diabetes.
The lifetime risk of developing Type 2 diabetes after gestational diabetes is at least 7 percent.36
8/2/2019 Diabetes in the UK 2011 12
http://slidepdf.com/reader/full/diabetes-in-the-uk-2011-12 11/22
Diabetes in the UK 2011/2012 Key statistics on diabetes 11
The impact
Good diabetes management has been shown to reduce the risk of complications.37 But whendiabetes is not well managed, it is associated with serious complications including heart disease,stroke, blindness, kidney disease and amputations leading to disability and premature mortality.
There is also a substantial financial cost to diabetes care as well as costs to the lives of peoplewith diabetes.
By the time they are diagnosed, half of the people with Type 2 diabetes show signs ofcomplications.38
Complications may begin five to six years before diagnosis and the actual onset of diabetesmay be ten years or more before clinical diagnosis.39
Cardiovascular disease
The term cardiovascular disease (CVD) includes heart disease, stroke and all other diseases of theheart and circulation, such as hardening and narrowing of the arteries supplying blood to thelegs, which is known as peripheral vascular disease (PVD). People with diabetes have abouttwice the risk of developing a range of CVD, compared with those without diabetes.40 Researchshows that improving dietary habits, managing weight, keeping active and using medicationwhere required to help control risk factors like diabetes, high cholesterol, triglyceride levels andhigh blood pressure reduces the overall chance of developing CVD.41 42 43 44
Cardiovascular disease is a major cause of death and disability in people with diabetes,accounting for 44 per cent of fatalities in people with Type 1 diabetes and 52 per cent inpeople with Type 2.45
People with Type 2 diabetes have a two-fold increased risk of stroke within the first fiveyears of diagnosis compared with the general population.46 47
Kidney disease
Kidney disease can happen to anyone but it is much more common in people with diabetes andpeople with high blood pressure. The kidneys are the organs that filter and clean the blood andget rid of any waste products by making urine. They regulate the amount of fluid and varioussalts in the body, helping to control blood pressure. They also release several hormones. Kidneydisease (or nephropathy) is caused by damage to small blood vessels making the kidneys work
less efficiently and this can cause the kidneys to start to fail. Keeping blood glucose levels asnear normal as possible and blood pressure well controlled can greatly reduce the risk of kidneydisease developing as well as other diabetes complications.48
Almost one in three people with Type 2 diabetes develops overt kidney disease.49
Diabetes is the single most common cause of end stage renal disease. 50
Kidney disease accounts for 21 per cent of deaths in Type 1 diabetes and 11 per cent ofdeaths in Type 2.51

8/2/2019 Diabetes in the UK 2011 12
http://slidepdf.com/reader/full/diabetes-in-the-uk-2011-12 12/22
Diabetes in the UK 2011/2012 Key statistics on diabetes 12
Eye disease
People with diabetes are at risk of developing a complication called retinopathy. Retinopathyaffects the blood vessels supplying the retina – the seeing part of the eye. Blood vessels in theretina of the eye can become blocked, leaky or grow haphazardly. This damage gets in the way
of the light passing through to the retina and if left untreated can damage vision. Keepingblood glucose, blood pressure and blood fat levels under control will help to reduce the risk ofdeveloping retinopathy.52 For protection against retinopathy, it is best to have eyes screenedwith a digital camera when first diagnosed and then every year, to identify and then treat eyeproblems early.
People with diabetes are 10 to 20 times more likely to go blind than people withoutdiabetes.53
Diabetes is the leading cause of blindness in people of working age in the UK.54 55 It isestimated that there are 4,200 people in England who are blind due to diabetic retinopathy.This increases by 1,280 each year.56
Within 20 years of diagnosis nearly all people with Type 1 and almost two thirds of peoplewith Type 2 diabetes (60 per cent) have some degree of retinopathy.57
People with diabetes are twice as likely to suffer from cataracts or glaucoma as the generalpopulation.58
Amputation
Foot problems can affect anyone who has diabetes. Diabetes, particularly if it is poorlycontrolled, can damage your nerves, muscles, sweat glands and circulation in the feet and legsleading to amputations. Reviewing the feet of people with diabetes regularly and keeping blood
glucose, blood fats and blood pressure under control can prevent some of the complicationsassociated with the feet.59
Diabetes is the most common cause of lower limb amputations.60
People with diabetes account for just under half of lower limb amputations in adults.63
100 amputations are carried out each week because of diabetes.61
Around one in twenty people with diabetes will develop a foot ulcer in one year. 62 Morethan one in ten foot ulcers result in the amputation of a foot or a leg.63
Worldwide, the rate of leg amputations in people with diabetes is over 15 times higher thanin people without diabetes.64
Up to 70 per cent of people die within five years of having an amputation as a result of
diabetes.65

8/2/2019 Diabetes in the UK 2011 12
http://slidepdf.com/reader/full/diabetes-in-the-uk-2011-12 13/22
Diabetes in the UK 2011/2012 Key statistics on diabetes 13
Depression
The emotional well being of people with diabetes is important and is integral to the overallhealth of an individual, particularly for people with long term conditions such as diabetes.People with diabetes may have emotional or psychological support needs resulting from living
with diabetes or due to causes external to the condition.
Coming to terms with diagnosis, the development of a complication, the side effects ofmedication, or dealing with the daily responsibility of self-managing diabetes can take their tollon emotional well being. In some cases this can lead to depression, anxiety, eating disorders, orphobias.
The prevalence of depression is approximately twice as high in people with diabetes as it isin the general population.66
Neuropathy
Neuropathy causes damage to the nerves that transmit impulses to and from the brain andspinal cord, to the muscles, skin, blood vessels and other organs. This can cause erectiledysfunction. The best way to reduce the risk of developing neuropathy, or prevent it becomingworse, is to control blood glucose levels.67 Following a healthy, balanced diet, making sure thatprescribed medication is taken properly, and having some form of regular exercise are allimportant factors that help keep good control of blood glucose levels.68 69
Neuropathies (or nerve damage) may affect up to 50 per cent of patients with diabetes.70
Chronic painful neuropathy is estimated to affect about one in six (16.2 per cent of) people
with diabetes, compared with one in 20 (4.9 per cent) in the age and sex matched controlgroup.71
Sexual dysfunction
Erectile dysfunction (ED) or impotence, the inability to achieve or maintain an erection for sexualintercourse, is one of the most common sexual problems experienced by men.
In 2009, a world literature review found that the reported prevalence of erectile dysfunctionwas between 35 per cent and 90 per cent among men with diabetes.72
One study found that 27 per cent of women with Type 1 diabetes reported sexualdysfunction. However, this is an under-researched area.73

8/2/2019 Diabetes in the UK 2011 12
http://slidepdf.com/reader/full/diabetes-in-the-uk-2011-12 14/22
Diabetes in the UK 2011/2012 Key statistics on diabetes 14
Complications in pregnancy
Pregnancy poses additional risks for women with diabetes. The chances of having difficulties aregreatly reduced through tight blood glucose control before and during pregnancy.74
Babies of women with diabetes are:– five times as likely to be stillborn– three times as likely to die in their first months of life– twice as likely to have a major congenital anomaly. This number could be higher as this
figure is not adjusted for the higher rate of abortions in women where congenitalabnormalities are found.
Two in three mothers with pre-existing diabetes have Type 1 diabetes.
The proportion of births to women with diabetes is rising due to an increased prevalence ofType 2 diabetes in younger people.75 76 77
Life expectancy and mortality
Diabetes is the fifth most common cause of death in the world.78
People with diabetes account for an estimated 15 to 16 per cent of deaths
occurring in England.79
Life expectancy is reduced, on average, by:– more than 20 years in people with Type 1 diabetes– up to 10 years in people with Type 2 diabetes.80
Financial costs
It is currently estimated that 10 per cent of the NHS budget is spent on diabetes.81 Thisworks out at around £9 billion a year (with a 2007/2008 budget for the NHS ofapproximately £90.7 billion).82 Or:– £173 million a week– £25 million a day– £1 million an hour– £17,000 a minute– £286 a second.
One in ten people admitted to hospital has diabetes. In some age groups, it is as many as
one in five. This could be one in three coronary care admissions.Complications of diabetes make up around one in five of all coronary heart disease, footand renal admissions.83
37.7 million prescription items were dispensed in primary care units across England in 2010at a net ingredient cost of nearly £713 million. This is an increase in cost of 27 per cent over2006.84

8/2/2019 Diabetes in the UK 2011 12
http://slidepdf.com/reader/full/diabetes-in-the-uk-2011-12 15/22
8/2/2019 Diabetes in the UK 2011 12
http://slidepdf.com/reader/full/diabetes-in-the-uk-2011-12 16/22
Diabetes in the UK 2011/2012 Key statistics on diabetes 16
Diabetes care
The National Diabetes Audit 201088 includes the following key findings about the quality of carefor people with diabetes in England and Wales.
Two thirds of people with Type 1 diabetes and almost half of people with Type 2diabetes in England and Wales do not receive all nine annual health checks to managetheir diabetes effectively.
There are big variations in the percentage of patients receiving the care processes. In 19PCTs all nine care processes are completed in more than 60 per cent of patients but intwo PCTs the figure is less than 10 per cent.
Over 800,000 people with diabetes are at high risk of future complications due toglucose control above recommended levels. Nearly 300,000 children and younger adultshave high risk, and some 144,000 dangerously high risk, blood glucose levels that canlead to diabetic complications such as blindness or kidney failure.
Younger people with diabetes aged 16–55 are less likely than older people to receive all
their basic checks.Children and young people with diabetes have the worst rates of very high risk glucosecontrol and of the acute metabolic complication diabetic ketoacidosis (DKA). 9 per centof children and young people with diabetes experienced at least one episode of DKA in2009–2010. There was a large variation in recurrence rates between treatment centres.

8/2/2019 Diabetes in the UK 2011 12
http://slidepdf.com/reader/full/diabetes-in-the-uk-2011-12 17/22
Diabetes in the UK 2011/2012 Key statistics on diabetes 17
Notes
1 International Diabetes Federation (2011). Diabetes atlas, fifth edition: www.diabetesatlas.org Note: These figures are based on what countries report, and the figures will depend on screeningstrategies.
2 Quality and outcomes framework (QOF) 2011:England: http://bit.ly/qof2011e Northern Ireland: http://bit.ly/qof2011ni Scotland: http://bit.ly/qof2011s Wales: http://bit.ly/qof2011w
3 Figures based on AHPO diabetes prevalence model: http://bit.ly/aphodiabetes The APHO model estimates that by 2025 there will be 4,189,229 million people with diabetes inEngland, 371,310 people in Scotland, and 287,929 people in Wales. The model was not used to give a2025 prediction for Northern Ireland so we are using the current APHO model estimate total fordiagnosed and undiagnosed for 2010 of 109,000 [unpublished]. Adding these up gives us theestimate of five million people with diabetes in 2025.
4 This figure was worked out using the diagnosed figure from the 2009 Quality and outcomes framework with figures from the 2010 Quality and outcomes framework :
Quality and Outcomes Framework (QOF) 2009: England: http://bit.ly/qof2009e Northern Ireland: http://bit.ly/qof2009ni Scotland: http://bit.ly/qof2009s Wales: http://bit.ly/qof2009w
5 Figure based on data from AHPO diabetes prevalence model figures http://bit.ly/aphodiabetes and theQOF 2010 figures http://bit.ly/prevalence2010
6 Quality and outcomes framework (QOF) 2011
7 Department of Health (2007). About diabetes http://bit.ly/DHaboutdiab 8 Department of Health (2001). National service framework for diabetes http://bit.ly/NSFdiab
9 The Information Centre (2011). Health Survey for England 2010 http://bit.ly/HSE2010
10 NHS Scotland (2010). Scottish Diabetes Survey 2010 http://bit.ly/SDS2010nhs
11 This breakdown of statistics should be applied to the population of Wales with caution, as it is a selfcompleted questionnaire.Welsh Health Survey 2010 national statistics , chap 3 http://bit.ly/WHS2010
12 This data is based on interviews so the answers are not directly comparable with either the England orWales data. Northern Ireland Health and Social Wellbeing Survey 2005/06 http://bit.ly/tNsFej
13 Royal College of Paediatrics and Child Health (2009). Growing up with diabetes: children and young people with diabetes in England http://bit.ly/growing2009
Warner JT and O’Connell H (2009). Diabetes in children and young people in Wales: prevalence and outcome.
NHS Scotland (2009). Scottish Diabetes Survey 2009 http://bit.ly/sds2009

8/2/2019 Diabetes in the UK 2011 12
http://slidepdf.com/reader/full/diabetes-in-the-uk-2011-12 18/22
8/2/2019 Diabetes in the UK 2011 12
http://slidepdf.com/reader/full/diabetes-in-the-uk-2011-12 19/22
Diabetes in the UK 2011/2012 Key statistics on diabetes 19
33 NHS Scotland (2009). Scottish Diabetes Survey 2008 http://bit.ly/sds2008
34 The Information Centre (2006). Health Survey for England 2004: health of ethnic minorities :
http://bit.ly/hse2004
35 Inkster ME, Fahey TP, Donnan PT et al (2006). Poor glycated haemoglobin control and adversepregnancy outcomes in type 1 and type 2 diabetes mellitus: systematic review of observational studies.BMC Pregnancy and Childbirth, 6, 30
36 Bellamy L, Casas J-P, Hingorani AD et al (2009). Type 2 diabetes mellitus after gestational diabetes: asystematic review and meta analysis. Lancet , 373 (9677) 1773–1779
37 Stratton IM, Adler AI, Neil HAW et al (2000). Association of glycaemia with macrovascular andmicrovascular complications of Type 2 diabetes (UKPDS 35): prospective observational study. BMJ 321;405–412
38 UKPDS Group: UK Prospective Diabetes Study VIII: study design, progress and performance.Diabetologia (1991) 34; 877–90
This is a population diagnosed on average in 1988. However, the UKPDS is still the largest clinicalresearch study of Type 2 diabetes ever conducted. Figures may not be the same now due to greaterawareness of diabetes and screening. Numbers may still be high, as the UKPDS was not based on arandom sample and excluded those with serious complications.
39 Harris MI, Klein R, Welborn TA et al (1992). Onset of NIDDM occurs at least 4-7 years before clinicaldiagnosis. Diabetes Care 15 (7); 815–819
40 Emerging Risk Factors Collaboration (2010). Diabetes mellitus, fasting blood glucose concentration,and risk of vascular disease: a collaborative meta-analysis of 102 prospective studies. Lancet 375
(9733); 2215–2222 41 UK Prospective Diabetes Study (UKPDS) Group (1998). Tight blood pressure control and risk of
macrovascular and microvascular complications in Type 2 diabetes: (UKPDS 38). BMJ 317; 703–713
42 Colhoun HM, Betteridge DJ, Durrington PN et al (2004). Primary prevention of cardiovascular diseasewith atorvastatin in Type 2 diabetes in the Collaborative Atorvastatin Diabetes Study (CARDS):multicentre randomised placebo-controlled trial. Lancet 364 (9435); 685–696
43 UK Prospective Diabetes Study (UKPDS) Group (1998). Intensive blood-glucose control withsulphonylureas or insulin compared with conventional treatment and risk complications in patientswith Type 2 diabetes (UKPDS 33). Lancet 352 (9131); 837–853
44 Morrish NJ, Wang SL, Stevens LK et al (2001). Mortality and causes of death in the WHO multinationalstudy of vascular disease in diabetes. Diabetologia 44 suppl 2; s14–s21
45 Morrish NJ, Wang SL, Stevens LK et al (2001). Mortality and causes of death in the WHO multinationalstudy of vascular disease in diabetes. Diabetologia 44 suppl 2; s14–s21
Data from the American Diabetes Association suggest that deaths from cardiovascular disease arehigher in people with diabetes in America accounting for 65 per cent of diabetes deaths:http://bit.ly/aafp2003
46 Emerging Risk Factors Collaboration (2010). Diabetes mellitus, fasting blood glucose concentration,and risk of vascular disease: a collaborative meta-analysis of 102 prospective studies. Lancet 375
(9733); 2215–2222
47 Jeerakathil T, Johnson JA, Simpson SH et al (2007). Short-term risk for stroke is doubled in personswith newly treated Type 2 diabetes compared with persons without diabetes: a population basedcohort study. Stroke 38 (6); 1739–1743

8/2/2019 Diabetes in the UK 2011 12
http://slidepdf.com/reader/full/diabetes-in-the-uk-2011-12 20/22
Diabetes in the UK 2011/2012 Key statistics on diabetes 20
48 Stratton IM, Adler AI, Neil HAW, et al (2000). Association of glycaemia with macrovascular andmicrovascular complications of Type 2 diabetes (UKPDS 35): prospective observational study. BMJ 321;405–412
49 Department of Health (2006). Turning the corner: improving diabetes care http://bit.ly/turning2006
50 Department of Health (2007). Improving diabetes services: the NSF four years on http://bit.ly/fouryearson
51 Morrish NJ, Wang SL, Stevens LK et al (2001). Mortality and causes of death in the WHO multinationalstudy of vascular disease in diabetes. Diabetologia 44, suppl 2; s14–s21
52 Stratton IM, Adler AI, Neil HAW, et al (2000). Association of glycaemia with macrovascular andmicrovascular complications of Type 2 diabetes (UKPDS 35): prospective observational study. BMJ 321;405–412
53 Hamilton AMP, Ulbig MW, Polkinghorne P (1996). Management of diabetic retinopathy , London: BMJPublishing
There is a lack of current data on blindness and diabetic retinopathy. As screening improves, thenumber of people going blind due to retinopathy may have reduced.
54 Kohner E, Allwinkle J, Andrews J et al (1996). Saint Vincent and improving diabetes care: report of theVisual Handicap Group. Diabetic Medicine 13, suppl 4; s13–s26. There is a lack of current data. Thefigure may have reduced with better screening.
55 Arun CS, Ngugi N, Lovelock L et al (2003). Effectiveness of screening and preventing blindness due todiabetic retinopathy. Diabetic Medicine 20 (3); 186–190
56 Scanlon PH (2008). The English national screening programme for sight threatening diabeticretinopathy. Journal of Medical Screening 15 (1); 1–4
57 Scanlon PH (2008). The English national screening programme for sight threatening diabeticretinopathy. Journal of Medical Screening 15 (1); 1–4
58 Ederer F & Taylor HR (1981). Senile lens changes and diabetes in two population studies. American Journal Of Opthalmology , 91, 3, 381–385
59 Stratton IM, Adler AI, Neil HAW, et al (2000). Association of glycaemia with macrovascular andmicrovascular complications of Type 2 diabetes (UKPDS 35): prospective observational study. BMJ 321;405–412
60 Amputee Statistical Database for the United Kingdom (2007). Lower limb amputations
61 Yorkshire and Humber Public Health Observatory (2011). Email and verbal communication, usingHospital Episode Statistics data 2007–2010
62 Abbott CA, Vileikyte L, Williamson S et al (1998). Multicenter study of the incidence of and predictiverisk factors for diabetic neuropathic foot ulceration. Diabetes Care 21 (7); 1071–1075
63 National Diabetes Support Team (2006). Diabetic foot guide http://bit.ly/ndst2006
64 Boulton AJM. Foot problems in patients with diabetes, in Holt RIG, Cockram CS, Flyvbjerg A et al (ed.)Textbook of diabetes , 4th edition. Oxford: Wiley-Blackwell
65 Singh B et al (2006). Research presented at the Diabetes UK Annual Professional Conference.
This matches figures found in US studies:

8/2/2019 Diabetes in the UK 2011 12
http://slidepdf.com/reader/full/diabetes-in-the-uk-2011-12 21/22
Diabetes in the UK 2011/2012 Key statistics on diabetes 21
Schofield CJ, Libby G, Brennan GM et al (2006). Mortality and hospitalization in patients, afteramputation: a comparison between patients with and without diabetes. Diabetes Care 29 (10); 2252–
2256
66 Katon W, von Korff M, Ciechanowski P et al (2004). Behavioral and clinical factors associated with
depression among individuals with diabetes. Diabetes Care 27; 914–920
This study was conducted on a population in Washington State.
67 Stratton IM, Adler AI, Neil HAW, et al (2000). Association of glycaemia with macrovascular andmicrovascular complications of Type 2 diabetes (UKPDS 35): prospective observational study. BMJ 321;405–412
68 Boule NG, Haddad E, Kenny GP et al (2001). Effects of exercise on glycaemic control and body mass inType 2 diabetes: a meta analysis of controlled clinical trials. JAMA 286; 1218–1227
69 Connor H, Annan F, Bunn E et al (2003). The implementation for nutritional advice for people withdiabetes. Diabetic Medicine 20; 786–807
70 Boulton AJM (2005). Management of diabetic peripheral neuropathy. Clinical Diabetes 23; 9–15. Thisfigure is based on four different studies in which estimates of neuropathy range from 66 per cent inpeople with Type 1 diabetes over 60 years of age to 41.6 per cent in people who been diagnosed forover seven years.
71 Daousi C et al (2004). Chronic painful peripheral neuropathy in an urban community: a controlledcomparison of people with and without diabetes. Diabetic Medicine 21 (9); 976–982
72 Malavige LS & Levy JC (2009). Erectile dysfunction in diabetes mellitus. Journal of Sexual Medic ine 6(5); 1232–1247
73 Enzlin P, Mathieu C, Van den Bruel A et al (2003). Prevalence and predictions of sexual dysfunction in
patients with Type 1 diabetes. Diabetes Care 26; 409–414
74 Taylor R & Davison JM (2007). Type 1 diabetes and pregnancy, BMJ 334 (7596); 742–745
75 CEMACH (2004). Maternity services in 2002 for women with Type 1 and Type 2 diabetes http://bit.ly/cemach2004
76 CEMACH (2005). Pregnancy in women with Type 1 and Type 2 diabetes in 2002-2003, England,Wales and Northern Ireland :http://bit.ly/cemach2005
77 CEMACH (2007). Diabetes in pregnancy: are we providing the best care? Findings of a national enquiry http://bit.ly/cemach2007
78 Roglic G, Unwin N, Bennett PH et al (2005). The burden of mortality attributable to diabetes: realisticestimates for the year 2000. Diabetes Care 28; 2130–2135
79 Information Centre (2011) National diabetes Audit (NDA) Mortality Analysis 2007-2008 http://bit.ly/NDAmort
80 Department of Health (2001). National service framework for diabetes: standards .http://bit.ly/nsf2001a
81 Department of Health (2006). Turning the corner: improving diabetes care
http://bit.ly/turning2006
82 NHS Confederation (2007). Key statistics on the NHS

8/2/2019 Diabetes in the UK 2011 12
http://slidepdf.com/reader/full/diabetes-in-the-uk-2011-12 22/22
83 NDST (2005). National Diabetes Support Team fact sheet: no 10: Working together to reduce length of stay for people with diabetes .http://bit.ly/ndst2005
84 The Health and Social Care Information Centre (2011). Prescription cost analysis
England 2010 http://bit.ly/pcae2010
85 Sampson MJ, Doxio N, Ferguson B et al (2007). Total and excess bed occupancy by age, speciality andinsulin use for nearly one million diabetes patients discharged from all English acute hospitals. Diabetes Research and Clinical Practice 77 (1); 92–98
86 Sampson MJ, Crowle T, Dhatariya K et al (2006). Trends in bed occupancy for inpatients with diabetesbefore and after the introduction of a diabetes inpatient specialist nurse service. Diabetic Medicin e 23(9); 1008–1115
87 Kings Fund et al (2000). Tardis: Type 2 diabetes: accounting for major resource demand in society in the UK
88 The NHS Information Centre (2011). The National Diabetes Audit Executive Summary 2009 – 2010


