Page 1
ORIGINAL ARTICLE
Diagnosis of landslide risk for individual buildings:insights from Prahova Subcarpathians, Romania
Iuliana Armas
Received: 3 January 2012 / Accepted: 6 October 2013 / Published online: 17 October 2013
� Springer-Verlag Berlin Heidelberg 2013
Abstract The aim of this study is to quantify the land-
slide risk for individual buildings using spatial data in a
GIS environment. A landslide-prone area from Prahova
Rivers’ Subcarpathian Valley was chosen because of its
associated landslide hazards and its impact upon human
settlements and activities. The bivariate landslide suscep-
tibility index (LSI) was applied to calculate the spatial
probability of landslides occurrence. The Landslide Sus-
ceptibility Index map was produced by numerically adding
the weighted thematic maps for slope gradient and aspect,
water table, soil texture, lithology, built environment and
land use. Validation curves were obtained using the ran-
dom-split strategy for two combinations of variables: (a) all
seven variables and (b) three variables which showed
highest individual success rates with respect to landslides
occurrences (slope gradient, water table and land use). The
principal pre-disposing factors were found to be slope
steepness and groundwater table. Vulnerability was estab-
lished as the degree of loss to individual buildings resulting
from a potential damaging landslide with a given return
period in an area. Risk was calculated by multiplying the
spatial probability of landslides by the vulnerability for
each building and summing up the losses for the selected
return period.
Keywords Specific risk analysis � Landslides
susceptibility � Bivariate statistical method � Building
stock vulnerability � Prahova Subcarpathians
Introduction
Landslides are related to erosion-prone areas, being com-
mon processes in mountainous or hilly regions with steep,
unstable slopes. There is evidence to proof that landslides
have the biggest impact on human communities and on
natural ecosystems (e.g., Alexander 1991, 2000; Schuster
1995; Schuster and Fleming 1986; U.S. Geological Survey
1997).
It was estimated that about 1 % of lives lost in natural
catastrophes between 1991 and 2005 can be attributed to
landslides, with an average of approximately 20 landslide
disasters occurring each year (EM-DAT 2010).
From a legislative point of view, only four European
countries have official landslide risk assessment method-
ologies (France, Italy, Sweden, and Switzerland). Romania
has a general framework of risk policy, but does not have
an official landslide Risk Assessment Methodology.
In Romania, during 1974–2006, the proportional distri-
bution of the different hazards shows that landslides rep-
resent only 1 %, affecting over 1,000,000 ha, of which
700,000 ha is agricultural land (EM-DAT 2010). Most
landslide-prone areas are located in the Subcarpathian area
and the Carpathian Flysch.
Landslide risk is commonly defined in literature as the
expected level of damage to property, disruption of eco-
nomic activity, and the probable number of lives lost and/or
persons injured due to a particular landslide hazard for a
given area and reference period (Varnes 1984). In a quan-
titative way, this specific risk is calculated as the product of
probability (spatial and temporal probability of occurrence
of a landslide with a given magnitude), vulnerability (the
degree of damage of the element at risk due to the occur-
rence of a landslide with a given magnitude) and damage
potential of the elements at risk. In recent years, the interest
I. Armas (&)
Faculty of Geography, University of Bucharest, Balcescu Bd. 1,
010041 Bucharest, Romania
e-mail: [email protected]
123
Environ Earth Sci (2014) 71:4637–4646
DOI 10.1007/s12665-013-2854-5
Page 2
in this topic has increased greatly and many approaches
have been developed worldwide. Advances in GIS tech-
nology and the statistical tools have led to the growing
application of quantitative techniques for assessing land-
slide risks. Overview publications on GIS-based landslide
susceptibility assessment and risk methods have been
published by Yin and Yan (1988), Carrara et al. (1991,
1995, 1999), Chung et al. (1995), Soeters and van Westen
(1996), Atkinson and Massari (1998), Aleotti and Chow-
dhury (1999), Guzetti et al. (1999), Guzzetti (2002), Clerici
et al. (2002), Dai et al. (2002), van Westen (2004), van
Westen et al. (1997, 1999, 2006).
In this paper we discuss an applied investigation related
to the landslide risk assessment in human settlements,
based on a landslide-prone area along a Subcarpathian
Valley from Romania.
In particularly, this study stresses the investigation of
landslide risk to individual buildings based on the quanti-
tative risk equation (Eq. 1).
To support the research, the bivariate landslide suscep-
tibility index was used aiming to predict the landslides
occurrence, as well as vulnerability and risk approaches.
Landslides were defined as the gravitational movement of a
mass of rock, debris or earth down a slope (e.g., Cruden
1991; Cruden and Varnes 1996).
The following topics describe the geological/morpho-
logical characteristics of our research area and its related
landslide dynamic features as well as the methodological
advance. In the end, the paper presents/discusses the results
and conclusions of our study.
Study area
The study area is situated between 45�0802400N and
45�1002300N latitudes and 25�4103000E and 25�4302500Elongitudes, laying 100 km north of the Romanian capital
city, in the Prahova Subcarpathians (Fig. 1).
Fig. 1 Study area. Location
and geomorphological
background
4638 Environ Earth Sci (2014) 71:4637–4646
123
Page 3
The area is located in the southern part of the Breaza
syncline. The northern fringe of the studied area is shaped
in loamy flysch from the facies of Pucioasa Series–Fusaru
sandstone, outcropping in the left slope of Prahova Valley
(Oligocene–Lower Miocene) (Mutihac 1990). In the
southern shank of the syncline, on the left bank of Prahova
Valley, in a 60–80 m wall Brebu conglomerates of Burd-
igalian age, are outcroping (Spataru and Trasnea 1993).
In a sedimentary continuity, the Ribbed Suite (Burdi-
galian–Lower Badenian) is present in the study area with a
thickness of about 650–700 m. The Ribbed Suite is formed
by pelites (60–70 %), which interfere with mica sandstone,
with fine or medium clast rocks. Especially in the left limb
of the syncline, appear gypsum-ferrous marls with small
interlayers or nodules of gypsum, and, in the upper region
of the shank, appear fine yellowish calcareous slate and
levels of green-white tuff, 4–5 m thick.
South of Breaza fault, the Upper Palaeogene deposits
appear to date.
The stepped topography is characteristic for this area
(Fig. 1). The highest reference surface is represented by a
ridge that descends gradually in altitude on a northwest–
southeast direction, from 664 to 500 m. A glacis with a
250–750 m width, a relative altitude of 25–70 m and with a
10–20 % slope in its forehead is shaped at the base of the
ridge. The glacis overlay the bench of Cornu terrace that
slightly descends from 550 to 440 m. 20 % of the study
area is represented by the slope surfaces affected mostly by
translational landslides.
The landscape change due to the increasing human
pressure in this area after 1950, has led to the continuous
extension of built space, especially in the slope area (Armas
and Manea 2002). A consequence of this fact was the reac-
tivation of the landslides through man-made activities such
as slope excavation and loading, land use changes, strong
vibrations or water leakage from utilities (Armas et al.
2003). Some of the most recent events were the landslides
from 21.04.2010 or 11.02.2011. For example, in the Febru-
ary 2011 event, more than 400 m2 were affected, including
the road between the two parts of Cornu’s village, blocking
also a small tributary, due to the landslide rock mass.
Method
In this study, the risk assessment for individual buildings
was calculated accordantly with the basic quantitative risk
equation:
Risk ¼ Hazard Hð Þ � Vulnerability Vð Þ� Amount of elements at risk Að Þ ð1Þ
The term ‘hazard’ in the general risk equation represents
the temporal probability of a landslide event (e.g. the
annual probability/return period) in a given area (e.g. the
spatial probability). The temporal probability of the
surveyed landslides was calculated based on the
correlations between daily rainfalls in the last 15 years
and landslides reactivation according to historical
information.
The spatial probability of landslides occurrence was
calculated from the susceptibility map. In this study, we
applied the bivariate index method in landslide sus-
ceptibility mapping (LSI). LSI is a bivariate statistical
approach that compares the spatial distribution of
landslides with each individual factor that is being
considered. In the last decades, the bivariate statistical
approach developed initially by Yin and Yan (1988)
and van Westen (1997) has been successfully employed
by researchers mapping landslide susceptibility all over
the world (Cevik and Topal 2003; Mehmet and Doyu-
ran 2004; Yaclin 2008; Kelarestaghi and Ahmadi 2009;
Nandi and Shakoor 2009; Bai et al. 2009; Thaiyuen-
wong and Maireang 2010). The most considered factors
for the bivariate method were slope, distance from
rivers, distance from human settlements and distance
from roads.
The LSI method requires the following steps, systema-
tised after Aleotti and Chowdhury (1999):
• Selection and mapping of significant factors and their
categorisation into a number of relevant classes
• Landslide mapping
• Overlay mapping of the landslide map with each pre-
disposing factor map
• Determination of density of landslides in each factor
class and assignment of weighting values to the various
factor maps according to the formula:
Wi ¼ ln Dclas=Dmap
� �
¼ ln Area Lið Þ=Area Nið Þ.X
Area Lið Þ.X
Area Nið Þh i
ð2Þ
where, Wi = the weight given to a certain parameter class
(e.g. a slope class or aspect class), Dclas = the landslide
density within the parameter class, Dmap = the landslide
density within the entire map, Area (Li) = area, which
contain landslides, in a certain parameter class, Area
(Ni) = total area in a certain parameter class.
We used the natural logarithm to emphasis negative
weights when the landslide density is lower than normal
and positive when it is higher than normal.
• Final overlay mapping and calculation of the final
susceptibility values
• Reclassification of the final susceptibility map accord-
ing to the histogram values
• Validation test
Environ Earth Sci (2014) 71:4637–4646 4639
123
Page 4
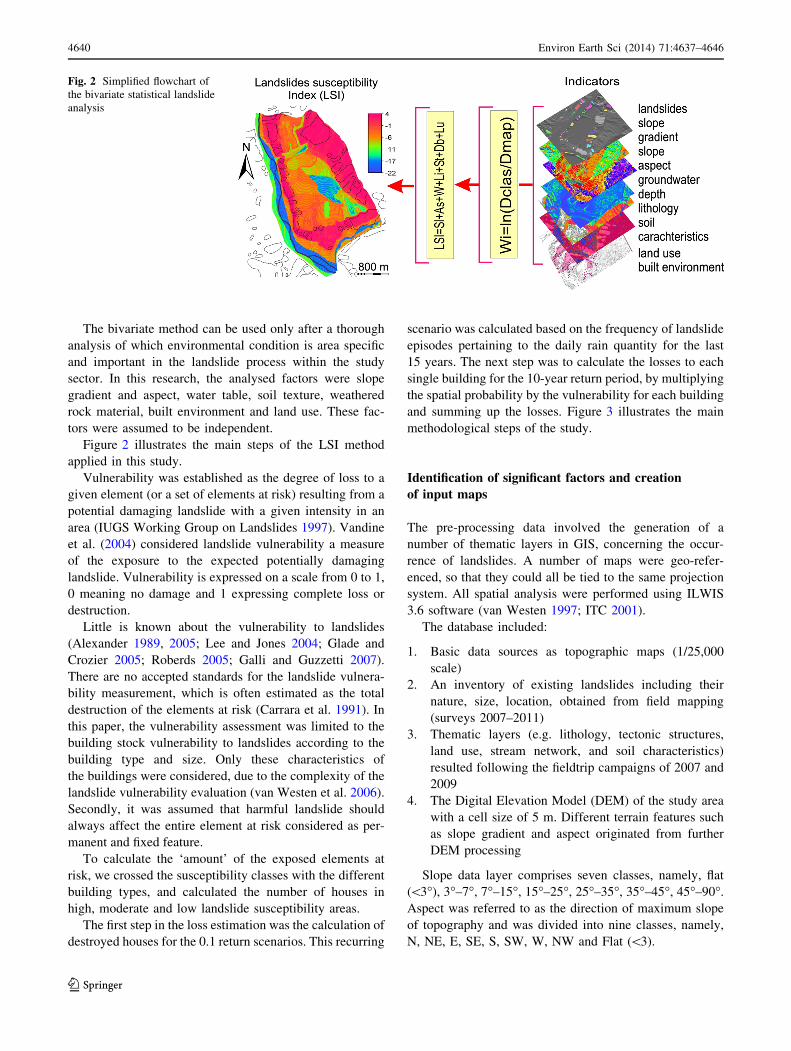
The bivariate method can be used only after a thorough
analysis of which environmental condition is area specific
and important in the landslide process within the study
sector. In this research, the analysed factors were slope
gradient and aspect, water table, soil texture, weathered
rock material, built environment and land use. These fac-
tors were assumed to be independent.
Figure 2 illustrates the main steps of the LSI method
applied in this study.
Vulnerability was established as the degree of loss to a
given element (or a set of elements at risk) resulting from a
potential damaging landslide with a given intensity in an
area (IUGS Working Group on Landslides 1997). Vandine
et al. (2004) considered landslide vulnerability a measure
of the exposure to the expected potentially damaging
landslide. Vulnerability is expressed on a scale from 0 to 1,
0 meaning no damage and 1 expressing complete loss or
destruction.
Little is known about the vulnerability to landslides
(Alexander 1989, 2005; Lee and Jones 2004; Glade and
Crozier 2005; Roberds 2005; Galli and Guzzetti 2007).
There are no accepted standards for the landslide vulnera-
bility measurement, which is often estimated as the total
destruction of the elements at risk (Carrara et al. 1991). In
this paper, the vulnerability assessment was limited to the
building stock vulnerability to landslides according to the
building type and size. Only these characteristics of
the buildings were considered, due to the complexity of the
landslide vulnerability evaluation (van Westen et al. 2006).
Secondly, it was assumed that harmful landslide should
always affect the entire element at risk considered as per-
manent and fixed feature.
To calculate the ‘amount’ of the exposed elements at
risk, we crossed the susceptibility classes with the different
building types, and calculated the number of houses in
high, moderate and low landslide susceptibility areas.
The first step in the loss estimation was the calculation of
destroyed houses for the 0.1 return scenarios. This recurring
scenario was calculated based on the frequency of landslide
episodes pertaining to the daily rain quantity for the last
15 years. The next step was to calculate the losses to each
single building for the 10-year return period, by multiplying
the spatial probability by the vulnerability for each building
and summing up the losses. Figure 3 illustrates the main
methodological steps of the study.
Identification of significant factors and creation
of input maps
The pre-processing data involved the generation of a
number of thematic layers in GIS, concerning the occur-
rence of landslides. A number of maps were geo-refer-
enced, so that they could all be tied to the same projection
system. All spatial analysis were performed using ILWIS
3.6 software (van Westen 1997; ITC 2001).
The database included:
1. Basic data sources as topographic maps (1/25,000
scale)
2. An inventory of existing landslides including their
nature, size, location, obtained from field mapping
(surveys 2007–2011)
3. Thematic layers (e.g. lithology, tectonic structures,
land use, stream network, and soil characteristics)
resulted following the fieldtrip campaigns of 2007 and
2009
4. The Digital Elevation Model (DEM) of the study area
with a cell size of 5 m. Different terrain features such
as slope gradient and aspect originated from further
DEM processing
Slope data layer comprises seven classes, namely, flat
(\3�), 3�–7�, 7�–15�, 15�–25�, 25�–35�, 35�–45�, 45�–90�.
Aspect was referred to as the direction of maximum slope
of topography and was divided into nine classes, namely,
N, NE, E, SE, S, SW, W, NW and Flat (\3).
Fig. 2 Simplified flowchart of
the bivariate statistical landslide
analysis
4640 Environ Earth Sci (2014) 71:4637–4646
123
Page 5
After the creation of the primary layers, various
advanced GIS techniques such as vector to raster conver-
sion, reclassification, filtering, distance operations and
raster calculations were applied.
LSI index was obtained by adding all the LSI individual
maps obtained by the statistical correlation of the landslide
map with the different factor maps. Weights were derived
from densities in each attribute class within each factor (see
‘‘Method’’).
More details on methodology for calculating the LSI
index can be found in van Westen (1997), Suzen and
Doyuran (2004), Armas (2011).
Next we calculated the risk at individual building levels,
based on the general Risk formula (Eq. 1).
The analysis was done only on the basis of the new
constructions—built after 1990—because before this year
houses were built traditionally only on the bridge of the
terraces, with no vulnerability to landslides. After 1990,
and especially after the year 2000, houses were built on
vulnerable slopes, exposed to the risk of sliding. New
buildings were mapped in the summer of 2008 with the
GPS, together with information on the structure, material
of construction, number of floors, land use, utilities and
type of property.
The risk analysis was made on the number of present
new buildings in high, moderate and low landslide sus-
ceptibility classes, according to the building type: auto-
claved aerated concrete (AAC), AAC and brick, brick,
wood, reinforced concrete, and size: small (bungalows),
medium (one to two floors) and large buildings (over two
floors) Table 1.
Results
The resulted weight values obtained from the LSI analysis
for each factor class are shown in Table 2.
Highest weights were registered in case of higher slope
gradient and low groundwater table. The values obtained
were in good agreement with the field observations.
Regarding the groundwater table, the measurements
made to over 40 wells and in over 30 bore holes (Parichi
et al. 2006a, b, 2008) showed that this is quartered at dif-
ferent depths as follows: between 0.51 and 1.0 m depth in
the Prahova and Campinita floodplain, between 1 and 2 m
in the floodplain terrace, and at greater depths (2 and over
10 m) in the terrace bench and glacis.
The groundwater table deepens significantly (to over
10 m, even 16 m) only in the area of the terrace bench, on
which Cornu locality was built.
The analysis of the weathered rock deposits reveals high
values of the ‘in situ’ (eluvia, carbonate or fine-grained
siliciclasts) material resulting from weathering and/or
Fig. 3 Flowchart of the
analytical process
Table 1 Pressure on land caused by human activities (1984, 2000
and 2008)
Human pressure index (ha/inhabitant)
Agricultural land use
Arable Pasture and meadow
1984 2000 2008 1984 2000 2008
0,073 0,075 0,07 0,166 0,154 0,147
Source: Prahova County’s Directory of Statistics
Environ Earth Sci (2014) 71:4637–4646 4641
123
Page 6
physical disintegration acting on the interfluves, where the
landslide scarps advance progressively.
The soil mapping demonstrates that the largest part of
the soils (73 %) show a middle texture (clayey sand to
clay), as well as high values of landslide susceptibility
(Parichi et al. 2006, 2006–2007, 2008).
Weights were assigned to the classes of each thematic
layer, respectively, to produce weighted thematic maps
(Fig. 2). The Landslide Susceptibility Index map (LSI) was
produced by numerically adding the weighted thematic
maps, according to Eq. (3).
LSI ¼ Sl þ As þ W þ Li þ St þ Dbþ Lu; ð3Þ
where Sl, As, W, Li, St, Db and Lu are distribution-derived
weights for slope, aspect, groundwater depth, lithology,
soil texture, distances from built environment and land use,
respectively.
The spatial analysis shows the presence of two sectors
with maximum values of landsliding susceptibility: the
slopes of the upper terraces and the dens gullies frag-
menting the slope of the second terrace (Fig. 4).
For validation of the model, the landslides in the study
area were split into an analysis and a validation group and
the analysis was repeated.
The success rate is calculated by decreasing order of
pixels in the susceptibility map, on intervals based on the
histogram frequency values. Landslide inventory map was
overlapped with the LSI map and a common frequency was
calculated. The validation curve indicates what percentage
of the total number of slides occur in areas with the highest
rates of susceptibility of pixels on LSI map. The higher the
percentage of landslide occurrence in most susceptible
pixels, the better is the predictability of the model (Re-
mondo et al. 2003).
Figure 5a, b show validation curves obtained using the
random-split strategy for two combinations of variables:
(a) all seven variables and (b) three variables which
showed highest individual success rates with respect to
landslides occurrences (slope gradient, water table and land
use). The principal pre-disposing factor was found to be
slope steepness (99 % of landslides in the validation
sample fall in the highest susceptibility classes), followed
by groundwater table and land use. Slope aspect showed no
relation to the landslide occurrence. This fact could be also
explained through the general uniform western exposition
of slopes in the study area.
Figure 5a shows that almost 90 % of landslides in the
validation sample fall on pixels corresponding to the 45 %
of the study area with the highest susceptibility. Curve ‘b’
has a slightly better prediction rate with respect to land-
slides occurrences.
To derive the risk map, the susceptibility map was
combined with the vulnerability information of the
Table 2 Distribution of weight values (Wi) obtained from the LSI
analysis
Data layers Parameter classes Landslidearea (%)
Weights
Slope angle 0–3� 1 -2.67
3–7� 10 -0.27
7–15� 25 0.62
15–25� 21 0.43
25–35� 18 0.28
35–45� 15 0.08
45–90� 10 -0.34
Slope aspect NE 13 0.07
E 14 0.30
SE 15 0.24
S 6 -1.18
SV ? flat 15 0.20
V 14 0.19
NV 14 0.32
N 9 0.56
Groundwatertable
1–2 m 1 -2.55
1.5–2.5 m 8 -0.74
2–3 m 1 -6.31
2.5–3.5 m 6 -1.10
2–5 m 35 0.75
3.5–5.5 m 5 -1.27
5.5–10 m 3 -1.77
6–11 m 4 -3.97
Over 11 m 1 -7.41
Various depths (in the landslidebody)
36 0.79
Weathered rockmaterial
Torrential bed-loads 3 -1.73
Prahova and Campinita river-beds
10 -7.41
‘‘In situ’’ (eluvia, carbonate orfine-grained siliciclastic)material
7 0.31
Floodplain and terrace gravels 25 -1.23
Fine-grained deluvial-colluvialmaterial of the terrace IIglacis
19 -0.86
Terrace scarps 36 0.89
Soil texture Middle texture (clayey sand toclay)
73 1.19
Clay (terrace II glacis) 8 -2.16
Clayey sandy and sandy clay 15 -1.34
Various textures in thefloodplain
4 -7.41
Distances tobuiltenvironment
0–20 m 4 -1.20
20–50 m 11 -0.28
50–100 m 25 0.43
100–150 m 18 0.54
150–200 m 17 0.53
200–300 m 12 0.32
300–500 m 9 0.20
500–1,000 m 5 -0.16
Land use Prahova meadow 0 -12.2
Households/gardens/ 8 -0.93
Forests 35 0.43
Hay field/shrubs 57 0.92
4642 Environ Earth Sci (2014) 71:4637–4646
123
Page 7
elements at risk. All of the over 300 new buildings ana-
lysed in this study have a residential function. Most
buildings are brick buildings (40 %), 17 % laying in the
high susceptibility class. Houses of the AAC type are the
second frequent building type in this area (31 % of all
buildings), 23 % of them laying in the high susceptibility
class. Although wooden and brick houses are traditional
building types for this Subcarpathian sector, newer con-
structions are of the ACC type because they are cheap and
have flexible wall construction blocks.
Figure 6 shows in a cumulative histogram the sus-
ceptibility class of each building type. Referring to the
general Risk formula (Eq. 1) the amount (A) represents
the number of buildings in different susceptibility
classes.
The hazard occurrence probability is expressed by the
spatial and temporal probability of landslides occurrence.
Because a complete historic record of landslide occur-
rences is absent, we used interviews to obtain information
about landslide activity. Unfortunately, we could not cover
a period of 15–20 years based on over 50 interviews with
local people. The analysis made on a 15-year period
(1990–2005) between the daily quantity of precipitations
and the start of gliding processes, showed a 10-year mean
return period of landslides reactivation. The annual land-
slide probability was estimated by multiplying the temporal
probability (1/return period for annual probability) with the
spatial susceptibility (e.g. the spatial distributed return
probability of a landslide to affect a building).
Table 3 shows the chance of occurrence of a landslide at
each location.
The building’s landslide vulnerability was considered as
being 1 in the case of complete destruction after a landslide
event. The estimation of landslide’s vulnerability is very
complex and necessitates data on the building type and
dimensions, as well as the expected landslide size and
speeds (van Westen et al. 2006).
The result was an annual risk of about three houses
located within high susceptibility areas that could be
affected by landslides and completely destroyed (vulnera-
bility is assumed to be 1). Equally, this value was divided
by brick houses and the AAC building type.
In estimating individual building vulnerability, the
damage percentages were calculated as a function of the
building type and size (e.g. number of floors). Table 4
presents the assigned value of vulnerability based on the
type of building material and building’s size. We defined
three classes: small (bungalows), medium (one to two
floors) and large buildings (over two floors).
Each building, based on its susceptibility class, was
assigned a spatial probability of a landslide occurrence.
The information showing that a landslide will strike a
particular part of a building is very important when cal-
culating the risk to landslides for individual buildings. The
next step was to calculate the losses for the 10-year return
period scenario, based on the equation: R ¼ H � V .
Each building contributes with its losses in the general
amount of losses, which is expressed in the number of
buildings lost for the 10-year return scenario. For all sus-
ceptibility levels there are five houses that could be lost.
The areas with the highest individual risk levels are located
on the steep and vulnerable slopes (Fig. 7).
Conclusions
The landslide risk assessment undertaken here represents
the first to follow an internationally recognised quantitative
Fig. 4 Landslide susceptibility map. a susceptibility weights; b sus-
ceptibility classes
Environ Earth Sci (2014) 71:4637–4646 4643
123
Page 8
landslide risk assessment methodology applied to calculate
the landslide risk for individual buildings in a hilly area
from Romania.
Firstly, the most important aspects sought through this
research were to properly define disaster prone areas and to
weight up the spatial probability of a landslide occurring at
the location of a building. This value derived from the
landslide density within a susceptibility class. To calculate
the landslides susceptibility classes, the bivariate statistical
method was applied, which is suited for local or regional-
scale landslide susceptibility mapping.
The use of this statistical method has also a number of
drawbacks. Some of the most important are the simplifi-
cation and generalisation of conditional factors throughout
the study area. Another conclusion derived from the vali-
dation method used in this study is that an increase in the
number of variables included in the LSI analysis does not
necessarily increase the quality of the model.
Fig. 5 Landslide samples a and
b. Validation curves: all
variables (a); slope gradient,
groundwater table and land use
(b). The percentage of predicted
landslides was ordered from
high to low susceptibility values
0%
20%
40%
60%
80%
100%
1 2 3 4 5
Fig. 6 Cumulative histogram of building types in susceptibility
classes: 1 AAC and brick, 2 AAC, 3 reinforced concrete, 4 brick, 5
wood
Table 3 Landslides density within landslides susceptibility classes
Susceptibility class Area in the
susceptibility
classes
Landslides (% of
susceptibility areas)
Spatial probability of landslides
occurrence (cumulative landslide
area/susceptibility class areas)
Hazard for the
annual probability
of 0.1
[0 (low) 189,900 2.91 0 0
0–2.5 (moderate) 302,700 4.61 0.5 0.05
2.5–5 (high) 898,800 13.77 0.8 0.08
Table 4 Vulnerability of buildings according to building type and
size
Building material Building size
Small Medium Large
AAC 1.0 0.9 0.9
Brick 1.0 0.8 0.7
Wood 0.4 0.5 0.6
Concrete 0.6 0.5 0.4
AAC ? brick 1.0 0.9 0.9
4644 Environ Earth Sci (2014) 71:4637–4646
123
Page 9
Secondly, this paper has provided new information on
the individual building risk estimation to landslides based
on the quantitative risk formula.
If the buildings continue to be developed on the hill
slopes, the risk of landslide occurrence will increase.
Therefore, landslide risk management should become a key
factor to be considered by risk mitigation strategies for the
protection of human life and property.
This case study is only an initial step in the complex
process of risk mitigation. We are aware that the man-
agement of slope instability/landslides has the potential to
become efficient only in connection with the real world of
land use planning.
Acknowledgments This research was partially supported by the
National Research Council (CNCS) of Romania through the project
No. 2916/31 GR, having Prof. I. Armas as principal investigator. The
author wishes to express sincere thanks to the two anonymous ref-
erees who provided constructive comments on the manuscript and
helped in improving the paper.
References
Aleotti P, Chowdhury R (1999) Landslide hazard assessment:
summary review and new perspective. Bull Eng Geol Environ
58:21–44
Alexander DE (1989) Urban landslides. Prog Phys Geog 13:157–191
Alexander DE (1991) Applied geomorphology and the impact of
natural hazards on the built environment. Nat Hazards
4(1):57–80
Alexander DE (2000) Confronting catastrophe—new perspectives on
natural disasters. Oxford University Press, Oxford
Alexander DE (2005) Vulnerability to landslides. In: Glade T,
Anderson MG, Crozier MJ (eds) Landslide risk assessment.
Wiley, New York, pp 175–198
Armas I (2011) An analytic multicriteria hierarchical approach to
assess landslide vulnerability. Case study: Cornu village, Sub-
carpathian Prahova Valley/Romania. Zeitschrift fur. Geomor-
phologie 55(2):209–229
Armas I, Manea G (2002) Artificializarea peisajului si vulnerabili-
tatea terenurilor la alunecari ın sectorul subcarpatic al vaii
Prahova. Comunicari de Geografie, VI
Armas I, Damian R, Sandric I, Osaci-Costache G (2003) Vulnera-
bilitatea versantilor subcarpatici la alunecari de teren (Valea
Prahovei), Ed. Fundatiei Romania de Maine, Bucuresti
Atkinson PM, Massari (1998) Generalised linear modelling of
susceptibility to landsliding in the central Apennines, Italy.
Comput Geosci 24:373–385
Bai SB, Wang J, Lu GN, Zhou PG, Hou SS, Xu SN (2009) GIS-based
and data-driven bivariate landslide-susceptibility mapping in the
Three Gorges area, China. Pedosphere 19(1):14–20
Carrara A, Cardinali M, Detti R, Guzzetti F, Pasqui V, Reichenbach P
(1991) GIS techniques and statistical models in evaluating
landslide hazard. Earth Surf Processes Landf 16:427–445
Carrara A, Cardinali M, Guzzetti F, Reichenbach P (1995) GIS
technology in mapping landslide hazard. In: Carrara A, Guzetti F
(eds) Geographical information systems in assessing natural
hazards. Kluwer, Dordrecht, pp 135–176
Carrara A, Guzzetti F, Cardinali M, Reichenbach P (1999) Use of GIS
technology in the prediction and monitoring of landslide hazard.
Nat Hazards 20:117–135
Cevik E, Topal T (2003) GIS-based landslide susceptibility mapping
for a problematic segment of the natural gas pipeline, Hendek
(Turkey). Environ Geol 44:949–962
Chung CF, Fabbri AG, van Westen CJ (1995) Multivariate regression
analysis for landslide hazard zonation. In: Carrara A, Guzetti F
(eds) Geographical information systems in assessing natural
hazards. Kluwer, Dordrecht, pp 107–133
Clerici A, Perego S, Tellini C, Vescovi P (2002) A procedure for
landslide susceptibility zonation by the conditional analysis
method. Geomorphology 48:349–364
Cruden DM (1991) A simple definition of a landslide. Bull Eng Geol
Environ 43(1):27–29. doi:10.1007/BF02590167 ISSN 1435-9529
Cruden DM, Varnes DJ (1996) Landslide types and processes. In:
Turner AT, Schuster RL (eds) Landslides—investigation and
mitigation. Transportation research board special report no. 247.
National Academy Press, Washington, pp 36–75
Dai FC, Lee CF, Ngai YY (2002) Landslide risk assessment and
management overview. Eng Geol 64:65–87
EM-DAT (2010) The international disaster database, centre for
research on epidemiology of disasters—CRED. www.emdat.be
(accessed 10 September 2010)
Galli M, Guzzetti F (2007) Landslide vulnerability criteria: a case
study from Umbria, Central Italy. Environ Manag 40:649–664
Glade T, Crozier MJ (2005) The nature of landslide hazard impact. In:
Glade T, Anderson MG, Crozier MJ (eds) Landslide hazard and
risk. Wiley, New York, pp 43–74
Guzetti F, Carrarra A, Cardinali M, Reichenbach P (1999) Landslide
hazard evaluation: a review of current techniques and their
application in a multiscale study, Central Italy. Geomorphology
31:181–216
Guzzetti F (2002) Landslide hazard assessment and risk evaluation:
limits and prospectives. In: Proceedings of the fourth EGS
Plinius Conference held at Mallorca, Spain, October 2002
ITC (2001) ILWIS 3.0 Academic—user’s guide. ITC, Enschede,
Netherlands
IUGS Working Group on Landslides, committee on risk assessment
(1997) Quantitative risk assessment for slopes and landslides –
Fig. 7 The specific risk for each construction
Environ Earth Sci (2014) 71:4637–4646 4645
123
Page 10
The state of the art, In: Proceedings of International Workshop
on Landslide Risk Assessment, Honolulu
Kelarestaghi A, Ahmadi H (2009) Landslide susceptibility analysis
with a bivariate approach and GIS in northern Iran. Arb J Geosci
2:95–101
Lee EM, Jones DKC (2004) Landslide risk assessment. Thomas
Telford, London, 256 p
Mehmet SL, Doyuran V (2004) A comparison of the GIS based
landslide susceptibility assessment methods: multivariate versus
bivariate Environ Geol 45:665–679
Mutihac V (1990) Structura geologica a teritoriului Romaniei, Ed.
Tehnica, Bucuresti
Nandi A, Shakoor A (2009) A GIS-based landslide susceptibility
evaluation using bivariate and multivariate statistical analyses.
Eng Geol 110:11–20
Parichi M, Armas I, Stanila L, Popa R (2006–2007) Studiul
pedogeografic al teritoriului Cornu, TERRA XXXVI-XXXVII:
59–73
Parichi M, Armas I, Fl Vartolomei (2006) Evaluari pedologice si
morfodinamice pe valea Prahovei subcarpatice. An Spiru Haret
9:103–111
Parichi M, Armas I, Vartolomei Fl (2008) Informatia pedologica ın
evaluarea susceptibilitatii versantilor la alunecari de teren.
Studiu de caz: orasul Breaza. Lucrari si rapoarte de cercetare,
D.T.D.G. 2:15–27
Remondo J, Gonzalez A, de Teran RJ, Cendrero A, Fabri A, Chung
ChF (2003) Validation of landslide susceptibility maps; exam-
ples and applications from a case study in northern Spain. Nat
Hazards 30:437–449
Roberds W (2005) Estimating temporal and spatial variability and
vulnerability. In: Glade T, Anderson MG, Crozier MJ (eds)
Landslide hazard and risk. Wiley, New York, pp 129–157
Schuster RL (1995) Socioeconomic significance of landslides. In:
Turner AK, Schuster RL (eds) Landslides, investigation and
mitigation, transportation research board special report 247.
National Academy Press, WA
Schuster RL, Fleming RW (1986) Economic losses and fatalities due
to landslides, Bulletin American Association Engineering Geol-
ogists 23(1)
Soeters R, van Westen CJ (1996) Slope instability recognition,
analysis, and zonation. In: Turner KA, Schuster RL (eds)
Landslides: investigation and mitigation. Transport Research
Board Special Report 247, pp 129–177
Spataru M, Trasnea C (1993) Cercetari geologice ın regiunea Breaza-
Bezdead. Raport geologic final, Arh. S.C. ‘‘Prospectiuni’’ S.A.,
Bucuresti
Suzen ML, Doyuran V (2004) Data driven bivariate landslide
susceptibility assessment using geographical information sys-
tems: a method and application to Asarsuyu catchment, Turkey.
Eng Geol 71:303–321
Thaiyuenwong S, Maireang W (2010) Triggered-rainfall landslide
hazard prediction. Res Dev J 21(2):43–50
U.S. Geological Survey (1997) U.S. geological survey landslide
hazards Program five-year plan 1998–2002. U.S. Government
Printing Office, Washington
van Westen CJ (1997) Statistical landslide hazard analysis, ILWIS 2.1
for windows application guide. ITC Publication, Enschede,
pp 73–84
van Westen CJ (2004) Geo-Information tools for landslide risk
assessment: an overview of recent developments. In: Lacerda
WA, Ehrlich M, Fountoura SAB, Sayao ASF (eds) Landslides
evaluation and stabilization. Balkema, Rotterdam, pp 39–56
van Westen CJ, Rengers N, Terlien MTJ (1997) Prediction of the
occurrence of slope instability phenomena through GIS-based
hazard zonation. Geol Rundsch 86:4004–4414
van Westen CJ, Seijmonsbergen AC, Mantovani F (1999) Comparing
landslide hazard maps. Nat Hazards 20:2–3
van Westen CJ, Van Asch TWJ, Soeters R (2006) Landslide hazard
and risk zonation: why is it still so difficult. Bull Eng Geol
Environ 65(2):167–184
Vandine DF, Moore G, Wise M, Vanbuskirk C, Gerath R (2004)
Technical terms and methods. In: Wise M, Moore G, Vandine D
(eds) Landslide risk case studies in forest development planning
and operations. B. C., Ministry of Forests, Forest Science
Program, abstract of land management handbook 56:13–26
Varnes DJ (1984) Landslide hazard zonation: a review of principles
and practice of the United Nations Educational, Scientific and
Cultural Organization. Natural Hazards, vol 3. UNESCO Press,
Paris
Yaclin A (2008) GIS-based landslide susceptibility mapping using
analytical hierarchy process and bivariate statistics in Ardesen
(Turkey): comparisons of results and confirmations. Catena
72:1–12
Yin KL, Yan TZ (1988) Statistical prediction model for slope
instability of metamorphosed rocks. In: Proceedings of fifth
International Symposium on Landslides, Lausanne, Switzerland
2:1269–1272
4646 Environ Earth Sci (2014) 71:4637–4646
123