DIAGNOSIS OF WEST NILE DIAGNOSIS OF WEST NILE VIRUS INFECTION IN VIRUS INFECTION IN ANIMALS ANIMALS Jon S. Patterson, DVM, PhD, DACVP Roger K. Maes, DVM, PhD Diagnostic Center for Population and Animal Health Michigan State University
Transcript
DIAGNOSIS OF WEST NILE DIAGNOSIS OF WEST NILE VIRUS INFECTION IN VIRUS INFECTION IN
ANIMALSANIMALSJon S. Patterson, DVM, PhD, DACVP
Roger K. Maes, DVM, PhD
Diagnostic Center for Population and Animal Health
Michigan State University
WNV Surveillance in Dead WNV Surveillance in Dead CorvidsCorvids
blue jay
American crow
Common raven
Reporting Dead CorvidsReporting Dead Corvids
complete the form at www.michigan.gov/westnilevirus/
if we want to test the bird for WNV, you will be instructed to contact your local health department
submission kits are available at the LHD and other agencies
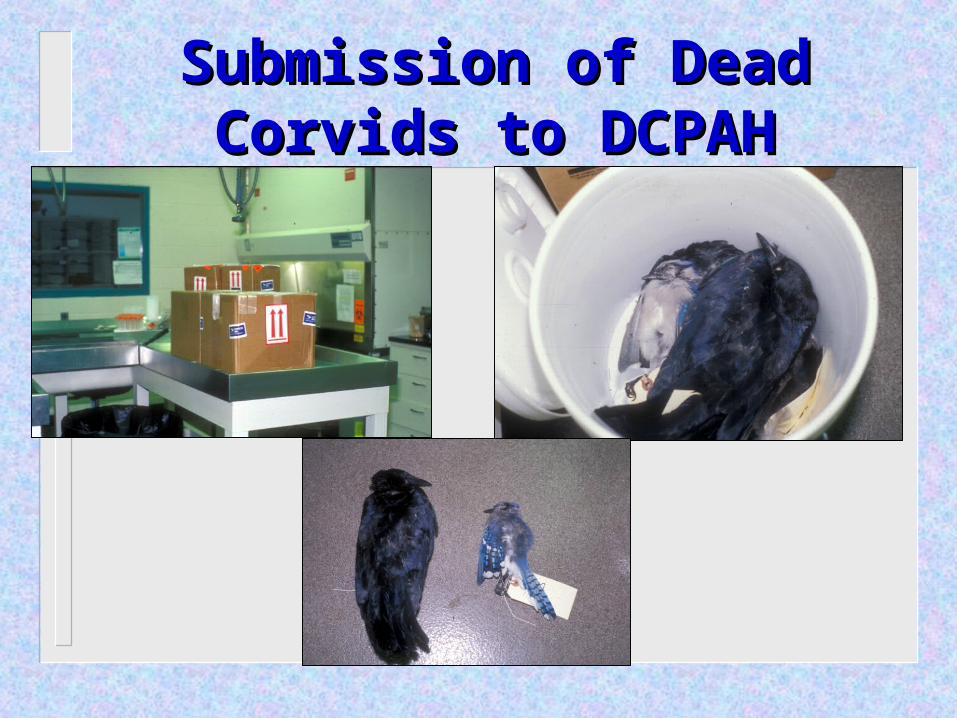
Submission of Dead Corvids to Submission of Dead Corvids to DCPAHDCPAH
Submission of Dead Corvids to Submission of Dead Corvids to DCPAHDCPAH
birds that appear recently dead, with little evidence of decay (i.e., maggots, noxious odor)
handle birds with disposable rubber/latex gloves
submission kits provided by MDCH to LHDs and other participating agencies
Testing of Dead Corvids at Testing of Dead Corvids at DCPAHDCPAH
collection of heart and kidney tissues immunohistochemistry (IHC) for
WNV antigen PCR confirmation of IHC-positive
birds testing birds from a given ZIP CODE
until one positive bird is confirmed
Positive IHC Reactions in Positive IHC Reactions in CorvidsCorvids
heart kidney
Confirmation of IHC-positive Confirmation of IHC-positive Corvids by RT-PCRCorvids by RT-PCR
Dead Corvid Data CollectionDead Corvid Data Collection
timely updating of data at website mapping positive birds by zip code determining dead corvid density (per
square mile) determining changes in dead corvid
density over time (weekly)
Mapping of Positive Birds - 2001Mapping of Positive Birds - 2001
Significance of Dead Corvid DataSignificance of Dead Corvid Data
forecast of human WNV risk New York study (2000):
no human cases in counties with low weekly dead crow densities (< 0.1 per square mile)
occasional human cases within a few weeks after counties reported moderate dead crow densities (0.1-1.5 per square mile)
outbreak of human cases 2 weeks later in the only county with high dead crow density (>1.5 per square mile)
Significance of Dead Corvid DataSignificance of Dead Corvid Data
CDC study (2001 and 2002) calculated relative risk (RR) of human
cases in relation to when the first positive bird case was reported
The end of week 31 (August 5 or 4) was the pivotal date
in 2001, RR = 6.43 in 2002, RR = 2.37
Early Avian Deaths Predict Human Early Avian Deaths Predict Human Illness: North Central U.S., 2002Illness: North Central U.S., 2002
RR = 1.77
Human cases
Avian cases before Wk 32 (8/4)
Avian cases Wk 32 or later
USGS
WNV Diagnosis in Live HorsesWNV Diagnosis in Live Horses
submission of serum and/or CSF to DCPAH
completion of
“Equine Arbovirus Encephalitis” submittal form
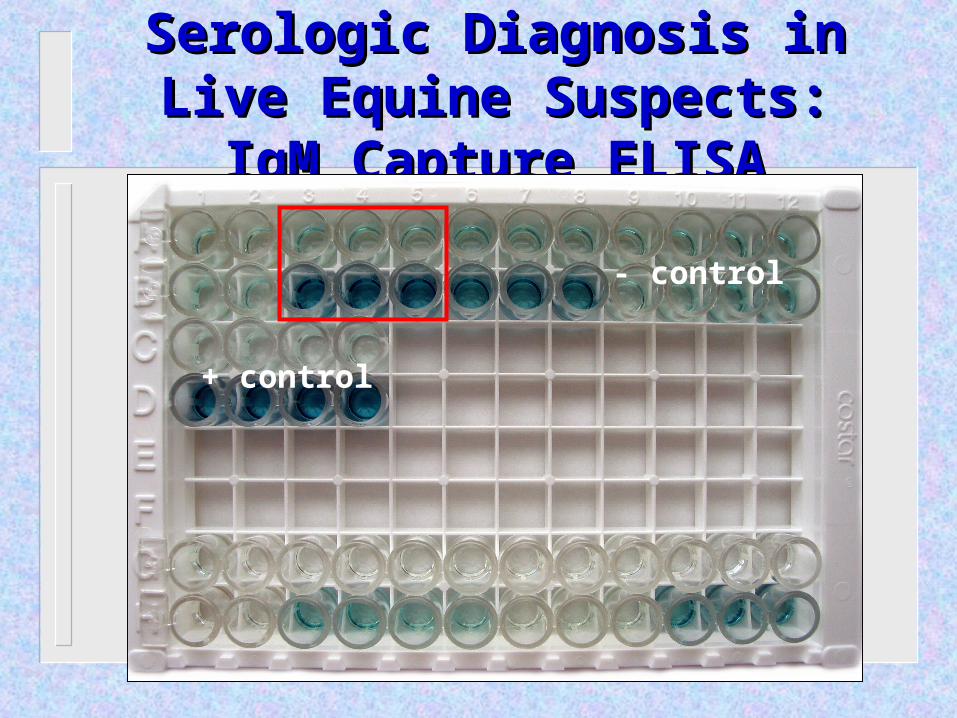
Serologic Diagnosis in Live Equine Serologic Diagnosis in Live Equine Suspects: IgM Capture ELISASuspects: IgM Capture ELISA
- control
+ control
Other Testing of Live Equine Other Testing of Live Equine SuspectsSuspects
IgG ELISA screening test for previous exposure to
WNV previously vaccinated or natural exposure
virus neutralization (VN) test determines viral neutralizing antibody
titer
WNV Diagnosis in Dead HorsesWNV Diagnosis in Dead Horses
submission of heads or whole bodies to DCPAH for necropsy
MDA will arrange for transportation, if necessary
Testing of Dead Horses gross necropsy rabies testing at MDCH CNS histopathology IgM capture ELISA on CSF IHC for EEE, but not for WNV PCR and/or virus isolation
Pathology of WNV Infection in Horses
encephalitis and/or myelitis, meningitis
WNV Diagnosis in Dead Non-corvid Birds
gross necropsy histopathology of all major organs IHC on heart, kidney, brain confirmation by PCR
Histopathologic and IHC Histopathologic and IHC Findings in Non-corvid BirdsFindings in Non-corvid Birds
inflammation and viral antigen in multiple organs
myocarditisencephalitis
IHC, brain
WNV Infection in Other WNV Infection in Other AnimalsAnimals