Page 1
LUND UNIVERSITY
PO Box 117221 00 Lund+46 46-222 00 00
Diagnostic evaluation of planar and tomographic ventilation/perfusion lung images inpatients with suspected pulmonary emboli.
Bajc, Marika; Olsson, Carl-Gustav; Olsson, Berit; Palmer, John; Jonson, Björn
Published in:Clinical Physiology and Functional Imaging
DOI:10.1111/j.1475-097X.2004.00546.x
Published: 2004-01-01
Link to publication
Citation for published version (APA):Bajc, M., Olsson, C-G., Olsson, B., Palmer, J., & Jonson, B. (2004). Diagnostic evaluation of planar andtomographic ventilation/perfusion lung images in patients with suspected pulmonary emboli. Clinical Physiologyand Functional Imaging, 24(5), 249-256. DOI: 10.1111/j.1475-097X.2004.00546.x
General rightsCopyright and moral rights for the publications made accessible in the public portal are retained by the authorsand/or other copyright owners and it is a condition of accessing publications that users recognise and abide by thelegal requirements associated with these rights.
• Users may download and print one copy of any publication from the public portal for the purpose of privatestudy or research. • You may not further distribute the material or use it for any profit-making activity or commercial gain • You may freely distribute the URL identifying the publication in the public portal
Page 2
Take down policyIf you believe that this document breaches copyright please contact us providing details, and we will removeaccess to the work immediately and investigate your claim.
Download date: 26. Aug. 2018
Page 3
Diagnostic evaluation of planar and tomographic ventilation/perfusion lung images in patients with suspected pulmonaryemboliMarika Bajc1, Carl-Gustav Olsson2, Berit Olsson1, John Palmer3 and Bjorn Jonson1
1Center for Medical Imaging and Clinical Physiology, 2Department of Internal Medicine, and 3Department of Radiation Physics, University Hospital Lund, Lund,
Sweden
CorrespondenceMarika Bajc, Center for Medical Imaging and
Clinical Physiology, University Hospital Lund,
221 85 Lund, Sweden
E-mail: [email protected]
Accepted for publicationReceived 20 February 2004;
accepted 8 April 2004
Key wordspulmonary embolism; quantification; RoPer; RoVent;
ventilation/perfusion SPET
Summary
Planar lung ventilation/perfusion scintigraphy (V/PPLANAR) is a standard method fordiagnosis of pulmonary embolism (PE). The goals of this study were to test whetherthe diagnostic information of ventilation/perfusion tomography (V/PSPET) appliedin clinical routine might enhance information compared with V/PPLANAR and tostreamline data processing for the demands of clinical routine. This prospectivestudy includes 53 patients suspected for PE referred for lung scintigraphy. Afterinhalation of 99mTc-DTPA planar ventilation imaging was followed by tomography,using a dual-head gamma camera. 99mTc-MAA was injected i.v. for perfusiontomography followed by planar imaging. Patients were examined in supine position,unchanged during V/P tomography. Two reviewers evaluated V/PPLANAR andV/PSPET images separately and randomly. Mismatch points were calculated on thebasis of extension of perfusion defects with preserved ventilation. Patients werefollowed up clinically for at least 6 months. With V/PSPET the number of patientswith PE was higher and 53% more mismatch points were found. In V/PSPETinterobserver variation was less compared with V/PPLANAR. Ancillary findings wereobserved by both techniques in half of the patients but more precisely interpretedwith V/PSPET. V/PSPET shows more and better delineated mismatch defects, improvedquantification and less interobserver variation compared with V/PPLANAR. V/PSPET isamenable to implementation for clinical routine and suitable even when there isdemand for a high patient throughput.
Introduction
Planar lung scintigraphy is a frequently used method for the
diagnosis of pulmonary embolism (PE) (Burkill et al., 1999) due
to its non-invasive character, ease of application, low cost, low
radiation burden and high sensitivity (Maki et al., 1999). The
value of scintigraphy is questioned, primarily because of a high
incidence of non-diagnostic findings reported in studies based
on PIOPED and modified PIOPED interpretative strategies
(Gottschalk et al., 1993). However, recent studies show much
more favourable results because of improved techniques for
planar lung ventilation/perfusion scintigraphy (V/PPLANAR)
(Howarth et al., 1999; Barghouth et al., 2000; Tagil et al.,
2000) and alternative interpretation strategies (Bajc et al.,
2002a). Accordingly, a technique allowing V/PPLANAR within
1 h after referral showed a higher sensitivity and similar low
rates of non-diagnostic findings as compared with spiral
computer tomography (CT) (Bajc et al., 2002a). Studies by
Palla et al. (1988); Eustace et al. (1993); Corbus et al. (1997);
Magnussen et al. (1999); Wenger et al. (2000); Lemb &
Pohlabeln (2001); showed that ventilation/perfusion tomogra-
phy (V/PSPET) further improves specificity by reducing the
proportion of uncertain results. Palmer et al. (2001) recently
showed that V/PSPET is clinically feasible with short examination
time, low cost and low radiation dose. Their preliminary data
indicate that tomography is superior to V/PPLANAR. The method
was validated on pigs using lung emboli labelled with 201Tl as a
golden standard (Bajc et al., 2002b), thus circumventing
imperfections of other modalities, such as angiography. The
latter study showed that V/PSPET was significantly more sensitive
than V/PPLANAR with respect to detection of small emboli.
The objective of PE diagnostics is not only to confirm or deny
the presence of PE, but also to provide quantitative data on
degree of PE so as to meet the demands by rapidly evolving
therapeutic modalities. Massive embolization should be treated
with thrombolysis, while modest embolization requires inpa-
tient treatment. At a low degree of PE, outpatient treatment may
be offered. It appears even possible that we in the future may
Clin Physiol Funct Imaging (2004) 24, pp249–256
� 2004 Blackwell Publishing Ltd • Clinical Physiology and Functional Imaging 24, 5, 249–256 249
Page 4
abstain from treatment of single sub-segmental emboli. Accord-
ingly, diagnostic methods should allow quantitation. Also
evaluation and development of new therapeutic strategies
require recognition of all embolized areas at the time of
diagnosis and at follow up.
The aim of the present study was to compare V/PPLANAR and
V/PSPET with respect to the diagnosis of PE, quantification of
emboli and ancillary findings, against the clinical diagnosis at
discharge from hospital. Before applying V/PSPET in routine, we
wanted to validate its usefulness. Based on initial clinical
experience of the V/PSPET technique, we wanted to improve the
normalization of images, their mode of presentation, and to
automate data processing.
Patients and methods
This prospective study embraces 51 patients with symptoms
suggestive for PE and additional two patients on treatment for
PE. All were examined with V/PPLANAR and V/PSPET. Referred
patients were included whenever the dual head gamma camera
was available. Accordingly, patient selection was not specific for
the purpose of the study. The study included 19 inpatients (one
with trauma, four from surgical and 14 from medical
specialties) and 34 outpatients. The patients gave informed
consent to be examined both by V/PPLANAR and V/PSPET.
Approval was obtained from the ethical committee.
When patients left hospital, the responsible clinicians estab-
lished the final diagnosis, based on symptoms, blood specimens,
chest X-ray (and some with spiral CT), V/P scintigraphy,
changes due to therapy, according to a local consensus program
on venous thromboembolism. Patients with PE were followed
during 6-month periods by one of us, up to 24 months. They
were controlled at an outpatient clinic with physical examina-
tion, blood specimens and scintigraphy, if considered necessary.
Patients without PE were not given anticoagulant therapy and
were followed for at least 6 months, by their medical records.
According to the protocol, a new V/P scintigraphy should be
performed in case of recurrent symptoms, which did not occur.
For the ventilation study patients inhaled aerosolized 99mTc-
DTPA (TechneScan DTPA; Mallinckrodt Medical, Petten, The
Netherlands) in supine position, by spontaneous breathing from
a pressurized air driven nebulizer. Inhalation stopped when
30 MBq had been deposited, as measured by a shielded Geiger–
Muller tube (Mini-Instruments Ltd, Burnkam-on-Crouch, Essex,
UK). Planar images in anterior, posterior and posterior oblique
projections were taken in the supine position and followed by
ventilation tomography. Immediately thereafter and without
patient movement, 100 MBq99mTc -MAA (TechneScan
LyoMAA; Mallinckrodt Medical) was given by i.v. injection for
perfusion study. Then, tomography was followed by planar
imaging. A large field-of-view dual-head gamma camera with
low energy all-purpose collimators was used (SMV DST-XLi, Buc
Cedex, France). For SPET a 64 · 64 matrix was used with 128
projections over 360�. Sixty-four steps of 10 and 5 s were used
for the ventilation and the perfusion studies, respectively.
99mTc-DTPA clearance was calculated from the initial and final
SPET projections, and was used for correction of the ventilation
projection set prior to reconstruction. Iterative reconstruction
was performed using OSEM with eight subsets and two
iterations. The ventilation background was subtracted from the
perfusion tomograms, and a normalized V/P image set
calculated. As manual processing would be prohibitive in
clinical routine the procedure, from raw data to a complete set
of images for final review was made fully automatic. Tagil et al.
(2000) and Palmer et al. (2001) described details of the planar
and tomographic techniques. In short, the main consideration in
the creation of quotient images is to define a suitable scaling
factor between the reconstructed and appropriately smoothened
ventilation and perfusion data sets. The scaling was designed
with the aim to produce quotient images that would be
displayed in a fixed grey-scale value in lung regions deemed to
be normal from a simple automatic criterion. In the original
work (Palmer et al., 2001) the normal region was selected by
threshholding from the maximum count after automatic hot-
spot removal in the reconstructed volumes. In the present work,
a more robust normalization threshholding was applied. Thus,
the reconstructed volume was first truncated at a lower
threshold of 10% of its maximum value. An upper threshold
was then obtained by iteration to the count level at which 90%
of the lung volume was included. The voxels within the count
range 50–100% of the upper threshold defined a preliminary
‘normal’ subvolume. This process was applied to ventilation and
perfusion independently. The volume in which both ventilation
and perfusion were ‘normal’ comprised the final normalization
volume. When, in exceptional cases, no such common volume
was recognized, each region was used separately. The average
voxel count in the normalization volume was scaled to be equal
for ventilation and perfusion. The final display was set to always
span a quotient range of 0–4000, with equality being
represented by 1000.
Ventilation, perfusion and V/P quotient tomograms were
simultaneously presented in 13Æ6 mm thick coronal, sagittal and
transverse slices, and as rotating volume rendered ‘Maximum
Intensity Projection’ images. The computer display allowed
adjustment of thresholds and colours.
For clinical purpose physicians on duty read the planar
images. These reports were used by clinicians for treatment-
decisions and also, in the study, for comparison with results of
the two expert reviewers. For the purpose of the study these two
reviewers interpreted SPET images. No results from SPET were
given to clinicians.
The clinical readers and the reviewers had access to clinical
data. Planar and tomographic images were related for interpret-
ation to anatomical charts of lung segments. The two reviewers
read separately all planar and tomographic images. The two
modalities were interpreted with at least 3 weeks interval. In
each session the identification of patients was hidden and the
order was randomized.
The time needed for V/P examination is about 30 min inclu-
ding acquisition time of 16 min. Reconstruction, automatic
Evaluation of V/PPLANAR and V/PSPET, M. Bajc et al.
� 2004 Blackwell Publishing Ltd • Clinical Physiology and Functional Imaging 24, 5, 249–256
250
Page 5
processing including all slices and 3D rendered cine images take
9 min. Interpretation and reporting takes 5–10 min.
Interpretation criteria
Ventilation and perfusion defects were quantified with respect to
segmental/subsegmental character of defects, ‘RoVent’ points
(reduction of ventilation) and ‘RoPer’ points (reduction of
perfusion) (Palmer et al., 2001; Olsson et al., 2002). A segmental
reduction or a subsegmental total deficiency was attributed 1
point; a segmental total deficiency was attributed 2 points. For
each lung, we calculated the number of points reflecting a P
defect with preserved V, to a total mismatch score.
Within a holistic principle of image reading the following
guidelines were applied.
• No embolism, PE): absence of unmatched perfusion defects.
• Embolism, PE+: >1 segmental or subsegmental defect of
mismatch, i.e. at least 2 points.
• Other pathology than PE: matched defects with typical
patterns for other lung diseases.
• Non-diagnostic, ND: Grave V/P defects rendering the judge-
ment of mismatch impossible.
We adhere to a holistic principle of clinical image reading, in
line with concepts recently described by Freeman et al. (2001).
Accordingly, ancillary scintigraphic findings and clinical data
were considered in the interpretation. The readers considered
the number of mismatched areas, their distinctness, peripheral
or central position, as well as segmental or non-segmental
location. Signs of obstructive or parenchymal lung disease,
tumour and heart failure were included in clinical and reviewed
reports. Increased clearance of DTPA from the lungs was
considered to indicate alveolar inflammation.
Statistics: linear regression was used for comparison between
readers. Wilcoxon Signed Rank Test was used for comparisons
between V/PSPET and V/PPLANAR, using Sigma Stat, Statistical
Software, version 2, SPSS Inc.
Results
According to the final clinical diagnosis, 11 patients were treated
for recent PE. Another two patients were on continuous
treatment since a previous episode of PE (Table 1). In the 11
cases of recent PE the diagnosis reflected a positive reading of
the routine V/PPLANAR. The reviewers judged the V/PPLANARpositive for PE in the same 11 and 10 cases, respectively. In the
11th case, one reviewer expressed strong suspicion for PE and
recommended CT to confirm the suspicion. In two patients with
‘old PE’ the routine and the reviewers’ report on V/PPLANARwere negative. On V/PSPET both reviewers reported PE in all 11
new cases with a clinical diagnosis of PE and in two patients
already on therapy for PE (Fig. 1). In the remaining 40 patients
all routine and review reports of V/PPLANAR were negative. In
three of these 40 patients V/PSPET showed PE according to one
reviewer. The other reviewer reported two of these, while the
third was considered ND (Table 1).
The inter-observer agreement between reviewer A and B,
with respect to the number of mismatch points recognized for
each patient, MMPA and MMPB, respectively was illustrated with
regression analysis:
For V/PPLANAR:
MMPB ¼ 0 � 79ð�0 � 04Þ; MMPA � 0 � 2ðR2 ¼ 0 � 88Þ
For V/PSPET:
MMPB ¼ 0 � 96ð�0 � 03Þ; MMPA � 0 � 2ðR2 ¼ 0 � 95Þ
Numbers in brackets indicate standard error. The intercept 0Æ2was not significantly different from zero.
On average mismatch points in V/PSPET were for both
reviewers 53% higher than in V/PPLANAR. This difference
between the methods was significant (reviewer A, P ¼ 0Æ003and B, P ¼ 0Æ001).No patient developed signs or symptoms of new PE during
the follow up period of 6 months.
Ancillary findings
The reviewers together reanalysed V/PPLANAR and V/PSPETimages with respect to ancillary findings indicating other
diseases than PE.
Ancillary findings were concordant between V/PPLANAR and
V/PSPET in 25 patients.
V/P changes were of obstructive type, i.e. central deposition
of aerosols and matched ventilation perfusion changes in 12
(Fig. 2). Lobar V/P defects were observed in 4, and minor
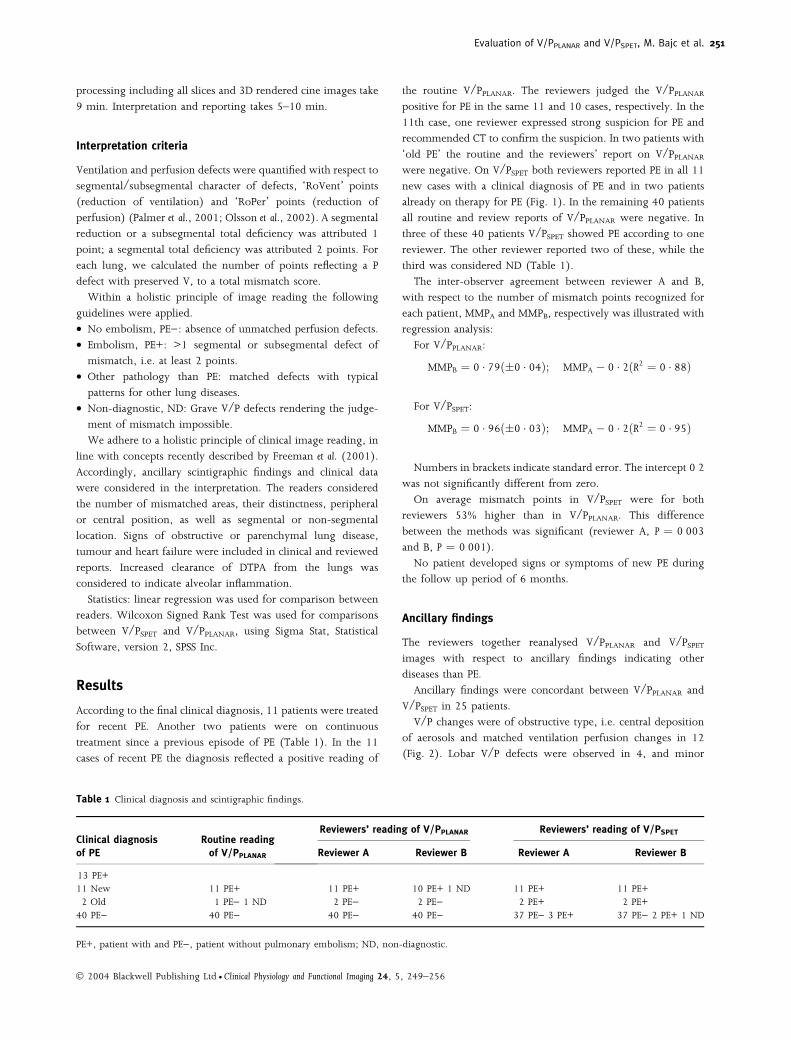
Table 1 Clinical diagnosis and scintigraphic findings.
Clinical diagnosis
of PE
Routine reading
of V/PPLANAR
Reviewers’ reading of V/PPLANAR Reviewers’ reading of V/PSPET
Reviewer A Reviewer B Reviewer A Reviewer B
13 PE+11 New 11 PE+ 11 PE+ 10 PE+ 1 ND 11 PE+ 11 PE+2 Old 1 PE) 1 ND 2 PE) 2 PE) 2 PE+ 2 PE+40 PE) 40 PE) 40 PE) 40 PE) 37 PE) 3 PE+ 37 PE) 2 PE+ 1 ND
PE+, patient with and PE), patient without pulmonary embolism; ND, non-diagnostic.
Evaluation of V/PPLANAR and V/PSPET, M. Bajc et al.
� 2004 Blackwell Publishing Ltd • Clinical Physiology and Functional Imaging 24, 5, 249–256
251
Page 6
Ventilation
Perfusion
Ventilation
Perfusion
Post
V/P quotient
Anterior Posterior RPO LPO
Sagittal, right lung
Ant
B
A
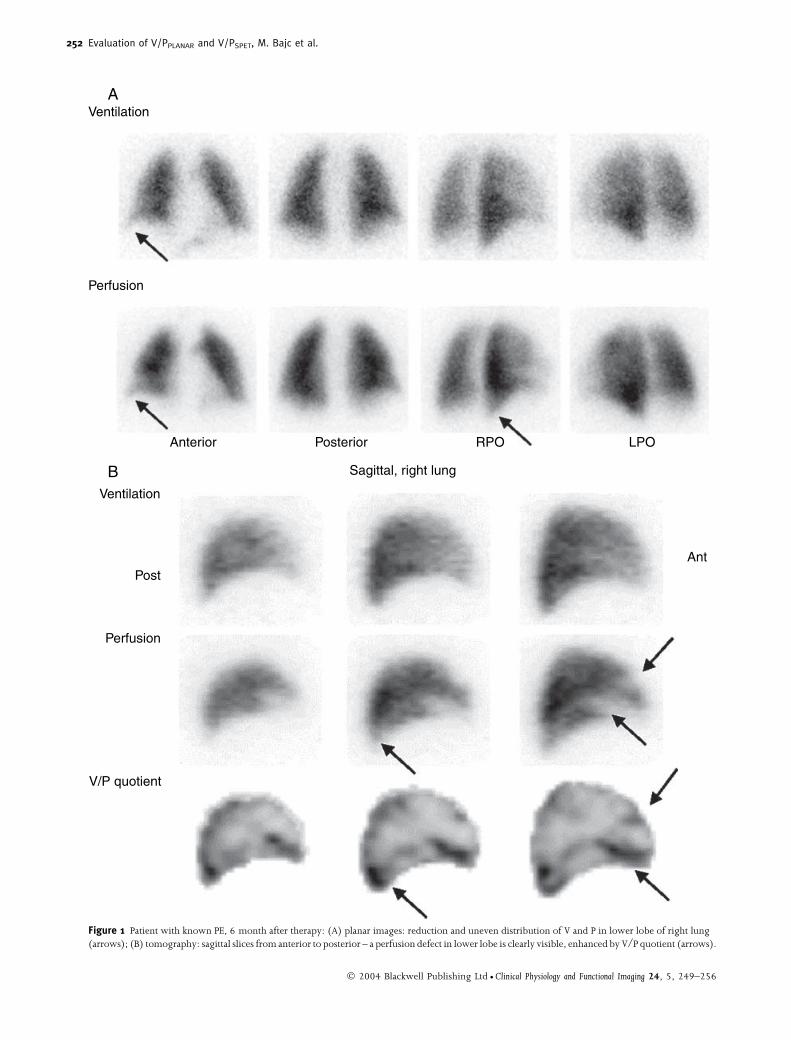
Figure 1 Patient with known PE, 6 month after therapy: (A) planar images: reduction and uneven distribution of V and P in lower lobe of right lung(arrows); (B) tomography: sagittal slices from anterior to posterior – a perfusion defect in lower lobe is clearly visible, enhanced by V/P quotient (arrows).
Evaluation of V/PPLANAR and V/PSPET, M. Bajc et al.
� 2004 Blackwell Publishing Ltd • Clinical Physiology and Functional Imaging 24, 5, 249–256
252
Page 7
Ventilation
a
a
a
a
a
b
b
Perfusion
Anterior Posterior
A
Ventilation
Perfusion
V/P quotient
FrontalB
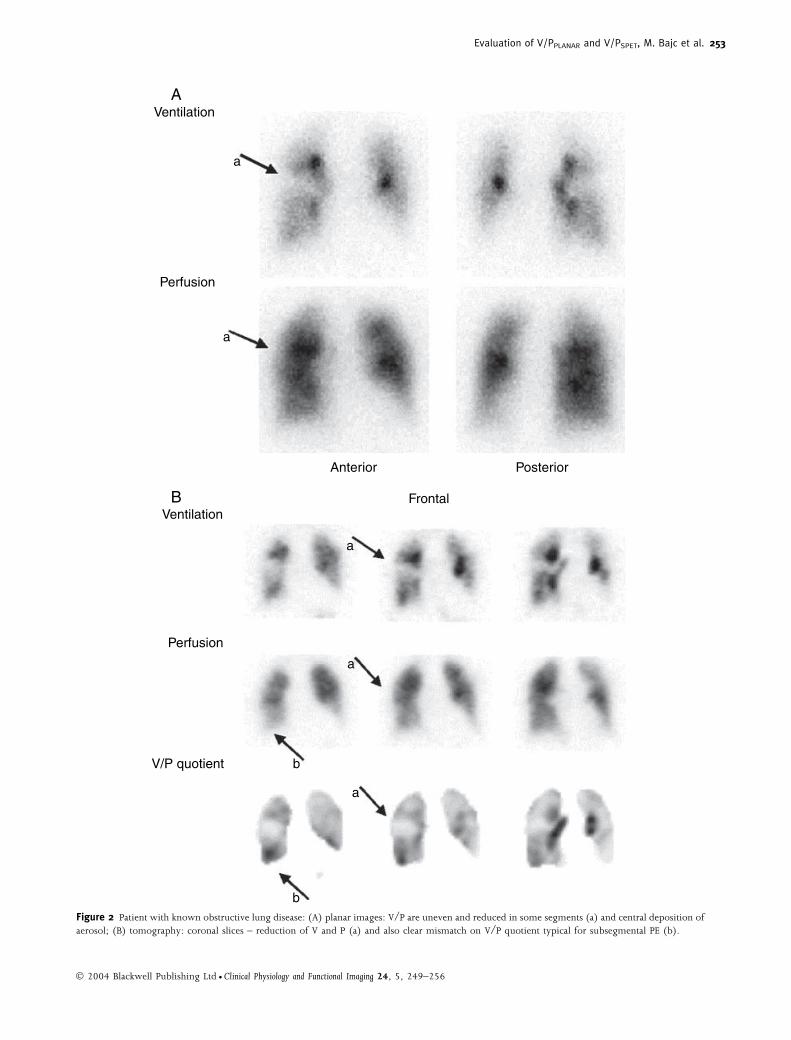
Figure 2 Patient with known obstructive lung disease: (A) planar images: V/P are uneven and reduced in some segments (a) and central deposition ofaerosol; (B) tomography: coronal slices – reduction of V and P (a) and also clear mismatch on V/P quotient typical for subsegmental PE (b).
Evaluation of V/PPLANAR and V/PSPET, M. Bajc et al.
� 2004 Blackwell Publishing Ltd • Clinical Physiology and Functional Imaging 24, 5, 249–256
253
Page 8
defects of the same type in 5 (Fig. 3). Two others had pattern of
heart failure, i.e. diminished ventilation and perfusion in dorsal
and basal part of the lung. Alveolitis was diagnosed by high
clearance of DTPA in two patients.
Ancillary findings were discordant in four patients. In one
patient obstruction was only recognized on V/PSPET. Two
patients with enlarged hearts and one patient with uptake in
oesophagus clearly observed on V/PSPET showed false V/P
changes on V/PPLANAR.
Discussion
In this study, we compare planar and tomographic imaging in a
clinical material. In a previous experimental study we showed
that both sensitivity and specificity was enhanced by tomogra-
phy (Bajc et al., 2002b). In that study artificial emboli were
marked with 201Tl providing a ‘true gold standard’. A limitation
of clinical studies is that no similar standard is available.
Traditionally, pulmonary angiography has been regarded as the
gold standard for diagnostics of PE. However, according to a
recent article on state of the art ‘the status of pulmonary
angiography as the standard of reference for diagnosis of PE is in
doubt’ (Schoepf & Costello, 2004). A similar opinion has since
several years been advocated by the British Thoracic Society,
Standards of Care Committee, 1997. These considerations were
based upon several studies showing limited sensitivity and high
inter-observer and intra-observer variability. Ethical concerns
would also be raised against an invasive technique with some
radiation hazards used for purely scientific reasons. In the
absence of a standard reference for the diagnosis PE the outcome
for patients should be regarded as appropriate endpoint
(Fennerty, 1998).
The study reflects a transitory phase in our department during
improvement and implementation of the tomographic method,
previously described (Palmer et al., 2001). A minimum of
technician intervention is now needed for reconstruction and
V/P quotient calculations. The interpreter is helped by a new
presentation form suitable for quality control and reviewing.
Three sets of tomographic data (V, P and V/P quotient), viewed
in coronal, sagittal and transverse plane as well as in
simultaneous 3D volume images are directly available for
interpretation.
Examination in supine position offered a stable and comfort-
able procedure even for critically ill patients. Moreover, it was
convenient for the staff. Immobilization needed during the short
acquisition time was well tolerated by all patients. There were
only four patients that moved during examinations thus causing
artefacts on V/P quotient images, which are easy to recognize.
The administered activity used here, 30 MBq for ventilation
and 100 MBq for perfusion, were found to be adequate in most
cases. Exceptionally we use up to 50 MBq for ventilation and up
to 150 MBq for perfusion. The Procedure Guideline by the
Society of Nuclear Medicine suggests, implicitly for planar
technique, 20–40 MBq for ventilation, and a total count rate at
perfusion of at least four times that at ventilation (ACCP, 1998).
Interpretation of lung scintigraphy according to initial and
revised PIOPED criteria has caused confusion in nuclear and
clinical medicine (Gray, 2002). The criteria for PE are based on
the judgement of size of perfusion defects and ventilation, if
studied, has not been standardized and often been performed
with 133Xe which we find inadequate. This has caused a high
proportion of intermediate, non-diagnostic reports (Gottschalk
et al., 1993). Difficulties are also caused by the reports expressed
as probabilities and to use these in a clinical context.
Recognition of patterns typical for PE represents a step forward
as evidenced by the PISA-PED studies, even if ventilation was not
studied (Miniati et al., 1996). Giordano & Angiolillo (2001),
stressed that ventilation, if used should be performed using
aerosols or Technegas. Finally, a holistic approach should be
adopted for interpretation of scintigraphic images by using
clinical information, segmental charts, and recognition of
patterns typical for PE and for other diseases (Freeman et al.,
2001; Palmer et al., 2001; Bajc et al., 2002a). Such a strategy has
dramatically reduced the number of non-diagnostic reports and
in general increased the diagnostic value of V/P scintigraphy
(Bajc et al., 2002a). V/PSPET used in recent studies showed
particularly low numbers of non-diagnostic findings and high
sensitivity and specificity for PE (Corbus et al., 1997; Lemb &
Pohlabeln, 2001). In this respect our results are similar to these
observations.
In the present study the comparison between V/PPLANAR and
V/PSPET was based on the same holistic interpretation principles.
The methods differed with respect to imaging technique.
V/PPLANAR showed diagnostic results superior to studies based
on probabilistic criteria as by PIOPED. V/PSPET further enhanced
diagnostic accuracy both by visualizing remnants of PE in two
patients under treatment and also by revealing findings typical
for PE in another three patients, who were not treated (clinicians
were not informed on the results of V/PSPET). However, these
results should be cautiously considered as the material is small
and a real gold standard is not available.
V/P defects were quantified to describe the extent of PE in
terms of new parameters RoVent and RoPer. Using this strategy
V/PSPET showed 53% more mismatch points than V/PPLANAR.
Furthermore, V/PSPET with 3D visualization eliminates the
influence of superimposed structures, thus clarifying segmental
and subsegmental character of PE defects. Also the stripe sign
indicating defects of other nature than PE is more obvious
(Fig. 3). These qualities of V/PSPET are particularly valuable
when PE is combined with other diseases and explain the higher
sensitivity observed by others and by us. An increased number
of planar projections would probably marginally increased the
sensitivity of planar technique at the cost of longer time for the
whole procedure. Anyway with our planar technique the
sensitivity is higher than that of CT (Bajc et al., 2002a). Another
advantage of our V/PSPET is the V/P quotient that facilitates both
recognition and quantification of PE (Figs 1–3). Quantification
is becoming important for choice of therapy, i.e. thrombolysis
or conventional anticoagulants, and more importantly for
identifying patients suitable for outpatient treatment (Kovacs
Evaluation of V/PPLANAR and V/PSPET, M. Bajc et al.
� 2004 Blackwell Publishing Ltd • Clinical Physiology and Functional Imaging 24, 5, 249–256
254
Page 9
et al., 2000; Olsson et al., 2002; Beer et al., 2003). The
significantly lower interobserver variation and higher sensitivity
observed by V/PSPET compared with V/PPLANAR is due to its
more clear patterns representing PE or other diseases. These
qualities of V/PSPET are important for a proper diagnosis, for the
choice of therapy and for follow up of patients. A problem
Ventilation
Perfusion
V/P quotient
Right LeftB
Ventilation
Perfusion
Anterior Posterior RPO LPO
A
a
a
a
a
b
b
b
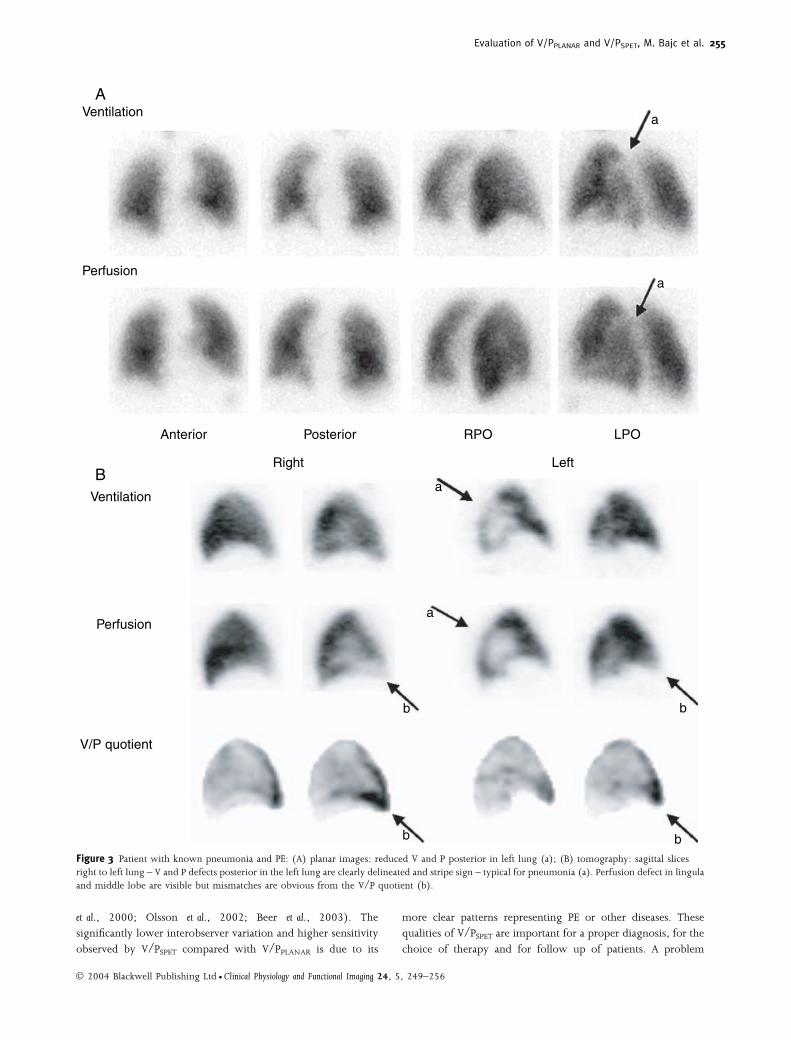
bFigure 3 Patient with known pneumonia and PE: (A) planar images: reduced V and P posterior in left lung (a); (B) tomography: sagittal slicesright to left lung – V and P defects posterior in the left lung are clearly delineated and stripe sign – typical for pneumonia (a). Perfusion defect in lingulaand middle lobe are visible but mismatches are obvious from the V/P quotient (b).
Evaluation of V/PPLANAR and V/PSPET, M. Bajc et al.
� 2004 Blackwell Publishing Ltd • Clinical Physiology and Functional Imaging 24, 5, 249–256
255
Page 10
which cannot be addressed on the bases of this study is the
clinical significance and the indication to treat isolated subseg-
mental emboli.
The holistic attitude including ancillary findings should be
used to recognize various differential diagnoses (Freeman et al.,
2001). Both V/PPLANAR and V/PSPET imaging showed such
findings in about half of the patients. The importance of
ventilation studies is not limited to identification of mismatch
but also allows the identification of patterns typical for
alternative diagnoses such as obstructive disease, parenchymal
diseases and tumours, heart failure and in our study also
alveolitis. Experience from more than 1200 V/PSPET examina-
tions until today, combined with daily clinical feedback has for
us confirmed the superiority of V/PSPET.
Conclusion
V/PSPET performed with recommended, low activity allows
excellent imaging also of V/P quotient. V/PSPET showed higher
sensitivity with respect to demonstration of more emboli
revealing more perfusion defects and had less interobserver
variation than V/PPLANAR. V/PSPET enables better quantification
that has impact on choice of therapy and improves follow up.
Ancillary findings were more clearly delineated and correctly
explained.
Acknowledgments
This work was supported by the Swedish Medical Research
Council (02872) and by the Swedish Heart Lung Foundation.
References
ACCP. Consensus Committee on Pulmonary Embolism Opinions
Regarding the Diagnosis and Management of Venous Thrombo-embolic Disease. Chest (1998); 113: 499–504.
Bajc M, Albrechtsson U, Olsson CG, Olsson B, Jonson B. Comparison ofventilation/perfusion scintigraphy and helical CT for diagnosis of
pulmonary embolism; strategy using clinical data and ancillary find-ings. Clin Physiol Funct Imaging (2002a); 22: 392–397.
Bajc M, Bitzen U, Olsson B, Perez de Sa V, Palmer J, Jonson B. Lungventilation/perfusion SPECT in the artificially embolized pig. J Nucl
Med (2002b); 43: 640–647.Barghouth G, Yersin B, Boubaker A, Doenz F, Schnyder P, Delaloye AB.
Combination of clinical and V/Q scan assessment for the diagnosis ofpulmonary embolism: a 2-year outcome prospective study. Eur J Nucl
Med (2000); 27: 1280–1285Beer JH, Burger M, Gretener S, Bernard-Bagattini S, Bounameaux H.
Outpatient treatment of pulmonary embolism is feasible and safe in asubstantial proportion of patients. J Thromb Haemost (2003); 1: 186–
187.British Thoracic Society, Standards of Care Committee. Suspected acute
pulmonary embolism: a practical approach. Thorax (1997); 52 (Suppl.4): 1–24.
Burkill GJ, Bell JR, Padley SP. Survey on the use of pulmonary
scintigraphy, spiral CT and conventional pulmonary angiography forsuspected pulmonary embolism in the British Isles. Clin Radiol (1999);
54: 807–810.Corbus HF, Seitz JP, Larson RK et al. Diagnostic usefulness of lung SPET in
pulmonary thromboembolism: an outcome study. Nucl Med Commun(1997); 18: 897–906.
Eustace S, Phelan N, Dowsett DJ, Ennis JT. A comparison of SPECT andplanar ventilation perfusion lung scanning. Ir J Med Sci (1993); 162:
82–85.
Fennerty T. Pulmonary embolism. Hospitals should develop their ownstrategies for diagnosis and management. BMJ (1998); 317: 91–92.
Freeman LM, Krnyckyi B, Zuckier LS. Enhanced lung scan diagnosis ofpulmonary embolism with the use of ancillary scintigraphic findings
and clinical correlation. Semin Nucl Med (2001); 2: 143–157.Giordano A, Angiolillo DJ. Current role of lung scintigraphy in pul-
monary embolism. Q J Nucl Med (2001); 45: 294–301.Gottschalk A, Sostman HD, Coleman RE et al. Ventilation-perfusion
scintigraphy in the PIOPED study. Part 2. Evaluation of the scinti-graphic criteria and interpretations. J Nucl Med (1993); 34: 1119–1126.
Gray HW. The natural history of venous thromboembolism: impact onventilation/perfusion scan reporting. Semin Nucl Med (2002); 32: 159–
172.Howarth DM, Lan L, Thomas PA, Allen LW. 99mTc technegas ventila-
tion and perfusion lung scintigraphy for the diagnosis of pulmonaryembolus. J Nucl Med (1999); 40: 579–584.
Kovacs MJ, Anderson D, Morrow B, Gray L, Touchie D, Wells PS.Outpatient treatment of pulmonary embolism with dalteparin. Thromb
Haemost (2000); 83: 209–211.Lemb M, Pohlabeln H. Pulmonary thromboembolism: a retrospective
study on the examination of 991 patients by ventilation/perfusionSPECT using Technegas. Nuclearmedizin (2001); 40: 179–186.
Magnussen JS, Chicco P, Palmer AW et al. Single photon emissiontomography of a computerized model of pulmonary embolism. Eur J
Nucl Med (1999); 26: 1430–1438.Maki DD, Gefter WB, Alavi A. Recent advances in pulmonary imaging.
Chest (1999); 116: 1388–1402.Miniati M, Pistolesi M, Marini C et al. Value of perfusion lung scan in the
diagnosis of pulmonary embolism: results of the Prospective Inves-tigative Study of Acute Pulmonary Embolism Diagnosis (PISA-PED).
Am J Respir Crit Care Med (1996); 154: 1387–1393.Olsson CG, Bitzen U, Bajc M et al. Roper and Rovent Scintigraphic points
in pulmonary embolism as a safe bases in out-patient Tinzaparin
therapy. Reports from the 17th International Congress on Thrombosis. (2002).Monduzzi editore S.p.A, Bologna, 127–129.
Palla A, Tumeh SS, Nagel JS, Meyerovitz MF, Goldhaber SZ, Holman BL.Detection of pulmonary perfusion defects by single photon emission
computed tomography. J Nucl Med Allied Sci (1988); 32: 27–32.Palmer J, Bitzen U, Jonson B, Bajc M. Comprehensive ventilation/per-
fusion SPECT. J Nucl Med (2001); 42: 1288–1294.Schoepf UJ, Costello P. CT angiography for diagnosis of pulmonary
embolism: state of the art. Radiology (2004); 230: 329–337.Tagil K, Evander E, Wollmer P, Palmer J, Jonson B. Efficient lung scin-
tigraphy. Clin Physiol (2000); 20: 95–100.Wenger M, Donnemiller E, Bacher-Stier C et al. Improved pulmonary
diagnosis by pixel based 3D-volume mathematics in combinedinhalation/perfusion lung SPET [abstract]. Eur J Nucl Med (2000); 27:
89.
Evaluation of V/PPLANAR and V/PSPET, M. Bajc et al.
� 2004 Blackwell Publishing Ltd • Clinical Physiology and Functional Imaging 24, 5, 249–256
256