23
Diagnostics in EM; test thresholds and likelihood ratios Published courtesy of the CEM FOAMed Network http://www.cemfoamed.co.uk/portfolio/ diagnostics-in-em/
| Date post: | 23-Dec-2015 |
| Category: |
Documents |
| Upload: | mabel-wilkerson |
| View: | 218 times |
| Download: | 3 times |

Diagnostics in EM; test thresholds and likelihood ratios
Published courtesy of the CEM FOAMed Networkhttp://www.cemfoamed.co.uk/portfolio/diagnostics-in-
em/

Everything we do in a patient assessment is a test
Including questions we ask

Test thresholds

Within the test thresholds;
appropriate testing

Below a test threshold;
more likely to harm than help a patient by testing

Above a test threshold;
more likely to harm than help a patient by testing

Within a test threshold;
appropriate testing

How do we use all of this information??
100 %
0%
Likelihood of diagnosis being correct
Below test threshold
Diagnosis considered
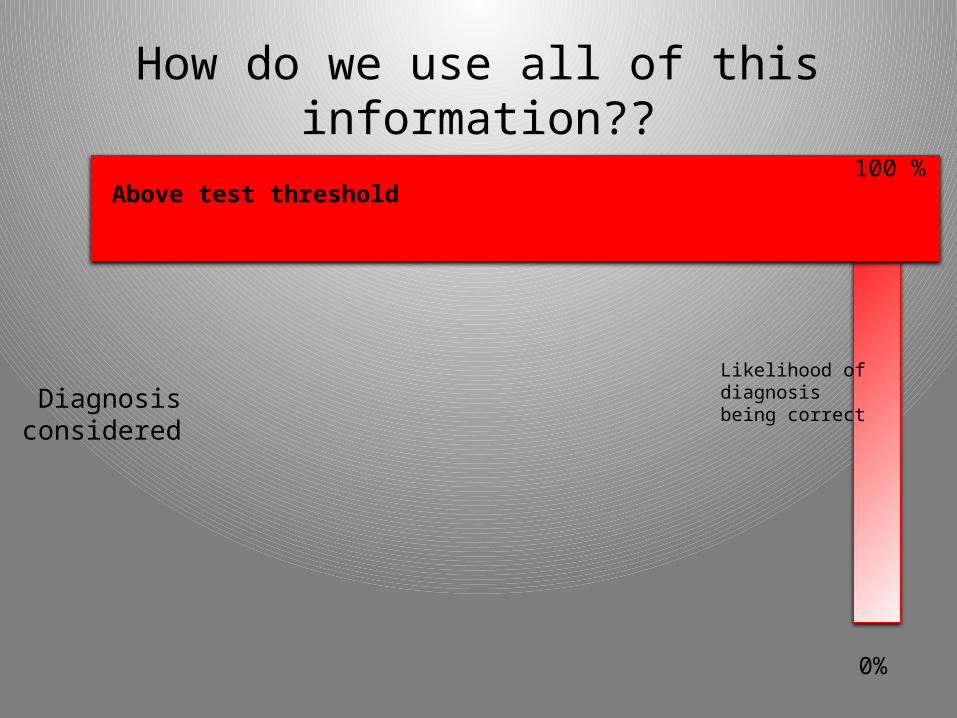
How do we use all of this information??
0%
Likelihood of diagnosis being correct
Above test threshold
Diagnosis considered
100 %

Above test threshold
How do we use all of this information??
Below test threshold
Appropriate testing
Diagnosis considered
0%
Likelihood of diagnosis being correct
100 %

Likelihood ratios
Positive Likelihood ratio;
a high number is powerful
>>1

Negative Likelihood ratio;
a small number is powerful
<< 1

Likelihood ratio Shift in probability
>10 Large (often conclusive)
5-10 Moderate
2-5 Small
1-2 Minimal
1 Nil
1-0.5 Minimal
0.5-0.2 Small
0.2-0.1 Moderate
<0.1 Large (often conclusive)

Fagan’s nomogram

Application of serial tests100 %
0%
Finding 1
Finding 2
Finding 3
Likelihood of diagnosis being correct
Above test threshold
Below test threshold
Diagnosis considered

Correct testing
Correct testCorrect circumstance
Correct patient

Perry et al. Sensitivity of coputed tomography performed within six hours of onset of headache for diagnosis of subarachnoid haemorrhage: prospective cohort study.
BMJ 2011; 343:d4277 doi. 10.1136/bmj.d4277

Han et al., The Role of Cardiac Risk Factor Burden in Diagnosing Acute Coronary Syndromes in the Emergency Department Setting. Ann Emerg Med. 2007; 49

Who not to test100 %
0%
Likelihood of diagnosis being correct
Below test threshold
Diagnosis considered

Who not to test but to treat
0%
Likelihood of diagnosis being correct
Above test threshold
Diagnosis considered
100 %

Who should be tested
Appropriate testing
Diagnosis considered
0%
Likelihood of diagnosis being correct
100 %

Correct testing
Correct testCorrect circumstance
Correct patient


